where we stand where we are going
|
|
|
- Rudolf Carter
- 5 years ago
- Views:
Transcription

1 where we stand where we are going EnerCom s The Oil & Gas Conference August 20, 2018
2 Forward-Looking Statements and Other Disclaimers This presentation includes forward looking statements within the meaning of Section 27A of the Securities Act of 1933, as amended, and Section 21E of the Securities Exchange Act of 1934, as amended. The statements regarding future financial and operating performance and results, strategic pursuits and goals, market prices, future hedging and risk management activities, and other statements that are not historical facts contained in this report are forward-looking statements. The words expect, project, estimate, believe, anticipate, intend, budget, plan, forecast, outlook, target, predict, may, should, could, will and similar expressions are also intended to identify forward-looking statements. Such statements involve risks and uncertainties, including, but not limited to, market factors, market prices (including geographic basis differentials) of natural gas and crude oil, results of future drilling and marketing activity, future production and costs, legislative and regulatory initiatives, electronic, cyber or physical security breaches and other factors detailed herein and in our other Securities and Exchange Commission (SEC) filings. See Risk Factors in Item 1A of the Form 10-K and subsequent public filings for additional information about these risks and uncertainties. Should one or more of these risks or uncertainties materialize, or should underlying assumptions prove incorrect, actual outcomes may vary materially from those indicated. Any forward-looking statement speaks only as of the date on which such statement is made, and Cabot Oil & Gas (the Company or Cabot ) does not undertake any obligation to correct or update any forward-looking statement, whether as the result of new information, future events or otherwise, except as required by applicable law. This presentation may contain certain terms, such as resource potential, risked or unrisked resources, potential locations, risked or unrisked locations, EUR (estimated ultimate recovery) and other similar terms that describe estimates of potentially recoverable hydrocarbons that the SEC rules prohibit from being included in filings with the SEC. These estimates are by their nature more speculative than estimates of proved, probable and possible reserves and may not constitute reserves within the meaning of SEC rules and accordingly, are subject to substantially greater risk of being actually realized. These estimates are based on the Company s existing models and internal estimates. Actual locations drilled and quantities that may be ultimately recovered from the Company s interests could differ substantially. Factors affecting ultimate recovery include the scope of the Company s ongoing drilling program, which will be directly affected by the availability of capital, drilling and production costs, availably of drilling services and equipment, drilling results, lease expirations, transportation constraints, regulatory approvals, actual drilling results, including geological and mechanical factors affecting recovery rates, and other factors. These estimates may change significantly as development of the Company s assets provide additional data. Investors are urged to consider carefully the disclosures and risk factors about Cabot s reserves in the Form 10 K and other reports on file with the SEC. This presentation also refers to Discretionary Cash Flow, EBITDAX, Free Cash Flow, Adjusted Net Income (Loss), Return on Capital Employed (ROCE) and Net Debt calculations and ratios. These non-gaap financial measures are not alternatives to GAAP measures, and should not be considered in isolation or as an alternative for analysis of the Company s results as reported under GAAP. For additional disclosure regarding such non-gaap measures, including definitions of these terms and reconciliations to the most directly comparable GAAP measures, please refer to Cabot s most recent earnings release at and the Company s related 8-K on file with the SEC. 2
3 Q Highlights Daily equivalent production of 1,895 Mmcfe per day Net income of $42.4 million (or $0.09 per share); adjusted net income (non-gaap) of $57.9 million (or $0.13 per share) Net cash provided by operating activities of $273.9 million; discretionary cash flow (non-gaap) of $196.5 million Returned $239.6 million of cash to shareholders through dividends and share repurchases Improved operating expenses per unit by eight percent relative to the prior-year quarter Announced increase in share repurchase authorization by 20.0 million shares, bringing the current remaining authorization to 30.1 million shares Q Q Q Equivalent Production (Mmcfe/d) 1,895 1,884 1,902 Realized Gas Price (Incl. Hedges) ($/Mcf) $2.15 $2.44 $2.38 Realized Gas Price (Excl. Hedges) ($/Mcf) $2.11 $2.50 $2.38 Net Income ($mm) $42.4 $117.2 $21.5 Adjusted Net Income (non-gaap) ($mm) $57.9 $128.5 $64.0 Discretionary Cash Flow (non-gaap) ($mm) $196.5 $280.3 $255.7 EBITDAX (non-gaap) ($mm) $232.1 $278.6 $274.4 Operating Expenses 1 ($/Mcfe) $1.85 $1.58 $2.02 LTM Net Debt / EBITDAX (Non-GAAP) 0.8x 0.5x 1.1x 3 Note: See supplemental tables at the end of the presentation for a reconciliation of non-gaap measures 1 Includes direct operations, transportation and gathering, taxes other than income, exploration, DD&A, general and administrative, and interest expense
4 Cabot High-Graded its Portfolio to Become the Lowest Cost Natural Gas Producer / Divested offshore and South Louisiana assets Divested Canadian assets Divested Marcellus gathering assets Divested Rocky Mountain assets Divested partial working interest in Pearsall assets Divested Mid-Continent assets Divested East Texas assets Divested conventional West Virginia assets Divested Eagle Ford and Haynesville assets Result: Lowest cost natural gas producer 4
5 Cabot Oil & Gas Overview 2017 Year-End Proved Reserves: 9.7 Tcfe (13% year-over-year increase) 2017 Production: 1,878 Mmcfe/d (10% year-over-year increase) 2018E Production Growth: 10% - 12% 2018E Capital Expenditures: $960 million MARCELLUS SHALE ~3,000 Remaining Undrilled Locations Year-End 2017 Net Producing Horizontal Wells: E Wells Placed on Production: 80 Net Wells Inventory Life Based on 2018E Activity: ~35 years 5
6 Proven Track Record of Debt-Adjusted per Share Growth Daily Production Per Debt-Adjusted Share Year-End Proved Reserves Per Debt-Adjusted Share Note: Debt-adjusted share count is calculated as the sum of the annual weighted average shares outstanding plus the incremental debt shares by dividing total debt by the average annual share price.
7 Industry-Leading Cost Structure Continues to Improve $1.21 Total Company All-Sources Finding & Development Costs ($/Mcfe) $0.87 $0.55 $0.71 $0.57 $0.37 $ $0.65 Marcellus All-Sources Finding & Development Costs ($/Mcf) $0.49 $0.40 $0.43 $0.31 $0.26 $
8 Resulting in a Continued Reduction in Breakeven Prices Cash Operating Expenses ($/Mcfe) Operating Transportation¹ Taxes O/T Income Cash G&A² Financing³ Exploration 4 $1.88 $1.74 $1.31 $1.30 $1.30 $1.16 $1.13 $1.06 $ Q Q Includes all demand charges and gathering fees 2 Excludes stock-based compensation 3 Excludes non-cash interest expense associated with income tax reserves and amortization of deferred financing cost 4 Excludes dry hole cost
9 Cabot s Balance Sheet is Well-Positioned to Provide Financial Flexibility Through the Commodity Price Cycle Net Debt to LTM EBITDAX 2.5x Target Leverage Ratio: 1.0x 1.5x 1.8x 1.4x 1.4x 1.2x 0.9x 1.0x 0.8x 0.5x Q Q Note: See supplemental tables at the end of the presentation for a reconciliation of non-gaap measures


10 Cabot Oil & Gas Strategy Disciplined capital allocation focused on delivering debt-adjusted per share growth, generating positive free cash flow, improving corporate returns on capital employed, increasing return of capital to shareholders, and maintaining a strong balance sheet Deliver growth in production and reserves per debt-adjusted share while generating positive free cash flow 20%+ CAGR in production and reserves per debt-adjusted share from Three-year plan production CAGR of 17% - 21% (20% - 24% on a divestiture-adjusted basis) Forecasted cumulative free cash flow of $1.6 bn - $2.5 bn from allows for potential share repurchases and/or debt reduction, furthering enhancing debt-adjusted per share growth Generate an improving return on capital employed (ROCE) that exceeds our cost of capital Anticipate ROCE increasing from 7.3% in 2017 to 18% - 23% by 2020 (based on a $ $3.25 NYMEX price range) ROCE would be further enhanced by future share repurchases or debt reduction Increase the return of capital to shareholders through dividends and share repurchases Returned over $200 mm of capital to shareholders in 2017 and $536 mm YTD Increased dividend by 150 percent in 2017 and 20 percent in 2018 Repurchased 20 million shares year-to-date Increased share repurchase program authorization by 20.0 mm to 30.1 mm shares (~7% of current shares outstanding) Maintain a strong balance sheet to maximize financial flexibility Net debt / LTM EBITDAX of 0.8x as of 6/30/2018 Liquidity of ~$2.4 bn including cash on hand of $741 mm as of 6/30/2018 Subsequent to 6/30/2018, paid down $237 mm of 6.5% senior notes 10 1 As of July 27, 2018 Note: See supplemental tables at the end of the presentation for a reconciliation of non-gaap measures

11 2018 Capital Budget and Operating Plan 2018E Production Growth: 10% - 12% 2018E Total Program Spending: $960 mm (includes $70 mm of equity pipeline investments) Marcellus Shale Exploration Areas Pipeline Investments Corporate 2% 7% 8% Net Marcellus Wells Placed on Production Due to larger pad sizes in Q1 and the 2 nd completion crew not coming online until February 2018, no wells were placed on production during 0 Q1 20 Q Q Q3 2018E Q4 2018E % Net Production (Mmcfe/d) 1 1,884 1,895 Assumes Gen 5 Completion Design Across the Majority of the 2018 Program 2018 Drilling Program Average Lateral Length: 8,300 feet 2018 Average Well Cost (Including Facilities): $8.3 million ($1,000 per lateral foot) ~2,100 2,200 Q Q Q3 2018E Q4 2018E 2018 exit-to-exit divestitureadjusted production growth guidance: ~35% 11 1 Production forecasts are subject to change based on the in-service timing of new infrastructure projects and takeaway capacity.


12 Thickest Marcellus Section Across the Trend With Two Distinct, Incremental Reservoirs Separated by the Purcell Limestone Cabot is positioned in the thickest producing Marcellus interval in the basin ~ feet of Marcellus section across Cabot s acreage position N Purcell Limestone a frac barrier that separates the Upper and Lower Marcellus reservoirs is 25 feet or thicker across 90% of Cabot s acreage position (up to 90 feet thick) Tully / Geneseo formations are 900 1,900 feet above the intervals shown in Bradford / Susquehanna Counties, PA 12
13 Cabot s Marcellus Position is the Most Prolific U.S. Onshore Natural Gas Resource Play Estimated Ultimate Recovery (EUR) Bcfe/1,000 Lateral Feet Based on Gen 4 / 5 completion designs Based on older Gen 1 / 2 / 3 completion designs Represents >70% of the Lower Marcellus EUR per 1,000 lateral feet for comparable well design Plan to test Gen 5 design on a few Upper Marcellus wells in 2H 2018 Appalachian Gas Play Non-Appalachian Gas Play Peer Average: 2.17 Bcfe / 1, Source: Current investor presentations as of February 16, Peers include Antero Resources, Chesapeake Energy, Eclipse Resources, EQT Corporation, Gulfport Energy, Range Resources, and Southwestern Energy. For companies with multiple type curves, a weighted average was used based on location count or acreage, based on current allocation of drilling capital.
14 2018 is an Inflection Year for Cabot Remaining capacity associated with Trains 2 & Bcf/d 150 Mmcf/d 165 Mmcf/d 160 Mmcf/d ~2.22 Bcf/d Mmcf/d (COG transport capacity): 20 years Mmcf/d (COG transport 2.5 capacity): 15 years 150 Mmcf/d (3 rd party transport capacity): 3 years 50 Mmcf/d (Long-term firm sales): 15 years ~3.75 Bcf/d Q Gross Production Moxie Freedom Power Plant (In-service as of August 8, 2018) Lackawanna Energy Center Power Plant (Train 1 online; Train 2 & 3 on schedule for 2H 2018) Atlantic Sunrise (Target in-service: Early September 2018 due to weather-related delays¹) PennEast (2019) Future Gross Production Capacity Based on Firm Transport / Firm Sales Secured as of Q Cabot continues to evaluate new opportunities to increase firm transport capacity / firm sales and remains confident it can organically grow its production base above 3.75 Bcf/d through the following opportunities: 1) additional sales on currently approved takeaway projects (i.e. Atlantic Sunrise / PennEast) 2) incremental sales on potential future expansion projects 3) increasing in-basin market share 4) new in-basin demand projects 5) future greenfield takeaway projects (including Constitution Pipeline) 14 1 As of August 15, 2018 Note: COG firm transport capacity / firm sales are stated on a gross basis before royalties
15 Dynamic Market Profile for Cabot in the NE Marcellus Despite an anticipated 35% increase in exit-rate production from 2017 to 2018, Cabot expects to reduce its exposure to in-basin prices from ~75% to ~30% by YE 2018 However, Cabot fully expects to defend its market share in-basin over time as we anticipate improved basis differentials going forward, driven by new pipeline takeaway and increased in-basin demand YE 2017 Price Exposure YE 2018 Price Exposure In-Basin Existing Out-of-Basin Power Plants Atlantic Sunrise 15
16 Bcf $/MMBtu The Historical Relationship Between the Storage Delta to the Five-Year Average and Price Indicates that the Current Storage Delta Should Correspond with Higher Prices Natural Gas Storage and Pricing 1,500 1,000 Polar Vortex Warm Winter Cold January & Low Storage and Low Prices $16 $14 $ $10 0 $8 (500) (1,000) $6 $4 $2 (1,500) $0 Storage Delta Compared to the 5-Year Average Henry Hub 16 Source: BTU Analytics, EIA updated through week ending July 20, 2018
17 Bcf Specific to the East Region, Injection Levels for the Rest of the Season Would Need to Be Close to the High Levels Seen in 2014 to Finish the Injection Season Above the Five-Year Low East Natural Gas Storage Level Scenarios 1,000 5-Year Minimum 5-Year Maximum 5-Year Average 2017 Injection Rate 5-Year High Injection Rate 5-Year Average Injection Rate 2018 to Date Apr-18 May-18 Jun-18 Jul-18 Aug-18 Sep-18 Oct-18 Nov Source: BTU Analytics & EIA Updated through week ending July 20, 2018
18 2019 Will Be a Major Inflection Point for U.S. Natural Gas Demand Growth, Primarily Driven by Exports 2019E U.S. Natural Gas Demand Growth +0.5 Bcf/d +1.1 Bcf/d +1.4 Bcf/d Bcf/d Bcf/d 1.7 Texas Southeast Northeast Other 2019E U.S. Natural Gas Demand Growth 18 Source: S&P Global Platts PIRA Natural Gas Service
19 Cabot Offers a Compelling Combination of Top-Tier Yield, Free Cash Flow and Growth Current Dividend Yield 3.1% Peer Median: 0.2% 1.2% 1.0% 1.0% 0.7% 0.7% 0.5% 0.5% 0.2% 0.2% 0.0% 0.0% 0.0% 0.0% 0.0% 0.0% 0.0% Peer A Peer B COG Peer C Peer D Peer E Peer F Peer G Peer H Peer I Peer J Peer K Peer L Peer M Peer N Peer O Peer P 2019E Free Cash Flow Yield 1 8.2% 7.1% 7.1% 5.8% 5.8% Peer Median: 2.2% 3.6% 3.1% 2.6% 2.2% 2.2% 1.9% 1.8% 1.3% 0.6% (0.6%) (2.0%) (3.8%) Peer C Peer A Peer G COG Peer M Peer H Peer D Peer I Peer F Peer N Peer L Peer J Peer B Peer E Peer P Peer O Peer K E Production CAGR % 21.0% 20.1% 19.4% 19.1% 18.0% 15.3% 14.9% Peer Median: 12.1% 13.6% 10.6% 9.0% 6.2% 4.2% 3.4% 2.6% (0.3%) (3.4%) COG Peer L Peer J Peer G Peer M Peer N Peer I Peer E Peer H Peer F Peer C Peer P Peer A Peer D Peer B Peer K Peer O 19 Source: FactSet as of 7/25/2018; peers include: AR, CHK, XEC, CXO, CLR, DVN, ECA, EQT, MRO, MUR, NFX, NBL, PXD, QEP, RRC, SWN. 1 Free cash flow yield is calculated as consensus estimates for discretionary cash flow less capital expenditures divided by market capitalization 2 CXO pro forma for RSP Permian acquisition; EQT pro forma for Rice Energy acquisition
20 Cabot is Committed to Returning Capital to Shareholders Return of Capital to Shareholders ($mm) $700 $600 Dividends Share Repurchases Remaining share repurchase authorization of 30mm shares 1 $500 $400 $300 $200 Commodity Price Downturn $481 Year-to- Date (as of July 27, 2018) $ $0 $165 $139 $109 $13 $17 $79 $25 $33 $33 $ E Increased Dividend 33% 1 As of July 27, 2018 Note: The chart above excludes the Company s 2016 equity issuance Increased Dividend 100% $124 Increased Dividend 150% Increased Dividend 20%
21 Three-Year Cabot Oil & Gas Outlook Three-Year Production CAGR: 17% - 21% (20% - 24% on a divestiture-adjusted basis) Adjusted Net Income ($mm) 1 Discretionary Cash Flow ($mm) 1 $2.75 NYMEX $3.00 NYMEX $3.25 NYMEX $2.75 NYMEX $3.00 NYMEX $3.25 NYMEX $976 $ Actual 2018E 2019E 2020E Free Cash Flow ($mm) 1 $2.75 NYMEX $3.00 NYMEX $3.25 NYMEX 2017 Actual 2018E 2019E 2020E Return on Capital Employed 1 $2.75 NYMEX $3.00 NYMEX $3.25 NYMEX $1.6 bn - $2.5 bn of estimated cumulative after-tax free cash flow from to reinvest in the business and return capital to shareholders 7.3% $ Actual 2018E 2019E 2020E 2017 Actual 2018E 2019E 2020E Incremental share repurchases and debt reduction would further enhance the growth of these metrics on a debt-adjusted per share basis and improve ROCE 21 Note: See the assumptions slide in the appendix for further detail and definitions. 1 Based on midpoint of production guidance. The CAGRs and improvement in ROCE represented in the arrows above are based on the $2.75 NYMEX case.
22 Best-in-Class Marcellus Capital Efficiency Cabot s expects to reach 3.7 Bcf/d of gross production in 2020 Cabot management expects to grow volumes above this illustrative 3.7 Bcf/d level by securing incremental firm transport capacity / firm sales and / or increasing in-basin market share Cabot would generate $1.6bn - $2.5bn of cumulative after-tax corporate free cash flow from before reaching this 3.7 Bcf/d level (based on a $ $3.25 NYMEX price range in ) The illustrative annual free cash flow estimates below include the impact of income taxes, corporate overhead, and interest expense Illustrative Average Annual After-Tax Corporate Free Cash Flow at 3.7 Bcf/d Flat ($bn) Average Annual Maintenance Capital: ~$500mm $1.0 $1.2 $1.4 Implied FCF Yield Based on Current Market Cap 1 : 9% Implied FCF Yield Based on Current Market Cap 1 : 11% Implied FCF Yield Based on Current Market Cap 1 : 13% $2.75 NYMEX $3.00 NYMEX $3.25 NYMEX 22 1 Based on market capitalization as of July 26, 2018 Note: Assumes ($0.35) long-term weighted-average differential to NYMEX
23 2018E $2.75 NYMEX 2018E $3.00 NYMEX 2018E $3.25 NYMEX Consumer Staples Materials Information Technology Consumer Discretionary Industrials Healthcare Utilities Real Estate Energy Telecommunications 2018E Return on Capital Employed Cabot s Anticipated Corporate Returns and Growth Are Competitive Across the Broader S&P 500 Index COG s ROCE and EPS Growth Outlook vs. Median Estimates By Sector 1 25% ROCE 2018E E EPS Growth 70% 20% 15% 10% 5% 60% 50% 40% 30% 20% 10% Consensus 2018E 2019E EPS Growth 0% 0% Enterprise Value / Consensus 2019E EBITDA Multiple 7.4x 12.4x 10.2x 13.7x 10.3x 11.2x 12.4x 10.1x 18.6x 7.6x 6.3x 23 1 COG ROCE and EPS calculations are based on internal estimates. COG s ROCE is calculated with capital employed net of cash to match the methodology used in the referenced broker research. NTM ROCE estimates by sector are sourced from Wolfe Research s report on February 12, 2018 titled Putting Producer ROCE Targets Into Context. Note: FactSet median estimates as of 7/25/2018; excludes the Financials sector due to limited 2019 EBITDA estimates.
24 A Different Class of Investors Are Currently Focused on Energy Driven by a Shift in the S&P Sector Weightings Energy Sector Weighting in Referenced Index S&P 500 S&P 500 Growth S&P 500 Value 13.3% 23.3% 13.1% 6.2% 3.1% 12/31/2008 Current 0.3% 12/31/2008 Current 12/31/2008 Current 24 Source: Bloomberg, JPMorgan; current weightings as of 7/31/2018

25 25 Appendix
26 2018 Guidance Full-year 2018 total company daily production growth guidance: 10% - 12% 2018 exit-to-exit divestiture-adjusted (Marcellus-only) production growth guidance: ~35% Q production guidance: 2,100 2,200 Mmcfe/d 2018 total program spending: $960 million Marcellus Shale: $800 million Exploration Areas: $75 million Pipeline Investments: $70 million Q3 2018E Natural Gas Price Exposure By Index Fixed Price (~$2.65 per Mcf) 25% NYMEX (minus ~$0.45) 19% TGP Z4 300 Leg 19% Leidy Line 16% Millennium 7% D.C. Market Area 6% Dominion 6% Power Pricing 2% Note: Fixed price percentages above include volumes associated with sales agreements that have floor prices. An additional deduct of ~$0.05 per Mcf should be applied to account for fuel use. Corporate: $15 million 2018 Marcellus Shale wells placed on production: 80 net wells 2018 income tax rate guidance: 24% 2018 deferred tax rate guidance: 100%+ (The Company expects to receive a refund in 2018 associated with the recent repeal of the corporate alternative minimum tax) Q3 2018E Cost Assumptions ($/Mcfe, unless otherwise noted) Direct operations $ $0.10 Transportation and gathering $ $0.68 Taxes other than income $ $0.03 Depreciation, depletion and amortization $ $0.53 Interest expense $ $0.11 General and administrative ($mm) 1 $14 - $16 Exploration ($mm) 2 $7 - $9 26 (1) Excluding stock-based compensation (2) Excluding exploratory dry hole costs; includes exploration administration expense and geophysical expenses
27 Financial Position and Risk Management Profile Debt Maturity Schedule ($mm) as of 6/30/2018 (Including Weighted Average Coupon Rate) $600 $500 $400 $300 $200 $100 $0 $237mm repaid in July 2018 $304 $87 $ $62 $575 $ Hedge Position 1 Natural Gas (NYMEX) Swaps Total Volume (Bcf) Average Price per Mcf Natural Gas (NYMEX) Basis Swaps Total Volume - Leidy (Bcf) Average Price per Mcf (Leidy) Total Volume Transco (Bcf) Average Price per Mcf (Transco) 98.0 $ ($0.68) 10.7 $0.41 Approximately 36% of Cabot s forecasted 2018 natural gas volumes are locked-in (includes NYMEX swaps and fixed price contracts) 2 Capitalization / Liquidity As of 6/30/2018 $bn Cash and Cash Equivalents $0.7 Debt $1.5 Net Debt $0.8 Net Capitalization $2.9 Liquidity $2.4 Net Debt / Capitalization 26.6% Net Debt / LTM EBITDAX 0.8x 27 1 As of July 27, Based on the midpoint of the production guidance range
28 Hedge Summary 2018 Natural Gas Swaps # of Total $/Mcf Pricing Index Contracts Mcf/Day Fixed Price Duration LDS NYMEX ,574 $2.93 Feb-18 Dec-18 LDS NYMEX 5 48,572 $3.10 Feb-18 Oct Natural Gas Basis Swaps # of Total $/Mcf Pricing Index Contracts Mcf/Day Fixed Price Duration Leidy 5 48,572 ($0.71) Jan-18 Dec-18 Leidy 5 48,572 ($0.68) Feb-18 Dec Natural Gas Basis Swaps # of Total $/Mcf Pricing Index Contracts Mcf/Day Fixed Price Duration Transco 3 29,143 $0.42 Jan-18 Dec-19 The table above does not include fixed price deals that cover ~23% of Cabot s forecasted 2018 natural gas volumes 28 Note: As of July 27, 2018
29 Three-Year Outlook Assumptions Three-Year Outlook Assumptions (Slide 15) ~($0.50) per Mcf weighted-average basis differential in 2018 and ~($0.35) per Mcf weighted-average basis differential in 2019 and 2020 ~$850 million of annual total company capital spending in 2019 and 2020 (no investments in equity pipelines in 2019 and 2020 as Constitution is not included in this three-year outlook) No capital associated with exploration activity in 2019 and 2020; however, assumes ~$35 million of corporate exploration expense annually. This assumption is subject to change based on the initial results from the ongoing testing in the Company s exploratory areas Refinancing of notes at maturity based on current market indications For purposes of this illustrative analysis, free cash flow is maintained on the balance sheet (ROCE outlook does not reflect the benefit of this free cash flow) Corporate tax rate between 23% and 24% in Deferred tax rates dependent on NYMEX price assumptions 100%+ in 2018 for all three price cases; a range of 70% to 100%+ in 2019 and 25% to 50% in 2020 Service cost inflation of 5%+ annually in 2019 and 2020 (subject to market conditions) Cash G&A expense increases of 3% and 4% in 2019 and 2020, respectively No change to the current Pennsylvania state Impact Fee 29

30 Reconciliation of Net Income to Adjusted Net Income and Adjusted Earnings Per Share 30

31 31 EBITDAX Calculation and Reconciliation
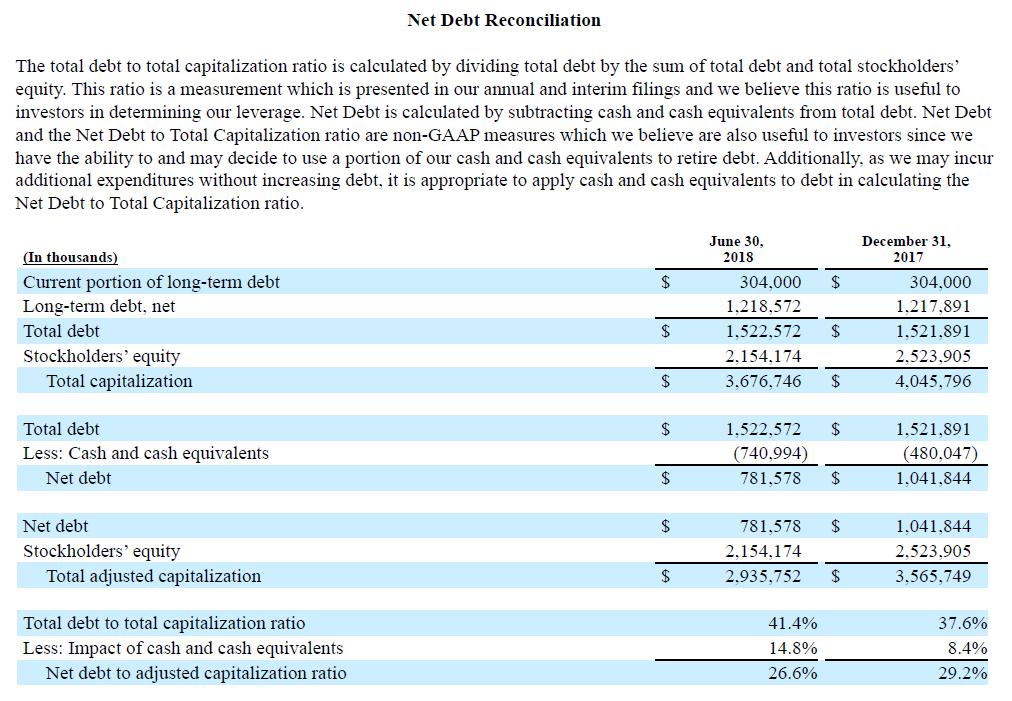
32 32 Net Debt Reconciliation

33 33 Discretionary Cash Flow and Free Cash Flow Calculation and Reconciliation
where we stand where we are going
 where we stand where we are going 2018 Heikkinen Energy Conference August 15, 2018 Forward-Looking Statements and Other Disclaimers This presentation includes forward looking statements within the meaning
where we stand where we are going
 where we stand where we are going J.P. Morgan 2018 Energy Conference June 18-19, 2018 Forward-Looking Statements and Other Disclaimers This presentation includes forward looking statements within the meaning
where we stand where we are going
 where we stand where we are going Third-Quarter 2018 Earnings Call October 26, 2018 Forward-Looking Statements and Other Disclaimers This presentation includes forward looking statements within the meaning
Scotia Howard Weil Energy Conference. March 25-26, 2019
 Scotia Howard Weil Energy Conference March 25-26, 2019 Forward-Looking Statements and Other Disclosures This presentation includes forward looking statements within the meaning of Section 27A of the Securities
where we stand where we are going
 where we stand where we are going Fourth-Quarter and Full-Year 2018 Earnings Call February 22, 2019 Forward-Looking Statements and Other Disclaimers This presentation includes forward looking statements
Investor Presentation January 2017
 Investor Presentation January 2017 FORWARD-LOOKING STATEMENTS AND OTHER DISCLAIMERS This presentation includes forward looking statements within the meaning of Section 27A of the Securities Act of 1933,
June 2016 Investor Presentation
 June 2016 Investor Presentation CABOT OIL & GAS OVERVIEW 2015 Production: 602.5 Bcfe (13% growth) 2015 Year-End Proved Reserves: 8.2 Tcfe (11% growth) 2016E Drilling Activity: ~30 net wells 2016E Production
Oil-focused initiative in the Eagle Ford Shale production growth guidance of 28% - 41% Initial 2015 production growth guidance of 20% - 30%
 INVESTOR PRESENTATION EnerCom s The Oil & Gas Conference 19 August 18, 2014 KEY INVESTMENT HIGHLIGHTS Extensive Inventory of Low-Risk, High-Return Drilling Opportunities Industry-Leading Production and
First Quarter 2016 Earnings Call Presentation April 28, 2016
 First Quarter 2016 Earnings Call Presentation April 28, 2016 FORWARD-LOOKING STATEMENTS This presentation contains forward-looking statements within the meaning of Section 27A of the Securities Act of
Third Quarter 2016 Earnings Call Presentation October 27, 2016
 Third Quarter 2016 Earnings Call Presentation October 27, 2016 FORWARD-LOOKING STATEMENTS This presentation contains forward-looking statements within the meaning of Section 27A of the Securities Act of
Investor Presentation. Jefferies 2013 Global Energy Conference Houston, TX November 12, 2013
 Investor Presentation Jefferies 2013 Global Energy Conference Houston, TX November 12, 2013 KEY INVESTMENT HIGHLIGHTS Extensive Inventory of Low-Risk, High-Return Drilling Opportunities Industry-Leading
3Q Quarterly Update. October 30, 2018
 3Q 2018 Quarterly Update October 30, 2018 Forward-Looking Statements and Other Disclaimers Forward-Looking Statements and Cautionary Statements The foregoing contains forward-looking statements within
Second Quarter 2018 Earnings Call Presentation AUGUST 2, 2018
 Second Quarter 2018 Earnings Call Presentation AUGUST 2, 2018 Cautionary Statement This presentation includes "forward-looking statements". Such forward-looking statements are subject to a number of risks
Energy Industry Data and Trends Supplemental Slides: The Art of the Share Buyback. October 2017
 Energy Industry Data and Trends Supplemental Slides: The Art of the Share Buyback October 2017 Table of Contents Share Buyback Slides Pg. 3 Supplemental Market Slides Pg. 15 The Art of the Share Buyback
4Q Quarterly Update. February 19, 2019
 4Q 2018 Quarterly Update February 19, 2019 Forward-Looking Statements and Other Disclaimers The foregoing contains forward-looking statements within the meaning of Section 27A of the Securities Act of
Second Quarter 2016 Earnings Call Presentation August 3, 2016
 Second Quarter 216 Earnings Call Presentation August 3, 216 FORWARD-LOOKING STATEMENTS This presentation contains forward-looking statements. All statements, other than statements of historical facts,
Cabot Oil & Gas Corporation Announces First-Quarter 2018 Results
 Cabot Oil & Gas Corporation Announces First-Quarter 2018 Results NEWS PROVIDED BY Cabot Oil & Gas Corporation Apr 27, 2018, 06:30 ET HOUSTON, April 27, 2018 /PRNewswire/ -- Cabot Oil & Gas Corporation
SOUTHWESTERN ENERGY ANNOUNCES SECOND QUARTER 2017 FINANCIAL AND OPERATING RESULTS
 NEWS RELEASE SOUTHWESTERN ENERGY ANNOUNCES SECOND QUARTER 2017 FINANCIAL AND OPERATING RESULTS Houston, Texas August 3, 2017...Southwestern Energy Company (NYSE: SWN) today announced its financial and
EnerCom The Oil and Gas Conference 23
 EnerCom The Oil and Gas Conference 23 Forward Looking Statements This presentation contains certain forward-looking statements within the meaning of the federal securities laws, including the safe harbor
SOUTHWESTERN ENERGY ANNOUNCES FIRST QUARTER 2018 RESULTS
 NEWS RELEASE SOUTHWESTERN ENERGY ANNOUNCES FIRST QUARTER 2018 RESULTS Delivers solid operating performance and executes new credit facility Spring, Texas April 26, 2018...Southwestern Energy Company (NYSE:
First Quarter 2016 Supplemental Slides May 4, 2016
 First Quarter 2016 Supplemental Slides May 4, 2016 Company Overview: More Than Just an E&P Company NYSE: RICE NYSE: RMP Upstream Marcellus + Utica Shale Development Rice Midstream Holdings Ohio Gathering
SOUTHWESTERN ENERGY ANNOUNCES CAPITAL PROGRAM AND GUIDANCE FOR 2009
 2350 N. Sam Houston Parkway East Suite 125 Houston, Texas 77032 (281) 618-4700 Fax: (281) 618-4820 NEWS RELEASE SOUTHWESTERN ENERGY ANNOUNCES CAPITAL PROGRAM AND GUIDANCE FOR 2009 Production Projected
EnerCom s The Oil & Gas Conference. August 15, 2012
 EnerCom s The Oil & Gas Conference August 15, 2012 Overview of Operations 16 Bakken Tulsa based company founded in 1963 with long history of operations in the Mid-Continent Integrated approach to business
Third Quarter 2018 Earnings Call Presentation NOVEMBER 1, 2018
 Third Quarter 2018 Earnings Call Presentation NOVEMBER 1, 2018 Legal Disclaimer 2 NO OFFER OR SOLICITATION This presentation includes a discussion of a proposed business combination transaction (the Transaction
Investor Presentation HOWARD WEIL ENERGY CONFERENCE MARCH 2015
 Investor Presentation HOWARD WEIL ENERGY CONFERENCE MARCH 2015 Forward-Looking Statements and Other Disclaimers This presentation contains forward-looking statements within the meaning of Section 27A of
First Quarter 2016 Review. Hal Hickey Harold Jameson Ricky Burnett. Chief Executive Officer Chief Operating Officer Chief Financial Officer
 First Quarter 2016 Review Hal Hickey Harold Jameson Ricky Burnett Chief Executive Officer Chief Operating Officer Chief Financial Officer May 4, 2016 Strategic Plan Update 2 Focus Area # Improvement Plan
Antero Resources Reports First Quarter 2018 Financial and Operating Results
 Antero Resources Reports First Quarter 2018 Financial and Operating Results Denver, Colorado, April 25, 2018 Antero Resources Corporation (NYSE: AR) ( Antero or the Company ) today released its first quarter
Fourth Quarter 2017 Earnings Call Presentation FEBRUARY 14, 2018
 Fourth Quarter 2017 Earnings Call Presentation FEBRUARY 14, 2018 Cautionary Statement This presentation includes "forward-looking statements". Such forward-looking statements are subject to a number of
EQT REPORTS SECOND QUARTER 2014 EARNINGS
 EQT REPORTS SECOND QUARTER 2014 EARNINGS Reiterates full-year production volume guidance PITTSBURGH, PA (July 24, 2014) -- EQT Corporation (NYSE: EQT) today announced second quarter 2014 net income attributable
Devon Energy Announces Three-Year Outlook and Detailed 2018 Guidance; Reports Fourth Quarter Earnings Results
 Devon Energy Corporation 333 West Sheridan Avenue Oklahoma City, OK 73102-5015 NEWS RELEASE Devon Energy Announces Three-Year Outlook and Detailed 2018 Guidance; Reports Fourth Quarter Earnings Results
Investor Presentation. November 2018
 Investor Presentation November 2018 Forward-Looking Statements and Other Disclaimers Forward-Looking Statements and Cautionary Statements The foregoing contains forward-looking statements within the meaning
Antero Resources Reports Second Quarter 2017 Financial and Operational Results and Increases 2017 Production Guidance
 NEWS RELEASE Antero Resources Reports Second Quarter 2017 Financial and Operational Results and Increases 2017 Production Guidance 8/2/2017 DENVER, Aug. 2, 2017 /PRNewswire/ -- Antero Resources Corporation
First Quarter 2018 Earnings Call Presentation APRIL 26, 2018
 First Quarter 2018 Earnings Call Presentation APRIL 26, 2018 Cautionary Statement This presentation includes "forward-looking statements". Such forward-looking statements are subject to a number of risks
EQT Corporation Announces Acquisition of Rice Energy
 EQT Corporation Announces Acquisition of Rice Energy Investor Presentation June 19, 2017 Cautionary Statement Regarding Forward-Looking Information This communication may contain certain forward-looking
CABOT OIL & GAS CORPORATION Annual Report. where we stand where we are going
 CABOT OIL & GAS CORPORATION 2017 Annual Report where we stand where we are going where we stand Cabot executed on our strategy to deliver long-term shareholder return in 2017 and delivered the highest
Antero Resources Reports Fourth Quarter and Year- End 2013 Financial and Operating Results
 Antero Resources Reports Fourth Quarter and Year- End 2013 Financial and Operating Results February 26, 2014 DENVER, Feb. 26, 2014 /PRNewswire/ -- (Logo: http://photos.prnewswire.com/prnh/20131101/la09101logo)
Analyst Presentation. October 29, 2018
 Analyst Presentation October 29, 2018 Key Investment Highlights Premier Natural Gas Asset Base 680,000 core net Marcellus acres / ~2,400 undeveloped locations Contiguous acreage position allows longer
Rice Midstream Partners First Quarter 2016 Supplemental Slides May 4,
 Rice Midstream Partners First Quarter 2016 Supplemental Slides May 4, 2016 1 www.ricemidstream.com RMP: High Growth MLP in Prolific Appalachian Basin TOP-TIER GROWTH DRIVEN BY ACTIVE CUSTOMERS Strategically
Company Overview. March 2012
 Company Overview March 2012 Forward-Looking Statements This presentation contains forward-looking statements within the meaning of Section 27A of the Securities Act of 1933 and Section 21E of the Securities
U.S. Leader in Return on Capital Employed. Among Lowest Cost Producers in Global Oil Market. Commitment to Safety and the Environment
 Bernstein _0517-2 U.S. Leader in Return on Capital Employed U.S. Oil Growth Leader Among Lowest Cost Producers in Global Oil Market Commitment to Safety and the Environment Create Significant Long-Term
First Quarter 2017 Earnings Call Presentation May 9, 2017
 First Quarter 2017 Earnings Call Presentation May 9, 2017 FORWARD-LOOKING STATEMENTS This presentation contains forward-looking statements. All statements, other than statements of historical facts, included
SOUTHWESTERN ENERGY ANNOUNCES 2015 FINANCIAL AND OPERATING RESULTS
 NEWS RELEASE SOUTHWESTERN ENERGY ANNOUNCES 2015 FINANCIAL AND OPERATING RESULTS Houston, Texas February 25, 2016...Southwestern Energy Company (NYSE: SWN) today announced its financial and operating results
EQT Reports Record Earnings for 2013 Production Sales Volume Growth of 43%
 EQT Reports Record Earnings for 2013 Production Sales Volume Growth of 43% PITTSBURGH, PA (February 13, 2014) -- EQT Corporation (NYSE: EQT) today announced 2013 net income attributable to EQT of $390.6
First Quarter 2018 Supplemental Presentation
 First Quarter 2018 Supplemental Presentation Forward-Looking Statements and Risk Factors Statements made in this presentation that are not historical facts are forward-looking statements. These statements
Investor Update. June 2015
 Investor Update June 2015 Cautionary Statement Regarding Forward-Looking Statements This presentation includes certain forward-looking statements and projections of EP Energy. EP Energy has made every
Investor Presentation
 1 Investor Presentation February 2017 Forward-Looking Statements and Other Disclaimers 2 FORWARD-LOOKING STATEMENTS This presentation and the oral statements made in connection therewith may contain forward
EQT REPORTS SECOND QUARTER 2018 RESULTS Board authorizes $500 million share repurchase program
 EQT REPORTS SECOND QUARTER 2018 RESULTS Board authorizes $500 million share repurchase program PITTSBURGH (July 26, 2018) -- EQT Corporation (NYSE: EQT) today announced financial and operational performance
Investor Presentation. March 2019
 Investor Presentation March 2019 Forward-Looking Statements and Other Disclaimers The foregoing contains forward-looking statements within the meaning of Section 27A of the Securities Act of 1933, as amended,
NYSE:CRK. Second Quarter 2018 Results
 NYSE:CRK Second Quarter 2018 Results This presentation includes forward-looking statements within the meaning of Section 27A of the Securities Act of 1933 and Section 21E of the Securities Exchange Act
Analyst Presentation October 22, 2015
 Analyst Presentation October 22, 2015 EQT Cautionary Statements EQT Corporation (NYSE: EQT) EQT Plaza 625 Liberty Avenue, Suite 1700 Pittsburgh, PA 15222 Pat Kane - Chief Investor Relations Officer (412)
Dahlman Rose Ultimate Oil Service Conference
 Dahlman Rose Ultimate Oil Service Conference December 3, 2012 Overview of Operations 16 Bakken Tulsa based company founded in 1963 with long history of operations in the Mid-Continent Integrated approach
Antero Resources Reports Fourth Quarter and Full Year 2016 Financial and Operational Results
 Antero Resources Reports Fourth Quarter and Full Year 2016 Financial and Operational Results Denver, Colorado, February 28, 2017 Antero Resources Corporation (NYSE: AR) ( Antero or the Company ) today
Company Presentation June 2018
 Company Presentation June 2018 Forward Looking Statements This presentation contains certain forward-looking statements within the meaning of the federal securities laws, including the safe harbor provisions
EQT REPORTS SECOND QUARTER 2016 EARNINGS Increases 2016 drilling plan
 ...... EQT REPORTS SECOND QUARTER 2016 EARNINGS Increases 2016 drilling plan PITTSBURGH, PA (July 28, 2016) -- EQT Corporation (NYSE: EQT) today announced second quarter 2016 net loss attributable to EQT
This presentation includes forward-looking statements within the meaning of Section 27A of the Securities Act of 1933 and Section 21E of the
 NYSE:CRK June 2018 This presentation includes forward-looking statements within the meaning of Section 27A of the Securities Act of 1933 and Section 21E of the Securities Exchange Act of 1934. Forward-looking
SOUTHWESTERN ENERGY ANNOUNCES QUARTERLY AND 2018 RESULTS Continued outperformance, advantaged balance sheet, foundation set for value growth
 NEWS RELEASE SOUTHWESTERN ENERGY ANNOUNCES QUARTERLY AND 2018 RESULTS Continued outperformance, advantaged balance sheet, foundation set for value growth SPRING, Texas February 28, 2019...Southwestern
Analyst Presentation October 27, 2016
 Analyst Presentation October 27, 2016 EQT Cautionary Statements EQT Corporation (NYSE: EQT) EQT Plaza 625 Liberty Avenue, Suite 1700 Pittsburgh, PA 15222 Pat Kane - Chief Investor Relations Officer (412)
GHS 100 Energy Conference. June 24, 2014
 GHS 100 Energy Conference June 24, 2014 Forward-Looking Statement Statements made in this presentation that are not historical facts are forward-looking statements within the meaning of the U.S. Private
Antero Resources Reports Third Quarter 2013 Financial and Operational Results
 Antero Resources Reports Third Quarter 2013 Financial and Operational Results DENVER, Nov. 6, 2013 /PRNewswire/ -- (Logo: http://photos.prnewswire.com/prnh/20131101/la09101logo) Highlights: Net daily production
SOUTHWESTERN ENERGY ANNOUNCES THIRD QUARTER 2018 RESULTS. Operational outperformance captures increasing value from high quality liquids portfolio
 NEWS RELEASE SOUTHWESTERN ENERGY ANNOUNCES THIRD QUARTER 2018 RESULTS Operational outperformance captures increasing value from high quality liquids portfolio Spring, Texas October 25, 2018...Southwestern
2016 Results and 2017 Outlook
 2016 Results and 2017 Outlook March 2, 2017 Cautionary Statement Regarding Forward-Looking Statements This presentation includes certain forward-looking statements and projections of EP Energy. EP Energy
SOUTHWESTERN ENERGY ANNOUNCES SECOND QUARTER 2018 RESULTS
 NEWS RELEASE SOUTHWESTERN ENERGY ANNOUNCES SECOND QUARTER 2018 RESULTS Raises full year 2018 production guidance with no increase to capital investment guidance Expects portfolio to generate modest free
Capturing the Core: Transformative Acquisition of Vantage Energy Inc. September 26, 2016
 RICE MIDSTREAM PARTNERS Capturing the Core: Transformative Acquisition of Vantage Energy Inc. September 26, 2016 1 www.riceenergy.com Acquisition Summary Enhancing Core, Dry-Gas Position in Appalachia
Analyst Presentation November 2016
 Analyst Presentation November 2016 EQT Cautionary Statements EQT Corporation (NYSE: EQT) EQT Plaza 625 Liberty Avenue, Suite 1700 Pittsburgh, PA 15222 Pat Kane - Chief Investor Relations Officer (412)
Third Quarter 2016 Supplemental Presentation November 2, 2016
 Third Quarter 2016 Supplemental Presentation November 2, 2016 Company Overview: The Premier Appalachian Company NYSE: RICE NYSE: RMP Upstream Marcellus + Utica Shale Development Rice Midstream Holdings
EQT REPORTS THIRD QUARTER 2014 EARNINGS Operational Results Continue to Improve GP Achieves Maximum Distribution Threshold
 EQT REPORTS THIRD QUARTER 2014 EARNINGS Operational Results Continue to Improve GP Achieves Maximum Distribution Threshold PITTSBURGH, PA (October 23, 2014) -- EQT Corporation (NYSE: EQT) today announced
Antero Resources Reports Third Quarter 2013 Financial and Operational Results
 Antero Resources Reports Third Quarter 2013 Financial and Operational Results Highlights: Net daily production averaged 566 MMcfe/d, a 25% increase over second quarter 2013 and a 128% increase over third
Ultra Petroleum Corp. Michael D. Watford, Chairman, President and CEO JP Morgan Energy Equity Conference June 28, 2017
 Ultra Petroleum Corp. Michael D. Watford, Chairman, President and CEO JP Morgan Energy Equity Conference June 28, 2017 Ultra Petroleum Corp. is an independent energy company engaged in domestic natural
Jefferies Energy Conference November 29, 2016
 Jefferies Energy Conference November 29, 2016 Rice Energy Strategy 2 www.riceenergy.com Allocate 100% of Capital to Core Assets with Attractive Returns Maintain a Strong Balance Sheet Protect Returns and
CHESAPEAKE ENERGY: THE TRANSFORMATION AND THE FUTURE
 CHESAPEAKE ENERGY: THE TRANSFORMATION AND THE FUTURE Doug Lawler President and Chief Executive Officer FORWARD-LOOKING STATEMENTS This presentation includes forward-looking statements within the meaning
EnerCom s The Oil & Services Conference. February 20, 2013
 EnerCom s The Oil & Services Conference February 20, 2013 Overview of Operations 16 Bakken Tulsa based diversified energy company incorporated in 1963 Integrated approach to business allows Unit to balance
Credit Suisse 24 th Annual Energy Summit FEBRUARY 12, 2019
 Credit Suisse 24 th Annual Energy Summit FEBRUARY 12, 2019 Legal Disclaimer No Offer or Solicitation This presentation includes a discussion of a proposed simplification transaction (the Transaction )
Antero Resources Reports Second Quarter 2013 Financial Results, Utica First Production and Well Rates
 Antero Resources Reports Second Quarter 2013 Financial Results, Utica First Production and Well Rates Highlights: Net daily production averaged 458 MMcfe/d, up 115% over second quarter 2012 production
SOUTHWESTERN ENERGY ANNOUNCES 2017 OPERATIONAL AND FINANCIAL RESULTS
 NEWS RELEASE SOUTHWESTERN ENERGY ANNOUNCES 2017 OPERATIONAL AND FINANCIAL RESULTS Houston, Texas March 1, 2018...Southwestern Energy Company (NYSE: SWN) today announced its financial and operating results
Analyst Presentation September 28, 2015
 Analyst Presentation September 28, 2015 EQT Cautionary Statements EQT Corporation (NYSE: EQT) EQT Plaza 625 Liberty Avenue, Suite 1700 Pittsburgh, PA 15222 Pat Kane - Chief Investor Relations Officer (412)
SOUTHWESTERN ENERGY ANNOUNCES CAPITAL PROGRAM AND PROVIDES GUIDANCE FOR 2003
 2350 N. Sam Houston Parkway East Suite 300 Houston, Texas 77032 (281) 618-4700 Fax: (281) 618-4820 NEWS RELEASE SOUTHWESTERN ENERGY ANNOUNCES CAPITAL PROGRAM AND PROVIDES GUIDANCE FOR 2003 2003 Capital
N e w s R e l e a s e
 N e w s R e l e a s e Chesapeake Energy Corporation P. O. Box 18496 Oklahoma City, OK 73154 FOR IMMEDIATE RELEASE JANUARY 17, 2006 JEFFREY L. MOBLEY, CFA VICE PRESIDENT INVESTOR RELATIONS AND RESEARCH
Analyst Presentation. October 24, 2013
 Analyst Presentation October 24, 2013 EQT Cautionary Statements EQT Corporation (NYSE: EQT) EQT Plaza 625 Liberty Avenue, Suite 1700 Pittsburgh, PA 15222 Pat Kane - Chief Investor Relations Officer (412)
Ultra Petroleum Corp. Michael D. Watford Chairman, President and CEO
 Ultra Petroleum Corp. Michael D. Watford Chairman, President and CEO May 2013 Ultra Petroleum Corp. is an independent exploration and production company focused on developing its long-life natural gas
Natural Gas Liquids Update: Leading Position & Strong Fundamentals
 1 Natural Gas Liquids Update: Leading Position & Strong Fundamentals Cautionary Statement This presentation includes "forward-looking statements". Such forward-looking statements are subject to a number
Howard Weil Energy Conference
 Howard Weil Energy Conference Brent Smolik Chairman, President and Chief Executive Officer EP Energy Corporation March 26, 2014 Forward Looking Statements This March 26, 2014 presentation includes certain
EQT Reports Second Quarter 2012 Earnings
 July 26, 2012 EQT Reports Second Quarter 2012 Earnings Strong Operating Performance Overshadowed By Lower Commodity Prices PITTSBURGH--(BUSINESS WIRE)-- EQT Corporation (NYSE: EQT) today announced second
Antero Resources Reports First Quarter 2013 Results
 Antero Resources Reports First Quarter 2013 Results DENVER, May 13, 2013 /PRNewswire/ -- Highlights: Net daily production averaged 383 MMcfe/d, up 114% over first quarter 2012 production from continuing
Investor Presentation
 1 Investor Presentation May 2017 Forward-Looking Statements and Other Disclaimers 2 FORWARD-LOOKING STATEMENTS This presentation and the oral statements made in connection therewith may contain forward
Third Quarter 2017 Supplement. October 2017 NBL
 Third Quarter 2017 Supplement October 2017 3Q17 KEY HIGHLIGHTS Solid and differential operational execution Volumes Significantly Exceeding Original Expectations Volumes of 355 MBoe/d, 10 MBoe/d above
Houston CFA Society March 2016
 Houston CFA Society March 2016 100% 90% Forecast 6% 7% 7% 7% 8% 9% 10% 12% 13% 14% 6% 6% 6% 6% 5% 5% 5% 5% 5% 5% 80% 70% 27% 26% 25% 27% 29% 29% 29% 28% 27% 26% 60% 50% 40% 22% 22% 23% 23% 24% 24% 25%
Credit Suisse 23 rd Annual Energy Summit
 Credit Suisse 23 rd Annual Energy Summit Bill Way, President and CEO Compete and Win NYSE: SWN Forward-Looking Statements This presentation includes forward-looking statements. Forward-looking statements
EQT Reports First Quarter 2012 Earnings
 EQT Reports First Quarter 2012 Earnings PITTSBURGH--(BUSINESS WIRE)-- EQT Corporation (NYSE: EQT) today announced first quarter 2012 earnings of $72.0 million, or $0.48 per diluted share. First quarter
Fayetteville Shale Transaction
 Fayetteville Shale Transaction Supplement to August Investor Update September 4, 2018 Forward-Looking Statements This presentation includes forward-looking statements. Forward-looking statements relate
USA Compression Partners, LP Jefferies Global Energy Conference 2013 November 13, 2013
 USA Compression Partners, LP Jefferies Global Energy Conference 2013 November 13, 2013 Disclaimers This presentation contains forward-looking statements relating to the Partnership s operations that are
UNITED STATES SECURITIES AND EXCHANGE COMMISSION Washington, D.C FORM 8-K
 UNITED STATES SECURITIES AND EXCHANGE COMMISSION Washington, D.C. 20549 FORM 8-K CURRENT REPORT Pursuant to Section 13 or 15(d) of the Securities Exchange Act of 1934 Date of Report (Date of earliest event
Antero Resources Reports Fourth Quarter and Full Year 2017 Financial and Operating Results
 NEWS RELEASE Antero Resources Reports Fourth Quarter and Full Year 2017 Financial and Operating Results 2/13/2018 DENVER, Feb. 13, 2018 /PRNewswire/ -- Antero Resources Corporation (NYSE: AR) ("Antero"
3Q 2017 Investor Update. Rick Muncrief, Chairman and CEO Nov. 2, 2017
 3Q 2017 Investor Update Rick Muncrief, Chairman and CEO Nov. 2, 2017 Recent Highlights Raising 2017 oil growth guidance from 40% to 45% year-over-year Current oil production averaging 75,000 BBL/D Increasing
Citi MLP Conference August 16, 2017
 Citi MLP Conference August 16, 2017 Forward-Looking Statements This presentation contains forward-looking statements. All statements, other than statements of historical facts, included in this presentation
May Investor Meetings Financial and Operations Review
 May 2007 Investor Meetings Financial and Operations Review EXCO Roadshow Team Doug Miller - Chairman & CEO Steve Smith - Vice Chairman & President Hal Hickey - Vice President & COO Paul Rudnicki - Vice
NEWS RELEASE. Devon Energy Reports First-Quarter 2018 Results. Highlights
 Devon Energy Corporation 333 West Sheridan Avenue Oklahoma City, OK 73102-5015 NEWS RELEASE Devon Energy Reports First-Quarter 2018 Results Highlights Raising full-year 2018 oil production outlook High-rate
Bank of America Merrill Lynch 2018 Energy Credit Conference. June 2018
 Bank of America Merrill Lynch 2018 Energy Credit Conference June 2018 Forward-Looking Statements and Other Disclaimers No Offer or Solicitation This presentation relates to a proposed business combination
Investor Presentation J.P. Morgan Global High Yield and Leveraged Finance Conference FEBRUARY 2016
 Investor Presentation J.P. Morgan Global High Yield and Leveraged Finance Conference FEBRUARY 2016 Forward-Looking Statements and Other Disclaimers This presentation contains forward-looking statements
JP Morgan Global High Yield Conference February 24, 2015
 JP Morgan Global High Yield Conference February 24, 2015 FORWARD-LOOKING STATEMENTS This presentation contains forward-looking statements within the meaning of Section 27A of the Securities Act of 1933
Cautionary Statements
 INVESTOR PRESENTATION NYSE: ECR August 27 August 27 Cautionary Statements Forward-Looking Statements This presentation contains forward-looking statements within the meaning of Section 27A of the Securities