FY2017 Results and FY2018 Forecasts Mid-term Management Plan VISION 2022
|
|
|
- Jeffrey Burns
- 5 years ago
- Views:
Transcription


1 FY2017 Results and FY2018 Forecasts Mid-term Management Plan VISION 2022 May25, 2018
2 INDEX 1. FY2017 Results 1. FY2017 PL 2. OP variation factors from FY2016 to FY Sales and OP by Segment 4. Sales outside Japan Ratio 5. FY2017 BS 3. Summary of VISION Results of Revised VISION Sales and OP by Segment 3. Historical data and VISION 2017 of OP by Segment 4. Historical data and VISION 2017 of ROE and ROIC 2. FY2018 Forecasts 1. FY2018 Forecasts (PL) 2. OP variation factors from FY2017 to FY Sales and OP by Segment 4. FY2018 Challenges and Strategies 5. Capital Investment by Region/Segment 6. R&D Expenditures by Segment 7. Dividend 4. Mid-term Management Plan VISION /41
3 1.FY2017 Results 3/41
4 1-1. FY2017 Results (PL) Sales have increased by 9.5% over the previous year. Sales and each profit item have achieved record-high. OP has slightly decreased compared with the revised plan. FY2016 FY2017 FY2017 Growth Difference \bn Actual 1 Revised Plan 2 Actual Net Sales 2, , , Operating Profit (1.9) Non-Operating Income/Expenses (1.5) +1.9 Ordinary Income Gain on sales of investment securities (0.9) Loss on disposal of fixed assets (4.3) (3.7) +0.6 Impairment loss on fixed assets - (3.4) (3.4) Restructuring expenses (6.0) (4.0) +2.1 Loss on construction related accident - (80.0) (4.1) (4.1) +5.3 Settlement package (10.1) Profit before Income Taxes Profit Attributable to Non-Controlling Interests Profit Attributable to Owners of the Parent (60.2) (73.0) (12.8) /41

 43 Cost 6 reduction Depreciation +41.1 173.1 150.5 (11.6) R&D and others bn bn 1,505 (10.6) Sales volume (5.6%) (5.")
5 1-2. OP variation factors from FY2016 to FY2017 OP has increased by 22.6bn, due to sales volume increase and global cost reduction, despite unit price decline, increase in depreciation associated with the expanded production capacity and R&D expenditures for future growth. (%):OP Ratio Unit price decline/ Product mix (46.4) 43 Cost 6 reduction Depreciation (11.6) R&D and others bn bn 1,505 (10.6) Sales volume (5.6%) (5.3%) increase 億円 Forex impact ( ) (5.3% ( )Average Rate ) USD EUR FY2016 Actual FY2017 Actual 5/41
6 1-3. Sales and OP by Segment OP has decreased in Automotive over the previous year mainly due to unit price decline and increase in cost of anti-vibration rubber, whereas achieved the revised plan. OP has decreased in Infocommunications over the previous year and the revised plan due to decrease in demand for optical devices. OP has increased in Electronics, Environment and Energy and Industrial Materials and others over the previous year. FY2016 FY2017 FY2017 Growth Difference Actual 1 Revised Plan 2 Actual bn Sales OP Sales OP Sales OP Sales OP Sales OP Automotive 1, , , (1.8) Infocommunications (2.9) +0.3 (4.4) Electronics (10.9) (4.8) (0.6) Environment and Energy Industrial Materials and Others (0.8) Total 2, , , (1.9) Differences between the aggregate of all segments and Total are consolidated eliminations. 6/41
7 1-4. Sales outside Japan Ratio Sales (M$) Ratio (%) 21,000 17,500 Sales outside Japan Ratio (Right axis) 43.8% 45.6% 48.6% 55.2% 58.3% 59.5% 58.8% 59.7% 60% 50% 14,000 10, % Sales amount outside Japan (Left axis) 16,588 40% 30% 7,000 15,004 14,533 15,264 20% 3,500 7,581 10,708 11,436 11,152 13,768 10% 0 FY2009 FY2010 FY2011 FY2012 FY2013 FY2014 FY2015 FY2016 FY2017 0% 7/41
8 1-5. FY2017 BS bn FY2015 Actual FY2016 Actual FY2017 Actual Current Assets 1, , ,445.1 Non-Current Assets 1, , ,572.2 Current Liabilities Non-Current Liabilities (Interest Bearing Debt) (457.1) (511.0) (492.6) Shareholders' Equity 1, , ,410.4 Accumulated Other Comprehensive Income Non- Controlling Interests Total Assets 2, , ,017.3 Shareholders' Equity Ratio 49.6% 48.7% 51.0% Debt/Equity Ratio FY2015 Actual FY2016 Actual FY2017 Actual Operating Profit / Invested Assets(ROIC) 6.8% 7.2% 7.9% Return on Equity(ROE) 6.5% 7.7% 8.1% Operating Profit / Invested Assets(ROIC) = Operating Profit Total Assets-Interest-Free Liabilities 8/41
9 2. FY2018 Forecasts 9/41
10 2-1. FY2018 Forecasts (PL) Sales forecast in FY2018 is 3,200bn, OP is 180bn, ordinary income is 205bn and net income is 125bn. Sales and each profit item are expected to increase over the previous year. FY2017 FY2018 Growth Actual 1H 2H Annual 2-1 bn 1 Plan Plan Plan2 Net Sales 3, , , , FY2018 Plan Forex rate 110/USD 130/EUR Operating Profit Non-Operating Income/Expenses Ordinary Income Net Extraordinary Profit/Loss (1.7) Profit before Income Taxes (30.0) (50.0) (80.0) (5.3) Profit Attributable to Non-Controlling Interests Profit Attributable to Owners of the Parent (73.0) /41

 Unit price decline/ Product mix (43.0) Depreciation (8.9) R&D and others (14.9) Forex impact ( ) (1.4) ( )Average Rate +37.4 2016 2017 2018P USD 108.34 110.")
11 2-2. OP variation factors from FY 2017 to FY2018 OP is forecasted to increase by 6.9bn in FY2018, due to cost reduction and sales volume increase, despite unit price decline and increase in depreciation and R&D expenditures for future growth. (%):OP Ratio Unit price decline/ Product mix bn (5.3%) (46.4) Depreciation (11.6) R&D and others (10.6) Forex impact ( ) +7.9 Cost reduction Sales volume increase bn (5.6%) Unit price decline/ Product mix (43.0) Depreciation (8.9) R&D and others (14.9) Forex impact ( ) (1.4) ( )Average Rate P USD EUR Cost reduction Sales volume increase bn (5.6%) FY2016 Actual FY2017 Actual 11/41 FY2018 Plan
12 2-3. Sales and OP by Segment Whereas sales would increase in Automotive, OP slightly decrease over the previous year due to increase in R&D expenditures for future growth and unit price decline. Other 4 segments would increase OP over the previous year. FY2017 FY2018 Growth Actual1 1H Plan 2H Plan Annual Plan bn Sales OP Sales OP Sales OP Sales OP Sales OP Automotive 1, , (0.8) Infocommunications (0.3) +0.4 Electronics (16.3) +1.6 Environment and Energy Industrial Materials and Others Total 3, , , , Differences between the aggregate of all segments and Total are consolidated eliminations. 12/41
13 2-4. FY2018 Challenges and Strategies(1) Automotive FY2017 FY2018 bn Actual Plan Growth Operating Profit (0.8) 1Acceleration of developing and commercialization of products related to NEV and high speed communication 2Strengthening developing capability of new products by collaboration with internal Sumitomo Electric group and making alliance with strategic partners outside the group 3Sales promotion of aluminum harnesses and to non-japanese customers, and strengthening global production control of Sumitomo Riko Infocommunications FY2017 FY2018 bn Actual Plan Growth Operating Profit Capturing demand in global markets of optical fiber and cables, 100Gbps optical devices and GaN HEMTs for Wireless Infrastructure 2Sales promotion of optical fibers for submarine cables, ultra-high-fiber-count optical cables and related accessories for data centers and 10G-EPON products 3Acceleration of developing ultra-low loss optical fibers, high functional products for optical cabling, ultra high definition (4K/8K) video transmission equipment, Set-Top Box and next-generation optical and wireless devices 13/41
14 2-4. FY2018 Challenges and Strategies(2) Electronics FY2017 FY2018 bn Actual Plan Growth Operating Profit FPC: Further quality improvement, cost reduction and sales promotion Development of ultra-thin, fine pitch and high heat resistant FPC and expansion of revenue base by developing new markets 2Electronic wire: Capturing new marketing opportunities in automotive and electronic business Environment and Energy FY2017 FY2018 bn Actual Plan Growth Operating Profit Enhancing profit of electric power cable business Completion of large scale projects, acquiring new orders and capturing demand for power cable replacement in Japan Further strengthening production capacity and enhancement of competitiveness in cost and quality 2Sales promotion of rectangular magnet wires for electric vehicles 3Expansion of renewable energy related business in coordination with Sumitomo Densetsu and Nissin Electric 14/41
15 2-4. FY2018 Challenges and Strategies(3) Industrial Materials and Others FY2017 FY2018 bn Actual Plan Growth Operating Profit Hard metal: Capturing demand in emerging markets such as China and India in addition to Japan, Europe and America Sales promotion to automotive and non-automotive business 2Sintered parts: Strengthening global supply volume by increasing production capacity 3A.L.M.T.: Intensive cost reduction, concentration of resources in growing market 4Prestressed concrete steel wires, Steel wires for spring : Global production expansion and sales promotion 15/41
 30 21.5 22.4 4.3 20.2 20 16.6 1.1 0.5 4.8 5.1 1.0 0.6 0.3 10 0.3 14.6 0 16.4 14.7 0.4 0.5 15.")

16 2-5. Capital Investment by Region/Segment Capital investment in FY2018 are planned to be 190.0bn in total. ( bn) Asia FY2015 FY2016 FY2017 FY2018P Americas ( bn) FY2015 FY2016 FY2017 FY2018P ( bn) Europe and others FY2015 FY2016 FY2017 FY2018P ( bn) Japan Industrial Materials & others Environment & Energy Infocommunications Automotive 0 FY2015 FY2016 FY2017 FY2018P 16/41

17 2-6. R&D Expenditures by Segment R&D expenditures in FY2018 are planned to be 125.0bn in total Industrial Materials & others 8.0 Environment & Energy 16.0 Electronics 3.0 Infocomm unications 18.0 Basic/Applied/ Prototype Development Automotive FY bn FY2018Plan 125.0bn FY bn ( )Basic and Applied research:30% Prototype Development:70% 17/41
 60 Intermediate dividend payment 50 40 30 20 10 0 Net Income per Share (Yen) Dividend Payout Ratio Year end dividend payment Memorial dividend")

18 2-7. Dividend FY2018 annual dividend is planned to be 48/share. ( /share) 60 Intermediate dividend payment Net Income per Share (Yen) Dividend Payout Ratio Year end dividend payment Memorial dividend payment Memorial dividend Memorial dividend FY2006 FY2007 FY2008 FY2009 FY2010 FY2011 FY2012 FY2013 FY2014 FY2015 FY2016 FY2017 FY2018P % 17.7% 82.6% 44.2% 21.3% 25.6% 41.8% 26.1% 19.9% 30.5% 29.1% 29.8% 29.9% 18/41
19 3. Summary of VISION /41
20 3-1. Results of Revised VISON2017 Revised "VISION 2017" FY2017 Actual Net Sales 3,300.0bn 3,082.2bn Operating Profit ( ) 200.0bn 173.1bn Operating Profit / Net Sales 6% or more 5.6% ROIC 9% or more 7.9% ROE 8% or more 8.1% Capital Investment (5 years) 800.0bn 821.1bn R&D Expenditures (5 years) 480.0bn 548.8bn ( ) Revised OP in which forex rates are adjusted to FY2017 actual rates and fluctuation effects of copper price are eliminated: 189.9bn Forex Rate Revised FY2017 VISION2017 Actual 115/$ /$ 130/ / 20/41
21 3-2. Sales and OP by Segment OP has almost achieved the revised and adjusted VISION2017 in 3 segments (Automotive, Infocommunications and Industrial Materials and Others). OP ( bn) , , bn 189.9bn 3, , ,500 3,000 Sales ( bn) 175.0bn 173.1bn 2, , Forex Rate 10% 10% 15% 15% Revised VISION /$ 130/ Revised and adjusted VISION /$ / 6.0bn (3%) 23.0bn (13%) 21.0bn (12%) 29.0bn (17%) FY2017 Revised Plan 110/$ 120/ 21/ 億円 (13%) 5.4bn (3%) 290 億円 (17%) 18.6bn (11%) 24.1bn (14%) 28.2bn (16%) FY2017 Actual /$ / 1, 億円 (11%) 1, 億円 (16%) 0 Automotive Infocommunications Electronics Environment & Energy Industrial Materials & others

22 3-3. Historical data and VISION 2017 of OP by Segment OP has almost achieved the revised and adjusted VISION2017 in 3 segments (Automotive, Infocommunications and Industrial Materials and Others). 22/41
23 3-4. Historical data and VISION 2017 of ROE and ROIC ROE has achieved the revised VISION17 target. ROIC has fallen from the revised VISION17 target whereas improved to 7.9%. 10.0% 9.1% 7.7% 8.1% 9% 6.8% 8.0% ROIC 6.5% 6.0% 4.8% 7.9% 8% 4.0% 7.2% 6.5% 5.9% ( ) ( ) Exclude gain on a sale of shares of Sumitomo 3M 2.0% ROE 3.7% 0.0% FY2012 FY2014 FY2015 FY2016 FY2017 Revised "VISION2017" 23/41
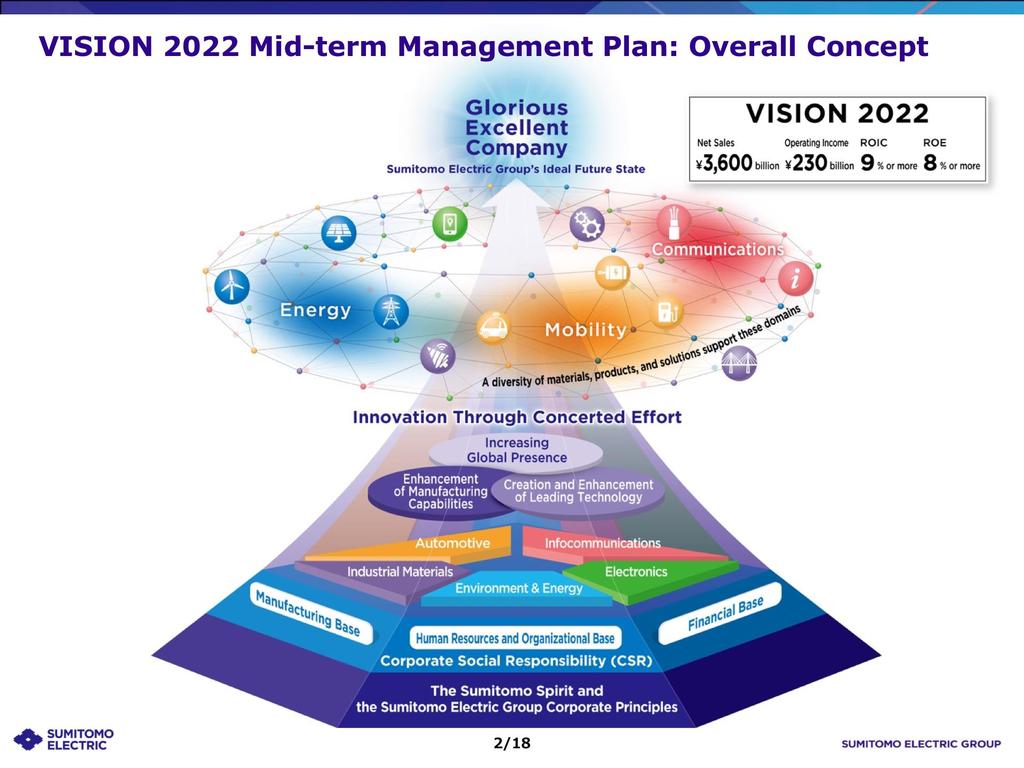
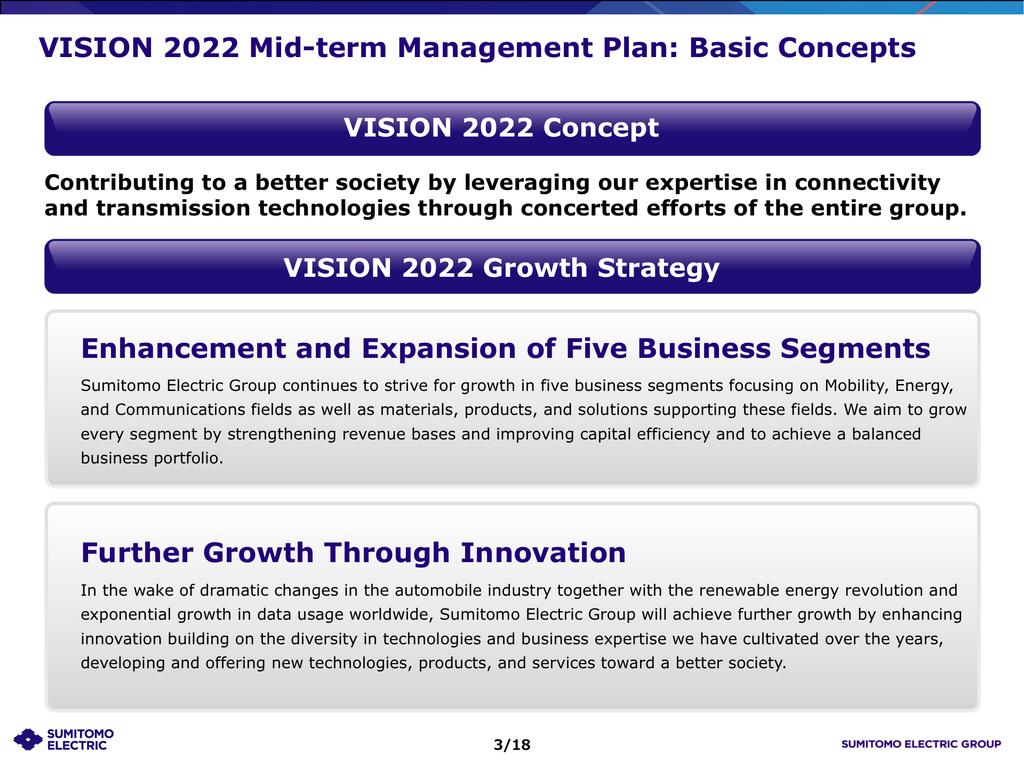
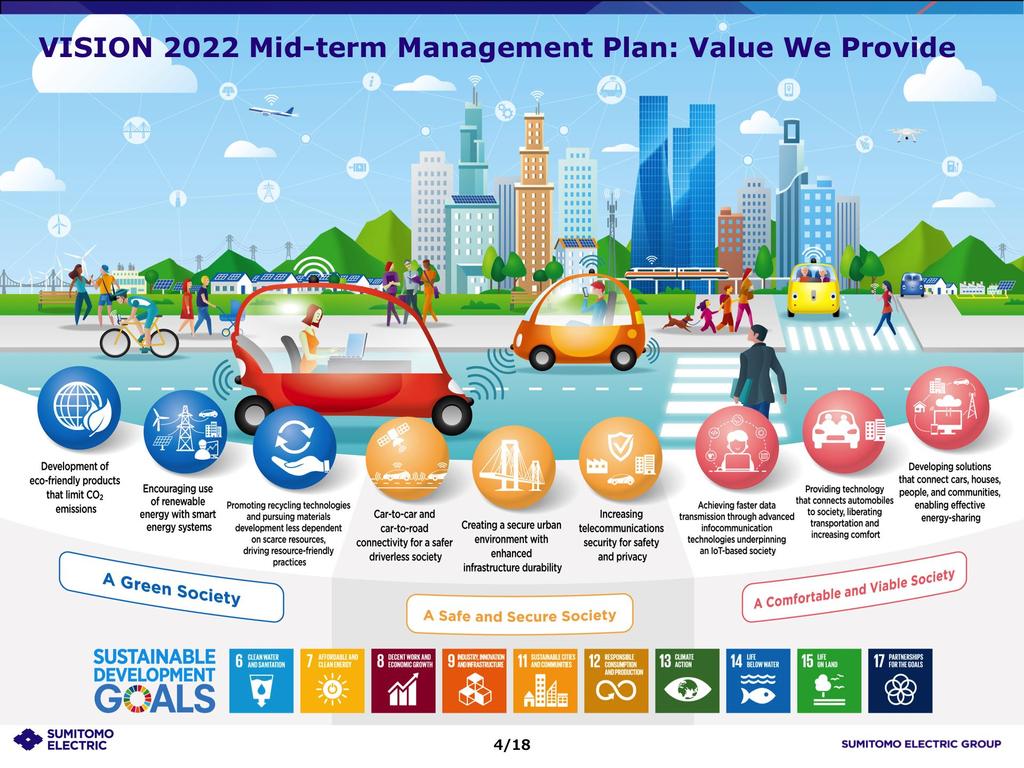
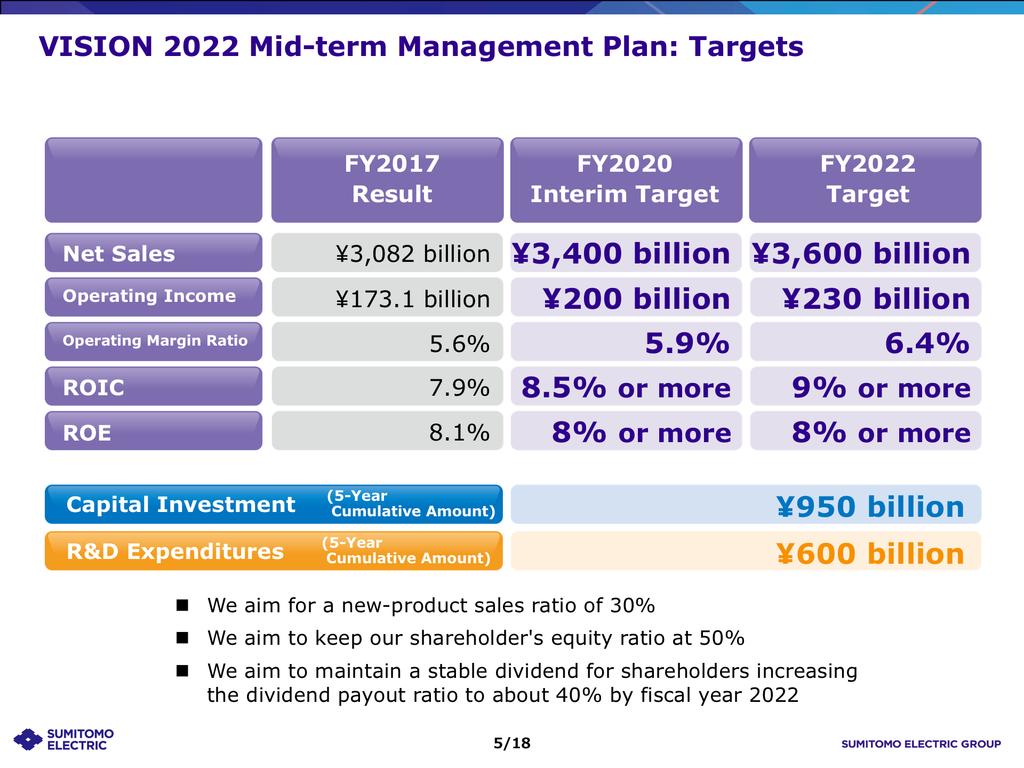
24 4.Mid-term Management Plan VISION /41
25 25/41
26 26/41
27 27/41
28 28/41
29 29/41
30 30/41
31 31/41
32 32/41

33 33/41
34 34/41
35 35/41
36 36/41

37 37/41
38 38/41
39 39/41

40 40/41

41 Notes on Perspective Information 41/41
FY2016 Results and FY2017 Forecasts 2017/5/26
 Results and FY2017 Forecasts 2017/5/26 INDEX 1. Results 1. PL 2. Factors of Increase or Decrease in OP 3. Sales and OP by Segment 4. Overseas Sales Ratio 5. BS 3. Overseas Expansion of Power Cable Business
FY2014 Results and FY2015 Forecasts Revision of Mid-term Business Plan VISION2017
 FY2014 Results and FY2015 Forecasts Revision of Mid-term Business Plan VISION2017 2015/05/26 INDEX 1. FY2014 Results 1. FY2014 PL 2. Factors of Increase or Decrease in OP 3. Sales and OP by Segment 4.
FY2018 Q1 Financial Results
 FY2018 Financial Results Director, Corporate Executive Vice President, and General Manager of the Finance & Procurement Hiroyuki Ogiwara August 1 st, 2018 FURUKAWA ELECTRIC CO., LTD. Forward-Looking Statements
3Q FY2018 Financial Results. February 4, 2019
 3Q Financial February 4, 2019 1 Contents 1. Review of 3Q Financial and Forecast 2. By Segment 3. Shareholder Return 1. Review of 3Q Financial and Forecast 2 3Q Financial and Forecast (Unit : Yen in billion)
FY2013 Management Plan. May 2013 Mitsuyoshi Shibata, President Furukawa Electric
 FY2013 Management Plan May 2013 Mitsuyoshi Shibata, President Furukawa Electric 1 FY2012 Highlights Both sales and profits increased from a year ago, reflecting the strong performance of the auto parts
FY2016 Financial Results
 FY2016 Financial Results President Keiichi Kobayashi Director, Corporate Executive Vice President General Manager, the Finance & Procurement Division and General Manager, Global Group Management Division
FY2013 Financial Results
 FY2013 Financial Results Fujikura Ltd. May 12, 2014 1 Ⅰ. Strategies for FY2014 Yoichi Nagahama, President & C.E.O. Ⅱ. FY2013 Financial Results Hideo Shiwa, Managing Executive Officer 2 Ⅰ. Strategies for
FY2017 Q2 Financial Results
 FY2017 Q2 Financial Results Director, Corporate Executive Vice President, and General Manager of the Finance & Procurement Hiroyuki Ogiwara November 2, 2017 FURUKAWA ELECTRIC CO., LTD Forward-Looking Statements
Hitachi Metals Financial Results for Fiscal Year Ended March 31, 2018 Operating Results Forecast for Fiscal Year Ending March 31, 2019
 Hitachi Metals Financial Results for Fiscal Year Ended March 31, 2018 Operating Results Forecast for Fiscal Year Ending March 31, 2019 April 26, 2018 Hitachi Metals, Ltd. 2018. All rights reserved. 1 1.
Hitachi Metals Financial Results for the Nine Months Ended December 31, 2017
 Hitachi Metals Financial Results for the Nine Months Ended December 31, 2017 January 29, 2018 1 1. Overview of the Nine Months Ended December 31, 2017 Trend in demand The global economy remained on a modest
Financial Results for the Third Quarter Ended December 31, 2013 (FY13 Q1-Q3)
") Financial Results for the Third Quarter Ended December 31, 2013 (FY13 Q1-Q3) January 30, 2014 OMRON Corporation Omron Corporation Contents 1. FY13 Q3 & Full-Year Overview P. 2 2. FY13 Q3 Results & Full-Year
Financial Results for the Third Quarter Ended December 31, 2013 (FY13 Q1-Q3) January 30, 2014 OMRON Corporation Omron Corporation Contents 1. FY13 Q3 & Full-Year Overview P. 2 2. FY13 Q3 Results & Full-Year
Consolidated Financial Results for 1Q FY2018
 Consolidated Financial for FY2018 July 27, 2018 Fuji Electric Co., Ltd. 2018 Fuji Electric Co., Ltd. All rights reserved. 1 Summary of Consolidated Financial for FY2018 (YoY Comparison) Continuation of
3Q FY2016 Financial Results
 3Q Financial Results Fujikura Ltd. February 2, 2017 1 Contents 1. Review of 3Q Financial Results and Forecasts 2. By Segment 3. Shareholder Return 1. Review of 3Q Financial Results and Forecasts 2 3Q Financial
FY2017 Results Presentation
 s Presentation KITZ CORPORATION May 2018 The forecast data presented herein reflects assumed results based on conditions that are subject to change. KITZ Corporation does not make representations as to,
Financial Results for Third Quarter FY2018. SHIMA SEIKI MFG., LTD. February, 2019
 Financial Results for Third Quarter FY2018 SHIMA SEIKI MFG., LTD. February, 2019 Summary of Operating Results for 3Q of the Fiscal Year Ending March 31, 2019 (Terms: Millions of yen) FY2018 3Q FY2017 3Q
Hitachi Metals Financial Results for the First Three Months of Fiscal Year 2018 (April 1, 2018 to June 30, 2018)
") Hitachi Metals Financial Results for the First Three Months of Fiscal Year 2018 (April 1, 2018 to June 30, 2018) July 26, 2018 1 1. Overview of the First Three Months of Fiscal Year 2018 Trend in demand
Hitachi Metals Financial Results for the First Three Months of Fiscal Year 2018 (April 1, 2018 to June 30, 2018) July 26, 2018 1 1. Overview of the First Three Months of Fiscal Year 2018 Trend in demand
Bando Chemical Industries, Ltd.
 Consolidated Business Results for the Fiscal Year Ending March 31, 217 Bando Chemical Industries, Ltd. May 12, 217 Ⅰ. Financial summary for the fiscal year ending March 31, 217 Ⅱ. Business forecast for
Other Notes Numbers of shares issued (Common stock) (ⅰ) Number of shares outstanding at end of period (Including treasury stock) June, ,904,35
 (ⅰ) Number of shares outstanding at end of period (Including treasury stock) June, ,904,35") Consolidated Financial Report [IFRS] For the First Quarter Ended June 30, 2017 Listed Company: Hitachi Metals, Ltd. (URL http://www.hitachi-metals.co.jp/e/index.html) Listed Stock Exchanges: Tokyo Stock
Consolidated Financial Report [IFRS] For the First Quarter Ended June 30, 2017 Listed Company: Hitachi Metals, Ltd. (URL http://www.hitachi-metals.co.jp/e/index.html) Listed Stock Exchanges: Tokyo Stock
FY2015 Management Plan Q3 Review (First Nine Months Review)
") FY2015 Management Plan Q3 Review (First Nine Months Review) February 4, 2016 Hiroyuki Ogiwara Director, General Manager of the Finance & Procurement Division FURUKAWA ELECTRIC CO., LTD. Forward-Looking
FY2015 Management Plan Q3 Review (First Nine Months Review) February 4, 2016 Hiroyuki Ogiwara Director, General Manager of the Finance & Procurement Division FURUKAWA ELECTRIC CO., LTD. Forward-Looking
Consolidated Financial Results for 3Q FY2017
 Consolidated Financial Results for 3Q FY2017 January 30, 2018 Fuji Electric Co., Ltd. 2018 Fuji Electric Co., Ltd. All rights reserved. 1 Summary of Consolidated Financial Results for (Apr.- Dec.) FY2017
Bando Chemical Industries, Ltd.
 Consolidated Business Results for the First Half of Fiscal 2011 November 4, 2011 Bando Chemical Industries, Ltd. 0 First Half Financial Summary for the Fiscal Year Ending March 31, 2012 1 (1)Settlement
1H of FY2013 (Apr. to Sep.) Earnings Presentation (Overview)
 Earnings Presentation (Overview)") 1 1H of FY2013 (Apr. to Sep.) Earnings Presentation (Overview) 1 Overview of 1H FY2013 Results [Billion, except for reference] 1H FY2013 1H FY2012 Difference 1H FY2013 Forecast Announced Aug. 1, 2013 Net
1 1H of FY2013 (Apr. to Sep.) Earnings Presentation (Overview) 1 Overview of 1H FY2013 Results [Billion, except for reference] 1H FY2013 1H FY2012 Difference 1H FY2013 Forecast Announced Aug. 1, 2013 Net
Financial Results for the Second Quarter Ended September 30, 2013 (FY13 Q1-Q2)
") Financial Results for the Second Quarter Ended September 30, 2013 (FY13 Q1-Q2) October 29, 2013 OMRON Corporation Omron Corporation Contents 1. FY13 1H (Q1-Q2) Results & Full-Year Forecast FY13 1H Results
Financial Results for the Second Quarter Ended September 30, 2013 (FY13 Q1-Q2) October 29, 2013 OMRON Corporation Omron Corporation Contents 1. FY13 1H (Q1-Q2) Results & Full-Year Forecast FY13 1H Results
3. Business results forecast for the year ending March 31, 2019 (Apr.1, Mar.31, 2019) Revenues Adjusted Operating Income (% indicates the rate
 Revenues Adjusted Operating Income (% indicates the rate") Consolidated Financial Report [IFRS] For the Year Ended March 31, 2018 Listed Company: Hitachi Metals, Ltd. (URL http://www.hitachi-metals.co.jp/e/index.html) Listed Stock Exchanges: Tokyo Stock Exchange,
Consolidated Financial Report [IFRS] For the Year Ended March 31, 2018 Listed Company: Hitachi Metals, Ltd. (URL http://www.hitachi-metals.co.jp/e/index.html) Listed Stock Exchanges: Tokyo Stock Exchange,
Q Earnings Financial Results for the First Quarter Ended June 30, July 29, 2014 OMRON Corporation
 Q1 2014 Earnings Financial Results for the First Quarter Ended June 30, 2014 July 29, 2014 OMRON Corporation Contents 1. FY14 Overview P. 2 2. Q1 Results P. 4 3. H1 Forecast P. 11 4. Full-Year Forecast
Q Earnings Financial Results for the First Quarter Ended June 30, July 30, 2015 OMRON Corporation
 Q1 2015 Earnings Financial Results for the First Quarter Ended June 30, 2015 July 30, 2015 OMRON Corporation Summary FY2015 Q1 Results Sales & operating income in line with internal guidance (sales up
FY2017 Consolidated Financial Forecasts (April 1, 2016 through March 31, 2017) May 26, 2016 AISIN SEIKI Co., Ltd. (
 May 26, 2016 AISIN SEIKI Co., Ltd. (") Consolidated Financial Forecasts (April 1, 216 through March 31, 217) May 26, 216 AISIN SEIKI Co., Ltd. (http://www.aisin.com/) - 1 - Overview of Financial Forecast 1While market in Japan stays the same
Consolidated Financial Forecasts (April 1, 216 through March 31, 217) May 26, 216 AISIN SEIKI Co., Ltd. (http://www.aisin.com/) - 1 - Overview of Financial Forecast 1While market in Japan stays the same
Group Companies Profiles Our history Division Structure Stamping and Molding Valves business
 1 2 We sell stamping, molding, valve, and TPMS products. In the tire valve market, our corporation s founding enterprise, we are a specialized manufacturer with the world s top market
Consolidated Financial Results of 2 nd Quarter for the Year Ending March 31, 2019
 Consolidated Financial Results of 2 nd Quarter for the Year Ending March 31, 219 November 8, 218 Takashi Shimomura Corporate Officer Division General Manager, Finance Division 1/16 218 Sanden Holdings
Other Notes Numbers of shares issued (Common stock) (i) Number of shares outstanding at end of period (Including treasury stock) Dec., ,904,35
 (i) Number of shares outstanding at end of period (Including treasury stock) Dec., ,904,35") Consolidated Financial Report [IFRS] For the 9-month period ended December 31, 2017 Listed Company: Hitachi Metals, Ltd. (URL http://www.hitachi-metals.co.jp/e/index.html) Listed Stock Exchanges: Tokyo
Consolidated Financial Report [IFRS] For the 9-month period ended December 31, 2017 Listed Company: Hitachi Metals, Ltd. (URL http://www.hitachi-metals.co.jp/e/index.html) Listed Stock Exchanges: Tokyo
Fiscal 2015 Supplementary Information May 10, 2016
 Fiscal 2015 Supplementary Information May 10, 2016 * Forward-looking statements made in this document, such as business forecasts, are based on the information available at this time and on certain premises
Financial Results for the Fiscal Year Ended March 31, 2013 (FY12)
") Financial Results for the Fiscal Year Ended March 31, 2013 (FY12) April 26, 2013 OMRON Corporation Omron Corporation Contents 1. FY12 Results P. 3 2. FY13 Forecast P. 10 3. VG Strategies P. 19 Higher Corporate
Financial Results for the Fiscal Year Ended March 31, 2013 (FY12) April 26, 2013 OMRON Corporation Omron Corporation Contents 1. FY12 Results P. 3 2. FY13 Forecast P. 10 3. VG Strategies P. 19 Higher Corporate
FY2015 Management Plan. May 11, 2015 FURUKAWA ELECTRIC CO., LTD.
 FY2015 Management Plan May 11, 2015 FURUKAWA ELECTRIC CO., LTD. Forward-Looking Statements Projections of future sales and earnings in these materials, except those related to the past and current facts,
Consolidated Business Results and Forecast. May 15, 2009 NSK Ltd.
 FINANCIAL IAL CONFERENCE Consolidated Business Results and Forecast May 15, 29 NSK Ltd. Cautionary Statements with Respect to Forward-Looking Statements Statements made in this report with respect to plans,
Earning Presentation
 Earning Presentation for the Year ended March 31, 2018 May 11, 2018 This presentation contains forward looking statements that are based on current expectations and assumptions. Actual results could differ
72 Corporate Data / Stock Information
 50 About Us Hitachi, Ltd. Integrated Report 2016 52 Segment Information 54 Financial & Non-Financial Highlights 56 10-Year Financial Data 58 Operating and Financial Review 64 Consolidated Statements of
Other Notes Numbers of shares issued (Common stock) (ⅰ) Number of shares outstanding at end of period (Including treasury stock) Sept., ,904,3
 (ⅰ) Number of shares outstanding at end of period (Including treasury stock) Sept., ,904,3") Consolidated Financial Report [IFRS] For the 6-month period ended September 30, 2018 Listed Company: Hitachi Metals, Ltd. (URL http://www.hitachi-metals.co.jp/e/index.html) Listed Stock Exchanges: Tokyo
Consolidated Financial Report [IFRS] For the 6-month period ended September 30, 2018 Listed Company: Hitachi Metals, Ltd. (URL http://www.hitachi-metals.co.jp/e/index.html) Listed Stock Exchanges: Tokyo
Taiyo Holdings / 4626
 COVERAGE INITIATED ON: 2017.12.08 Shared Research Inc. has produced this report by request from the company discussed in the report. The aim is to provide an owner s manual to investors. We at Shared Research
Financial Results for the Year Ended March 31, 2018 [Japanese GAAP] (Consolidated)
![Financial Results for the Year Ended March 31, 2018 [Japanese GAAP] (Consolidated)](/thumbs/83/87456160.jpg "Financial Results for the Year Ended March 31, 2018 [Japanese GAAP] (Consolidated)") Financial Results for the Year Ended March 31, 2018 [Japanese GAAP] (Consolidated) May 11, 2018 Company name: Tatsuta Electric Wire & Cable Co., Ltd. Stock exchange listing: Tokyo Stock Exchange Stock
Financial Results for the Year Ended March 31, 2018 [Japanese GAAP] (Consolidated) May 11, 2018 Company name: Tatsuta Electric Wire & Cable Co., Ltd. Stock exchange listing: Tokyo Stock Exchange Stock
FY2015 Revised Earnings Forecast. April 25, 2016 Furukawa Electric Co., Ltd.
 FY2015 Revised Earnings Forecast April 25, 2016 Furukawa Electric Co., Ltd. Forward-Looking Statements Projections of future sales and earnings in these materials are forward-looking statements. Management
TE Connectivity. Citi U.S. and European Industrials Conference. September 2013
 TE Connectivity Citi U.S. and European Industrials Conference September 2013 Forward-Looking Statements and Non-GAAP Measures Forward-Looking Statements -- This presentation contains certain forward-looking
3 rd Quarter FY2018. Financial Results. ended Dec. 31, 2017
 3 rd Quarter FY2018 Financial Results ended Dec. 31, 2017 1. 3 rd Quarter FY2018 Financial Results 2. FY2018 Financial Forecasts 1-1) Overview of 3 rd Quarter Financial Results
First Quarter of FY Japan Display Inc. Consolidated Financial Results. August 9, 2016
 First Quarter of FY 2016 Consolidated Financial Results Japan Display Inc. August 9, 2016 Agenda 1. 1Q16 Results & 2Q16 Forecast 2. Sales Trends and JDI s Action 3. Management Challenges Note: The depreciation
H Financial Results
 Milan August 1 st, 2013 1 AGENDA H1 2013 Highlights & FY 2013 Outlook Financial Results Appendix 2 H1 2013 Key Financials Euro Millions, % on Sales Sales Adjusted EBITDA (3) Adjusted EBIT (4) -1.8% * 7,973
1H of FY2016 (Jan. to Jun.) Earnings Presentation (Overview)
 Earnings Presentation (Overview)") 1H of FY2016 (Jan. to Jun.) Earnings Presentation (Overview) 1 Overview of 1H FY2016 Results [1] 300 Net Sales 40 Operating Income 40 Ordinary Income 25 Net Income* 250 262.9 244.1 30 31.6 34.6 30 32.2
1H of FY2016 (Jan. to Jun.) Earnings Presentation (Overview) 1 Overview of 1H FY2016 Results [1] 300 Net Sales 40 Operating Income 40 Ordinary Income 25 Net Income* 250 262.9 244.1 30 31.6 34.6 30 32.2
JVC Kenwood Group s Results and Forecast Briefing
 Translation for Reference Only JVC Kenwood Group s Results and Forecast Briefing Fiscal Year Ended March 211 JVC KENWOOD Holdings, Inc April 28, 211 Copyright 211 JVC KENWOOD Holdings Inc. All rights reserved.
Consolidated Financial Report [IFRS] For the 9-month period ended December 31, 2018 Listed Company: Hitachi Metals, Ltd. (URL
![Consolidated Financial Report [IFRS] For the 9-month period ended December 31, 2018 Listed Company: Hitachi Metals, Ltd. (URL](/thumbs/94/119904380.jpg "Consolidated Financial Report [IFRS] For the 9-month period ended December 31, 2018 Listed Company: Hitachi Metals, Ltd. (URL") Consolidated Financial Report [IFRS] For the 9-month period ended December 31, 2018 Listed Company: Hitachi Metals, Ltd. (URL https://www.hitachi-metals.co.jp/e/index.html) Listed Stock Exchanges: Tokyo
Consolidated Financial Report [IFRS] For the 9-month period ended December 31, 2018 Listed Company: Hitachi Metals, Ltd. (URL https://www.hitachi-metals.co.jp/e/index.html) Listed Stock Exchanges: Tokyo
FY nd Quarter Financial Results
 FY2014 2 nd Quarter Financial Results November 7 th, 2014 Calsonic Kansei Corporation President & CEO Hiroshi Moriya 1 FY14 2Q Financial Outline (Unit: 100M of JPY) FY13 Actual
Annual Report. Year Ended March 31, Automotive. Information & Communications. Electronics. Electric Wire & Cable, Energy
 Annual Report 212 Information & Communications Automotive Year Ended March 31, 212 Electronics Electric Wire & Cable, Energy Industrial Materials & Others The Origin of the Sumitomo Electric Group The
PERFORMANCE. 48 Financial
 PERFORMANCE 48 Financial 48 Segment Information 5 Financial and Non-Financial Highlights 52 1-Year Financial Data 54 Operating and Financial Review 6 Consolidated Statement of Financial Position 62 Consolidated
Consolidated Financial Results for the Fiscal Year Ended March 31, 2018 [Japanese GAAP]
![Consolidated Financial Results for the Fiscal Year Ended March 31, 2018 [Japanese GAAP]](/thumbs/87/97109926.jpg "Consolidated Financial Results for the Fiscal Year Ended March 31, 2018 [Japanese GAAP]") This is an abridged translation of the original document in Japanese and is intended for reference purposes only. In the event of any discrepancy between this translated document and the Japanese original,
This is an abridged translation of the original document in Japanese and is intended for reference purposes only. In the event of any discrepancy between this translated document and the Japanese original,
5405:JP. April 27, 2012
 5405:JP SMMLY:US 1 April 27, 2012 Forward-looking Statement This presentation contains certain forward-looking statements. The Company has tried, whenever possible, to identify these forward-looking statements
Financial Results for FY2016 and Medium-term Management Policy
 1 Financial Results for FY2016 and Medium-term Management Policy April 2017 Fujitsu General Limited Any forward-looking statement in this report speaks only as of the date on which it is made; Forward-looking
Consolidated Business Results For the Fiscal Year Ending March 31, 2012 Bando Chemical Industries, Ltd.
 Consolidated Business Results For the Fiscal Year Ending March 31, 2012 Bando Chemical Industries, Ltd. Financial Summary Fiscal Year Ending March 31, 2012 (1)Settlement of Accounts The production rates
FY2014 Earnings Presentation (Overview)
") FY2014 Earnings Presentation (Overview) FY2014 Results FY2014 (Apr. 2014 - Dec. 2014) FY2013 Adjusted Results* Difference Net Sales 411.4 339.9 71.5 Operating Income (OP margin) 40.3 (9.8%) 38.3 (11.3%)
FY2014 Earnings Presentation (Overview) FY2014 Results FY2014 (Apr. 2014 - Dec. 2014) FY2013 Adjusted Results* Difference Net Sales 411.4 339.9 71.5 Operating Income (OP margin) 40.3 (9.8%) 38.3 (11.3%)
Hitachi Metals Financial Results for the First Half Ended September 30, 2015 Operating Results Forecast for the Year Ending March 31, 2016
 Hitachi Metals Financial Results for the First Half Ended September 30, 2015 Operating Results Forecast for the Year Ending March 31, 2016 October 27, 2015 Table of Contents 1 2 Overview of Operating Results
1 Oct b o er ,
 October 29, 2009 1 Forward-looking Statement This presentation contains certain forward-looking statements. The Company has tried, whenever possible, to identify these forward-looking statements using
Financial Results for 3rd Quarter of Fiscal Bridgestone Corporation November 9, 2017
 Financial Results for 3rd Quarter of Fiscal 2017 Bridgestone Corporation November 9, 2017 Contents 1. Business and Financial Performance for 3rd Quarter of Fiscal 2017 2. Consolidated Projections for Fiscal
Business Report for Q1 FY ending March 31, 2019 (April-June 2018)
") Business Report for Q1 FY ending March 31, 2019 (April-June 2018) Wacom Chapter 2 Wacom Co., Ltd. (TSE 1st Sec. Code: 6727) Q1 FY 03/19 Results Overview Consolidated net sales of JPY 17.9 bn (YOY +12%)
Business Report for Q1 FY ending March 31, 2019 (April-June 2018) Wacom Chapter 2 Wacom Co., Ltd. (TSE 1st Sec. Code: 6727) Q1 FY 03/19 Results Overview Consolidated net sales of JPY 17.9 bn (YOY +12%)
Other Notes Numbers of shares issued (Common stock) (ⅰ) Number of shares outstanding at end of period (Including treasury stock) June, ,904,35
 (ⅰ) Number of shares outstanding at end of period (Including treasury stock) June, ,904,35") Consolidated Financial Report [IFRS] For the First Quarter Ended June 30, 2018 Listed Company: Hitachi Metals, Ltd. (URL http://www.hitachi-metals.co.jp/e/index.html) Listed Stock Exchanges: Tokyo Stock
Consolidated Financial Report [IFRS] For the First Quarter Ended June 30, 2018 Listed Company: Hitachi Metals, Ltd. (URL http://www.hitachi-metals.co.jp/e/index.html) Listed Stock Exchanges: Tokyo Stock
Securities Code: 9066 December 5, 2017
 Securities Code: 966 December 5, 217 Overview of Financial Financial results for Q2 Overview of the full-year plan 96.74 billion yen Net sales Interim period ended September 3, 216 (Cumulative for the
Financial Results for the Third Quarter Ended December 31, 2012 (FY12 Q3)
") Financial Results for the Third Quarter Ended December 31, 2012 (FY12 Q3) January 30, 2013 OMRON Corporation Omron Corporation Contents 1. FY12 Q3 & Full-Year Overview P.2 2. FY12 Q3 Results & Full-Year
Financial Results for the Third Quarter Ended December 31, 2012 (FY12 Q3) January 30, 2013 OMRON Corporation Omron Corporation Contents 1. FY12 Q3 & Full-Year Overview P.2 2. FY12 Q3 Results & Full-Year
TO OUR SHAREHOLDERS NIPPON SHEET GLASS CO., LTD. 148TH FISCAL PERIOD REPORT 1 APRIL MARCH 2014
 TO OUR SHAREHOLDERS NIPPON SHEET GLASS CO., LTD. 148TH FISCAL PERIOD REPORT 1 APRIL 2013 31 MARCH 2014 MAKING A DIFFERENCE TO OUR WORLD THROUGH GLASS TECHNOLOGY Securities Code: 5202 MESSAGE FROM THE PRESIDENT
Business Results for The First Half of FY2018 (April 1, 2018 September 30, 2018) November 1, 2018
 November 1, 2018") Business Results for The First Half of FY2018 (April 1, 2018 September 30, 2018) November 1, 2018 Please be aware of the following: * The financial information provided on this material has been prepared
Business Results for The First Half of FY2018 (April 1, 2018 September 30, 2018) November 1, 2018 Please be aware of the following: * The financial information provided on this material has been prepared
FY 2014 Full-Year Financial Results April 1, March 31, 2015
 April 30, 2015 FY 2014 Full-Year Financial Results April 1, 2014 - March 31, 2015 Fujitsu Limited Press Contacts Fujitsu Limited Public and Investor Relations Division Inquiries:https://www-s.fujitsu.com/global/news/contacts/inquiries/index.html
MITSUBISHI MATERIALS CORPORATION
 MITSUBISHI MATERIALS CORPORATION Supplementary Explanation for the 3rd Quarter of the fiscal year ending March 31, 2018 February 13, 2018 1 Performance Overview (for the Nine Months) 80.0 1,050.3 1,131.9
NOTES TO CONSOLIDATED FINANCIAL STATEMENTS HITACHI CABLE, LTD. AND ITS SUBSIDIARIES For the years ended March 31, 2005 and 2004
 NOTES TO CONSOLIDATED FINANCIAL STATEMENTS HITACHI CABLE, LTD. AND ITS SUBSIDIARIES For the years ended March 31, and 2004 1. Significant Accounting Policies (a) Basis of Presenting Consolidated Financial
H Financial Results. Milan July 28th, 2016
 H1 2016 Financial Results Milan July 28th, 2016 Agenda H1 2016 Highlights o o o Group overview Results by business Outlook Financial results Appendix H1 2016 Financial Results 2 H1 2016 Highlights Organic
Konica Minolta Group 1H / March 2008 Consolidated Financial Results Six months: Apr. - Sep. 2007
 Konica Minolta Group 1H / March 28 Consolidated Financial Results Six months: Apr. - Sep. 27 November 1, 27 Yoshikatsu Ota President & CEO Konica Minolta Holdings, Inc. Cautionary Statement: The forecasts
Financial Results for 1st Half of Fiscal Bridgestone Corporation August 7, 2015
 Financial Results for 1st Half of Fiscal Bridgestone Corporation August 7, Contents 1. Business and Financial Performance for 1st Half of Fiscal P. 3 2. Consolidated for Fiscal P. 9 2 1. Business and Financial
FY2009 Financial Results
 FY29 Financial Results I. FY29 ended March 21 Financial Results II. FY21 Full Year Plan April 28, 21 TOPCON CORPORATION CFO Takayuki Ogawa Topcon Investor Relations 21 FY29 ended March 21 Financial Results
FY2018 Q1 Earnings. Financial Results for the First Quarter Ended June 30, 2018 VG2.0. July 26, 2018 OMRON Corporation
 FY2018 Q1 Earnings Financial Results for the First Quarter Ended June 30, 2018 VG2.0 July 26, 2018 OMRON Corporation Summary Q1 Results In line with plan. Achieved record high sales, gross profit and GP
FY2016 Financial Results (Ended March 20, 2017) FY2017 Financial Forecasts (Ending February 28, 2018)
 FY2017 Financial Forecasts (Ending February 28, 2018)") FY2016 Financial Results (Ended March 20, 2017) FY2017 Financial Forecasts (Ending February 28, 2018) April 20, 2017 2017 YASKAWA Electric Corporation (TSE6506) Contents 1. FY2016 Financial Results FY2016
FY2016 Financial Results (Ended March 20, 2017) FY2017 Financial Forecasts (Ending February 28, 2018) April 20, 2017 2017 YASKAWA Electric Corporation (TSE6506) Contents 1. FY2016 Financial Results FY2016
FY 2013 Financial Results
 Milan February 25 th, 2014 1 AGENDA FY 2013 Highlights Group Overview Results by business Financial Results Appendix 2 2013 Key Achievements FY targets achieved despite continuous weak economic environment
Financial Results for the Second Quarter Ended September 30, 2012 (FY12 Q2)
") Financial Results for the Second Quarter Ended September 30, 2012 (FY12 Q2) October 31, 2012 OMRON Corporation Omron Corporation Contents 1. FY12 1H (Q1-Q2) Results & Full-Year Forecast FY12 1H Results
Financial Results for the Second Quarter Ended September 30, 2012 (FY12 Q2) October 31, 2012 OMRON Corporation Omron Corporation Contents 1. FY12 1H (Q1-Q2) Results & Full-Year Forecast FY12 1H Results
MITSUBISHI MATERIALS CORPORATION
 MITSUBISHI MATERIALS CORPORATION Supplementary Explanation for the 3rd Quarter of the fiscal year ending March 31, 2019 February 12, 2019 1 Contents 1. Performance Overview (P. 3-4) 2. Comparison with
Preliminary Consolidated Results for 2003: Increase in profits thanks to an upturn in the 4 th quarter, in a still difficult economic climate
 Press Release Preliminary Consolidated Results for 2003: Increase in profits thanks to an upturn in the 4 th quarter, in a still difficult economic climate Paris, February 2, 2004 - The Nexans Board of
Becoming a Globally Competitive Aluminum Company. August 29, 2012
 Becoming a Globally Competitive Aluminum Company August 29, 2012 Background and Purpose of the Business Integration Difficult Operating Environment Surrounding the Companies Decline in demand for aluminum
- FY2016/3 (ended March 2016) consolidated revenue: Billion JPY (YoY +6%) (* Billion JPY hereafter referred to as B ). - Revenue breakdown by
 consolidated revenue: Billion JPY (YoY +6%) (* Billion JPY hereafter referred to as B ). - Revenue breakdown by") 1 2 - FY2016/3 (ended March 2016) consolidated revenue: 70. 3 Billion JPY (YoY +6%) (* Billion JPY hereafter referred to as B ). - Revenue breakdown by segment: SPE 41.8B (YoY +4%), Metrology 28.5B (YoY
1 2 - FY2016/3 (ended March 2016) consolidated revenue: 70. 3 Billion JPY (YoY +6%) (* Billion JPY hereafter referred to as B ). - Revenue breakdown by segment: SPE 41.8B (YoY +4%), Metrology 28.5B (YoY
Group s Results and Forecast Briefing
 Translation for Reference Only JVC KENWOODK Group s Results and Forecast Briefing Fiscal Year Ended March 212 JVC KENWOOD Corporation April 27, 212 Copyright 212 JVC KENWOOD Corporation. All rights reserved.
Flash Report Consolidated Basis Results for Fiscal 2016 (April 1, 2016 March 31, 2017) <under Japanese GAAP>
 <under Japanese GAAP>") Flash Report Consolidated Basis Results for (April 1, 2016 March 31, 2017) Company name: Nippon Steel & Sumitomo Metal Corporation Stock listing: Tokyo, Nagoya, Sapporo, Fukuoka stock
Flash Report Consolidated Basis Results for (April 1, 2016 March 31, 2017) Company name: Nippon Steel & Sumitomo Metal Corporation Stock listing: Tokyo, Nagoya, Sapporo, Fukuoka stock
1st Quarter Financial Results
 FY 2017 1st Quarter Financial Results ended June 30, 2016 1. 1st Quarter Financial Results 2. Financial Forecast for 1st Half of 3. Financial Forecast for 1-1) Overview of 1st Quarter Financial Results
The LEONI Group 1 st 3 rd Quarter The Quality Connection
 The LEONI Group 1 st 3 rd Quarter 2016 The Quality Connection Contents 1. LEONI Group overview 2. LEONI Divisions 3. Report 1 st 3 rd Quarter 2016 4. LEONI Group figures 5. Outlook 6. Appendix LEONI AG
Presentation of Consolidated Financial Results for the 1st Quarter of the FY Ended March 31, 2019 (from Apr to Jun. 2018)
") Presentation of Consolidated Financial Results for the 1st Quarter of the FY Ended March 31, 2019 (from Apr. 2018 to Jun. 2018) 1 Highlights of Consolidated Results Summary of P/L (3M) (3M) Amount % Order
Presentation of Consolidated Financial Results for the 1st Quarter of the FY Ended March 31, 2019 (from Apr. 2018 to Jun. 2018) 1 Highlights of Consolidated Results Summary of P/L (3M) (3M) Amount % Order
Financial Results for the First Quarter Ended June 30, 2013 (FY13 Q1)
") Financial Results for the First Quarter Ended June 30, 2013 (FY13 Q1) July 30, 2013 OMRON Corporation Omron Corporation Contents 1. FY13 Overview P. 3 2. FY13 Q1 Results & Full-Year Forecast FY13 Q1 Results
Financial Results for the First Quarter Ended June 30, 2013 (FY13 Q1) July 30, 2013 OMRON Corporation Omron Corporation Contents 1. FY13 Overview P. 3 2. FY13 Q1 Results & Full-Year Forecast FY13 Q1 Results
FY2012 first-half financial results
 FY2012 first-half financial results Nissan Motor Co., LTD. November 6, 2012 Key performance indicators: financial results Net revenue 4,546.8 4,367.4 Operating profit 309.7 287.0 Net income Free cash flow
Fiscal 2014 Supplementary Information May 11, 2015
 Fiscal 2014 Supplementary Information May 11, 2015 * Forward-looking statements made in this document, such as business forecasts, are based on the information available at this time and on certain premises
JSP Corporation Engineered Plastic Foams. Results of Operations for the Fiscal Year Ended March 31, 2017 (FY3/17) Information Meeting.
 Information Meeting.") Results of Operations for the Fiscal Year Ended March 31, 2017 () Information Meeting 2 2 Contents 1. Summary of Business Operations 2. FY3/18 Outlook 3. Supplementary Financial Information 4. New Plants,
Results of Operations for the Fiscal Year Ended March 31, 2017 () Information Meeting 2 2 Contents 1. Summary of Business Operations 2. FY3/18 Outlook 3. Supplementary Financial Information 4. New Plants,
Summary of Consolidated Financial Results for Third Quarter of FY2017
 Summary of Consolidated Financial Results for Third Quarter of FY Feb 2, 2018 Mitsui Chemicals, Inc. 1. Summary of Income Statement Net sales Operating income Ordinary income Profit attributable to owners
Taiyo Holdings / 4626
 COVERAGE INITIATED ON: 2017.12.08 Shared Research Inc. has produced this report by request from the company discussed in the report. The aim is to provide an owner s manual to investors. We at Shared Research
Yokogawa Electric Corporation Financial Results for 3rd Quarter of Fiscal Year 2017
 Yokogawa Electric Corporation Financial Results for 3rd Quarter of Fiscal Year 2017 February 6, 2018-0 - Contents 1. Financial Results for 3rd Quarter of Fiscal Year 2017 Junichi Anabuki Director, Senior
Notice Regarding Issuance of New Shares and Disposition of Treasury Shares, and Secondary Offering of Shares
 February 4, 2014 Company: Representative: Contact: Kobe Steel, Ltd. (Code number: 5406, The Tokyo Stock Exchange and the Nagoya Stock Exchange) Hiroya Kawasaki, President, CEO and Representative Director
SUMIDA CORPORATION. Performance Briefings. <For the Second Quarter of FY2018 ending June 30, 2018> August 1, 2018
 SUMIDA CORPORATION Performance Briefings August 1, 2018 Today s Speakers Representative Executive Officer & President Tomoharu Suseki Representative
H FINANCIAL RESULTS. Milan September 18 th, 2018
 H1 2018 FINANCIAL RESULTS Milan September 18 th, 2018 1 AGENDA H1 2018 Highlights o o o Group overview Results by business Outlook Financial results Appendix 2 H1 2018 Financial Highlights Organic sales
: Sumitomo Metal Industries, Ltd. Consolidated Financial Situation and Business Results for the Third Quarter of FY 2009 (ending March 31, 2010)
") Sumitomo Metal Industries, Ltd. Consolidated Financial Situation and Business Results for the Third Quarter of FY 2009 (ending March 31, 2010) The following information was originally prepared and published
Sumitomo Metal Industries, Ltd. Consolidated Financial Situation and Business Results for the Third Quarter of FY 2009 (ending March 31, 2010) The following information was originally prepared and published
Q Earnings Financial Results for the Second Quarter Ended September 30, October 28, 2014 OMRON Corporation
 Q2 2014 Earnings Financial Results for the Second Quarter Ended September 30, 2014 October 28, 2014 OMRON Corporation Summary H1 saw high OP with large sales increase and higher profitability. Gross profit
Sumitomo Heavy Industries, Ltd.
 Sumitomo Heavy Industries, Ltd. CONSOLIDATED FINANCIAL REPORT For the ended March 31, 2008 All financial information has been prepared in accordance with generally accepted accounting principles in Japan.
FY 2017 FINANCIAL RESULTS. Milan February 27 th, 2018
 FY 2017 FINANCIAL RESULTS Milan February 27 th, 2018 1 AGENDA FY 2017 Highlights o o Group overview Results by business Financial results Appendix 2 Key Achievements of 2017 General Cable Acquisition Leadership
Flash Report Consolidated Basis Results for the First Half of Fiscal 2017 (April 1, 2017 September 30, 2017) <under Japanese GAAP>
 <under Japanese GAAP>") Flash Report Consolidated Basis Results for the First Half of Fiscal 2017 (April 1, 2017 September 30, 2017) Company name: Nippon Steel & Sumitomo Metal Corporation Stock listing:
Flash Report Consolidated Basis Results for the First Half of Fiscal 2017 (April 1, 2017 September 30, 2017) Company name: Nippon Steel & Sumitomo Metal Corporation Stock listing:
Supplementary Financial Information for First Quarter of Fiscal 2018
 Supplementary Financial Information for First Quarter of Fiscal 2018 Kobe Steel, Ltd. August 1, 2018 The portions of this material referring to forecasts are based on currently available information as