MACQUARIE INTERNATIONAL INFRASTRUCTURE FUND LIMITED ANALYST PACK APRIL 2008
|
|
|
- Aubrey Boone
- 5 years ago
- Views:
Transcription


1 MACQUARIE INTERNATIONAL INFRASTRUCTURE FUND LIMITED ANALYST PACK APRIL 2008
 Pty Limited (MIMAL) is the manager of MIIF.")
2 disclaimer This information package which includes the analyst model and other information (the Analyst Pack or Pack) has been prepared by Macquarie International Infrastructure Fund Limited (MIIF), which is a Bermudian registered mutual fund company listed on the Singapore Exchange Securities Trading Limited. Macquarie Infrastructure Management (Asia) Pty Limited (MIMAL) is the manager of MIIF. MIMAL is a wholly owned subsidiary of Macquarie Capital Group Limited (MCGL). The Analyst Pack has been prepared in good faith to assist analysts in the development of their own models. The Analyst Pack does not purport to forecast the asset value, income or distributions of MIIF or its subsidiaries or related companies, nor the value, income or distributions of any other entity. None of MIIF, MIMAL nor any entity in MCGL shall be in any way responsible or have any liability in respect of the accuracy of any statement or calculation within the Analyst Pack. Any assumptions or forecasts contained in the Analyst Pack are intended as a guide to analysts only. They do not represent forecasts or statements of certainty of MIIF, MIMAL, MCGL or any other party and are not intended to be a representation that the assumptions will or are likely to occur or that the assumptions are reasonable, reliable or accurate. The recipient should do their own research and form their own judgment in relation to any assumptions, forecasts, or estimates contained in the Analyst Pack and not rely on any information in the Analyst Pack as being either absolute or the likely outcome. The Analyst Pack does not purport to list the assumptions or risks which may infl uence the valuation of MIIF. Any information with respect to tax treatment is provided without warranty and for information only. The recipient should seek professional advice in respect of any taxation assumptions required to analyse MIIF. MIIF does not guarantee that the information provided is up to date, or accept any obligation to correct or update any information contained in the Analyst Pack or to inform the recipient that the Analyst Pack is no longer accurate or up to date whether as a result of new information becoming available or otherwise. The Analyst Pack remains the property of MIIF and may not be reproduced in part or whole without express written permission from MIIF. None of the entities noted in this document is an authorised deposit-taking institution for the purposes of the Banking Act 1959 (Commonwealth of Australia). The obligations of these entities do not represent deposits or other liabilities of Macquarie Bank Limited ABN (MBL). MBL does not guarantee or otherwise provide assurance in respect of the obligations of these entities. Investments in MIIF are subject to investment risk, including possible delays in repayment and loss of income and capital invested. None of MIIF, MIMAL nor any entity in MCGL guarantees any particular rate of return on MIIF shares or the performance of MIIF, nor do they guarantee the repayment of capital from MIIF. The Analyst Pack does not constitute an offer or invitation for subscription or purchase of shares of MIIF and it is not recommending or soliciting offers to buy shares of MIIF. The Analyst Pack does not take into account the investment objectives, fi nancial situation and particular needs of any potential investor nor does it address or attempt to quantify any of the risks associated with MIIF s business or an investment in the shares of MIIF. Before making an investment in MIIF, the prospective investor should consider whether such an investment is appropriate to their particular investment needs, objectives and fi nancial circumstances and consult an investment adviser if necessary. Information, including forecast fi nancial information, in this Analyst Pack should not be considered as a recommendation in relation to holding, purchasing or selling shares, securities or other instruments in MIIF. Due care and attention has been used in the preparation of forecast information. However, actual results may vary from forecasts and any variation may be materially positive or negative. Forecasts by their very nature are subject to uncertainty and contingencies, many of which are outside the control of MIIF. Past performance is not a reliable indication of future performance.


3 ANALYST PACK Welcome to the 2008 Macquarie International Infrastructure Fund Limited (MIIF) Analyst Pack (Analyst Pack or Pack). This Pack is primarily designed to assist institutional and professional investors and analysts to understand the MIIF business and its investments. The Pack includes a set of background notes on MIIF, on each of the assets within its portfolio and an Analyst Model (the Model) that outlines a possible format for valuing MIIF. The Model does not purport to forecast the asset value, income or distributions of MIIF, nor the value, income or distributions of any other entity. Any assumptions contained within the Pack are intended to be a guide only and do not represent the forecasts of MIIF, Macquarie Infrastructure Management (Asia) Pty Limited (MIMAL or the Manager) or any entity in the Macquarie Capital Group Limited (MCGL) or any other entity. MCGL does not represent that the forecasts will be achieved, the assumptions will occur or that the assumptions are reasonable, reliable or accurate. All fi gures unless stated otherwise, are presented in Singapore dollars, which is MIIF's functional and presentation currency.


4


5 Table of Contents Background... 1 Recent Key Events... 2 Asset Portfolio... 5 Diversifi ed Portfolio... 7 Management... 8 Investment Strategy Shares on Issue Dividends Fees Group Structure Valuation Policy Arqiva National Grid Wireless Canadian Aged Care Changshu Xinghua Port Hua Nan Expressway infravest Wind Power Taiwan Broadband Communications MEIF Overview of the Analyst Model Corporate Information MACQUARIE INTERNATIONAL INFRASTRUCTURE FUND LIMITED ANALYST PACK 5


6
7 Macquarie International Infrastructure Fund Limited BACKGROUND MIIF, a Bermudian mutual fund company, is today a leading Asia-based private owner and operator of infrastructure assets with signifi cant investments in toll roads, airports, renewable energy, communications infrastructure, broadcast infrastructure, transportation infrastructure and aged care infrastructure assets, among others. MIIF was the fi rst infrastructure fund to list on the main board of the Singapore Exchange Securities Trading Limited (SGX-ST). It listed on the SGX-ST on 27 May 2005 and is today a top 100 SGX company with a market capitalisation as at 31 December 2007 of approximately S$1.3 billion and over 6,300 investors, including retail investors and some of the world s foremost institutional investors. MIIF is managed by MIMAL, a subsidiary of Macquarie Capital Funds which, through special purpose management companies, has over A$56 billion (S$70 billion) of equity under management as at 31 December MIIF is the fl agship Asian listed infrastructure fund of MCGL. MIIF benefi ts from Macquarie s infrastructure expertise in sourcing new investment opportunities and acquiring infrastructure assets in diversifi ed sectors with a focus on Asia. MACQUARIE INTERNATIONAL INFRASTRUCTURE FUND LIMITED ANALYST PACK 1
8 RECENT KEY EVENTS 20 March 2008 Acquisition of infravest Wind Power, an operating wind farm in Taiwan MIIF s equity commitment was NT$597.9 million (S$27.9 million), including transaction costs, for an effective interest of 100.0% 14 March 2008 MIIF unwound total return swap (TRS) and sold its interest in Macquarie Airports (MAp) Total consideration of A$120.0 million (S$154.2 million) for MIIF s 35,470,000 securities in MAp 19 November 2007 Acquisition of Hua Nan Expressway in China MIIF s equity commitment for an effective interest of 81% was RMB1,513 million (S$295.7 million) 1, including transaction costs 16 November 2007 Divestment of 100% interest in TanQuid Total consideration of 88.0 million (S$187.3 million) 14 November 2007 Divestment of 3.2% interest in Brussels Airport Total consideration of 50.9 million (S$107.9 million) 16 August 2007 Completion of Taiwan Broadband Communications (TBC) refi nancing MIIF received total proceeds of US$68.3 million (S$104.1 million) from the refi nancing, which was treated as a return of capital 27 July 2007 MIIF unwound TRS and sold its interest in Macquarie Communications Infrastructure Group (MCG) Total consideration of A$112.6 million (S$147.2 million) for MIIF's 18,780,000 securities in MCG 16 July 2007 MIIF acquired TBC MIIF acquired a 20% economic interest in TBC from Och-Ziff Capital Management Group for US$175.5 million (S$265.9 million), including transaction costs 1 Originally announced acquisition price of S$329.5 million comprised of S$295.7 million invested at acquisition, and S$33.8 million of acquisition adjustments contingent upon certain events and is yet to be paid
 for MIIF s 17,592,000 securities in DUET 2 July 2007 MIIF unwound TRS and sold its interest in Macquarie Infrastructure Company (MIC) Total consideration of US$24.6 million (S$37.")
9 4 July 2007 MIIF unwound TRS and sold its interest in DUET Group (DUET) Total consideration of A$65.1 million (S$85.2 million) for MIIF s 17,592,000 securities in DUET 2 July 2007 MIIF unwound TRS and sold its interest in Macquarie Infrastructure Company (MIC) Total consideration of US$24.6 million (S$37.4 million) for MIIF s 599,000 securities in MIC 4 April 2007 Arqiva acquired 100% of National Grid Wireless (NGW) Total consideration of 2.5 billion (S$7.5 billion) MIIF participated in the Arqiva rights issue for 87 million (S$259.1 million) 22 January 2007 MIIF divested 50% interest in Novera Macquarie Renewable Energy (NMRE) Total consideration of 29.9 million (S$90.8 million) MACQUARIE INTERNATIONAL INFRASTRUCTURE FUND LIMITED ANALYST PACK 2 3


10
11 ASSET PORTFOLIO Unlisted Direct Investments INVESTMENT VEHICLE UNDERLYING ASSET ASSET LOCATION MIIF ECONOMIC INTEREST IN ASSET 8.7% MACQUARIE-MANAGED FUNDS' ECONOMIC INTEREST IN ASSET 75.8% Arqiva Communications infrastructure United Kingdom INVESTMENT VEHICLE UNDERLYING ASSET ASSET LOCATION MIIF ECONOMIC INTEREST IN ASSET MACQUARIE-MANAGED FUNDS' ECONOMIC INTEREST IN ASSET 100.0% Canadian Aged Care (CAC) Aged care infrastructure Canada 55.0% by way of TRS INVESTMENT VEHICLE Changshu Xinghua Port (CXP) UNDERLYING ASSET Port ASSET LOCATION China MIIF ECONOMIC INTEREST IN ASSET 38.0% MACQUARIE-MANAGED FUNDS' ECONOMIC INTEREST IN ASSET 38.0% INVESTMENT VEHICLE Hua Nan Expressway (HNE) UNDERLYING ASSET Toll road ASSET LOCATION China MIIF ECONOMIC INTEREST IN ASSET 81.0% MACQUARIE-MANAGED FUNDS' ECONOMIC INTEREST IN ASSET 81.0% INVESTMENT VEHICLE infravest Wind Power (infravest) UNDERLYING ASSET Renewable energy ASSET LOCATION Taiwan MIIF ECONOMIC INTEREST IN ASSET 100.0% MACQUARIE-MANAGED FUNDS' ECONOMIC INTEREST IN ASSET 100.0% INVESTMENT VEHICLE Taiwan Broadband Communications (TBC) UNDERLYING ASSET Communications infrastructure ASSET LOCATION Taiwan MIIF ECONOMIC INTEREST IN ASSET 20.0% MACQUARIE-MANAGED FUNDS' ECONOMIC INTEREST IN ASSET 80.0% Unlisted Fund Investment INVESTMENT VEHICLE UNDERLYING ASSETS ASSET LOCATION MIIF ECONOMIC INTEREST IN ASSET 6.3% MACQUARIE-MANAGED FUNDS' ECONOMIC INTEREST IN ASSET 24.5% Macquarie European Infrastructure Fund (MEIF) Diversifi ed infrastructure portfolio Developed European countries MACQUARIE INTERNATIONAL INFRASTRUCTURE FUND LIMITED ANALYST PACK 4 5


12
13 DIVERSIFIED PORTFOLIO 2 MIIF s investment portfolio is diversifi ed by sector and country. As at 31 March Portfolio Composition by Asset Hua Nan Expressway 18.3% CXP 7.0% InfraVest 1.7% MEIF 21.7% TBC 10.3% CAC 9.1% Arqiva + NGW 31.8% Portfolio Diversifi cation by Country Taiwan 12.0% Netherlands 0.5% China 25.4% UK 44.5% France 5.8% Sweden 1.3% Portfolio Diversifi cation by Sector Aged Care 9.1% Transport 26.5% Belgium 1.4% Renewable Energy 2.3% Ports 7.0% Canada 9.1% Utilities & Energy 8.8% Airports & Airport Services 4.2% Communications Infrastructure 42.1% MACQUARIE INTERNATIONAL INFRASTRUCTURE FUND LIMITED ANALYST PACK 2 Numbers are subject to rounding. 3 Based on 31 December 2007 valuations including the acquisition of infravest at cost. The disposal of MAp has been completed and has been excluded. 6 7
14 MANAGEMENT MIIF has appointed MIMAL as its sole and exclusive manager pursuant to a management agreement dated 19 May 2005 (Management Agreement). MIMAL was incorporated in Australia under the Corporations Act 2001 on 3 February 2005 and its current share capital is A$35,050,002. Its registered offi ce and principal place of business is Level 11, No.1 Martin Place, Sydney, New South Wales 2000, Australia. The MIMAL Singapore branch is located on level 11, 23 Church Street, Capital Square, Singapore MIMAL is a member of MCGL. MCGL is one of the global leaders in advising on the acquisition, disposal and fi nancing of infrastructure assets and the management of infrastructure investment vehicles and infrastructure assets on behalf of third-party investors. MIMAL is part of Macquarie Capital Funds which, through special purpose management companies, has over A$56 billion (S$70 billion) of equity under management. On behalf of retail and institutional investors Macquarie Capital Funds invests in infrastructure assets and businesses, including toll roads, airports and airport-related infrastructure, communications infrastructure, electricity and gas transmission and distribution networks, water utilities and rail. Macquarie Capital Funds has operated since 1996 and employs over 630 professionals. 4 MIMAL is licensed by the Australian Securities & Investments Commission as an Australian Financial Services Licensee to provide certain fi nancial services, including giving fi nancial product advice and dealing in investments. The Singapore branch of MIMAL is also licensed by the Monetary Authority of Singapore as a holder of a Capital Markets Services Licence to conduct the regulated activity of fund management in Singapore. MIMAL s resources are drawn from MCGL through a resources agreement dated 10 February 2005 between MIMAL and Macquarie Funds Management Holdings Pty Limited (MFMH). These resources include the non-exclusive use of personnel employed by MCGL primarily within Macquarie Capital Funds. Personnel and resources have also been provided by MFMH on a non-exclusive basis to other Macquarie Capital Funds under similar resources agreements. 4 As at 31 December 2007.


15 MACQUARIE INTERNATIONAL INFRASTRUCTURE FUND LIMITED ANALYST PACK 8 9


16
17 INVESTMENT STRATEGY MIIF s strategy is to invest in and acquire infrastructure assets that deliver an attractive and sustainable level of returns in the form of dividends, distributions and other cash fl ows in addition to the potential for capital growth. MIIF intends to make long-term investments in long-term assets with a long-term horizon and does not expect to actively trade the assets within its portfolio. Where MIIF acquires majority or substantial interests in an asset and can exert control over the business, it intends to pursue revenue growth and margin improvements as well as to optimise fi nancing structures. MIIF will also target investments in which it will acquire minority positions and where its partners have similar objectives to its own. Investment Criteria MIIF targets investments in a broad range of infrastructure sectors, seeking relatively lowrisk assets that exhibit some or all of the following characteristics: Provision of essential services to the community; Strategic competitive advantage due to high barriers to entry; Dominant market position; Sustainable and predictable cash fl ows over the long term; Potential for long-term capital growth; Experienced and capable operational management team; Long-term supply agreements or revenues that are governed by regulatory regimes; and Potential to increase returns to equity by capital structure optimisation. SHARES ON ISSUE Issue of Shares Initial Public Offering 27 May 2005 Over Allotment Option post IPO 7 June 2005 Number of Shares on Issue (000 s) Cumulative (000 s) Price (S$) 730, , , , Manager Performance Fee 23, , August Institutional/Retail Placement and Offer 17 November , ,279, Manager Performance Fee 2, ,282, August MIMAL opted to invest all of the performance fee in MIIF shares. MACQUARIE INTERNATIONAL INFRASTRUCTURE FUND LIMITED ANALYST PACK 10 11


18
19 DIVIDENDS Dividend Policy MIIF s dividend policy is based on the anticipated and stable cash fl ows from its investments. It is intended that all free recurring operating cash available for distribution subject to prudent reserves will be paid out by MIIF semi-annually as dividends. Payments The following table shows the dividends paid by MIIF since its IPO: Period ending Distribution per share H cents (paid 9 September 2005) H cents (paid 29 March 2006) H cents (paid 13 September 2006) H cents (paid 30 March 2007) H cents (paid 14 September 2007) H cents (payable on 5 May 2008) MIIF Dividends Jun Dec Jun Dec-06 Tax Implications 30-Jun Dec-07 As MIIF is incorporated in Bermuda and is not a resident in Singapore for tax purposes, dividends paid by MIIF are regarded as foreign-source income in Singapore. The foreign dividend is subject to Singapore corporate income tax when received in Singapore by corporate shareholders. Foreign dividends received by foreign investors with no permanent establishment in Singapore are generally not subject to Singapore income tax. Foreign dividends received by individuals in Singapore (whether resident or otherwise) are exempt from Singapore income tax. Note: All shareholders are advised to obtain their own professional tax advice in relation to the dividends paid by MIIF. MACQUARIE INTERNATIONAL INFRASTRUCTURE FUND LIMITED ANALYST PACK 12 13
20 FEES Management Agreement Under the terms of the Management Agreement, MIIF compensates MIMAL for managing its investments through base fees and performance fees. These fees are calculated for each quarter ending on 31 March, 30 June, 30 September and 31 December of each year. Base Fee The base fee is calculated on the following basis: 1.5% per annum of MIIF s Net Investment Value 6 ; and Payable quarterly in arrears. Fee Rebates (No Double Counting) Where a member of MCGL is entitled to be paid a base management fee for the management of any investment held by MIIF, the base fee payable by MIIF shall be reduced by MIIF s share of the actual base management fee payable to that member of MCGL in relation to the management of that investment. This is based on MIIF s percentage holding in the investment, provided that the base fee payable to MIMAL relating to that investment shall not be reduced to an amount less than zero. MEIF is the only remaining investment in MIIF's portfolio on which MIIF pays a management fee to MCGL. Base Fee Examples The following examples are for illustrative purposes and do not refl ect MIIF s position at a particular time. Base Fee Period 1 Base Fee Period 2 (A) Average market capitalisation over the last 15 SGX-ST trading days of the quarter $1,190,109,000 $1,202,906,000 (B) External borrowings at the end of the quarter $0 $150,000,000 (C) Cash or cash equivalents at the end of the quarter (D) Firm commitments to invest in future investments at the end of the quarter (E) MIIF % holding in an investment managed by a MCGL entity at the end of the quarter (F) Base management fee paid or payable by an investment of MIIF to a MCGL entity for the quarter $50,000,000 $85,000,000 $115,000,000 $0 25% 25% $1,000,000 $1,000,000 Number of days in the quarter Base Fee Period 1 Net investment value at the end of the quarter: = A + B C + D = $1,190,109,000 + $0 $50,000,000 + $115,000,000 = $1,255,109,000 Base Fee Period 2 Net investment value at the end of the quarter: = A + B C + D = $1,202,906,000 + $150,000,000 $85,000,000 + $0 = $1,267,906,000 Base fee for the quarter: = (Net investment value 1.5% 91/365) (E F) = ($1,255,109, % 91/365) (25% $1,000,000) = $4,443,764 Base fee for the quarter: = (Net investment value 1.5% 92/365) (E F) = ($1,267,906, % 92/365) (25% $1,000,000) = $4,543,727 6 Net investment value is the average market capitalisation over the last 15 SGX-ST trading days of the quarter; plus the external borrowings at the end of the quarter; less the cash or cash equivalents at the end of the quarter; plus fi rm commitments to invest in future investments at the end of the quarter.


21 MACQUARIE INTERNATIONAL INFRASTRUCTURE FUND LIMITED ANALYST PACK
22 Performance Fee The performance fee is calculated quarterly on the following basis: If the return on the shares for a quarter (including reinvestment of all dividends) is greater than zero and exceeds the benchmark return, the performance fee is equal to 20% of the return above the benchmark return for the quarter. If the return is less than the benchmark return in any quarter, the amount of the defi cit is carried forward; i.e. Performance fee = 20% (return benchmark return deficit brought forward); Payable quarterly in arrears; and The performance fee is payable to the Manager in cash. MIMAL may apply to invest all or a portion of the performance fee in MIIF shares. The Return The return is the average market capitalisation of MIIF over the last 15 SGX-ST trading days of the previous quarter (excluding the market capitalisation of additional shares issued during the last 15 SGX-ST trading days of the previous quarter) multiplied by the movement in the accumulation index for the shares over the relevant quarter expressed as a fraction. This is based on the average daily closing value of this index over the last 15 SGX-ST trading days of the quarter compared with the average daily closing value of this index over the last 15 SGX-ST trading days of the previous quarter. In the case of the fi rst quarter, the initial accumulation index fi gure ascribed to the shares on the listing date before the fi rst trade was used as a base for comparison. The Benchmark Return The benchmark return is the average market capitalisation of MIIF over the last 15 SGX-ST trading days of the previous quarter (excluding the market capitalisation of additional shares issued during the last 15 SGX-ST trading days of the previous quarter) multiplied by an annualised return of 8% per annum. The Defi cit The defi cit is the aggregate amount in respect of each quarter since a performance fee has become due and payable, not including the quarter in respect of which a calculation is being made, by which the benchmark return for each such quarter exceeds the return for that quarter (if any). The Accumulation Index The accumulation index measures the performance of MIIF over a period. It is calculated by an appropriately-qualifi ed independent party as the accumulated total return on the shares, including reinvestment of all distributions, from the date of listing of MIIF. The following graph shows the accumulation index of MIIF since IPO. 140% 120% 100% 80% 60% 40% May 05 Jun 05 Jul 05 Aug 05 Sep 05 Oct 05 Nov 05 Dec 05 Jan 06 Feb 06 Mar 06 Apr 06 May 06 Jun 06 Jul 06 Aug 06 Sep 06 Oct 06 Nov 06 Dec 06 Jan 07 Feb 07 Mar 07 Apr 07 May 07 Jun 07 Jul 07 Aug 07 Sep 07 Oct 07 Nov 07 Dec 07


23 MACQUARIE INTERNATIONAL INFRASTRUCTURE FUND LIMITED ANALYST PACK
24 Performance Fee Examples Set out below are examples of calculations of performance fee payable to MIMAL by MIIF. Performance Period Period 1 Period 2 Period 3 Period 4 (A) (C) (B) (Y) Average market capitalisation of MIIF over the last 15 SGX-ST trading days of the previous quarter Average closing accumulation index for the shares over the last 15 SGX-ST trading days of the previous quarter Average closing accumulation index for the shares over the last 15 SGX-ST trading days of the current quarter Benchmark rate of return for the quarter (1.08^(days in quarter/365) 1) $710,775,000 $710,775,000 $710,775,000 $710,775, % % % % (A2) Additional shares issued multiplied by issue price (27 days remaining in the quarter from date of issue) (C2) Accumulation index value ascribed to the shares based on their issue price (B2) Average closing accumulation index for the shares over the last 15 SGX-ST trading days of the current quarter (Y2) Benchmark rate of return for the additional shares (1.08^(27/365) 1) $100,000, % (D) Defi cit carried forward from the previous quarter $0 $6,954,116 $0
 = $89,158 Deficit carried forward into next quarter: = $0 As the return for the quarter is greater than zero")
25 Performance Period 1 Return for the quarter: = A (B C)/C = $710,775,000 ( )/1.00 = $14,215,500 Benchmark return for the quarter: = A Y = $710,775, % = $13,769,710 Performance fee for the quarter: = 20% ($14,215,500 $13,769,710) = $89,158 Deficit carried forward into next quarter: = $0 As the return for the quarter is greater than zero and greater than the benchmark return for the quarter, a performance fee is payable in respect of the quarter of $89,158. Performance Period 3 Return for the quarter: = A (B C)/C = $710,775,000 ( )/1.03 = $48,305,097 Benchmark return for the quarter: = A Y = $710,775, % = $13,769,710 Performance fee for the quarter: = 20% ($48,305,097 $13,769,710 $6,954,116) = $5,516,254 Deficit carried forward into next quarter: = $0 As the return for the quarter is greater than zero and greater than the benchmark return for the quarter and the defi cit carried forward, a performance fee is payable in respect of the quarter of $5,516,254. Performance Period 2 Return for the quarter: = A (B C)/C = $710,775,000 ( )/1.02 = $6,968,382 Benchmark return for the quarter: = A Y = $710,775, % = $13,922,498 Performance fee for the quarter: = 20% ($6,968,382 $13,922,498) = $0 Deficit carried forward into next quarter: = $13,922,498 $6,968,382 = $6,954,116 As the return is less than the benchmark return for the quarter, a performance fee is not payable in respect of the quarter and the defi cit of $6,954,116 is carried forward to the next quarter. Performance Period 4 Return for the quarter: = (A (B C)/C) + (A2 (B2 C2)/C2) = ($710,775,000 ( )/1.10) + ($100,000,000 ( )/1.13) = $32,307,954 + $1,769,912 = $34,077,866 Benchmark return for the quarter: = (A Y) + (A2 Y2) = ($710,775, %) + ($100,000, %) = $14,493,422 Performance fee for the quarter: = 20% ($34,077,867 $14,493,422) = $3,916,889 The return (including the return on the additional shares) is greater than zero and greater than the benchmark return (including the benchmark return on the additional shares) for this quarter. As a result, a performance fee is payable in respect of the quarter of $3,916,889. MACQUARIE INTERNATIONAL INFRASTRUCTURE FUND LIMITED ANALYST PACK 18 19


26
27 GROUP STRUCTURE * MIIF s interest in Canadian Aged Care is held through a total return swap arrangement. MACQUARIE INTERNATIONAL INFRASTRUCTURE FUND LIMITED ANALYST PACK 20 21


28
29 VALUATION POLICY MIIF and its wholly owned subsidiaries (the Group) have adopted International Financial Reporting Standards (IFRS) as a basis for preparation of its fi nancial statements. The preparation of fi nancial statements in conformity with IFRS requires the use of accounting estimates. It also requires management to exercise judgement when applying the Group s accounting policies. The Group s investments are classifi ed as fi nancial assets. In accordance with the applicable IFRS, these fi nancial assets are held at fair value, with changes in the fair values of these assets refl ected as revaluation income in the income statement in the period in which they arise. The value of those fi nancial assets that are unlisted, or whose prices are not publicly quoted, is determined by the Manager using established valuation techniques. The Manager utilises a variety of these established valuation techniques and makes assumptions that are based on market conditions at each balance sheet date that form the basis of these valuations. The established valuation techniques adopted by the Manager will be based on one or more of the following valuation methods: Discounted cash fl ows; Capitalisation of earnings analysis, such as EBITDA multiple analysis; Valuation of similar investments; Reference to recent sales transactions of the same or similar securities; and Other methods as determined by the Manager. The Manager calculates the fair value of each asset at the end of each calendar quarter and adjusts the carrying value of each investment to match the valuation generated by the Manager. This process of marking to market the value of the Group s investments generates revaluation gains and losses, reported as revaluation income or expense. The updated asset valuations feed into the balance sheet of the Group at each calendar quarter end and are reported to the SGX in accordance with the SGX listing rules. This is included in the same report as the quarterly net asset value per share disclosure amongst other items. The half year and full year updated asset valuations generated by the Manager are subjected to review and endorsement by MIIF s independent auditors, the MIIF Audit and Risk Committee and the MIIF board. MACQUARIE INTERNATIONAL INFRASTRUCTURE FUND LIMITED ANALYST PACK 22 23


30
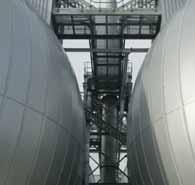
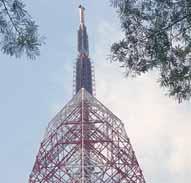
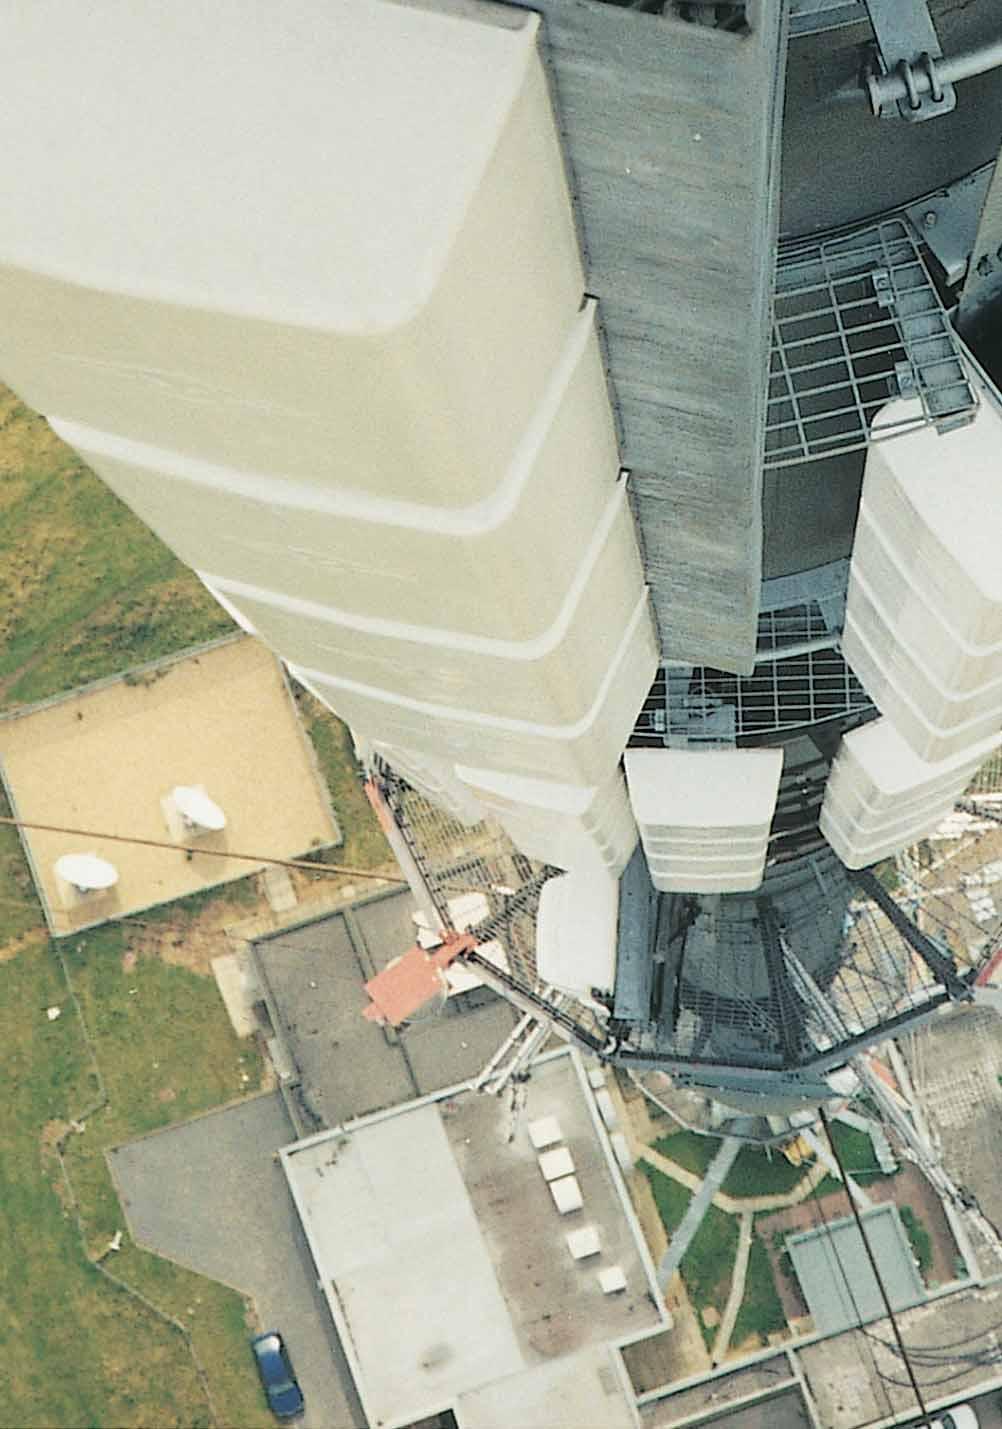
31 Arqiva ASSET NAME LOCATION EQUITY INVESTMENT MIIF'S INTEREST Arqiva UK S$175.7 million 8.7% interest Asset Overview Arqiva is one of only two TV broadcast transmission operators in the UK (National Grid Wireless (NGW) being the other, refer to page 35) and is a leading independent wireless site leasing provider in the UK. Arqiva provides transmission services to TV and radio broadcasters, site leasing to mobile phone and other wireless telecommunication companies and radio services to police, fi re and ambulance services. In April 2007, Arqiva announced the acquisition of NGW for a consideration of 2.5 billion. The acquisition has been under review by the UK competition authorities, who have required Arqiva and NGW to be held as two separate businesses. During the review process, NGW has been operating as a discrete entity, with separate management teams and customer contracts. On 8 August 2007 the Offi ce of Fair Trading referred the acquisition of NGW to the UK Competition Commission (Commission). On 11 March 2008, Arqiva announced that the Commission had conditionally approved the integration of Arqiva and NGW, subject to the agreement of suitable behavioural undertakings. The undertakings concern broadcast customers of the merged entity and comprise a package of measures ensuring ongoing high levels of customer service, price reductions for customers and the institution of an independent adjudicator to resolve disputes and oversee auditing of the Digital Switch Over (DSO). The Commission retains the option to require divestment if the undertakings cannot be agreed and completed. MACQUARIE INTERNATIONAL INFRASTRUCTURE FUND LIMITED ANALYST PACK 24 25
32 Ownership Structure MIIF has an 8.7% direct interest in Arqiva. Macquarie-managed funds' economic interest in Arqiva is 75.8%. Financing Structure MIIF s investment in Arqiva of S$175.7 million was made through a series of interposing entities including Macquarie UK Broadcast Holdings Ltd (MUKBHL), Macquarie UK Broadcast Services Plc (MUKBSL) and Macquarie UK Broadcast Limited (MUKBL). This investment is split 50:50 between ordinary shares and loan notes. These loan notes were issued by MUKBSL in January 2005 for million (MIIF s share of 27.5 million). Interest is paid at a fi xed rate of 13% pa, payable semi-annually in arrears on 30 June and 31 December. The notes are unsecured and subordinated to the senior and junior debt fi nance of MUKBL. A refi nancing of Arqiva was undertaken simultaneously with acquisition funding for the NGW transaction in order to capitalise upon the strength and quality of the merged business and achieve an optimal capital structure. MUKBL has 2,150 million in senior term loan facilities and a junior term loan facility of 475 million, both of which are fully drawn. The lenders require that MUKBL maintain interest rate hedging such that no less than 75% of the interest rate liabilities are hedged. At the level of MUKBL, there is a 75 million revolving credit facility for working capital and general corporate requirements (currently undrawn) and a 700 million capital expenditure facility for the purpose of funding expansion-related capital expenditure (currently partially drawn). The facilities mature in July 2014.
33 Asset Location Arqiva has its headquarters in Hampshire, with other major UK offi ces in London, Buckinghamshire and Yorkshire. It now has ten international satellite teleports, over 60 other manned locations and around 3,500 wireless sites throughout the UK and Ireland including masts, towers and rooftops from under 30 metres to over 300 metres tall. Asset Snapshot POPULATION SERVED SITES OPERATING DIVISIONS Business Description 98.5% of UK population 550 broadcast towers 3,500 wireless sites 10 teleports Terrestrial/Mobile Media Solutions Satellite Media Solutions Wireless Solutions Public Safety Arqiva has four primary operating divisions: Terrestrial/Mobile Media Solutions, Satellite Media Solutions, Wireless Solutions and Public Safety. Terrestrial/Mobile Media Solutions Terrestrial/Mobile Media Solutions provides national transmission for UK commercial television including ITV, Channel 4, Five and associated digital multiplexes, playing a leading role in the run up to DSO. Transmission services are also provided to the majority of UK independent radio stations, both analogue and digital. The UK Government s timetable anticipates the switch over from analogue to digital starting in 2008 to be completed by Antenna work has been completed in part in the Border region, which will be the fi rst to switch, and the construction of a replacement 337-metre mast at Caldbeck is well advanced. In most instances, existing structures are able to take the new antenna systems, with mast-strengthening modifi cations in certain cases. MACQUARIE INTERNATIONAL INFRASTRUCTURE FUND LIMITED ANALYST PACK 26 27

34 Mobile Media Solutions is a new division dedicated to the delivery of content to handheld devices. Arqiva remains platform neutral, while recent technology developments open up new service concepts and revenue streams for broadcasters, content providers and mobile operators alike. Satellite Media Solutions Satellite Media Solutions provide high quality and fl exible solutions to a diverse range of international customers. Arqiva s satellite broadcasting order book stands at over 500 million, and the business continues to perform well. Among the year s successes were the Freesat contract (ITV/BBC joint venture for free-to-air satellite TV), a long-term transponder agreement with Setanta Sports for UK direct-to-home delivery and the successful integration of the recently-acquired BT Satellite Broadcast Services (SBS) business. The acquisition of the BT SBS business provides the division with a sizeable presence in France and in the US to complement the existing products and services in the UK. Wireless Solutions Arqiva s Wireless Solutions division provides market-leading, multi-operator infrastructure systems and services to wireless telecoms, transport and interior public space businesses. This is done through a portfolio of over 3,500 towers, masts and managed sites, plus InBuilding (indoor coverage) and CityCell (urban coverage) products. Recent highlights include an agreement to provide 2G/3G/Wi-Fi coverage at 15 Glasgow subway stations and the acquisition of 18,000 potential urban radio sites from Macropolitan.
35 Public Safety Arqiva s Public Safety division provides frontline communications for the UK emergency services, government agencies and commercial organisations including design and installation, system maintenance and fully managed services for mobile radio, telecommunications and mobile data solutions. Key initiatives for the division during the year have included the winning of the 412/422 MHz spectrum, the successful deployment of mobile data trials for several police forces and the winning of a seven-year contract with Travel West Midlands for voice and data network infrastructure. The Metropolitan Police contract remains in place and Arqiva continues to play a leading role in helping police forces migrate to digital communications. Regulation in the EU A new regulatory framework in the EU (NRF) was adopted in February 2002 which set out the framework for electronic communications. It applies to all transmission infrastructures, including those operated by Arqiva. The NRF established a new approach for deciding whether regulatory obligations are to be imposed in relation to situations where there is no effective competition. The approach requires regulators to identify markets where competition is not effective and to designate which operators are considered to have signifi cant market power in those markets. Regulation in the UK The UK regulatory authority for the entire communications sector is the Offi ce of Communications (Ofcom). Ofcom has responsibilities across television, radio, telecommunications and wireless communications services. Wireless Telegraphy Act 1949/2006 This Act provides the frequency licences for NGW and Arqiva, including: analogue, digital and radio broadcasting transmission rights; fi xed point-to-point links frequency licences for analogue, digital and radio broadcast relay and distribution services; and spectrum allocation for Digital Terrestrial Television (DTT) multiplex licences. Broadcasting Acts 1990 and 1996 The Acts provided DTT and Digital Audio Broadcasting (DAB) service and multiplex licences. These acts also constituted the transfer of the undertakings and privatisation of the BBC s transmission services. MACQUARIE INTERNATIONAL INFRASTRUCTURE FUND LIMITED ANALYST PACK 28 29
 contracts (including price controls), and the imposition of new Signifi cant Market Power (SMP) regulations.")
36 Network Access Regulation Early in 2005, following a market review of the broadcast transmission market and a public consultation, Ofcom published a statement confi rming the revocation of previous Telecommunications Act regulation applied to bundled managed transmission services (MTS) contracts (including price controls), and the imposition of new Signifi cant Market Power (SMP) regulations. The SMP regulations apply to the provision of access to the mast and site network and shared or shareable antenna acquired, constructed or installed by each of NGW and Arqiva for the purpose of providing analogue and/or digital terrestrial broadcasting transmission services (known as site sharing, or in regulatory terms, the provision of Network Access ). The principle behind the new regulation was that the mast and site network infrastructure is a scarce resource and the regulator should ensure that third parties can gain access to these sites and masts. Under this regulation neither the pricing nor the contractual terms of MTS contracts with broadcasters are regulated, however the provision of Network Access is subject to obligations known as fair, reasonable and non-discriminatory regulatory conditions. The pricing of the Network Access is cost oriented, which requires the owners of the infrastructure to clearly differentiate between site sharing and other costs (eg managed transmission services). Network access requirements can be summarised as follows: to provide network access on reasonable request; not to unduly discriminate in the provision of network access; to provide network access on cost-oriented terms; and to publish a reference offer for the provision of network access.
37 Communications Act 2003 Under the Communications Act 2003, communication providers are not required to obtain an individual licence for the provision of communication networks or services. Even so, all providers are subject to some basic conditions set out by Ofcom (General Conditions of Entitlement). As a prior holder of a public telecommunications operator licence under the Telecommunications Act 1984, Arqiva is automatically deemed to operate under the new regime and is authorised to provide communication services throughout the UK. Operators, such as Arqiva, who provide services under the General Conditions of Entitlement and whose annual turnover from carrying out relevant activities exceeds 5 million are liable to pay administrative charges. Licence under the Telecommunications Act 1984 With the operation of the Communications Act 2003, only conditions 7 and 8 from this licence remain relevant. Condition 7: subject to certain conditions, Arqiva is required, on request, to make available to a transmission operator, such as Crown Castle UK, space within or on a number of listed transmission sites. (NGW is the only other provider of terrestrial transmission services to TV broadcasters in the UK). Condition 8: imposes restrictions on the prices which Arqiva can charge for certain telecommunications services activities, including operations services and site rentals Arqiva is required to grant under condition 7. The price control mechanism operates under an Retail Prices Index minus X formula. Competition Act 1998 This Act prohibits anti-competitive agreements and the abuse of a dominant position. This limits the types of agreements and arrangements that Arqiva can enter into. For example, Arqiva may be prohibited from establishing pricing arrangements or purchasing arrangements which have the effect of reducing or foreclosing competition in the market or forcing other companies to act in certain ways. Digial Switch Over (DSO) The UK Government intends to switch off analogue TV transmission in the future and replace it with digital TV, a process referred to as DSO. Around 5,000 analogue transmitters are to be replaced at a total industry capital cost of around 500 million. The DSO is expected to be completed by Digital broadcasting in the UK is well advanced and DTT is the fastest growing television platform, with more than 60% of homes now receiving their signal via DTT. Further penetration of DTT to around 18 million homes is anticipated due to DSO. There are currently six multiplexes, which host more than 40 television channels and more than 25 digital radio channels in the UK. Multiplexes C & D are two (of three) commercial multiplexes that are currently carrying Freeview channels, and NGW is the licencee of these multiplexes until 2014, with an option to renew the licence for a further 12 years. There is scope for signifi cant Freeview channel growth as platform penetration accelerates as DSO draws closer. MACQUARIE INTERNATIONAL INFRASTRUCTURE FUND LIMITED ANALYST PACK 30 31
38 Analogue Terrestrial Television Arqiva s contracts with ITV Plc and Channel 4 are regulated and pricing under these contracts moves under an RPI minus X formula, with X agreed through commercial negotiations with the regulator and the broadcasters. These relationships are contracted until the end of the DSO. DTT In July 2007, Arqiva was awarded a contract by SDN Ltd a wholly-owned subsidiary of ITV Plc to design, build and operate a new national DTT network in preparation for digital switchover. The contract will run until 2034 and is estimated to be worth 500 million over its 27-year term. In August 2007 Arqiva was awarded a contract estimated to be worth up to 1 billion by Digital 3 and 4 Ltd to design, build and operate a new high-power national DTT network until The 1.8 billion BBC DSO contract was signed in September 2006 and will run until Key Asset Features Strong client relationships and predictable cashfl ows Medium to long-term contracts with most of its clients for terms up to 20 years and a contracted order book of c. 5.0 billion (as at Dec 2007), ensure that Arqiva is able to deliver both a stable revenue stream and opportunities for growth. Potential for future growth Arqiva has invested signifi cantly in leading-edge technology and is well positioned for future growth in the UK as TV and radio broadcasters approach DSO. New 3G networks and growth in mobile telecommunications markets will also provide opportunities and potential new uses for the old analogue spectrum. Unique position and portfolio Arqiva has access to over 4,000 broadcast and wireless sites across the UK. Its portfolio includes managed radio communications services to public safety organisations, broadcast towers and wireless site leasing infrastructure with the capacity to provide endto-end broadcast services to its clients and coverage to 98.5% of the UK population. Management team Arqiva has a highly experienced senior management team, which has overseen a yearon-year revenue growth of 12%.
 Borrowing costs debt service (net of interest income) acquisition interest and non-cash (113.9) 8 Income tax 21.3 Net result 7.")
39 Summary Performance 7 Year ended 30 June 2007 million Total revenue Share of associates profi ts 1.0 Cost of sales expense (126.7) Other operating charges (111.6) EBITDA Depreciation and amortisation (31.5) Borrowing costs debt service (net of interest income) acquisition interest and non-cash (113.9) 8 Income tax 21.3 Net result Arqiva numbers from 30 June 2006 to 30 June Due to the UK Competition Commission requirements to hold Arqiva and NGW separate, income from NGW has not been included in the above table. However, the above table does include interest on refi nanced debt used to fi nance the NGW acquisition. Arqiva s total revenue for the year to 30 June 2007 was million. The breakdown of this revenue by division is as follows: Public Safety 16% Wireless Solutions 14% Other Revenue 8% Terrestrial Media 38% MACQUARIE INTERNATIONAL INFRASTRUCTURE FUND LIMITED ANALYST PACK Satellite Media 24% 32 33


40
41 National Grid Wireless ASSET NAME LOCATION EQUITY INVESTMENT MIIF'S INTEREST National Grid Wireless (NGW) (subsidiary of Arqiva) UK S$259.1 million 8.7% interest through Arqiva Background and Acquisition In April 2007, Arqiva announced the acquisition of NGW for a consideration of 2.5 billion. The acquisition has been under review by the UK Competition authorities, who have required NGW and Arqiva to be held as two separate businesses, as referenced on page 25. Asset Overview NGW is one of only two TV broadcast transmission operators in the UK (the other being Arqiva, refer to page 25) and the largest independent wireless site leasing provider in the UK. NGW provides transmission services to TV and radio broadcasters, site leasing to mobile phone and other wireless telecommunication companies and owns two of the six DTT licences in the UK. The combination of Arqiva and NGW creates a unifi ed provider of broadcast transmission services for the UK and one of the largest independent operators of shared sites for mobile communications. As complementary businesses, there are signifi cant opportunities to realise recurring operational synergies. Ownership Structure MIIF has an 8.7% interest in NGW through Arqiva. MACQUARIE INTERNATIONAL INFRASTRUCTURE FUND LIMITED ANALYST PACK 34 35
42 Asset Location NGW is headquartered in Warwick, UK and comprises a national communications infrastructure network through around 5,500 active sites used for mobile communications and 750 towers used for radio and television transmission broadcasts. Asset Snapshot POPULATION SERVED SITES OPERATING DIVISIONS 98.5% of UK population 750 broadcast towers 5,500 wireless sites Broadcasting Wireless DTT Licences Business Description NGW has three primary business segments; Broadcast, Wireless and DTT Licences. Broadcast NGW s Broadcast segment provides national transmission for UK commercial television including BBC and Virgin, playing a leading role in the run up to DSO. Transmission services are also provided to independent radio stations, both analogue and digital. In addition to managed transmission services, NGW also provides site access to its towers and masts, with Arqiva as its key customer. These activities are done through a portfolio of over 750 broadcast towers. Wireless NGW is the largest independent provider of wireless site leasing in the UK with c.11% market share, and has master site sharing agreements with all major mobile network operators (3, T-Mobile, O2, Orange and Vodafone). This is done through a portfolio of over 5,500 towers, masts and managed sites. NGW also provides managed services to both wireless and fi xed-line operators, with T-Mobile as a key customer. DTT Licences DTT spectrum licences C & D were awarded to NGW in 2002 for a 12-year term, with a renewal option for a further 12 years from 2014 to Multiplexes C & D are two of three commercial multiplexes that are currently carrying Freeview channels in the UK. They are currently broadcasting 5 and 6 channels on these multiplexes respectively, with key customers including BSkyB, Channel 4 and ITV. Key Asset Features Strong client relationships and predictable cashfl ows Medium to long term contracts with clients such as the BBC for terms up to 20 years, and a contracted order book of c. 1.9 billion ensure that NGW is able to deliver both a stable revenue stream and opportunities for growth. Potential for future growth NGW is well positioned for future growth in the UK as TV and radio broadcasters approach DSO, with DTT being the default digital free-to-air TV platform and penetration continuing to increase.

43 Unique position and portfolio NGW has access to over 6,000 broadcast and wireless sites across the UK. Operating synergies Potential synergies are expected as a result of coordination with Arqiva, resulting from operational benefi ts and a more effi cient capital expenditure programme with signifi cantly reduced execution risk around the implementation of DSO. Summary Performance Six-month period ended 31 December 2007 million Total revenue Direct costs and overheads (83.4) EBITDA 82.5 EBITDA Margin 49.7% NGW s total revenue for the six months to 31 December 2007 was million. The breakdown of this revenue by division is as follows: DTT Licences 17% Terrestrial Media 27% Wireless Solutions 56%


44
45 Canadian Aged Care ASSET NAME LOCATION EQUITY INVESTMENT MIIF'S INTEREST Canadian Aged Care (CAC) Canada S$164.9 million 55.0% interest Asset Overview CAC is currently the third largest owner and operator of long-term care (LTC) homes in Ontario, Canada. LTC homes are a vital part of a community s social infrastructure and share features that characterise other high-quality infrastructure assets, including stable revenue, signifi cant barriers to entry and low-demand variability. CAC owns 26 LTC homes, one retirement home (RH) and one independent living home (IL). LTC homes are designed to accommodate seniors who may require 24-hour per day care or who suffer from cognitive or physical impairment. This requirement for care distinguishes LTC homes from IL and RH. LTC homes may include shared, semi-private and private suites. Ownership Structure In November 2005 MIIF acquired a 55.0% interest in CAC for a total consideration of S$164.9 million through total return swaps. MACQUARIE INTERNATIONAL INFRASTRUCTURE FUND LIMITED ANALYST PACK 38 39

46 Financing Structure All CAC debt is issued at the Leisureworld Senior Care LP (LSCLP) level. The LSCLP debt is comprised of debt issued at the time CAC was acquired by its current partners, as well as debt to fund the recent acquisition of a seven LTC home portfolio. C$310 million of 4.814% Series A Senior Secured Debentures due on 24 November 2015 were issued on 24 November 2005 by way of a public-style rated private placement in Canada. Prior to the private placement, CAC entered into hedging arrangements for the full amount of the notes. A fl oating rate bank debt facility of C$75 million was drawn on 30 January 2008 to fund CAC s recent acquisition of seven LTC homes. 20% of this facility will be repaid within one year, settled pro rata by CAC s partners via an equity injection.
47 Asset Location CREEDAN VALLEY Creemore Class: C Year Built: 1975 LTC beds: 95 VAUGHAN Vaughan Class: A Year Built: 2004 LTC beds: 224 ELMIRA Elmira (Kitchener) Class: A Year Built: 2000 LTC beds: 96 OXFORD Ingersoll Class: C Year Built: 1975 LTC beds: 160 BRANTFORD ORIGINAL Branford Class: C Year Built: 1972 LTC beds: 90 EXPANSION Branford Class: A Year Built: 2002 LTC beds: 32 Ontario BARRIE Barrie Class: C Year Built: 1972 LTC beds: 57 NORTH BAY North Bay Class: C Year Built: 1975 LTC beds: 148 BRAMPTON MEADOWS Brampton Class: A Year Built: 2003 LTC beds: 160 TULLAMORE Brampton Class: C Year Built: 1965 LTC beds: 159 MUSKOKA Gravenhurst Class: A Year Built: 1999 LTC beds: 182 RH beds: 29 BRAMPTON WOODS Brampton Class: A Year Built: 2003 LTC beds: 160 ORILLIA Orillia Class: A Year Built: 2006 LTC beds: 160 RICHMOND HILL Richmond Hill Class: A Year Built: 2003 LTC beds: 160 ETOBICOKE Etobicoke Class: A Year Built: 2001 LTC beds: 160 SCARBOROUGH Scarborough Class: B Year Built: 1991 LTC beds: 299 IL beds: 53 O CONNOR COURT Toronto Class: A Year Built: 2001 LTC beds: 160 O CONNOR GATE Toronto Class: A Year Built: 2001 LTC beds: 158 ST. GEORGE Toronto Class: C Year Built: 1972 LTC beds: 238 NORFINCH North York Class: A Year Built: 2003 LTC beds: 160 ELLESMERE Scarborough Class: A Year Built: 2003 LTC beds: 224 LAWRENCE Toronto Class: A Year Built: 2002 LTC beds: 224 ALTAMONT Scarborough Class: C Year Built: 1965 LTC beds: 159 MISSISSAUGA Missisauga Class: C Year Built: 1970 LTC beds: 237 STREETSVILLE Missisauga Class: C Year Built: 1976 LTC beds: 118 CHELTENHAM Toronto Class: C Year Built: 1976 LTC beds: 170 ROCKCLIFFE Scarborough Class: C Year Built: 1968 LTC beds: 204 Asset Snapshot COMMENCEMENT OF OPERATIONS 1975 CORE BUSINESSES TOTAL BEDS 4,396 ANCILLARY BUSINESSES 26 LTC homes (4,314 beds) One RH (29 beds) One IL (53 beds) Preferred Health Care Services is an accredited provider of professional nursing and personal support services for both communitybased home care and LTC homes Ontario LTC Providers, a provider of purchasing services to CAC s LTC homes MACQUARIE INTERNATIONAL INFRASTRUCTURE FUND LIMITED ANALYST PACK 40 41

48 Business Description The LTC sector in Ontario is funded according to a defi ned funding model, which contributes to the predictability of CAC s cash fl ow. The following diagram outlines the funding and cost categories for CAC. * Some portion of funding to the accommodation envelope may be derived from the MOHLTC due to the subsidisation of low-income residents. ** Other items include items such as accreditation funding. Note: Not to scale, actual spending amounts differ.
49 Sources of Funds There are two main sources of funds: 1) Ministry of Health and Long-Term Care (MOHLTC) for aged care services: At least 60% of revenue from CAC s LTC homes is received from the MOHLTC. Over the past 10 years, government funding of CAC s LTC homes has increased in excess of the consumer price index. 2) Residents for accommodation services. Funding and Cost Categories Nursing and personal care (NPC): MOHLTC provides funding on a monthly basis to cover the costs of nursing and personal care staffi ng as well as medical and nursing supplies. LTC home operators must return any funding that is not spent to the government during an annual reconciliation process. Spending in excess of the government funding is paid for by the LTC operator. Program and support services (PSS): MOHLTC funds therapeutic services, pastoral care, recreation, staff training, volunteer coordination and other services. LTC home operators must return any funding that is not spent to the government during an annual reconciliation process. Spending in excess of the government funding is paid for by the LTC operator. Other: MOHLTC also provides funding to LTC homes that have been accredited by the Canadian Council on Health Services Accreditation as well as partial reimbursement of LTC homes municipal property tax obligations. Construction funding and/or structural compliance premiums: CAC receives capital cost funding of up to C$10.35 per bed, per day from the MOHLTC, for a period of 20 years (commencing from the year each home was constructed), for Class A homes. CAC also receives structural compliance premiums from the MOHLTC, on a per bed per day basis of C$2.50 for Class B homes and C$1.00 for Class C homes. Preferred premiums: An LTC home that provides basic accommodation for at least 40% of residents may offer the remaining residents preferred accommodation in semiprivate or private rooms. The LTC home operator retains the premiums collected for such accommodation, which typically increases revenue and enhances profi tability. These premiums, which are regulated, are currently C$8.00 per day for a semi-private room and C$18.00 per day for a private room. Approximately 52.9% of the beds in CAC s portfolio are designated as private or semi-private. Accommodation: A co-payment is charged to residents to cover funding for roomand-board expenses such as food, housekeeping, dietary services, laundry and linen, administration and building/property operations and maintenance, including mortgage payments and taxes. MOHLTC also provides subsidies to low-income residents
50 Name of CAC Home Basic Semi-Private Private Short Stay / Other Altamont* Barrie Brampton Meadows Brampton Woods Brantford Cheltenham* Creedan Valley Ellesmere Elmira Etobicoke Lawrence Mississauga* Muskoka Norfi nch North Bay O Connor Court O Connor Gate Orillia Oxford* Richmond Hill Rockcliffe* Scarborough St. George Streetsville* Tullamore* Vaughan Total 1, , % of total 46.3% 19.4% 33.7% 0.7% * Indicates a newly acquired home.

51 Key Drivers Increasing occupancy enhances cash fl ow Occupancy is a key driver of CAC s performance. An LTC home that meets or exceeds 97% annual average occupancy receives funding from the MOHLTC based on 100% occupancy. CAC has a strong record of increasing capacity, through acquisitions and new licences and of maximising occupancy. The government s control and regulation of the supply of beds ensures barriers to entry. In addition, LTC homes represent a costeffective alternative to acute-care hospital beds. Positive demographic trends support demand for LTC The demand for LTC homes is dictated by a need for care driven by demographic trends rather than changes in the economy. The Organisation for Economic Cooperation and Development (OECD) projects that the life expectancy of Canadians is increasing, with life expectancy for the total population rising to 79.9 years in 2003 from 75.3 years in According to the Ontario Ministry of Finance, the 75-plus age group is anticipated to be among the fastest-growing age groups over the next 20 years, doubling in size from 753,000, or 6% of the population, in 2005 to 1.6 million, or 10% of the population, in At the same time, this demographic is increasingly affl uent, with average after-tax income of senior families in Ontario, in which the major income earner was 65 years of age or over, increased almost 12% from 1996 to
52 Regulation LTC is regulated and funded by the MOHLTC, which requires that LTC homes be licensed in order to operate and receive government funding. LTC homes must be built to specifi ed design criteria and funding is generally tied to the delivery level of mandated care services. LTC homes are currently governed by The Homes for the Aged and Rest Homes Act, The Nursing Home Act and The Charitable Institutions Act. In October 2006, the Ontario government commenced the process to consolidate these three acts into a single piece of legislation and on June 4, 2007, The Long-Term Care Homes Act received Royal Assent. It is expected to take 12 to 18 months before the Act will come into force due to the number of regulations that need to be drafted. The Long-Term Care Homes Act contains a number of new provisions, including licence term limits for LTC homes of 15 to 25 years, according to class of homes. Currently, licences have one-year terms subject to automatic renewal on an annual basis provided that compliance requirements are met. On 31 July 2007, the MOHLTC announced a 10-year plan to redevelop 35,000 Class B and C beds, commencing in This funding will enable CAC to further enhance the quality and comfort of accommodation available to residents. All LTC homes are categorised by class as follows: Class A Class B Class C Class D Homes meet or exceed 1998 design standards Homes exceed 1972 standards but fall short of 1998 design standards Homes meet 1972 standards Homes fail to meet 1972 standards The composition of CAC s portfolio is as follows: CAC LTC homes Ontario CAC share of Ontario market Beds by Class Number Percent Number 9 Percent Percent A 10 2, % 24, % 9.25% B % 8, % 3.69% C 1, % 30, % 5.67% D 12, % Total 4, % 76, % 5.66% 9 As of December 31, Source: Care Planning Partners, Inc. 10 All of CAC s Class A homes are designated new homes and qualify for capital funding of $10.35 per day, per bed. Continuing Growth On 1 February 2008, CAC signed an agreement to acquire the Good Samaritan Seniors Complex, which consists of a 64-bed Class A LTC home and an attached 24-bed RH located in Alliston, Ontario, for approximately C$11.1 million plus transaction costs. The acquisition is conditional upon regulatory approval from the MOHLTC. Upon completion of the transaction, CAC will own or manage 27 LTC homes representing 4,378 beds, two RH representing 53 beds and one independent living facility with 53 beds.

53 MACQUARIE INTERNATIONAL INFRASTRUCTURE FUND LIMITED ANALYST PACK


54
55 Changshu Xinghua Port ASSET NAME LOCATION EQUITY INVESTMENT MIIF'S INTEREST Changshu Xinghua Port (CXP) China S$112.3 million 38.0% interest Asset Overview CXP is a multi-purpose cargo port centrally located within the Yangtze River Delta industrial zone. CXP handles mainly steel, forestry products and containers. The majority of CXP s revenue comes from steel-related operations. Ownership Structure MIIF owns a 38.0% effective equity interest in CXP through the acquisition of 40.0% of Singapore Changshu Development Company (SCDC) from existing shareholders, namely, Pan-United Corporation Ltd (PUC) and a minority shareholder. The remaining 60.0% balance of SCDC is owned by PUC and Petroships. Financing Structure MIIF s purchase of CXP was funded with proceeds from the November 2005 capital raising. The total consideration was S$112.3 million. Total debt outstanding at CXP is RMB480 million. The majority of CXP s debt is from Chinese banks in RMB where base rates are fi xed by The People s Bank of China. A smaller portion of the total debt is denominated in USD and the interest rate has been hedged for its tenure. MACQUARIE INTERNATIONAL INFRASTRUCTURE FUND LIMITED ANALYST PACK 48 49

56 Asset Location CXP is centrally located within a high growth industrial area along the Yangtze River which includes the cities of Suzhou, Wuxi and Changshu. Its hinterland has over 200 million people and is one of China s fastest growing industrial regions. As a port, CXP s growth is driven by local GDP and trade volume growth. With a water depth of 13 metres, CXP is the furthest port upstream from Shanghai that is able to handle containerised traffi c. With Class 1 port status, CXP is able to accept vessels directly from overseas thereby allowing it to participate in international trade fl ows.
57 Asset Snapshot GEOGRAPHY 80 kilometres upstream from Shanghai CONCESSION 50 year concession granted to PUC in 1994 (37 years remaining) VESSEL CAPACITY 50,000 dead weight tonne (DWT) vessels FACILITIES 8 berths 1,500 metres of jetty WATER DEPTH 13 metres STORAGE 425,380 square metres of open storage 12 warehouses with 85,847 square metres of covered storage capacity PORT STATUS Class 1 CAPITAL EXPENDITURE No signifi cant near term capital expenditure Business Description CXP s revenues are primarily based on tariffs negotiated with customers. CXP s revenues are derived mainly from the handling of steel and forestry products, as well as handling of container traffi c. Based on unaudited management accounts for the 12 months ended 31 December 2007, general cargo products accounted for 58% of revenue while forestry products and container traffi c accounted for 34% of total revenues. In the steel products segment, under general cargo, CXP benefi ts from captive steel mills and processing plants located in close proximity. CXP handles fi nished steel products between steel traders. In the forestry products segment, the port has a 25% interest in the Changshu Westerlund joint venture which was formed with leading Belgian forestry product terminal operator, Westerlund, in order to operate a dedicated forestry product terminal at CXP. Forestry products volumes, including timber, paper and pulp, are projected to increase due to strong demand in China for paper products. In the container segment, renewed growth is projected as CXP develops as an inland hub for container shipping along the Yangtze River. Rising costs for road transport, especially to and from the new Yangshan Port, are expected to make transport of containers via the Yangtze River more competitive. CXP is thus likely to handle more international and domestic containerised cargo as river traffi c increases. The revenue breakdown can be found below: Others 7% Forestry Products 24% Containers 11% General Cargo 58% MACQUARIE INTERNATIONAL INFRASTRUCTURE FUND LIMITED ANALYST PACK 50 51
58 Historical revenue for CXP is shown in the table below: Year ended 31 December Revenue (RMB million) The revenue decrease in FY2004, compared to FY2003, was due to Chinese government macro-economic measures to restrain excessive growth in the domestic economy. The measures resulted in lower volumes of steel imports, which adversely impacted CXP s steel handling volumes. Subsequently, steel export volumes have increased in contribution to CXP s revenue and profi tability. Historical quarterly volumes are shown in the table below: Quarter ending 31 Mar Jun Sep Dec Mar Jun Sep Dec 2007 Total steel volume (000 tonnes) Total non-steel volume (000 tonnes) Total containers (000s) Total forestry volume (000 tonnes) , Regulation The administration and operation of ports in China was under strict government controls until the end of 2001 when China launched a comprehensive reform program to separate government functions from enterprise management. Although the government remains in control of port administration, the reform opened up port construction and port operations to foreign investment to a greater extent. The construction and operation of ports and terminal facilities is classifi ed as encouraged, according to the Foreign Investment Industrial Guidance Catalogue which came into effect in January Future Opportunities There are ongoing efforts to secure new businesses through new cargo and land lease to reduce CXP's reliance on the steel sector. New opportunities such as fertilisers, equipment and cement have been identifi ed. Additionally, by leasing out a portion of its yard to prospective equipment manufacturers, CXP will receive a steady revenue stream while enjoying variable revenue from handling the equipment. CXP continues to be the leading forestry port in the region through its successful partnership with Belgian forestry specialist Westerlund and its ability to add warehouse capacity as needed to accommodate growth. With a strong performance in 2007, continued growth is expected in forestry products due to demand from the region's paper making industry. Competition in the steel sector remains strong, with a variety of regional ports remaining active. CXP is pursuing a three-way strategy to stay competitive, working to attract cargo owners, ship operators and specialist mills.

59 Opportunities to capture benefi ts of the growing market for steel and Chinese economic growth. CXP is expected to benefi t from robust growth in global and Chinarelated trade, which would necessitate increased water cargo transport. Increasing trade around the Yangtze river hinterland. MIIF s participation in the Chinese port sector through its investment in CXP may benefi t MIIF via introduction to other potential investment opportunities in this sector or in the region. Summary Performance Year ended 31 December 2007 RMB million Total revenue Cost of sales (57.9) Overheads (36.0) EBITDA Depreciation and amortisation (27.4) EBIT 93.5 Finance costs and non-operating income (25.9) Share of results of associates 5.6 Profi t before tax 73.1 Income tax expense (5.1) Profi t after tax 68.1 Note: The above numbers have been stated in accordance with Chinese GAAP. The numbers are subject to rounding. MACQUARIE INTERNATIONAL INFRASTRUCTURE FUND LIMITED ANALYST PACK


60
61 Hua Nan Expressway ASSET NAME LOCATION EQUITY INVESMENT MIIF'S INTEREST Hua Nan Expressway (HNE) Guangzhou, China S$295.7 million* 81.0% interest * Originally announced acquisition price of S$329.5 million comprised of S$295.7 million invested at acquisition, and S$33.8 million of acquisition adjustments contingent upon certain events and is yet to be paid. Asset Overview HNE is a 31-kilometre, dual way six-to-eight-lane brownfi eld urban-tolled expressway. It is located in the city of Guangzhou, the capital city of the wealthiest province in China, with one of the fastest rates of population growth. The road comprises a tunnel, various bridges and 11 interchanges. The asset has been constructed in two separate phases. Phase I totalling 15.6 kilometres long with eight lanes commenced operations in October 1999 and Phase II totalling 15.4 kilometres in length with six to eight lanes (four lanes in the tunnel) commenced operations in January The rights to operate and collect tolls for Phase I & II will expire in April Phase I & II make up the main artery for north-south traffi c in Guangzhou, enabling cities in the Pearl River Delta such as Foshan, Zhongshan, Zhuhai, Shenzhen and the whole of Southern China to be easily accessible. Ownership Structure On 19 November 2007, MIIF acquired an 81.0% interest in HNE, from Preciseway Management Ltd and Topwise Consultants Ltd (Vendors). A 9.0% equity interest has been retained by the Vendors, and the remaining 10.0% of equity is held by Guangzhou Centre for Administration of Municipal & Gardening Works (Guangzhou government body). The following is a simplifi ed diagram of HNE s holding structure. MACQUARIE INTERNATIONAL INFRASTRUCTURE FUND LIMITED ANALYST PACK 54 55

62 Financing Structure China Construction Bank has provided a maximum RMB2.753 billion debt facility. The facility has a 14-year tenor and an amortisation profi le which matches the operating cash fl ow growth profi le and allows HNE to repay a larger proportion of the debt towards the end of the tenor. The interest rate applicable to the loan is the 5-year PBOC rate. Asset Location Phase I & II is located in Guangzhou, the capital city of Guangdong province. Guangdong is a coastal province in southeastern China, with three of the six special economic zones in China within its boundaries: Shenzhen, Shantou and Zhuhai. Guangdong is one of the richest provinces in the nation, with the highest total GDP among all provinces. Asset Snapshot Length of Phase I 15.6 kilometres Length of Phase II 15.4 kilometres Pavement Asphalt Number of lanes six to eight (four in tunnel) Width of lanes 3.8 metres per lane Interchanges annual tolled vehicles (million) 40.4 Design speed (kilometres per hour) Structures Bridges, culverts & tunnel
63 Road Configuration HNE has three to four lanes in each direction and converges into two lanes each way in the tunnel at Shimentang Hill. HNE lies to the east of Guangzhou City and has good connectivity with other roads in the province including other expressways, the national highway and urban primary roads as marked out in the map below. Phase III of the expressway is currently under construction and MIIF may take the opportunity to acquire an interest in Phase III once it commences operation and attains satisfactory traffi c levels. Phase III is expected to increase the traffi c fl ow into Phase I & II. Airport Expressway 2nd Northern Ring Road Hua Nan Expressway Taihe Main Line Taihe Ramp Northern Ring Road Chungang Longdong Guangshan Cencun Zhongshan Guangyuan Luoxi Bridge East, South and West Ring Road Xinguang Expressway Panyu Bridge Xinzhou Huangpu Nansha Port Expressway Phase I Phase II Tuhua Phase I of HNE originates in the Tianhe district, the fi nancial centre of Guangdong and connects to the Panyu Bridge in the south. It intersects with eight expressways and urban arteries, namely Guangshen Highway, Northern Ring Road, Guangyuan East Expressway, Zhongshan Avenue, Huangpu Avenue, Xinguang Expressway, Xinjiaonan Road and Southeast West Ring Road. Phase I is the only external highway backbone which runs near the city centre in Guangzhou and connects to the Pazhou International Exhibition Centre and Guangzhou University Town. Phase I provides the fastest and most convenient route between Guangzhou and Panyu. Phase II of HNE connects to Phase I from Cencun Bridge and converges with Jingzhu Highway and the second Northern Ring Road at Taihe Town next to the Helong Reservoir in Baiyun District. The second Northern Ring Road is the key road in the Guangzhou- Foshan area and is the primary linkage between Baiyun Airport and Guangzhou New Railway Station. By taking the Jingzhu national highway from Beijing and continuing down Phase II to Guangzhou, cities in the Pearl River Delta such as Foshan, Zhongshan, Zhuhai, Shenzhen are easily accessible. Immediate destinations Distant destinations Connecting key roads Phase I Panyu and Nansha New residential development in southern Guangzhou Guangzhou International Exhibition Centre Local universities Phase II Baiyun and Tianhe districts Baiyun International Airport Shaoguan city Mt. Maofeng scenic region Zhong Shan, Zhu Hai and Macau Hunan Province, Beijing Eight local expressways and key inner city roads and two national highways Two intercity expressways (one in planning) and two national highways MACQUARIE INTERNATIONAL INFRASTRUCTURE FUND LIMITED ANALYST PACK 56 57
64 Exclusive Operation Rights The approved business scope of Phase I & II company is to plan, construct and operate the expressway, bridges and associated facilities of the business. The term of the toll collection for Phases I & II will expire in April Upon the expiration of the toll collection period, the assets of the expressway, bridges and associated facilities, buildings and the rights to operate shall be transferred to Guangzhou Centre (Guangzhou government body) without compensation. Tolling Toll rates have not increased since the opening of Phase I in 1999 and are set initially on a per kilometre basis by the provincial government (ie Guangdong Province Government). In the event that the Phase I & II Board decides to increase its toll rates, it is required to submit an application to the Guangzhou Transportation Committee and the Guangzhou Pricing Bureau. Any such approval by the government authorities will have an effect on all toll roads in the province. The following fl ow chart presents the stages a toll road needs to satisfy before an increase in the toll rate is approved by the provincial government. Toll Collection In 2000, a toll collection network with neighbouring roads was established, which laid the foundations for the subsequent unifi ed tolling system. HNE was also the fi rst toll road in Guangdong to implement electronic payment technology. The current toll-collection system is a semi-automatic closed type with manual classifi cation of vehicle classes. It utilises a recyclable non-contact Integrated Circuit (IC) card to offer different payment options to cash. Approximately 15% of the revenue is derived from the use of the IC card. Each of the main tollgates in Taihe, Huangpu, and Tuhua has an Electronic Toll Collection toll lane.
 Guangzhou Ring Road (b) Second Northern Ring Road (c) Second Eastern Ring Road (d) Airport Expressway (e) (f) Nansha Expressway Panyu Bridge The settlement scheme for Phase I & II is formulated")
65 Phase I & II are part of the joint tolling system which includes the following highways and bridge. (a) Guangzhou Ring Road (b) Second Northern Ring Road (c) Second Eastern Ring Road (d) Airport Expressway (e) (f) Nansha Expressway Panyu Bridge The settlement scheme for Phase I & II is formulated in accordance with the road s total length, vehicle types, and the existing approved toll rates. Phase I & II s management centre can control and supervise the entire tolling network. Through its lane control system, IC card system, automatic image capture and licence plate recording system, the system collects all information along the toll stations, and has a clear view of a vehicle s journey from entering to exiting the toll station. The real-time system links systems at all levels, and is able to operate independently, thereby providing a higher degree of fl exibility and improved operational effi ciency. MACQUARIE INTERNATIONAL INFRASTRUCTURE FUND LIMITED ANALYST PACK
66 Traffic Performance Tolled traffi c numbers for 2007 are approximately 11.7% lower than for 2006 predominantly due to the opening of Xinguang Expressway in January The negative impact of Xinguang Expressway on Phase I is expected to be limited as the traffi c on Xinguang Expressway mainly consists of local passenger cars whereas Phase I has a wider traffi c mix consisting of long distance freight trucks, buses and also local passenger cars. Furthermore, Xinguang Expressway has limited connectivity within the region (limited to the southern part of the city) which indicates that fewer cars are likely to use the road given the lack of destinations served by the road. For instance, the residential area just south of Panyu Bridge is a main source of traffi c for Phase I, and given the immediate proximity of this region to Phase I the traffi c is unlikely to detour and use the cheaper but less convenient Xinguang Expressway. There is a decreasing trend in Type 2 and 3 traffi c volume due to the growing trend of factories relocating out of Guangzhou. For cost effi ciency purposes, these factories have started using higher-yielding Type 4 and 5 vehicles to transport goods over longer distances. The table below provides the historical traffi c information for HNE. Year to 31 December Annual tolled traffic Type 1 - Small passenger vehicles 24,038 29,406 27,827 Type 2 - Delivery vans/mini buses 6,155 4,671 2,973 Type 3 - Medium passenger vehicles 10,758 9,630 7,359 Type 4 - Buses/medium trucks/coaches Type 5 - Heavy trucks/tractors 1,353 1,476 1,613 Total 42,975 45,758 40,400 Revenue (RMB million)* * As mentioned above, the reduction in revenue in 2007 was mainly due to the opening of Xinguang Expressway. Weighted Average Toll Rates The table below provides the historical weighted average toll rate per vehicle type for HNE. Although the toll rate per kilometre has not been changed since 1999, the toll rates displayed in the table below are based on revenue from each vehicle type and the number of vehicles. Therefore, there may be some fl uctuation in the weighted average toll rates between the periods. RMB/Vehicle Type 1 Small passenger vehicles Type 2 Delivery vans/mini buses Type 3 Medium passenger vehicles Type 4 Buses/medium trucks/coaches Type 5 Heavy trucks/ tractors 31 Dec Mar Jun Sept Dec

67 Summary Performance Year ended 31 December 2007 RMB million Revenue Toll revenue Other income 4.8 Operating expenses Operating costs (66.7) Routine maintenance (15.0) EBITDA EBITDA margin 82.2% Note: The above numbers have been stated in accordance with Chinese GAAP. The numbers are subject to rounding. MACQUARIE INTERNATIONAL INFRASTRUCTURE FUND LIMITED ANALYST PACK 60 61


68
69 infravest Wind Power ASSET NAME LOCATION EQUITY INVESMENT MIIF'S INTEREST infravest Wind Power (infravest) Taiwan S$27.9 million 100.0% interest Asset Overview infravest owns and operates 25 wind energy converters (WEC), with a cumulative installed capacity of 49.8MW, at two sites (Dapong and Chunan) in Miaoli County, Taiwan. These WECs provide power generation capacity under licence from the Energy Commission of the Ministry of Economic Affairs of Taiwan. All output from the WECs is sold to Taiwan Power Company (Taipower), the government-owned electricity company, under long term power purchase agreements (PPA). Taipower is obliged by regulation to purchase power from renewable energy sources. Ownership Structure MIIF's 100% interest in infravest was acquired from Asia Wind Co. Limited and Meihui Windpark GmbH & Co KG in March The total consideration (including transaction costs) was S$27.9 million. MACQUARIE INTERNATIONAL INFRASTRUCTURE FUND LIMITED ANALYST PACK 62 63

70 Financing Structure MIIF has agreed terms with lenders for a NT$2.15 billion debt facility that will be used to refi nance the existing borrowings. The facility has a 12-year tenor and the interest payments are expected to be hedged under an interest rate swap. Asset Location infravest owns and operates WECs at two sites (Dapong and Chunan) in the district of Miaoli, Taiwan. The terrain in the area is fl at and all the WEC sites are found directly on the coastline facing the Taiwan Strait or inland at elevated and exposed points. infravest Taipei Dapong Miaoli Chunan Taichung Kaohsiung
71 Asset Snapshot Geography PPA Capacity Facilities Operations and maintenance Dapong and Chunan towns in Miaoli County 15 years with the option to extend for a further 5 years 49.8MW 25 turbines 12-year fi xed fee contract with an option to extend for an additional three years. The contract payments are denominated in and have been hedged to NT$ for fi ve years Business Description infravest commenced operations in March 2006 with its fi nal commissioning occurring in August The 49.8MW project comprises of twenty four 2MW WECs and one 1.8MW WEC over two wind farms in Miaoli County. Of the 25 WECs, 21 are located at Dapong Wind Farm whilst the remaining four turbines are located at Chunan Wind Farm. WECs that face the prevailing wind direction convert wind energy into electricity. When the wind rotates the large rotor blades on the WECs, energy is generated, which is then converted into electricity. infravest uses turbines manufactured by Enercon, one of the world s leading manufacturers of WECs. The E-70 WEC installed by infravest is based on well proven technology and has been installed at more than 150 sites worldwide. Key Performance Drivers Fixed long-term tariffs provide stable revenue The entire energy production is sold to Taipower under 15-year fi xed tariff PPA (one agreement per wind farm site) and there is an option to extend each PPA for an additional fi ve years. The fi xed tariff is NT$2.00 per KWh. Energy production by each WEC fl uctuates based on the natural wind speed at the location of the WEC. Energy production is subject to seasonality, with the autumn and winter months forecast to have higher wind speed than the spring and summer months. The energy yield of the infravest sites was assessed by Deutsche WindGuard by means of the European Wind Atlas Procedure. 11 Wind measurements were based on a data series covering 36 years of historical data gathered from a meteorological station at Hsinchu Airport, which is located close to the two wind farm sites. A long term average mean energy production or probability of exceedance (P50) 12 was assumed in MIIF s investment case. The NT$2.15 billion debt facility is sized to a probability of exceedence of P MACQUARIE INTERNATIONAL INFRASTRUCTURE FUND LIMITED ANALYST PACK 11 The European Wind Atlas procedure is based on the Wind Atlas Analysis and Application Program (WASP). The WASP model is a widely-used method for wind energy prediction and currently has more than 2100 users in 100 countries. 12 P50 50% probability that actual results will outperform forecasts. P99 99% probability that actual results will outperform forecasts
72 Fixed long-term operations and maintenance contract Operations and maintenance (O&M) of the WECs is contracted to Solvent, a wholly owned subsidiary of the turbine manufacturer, Enercon. The fi xed fee contract is valid for 12 years, with the option to extend for an additional three years. This contract provides certainty around costs and removes the need for separate maintenance capital expenditure to be incurred. The O&M contract with Solvent guarantees a 97% WEC availability. If this level of availability is not achieved, Solvent is required to compensate infravest. The O&M contract payments, which escalate at the rate of German production indices 13, are denominated in and have been hedged to NT$ for fi ve years. Strong government and legislative support for renewable energy Renewable energy is a key component of Taiwan s installed energy capacity with the potential to increase from 5.5% (2.5GW) in 2004 to 10% (5.1GW) of Taiwan s total electricity capacity by Wind generation is expected to account for 8% of the total renewable energy capacity by These milestones are in line with targets set by the Taiwanese Bureau of Energy (BOE). Regulatory Background A concession licence is required under the Electricity Industry Law for a company to run an electricity generation business in Taiwan. infravest holds an Electricity Industry Licence issued by the BOE. The duration of the Electricity Licence is 30 years and will expire in The price and purchase conditions for renewable energy in Taiwan are stipulated in the Guidelines for the Purchase of Renewable Energy Power (Purchase Guidelines), issued by Taipower and approved by the Ministry of Economic Affairs. The Purchase Guidelines are the basis for the PPAs with Taipower. The Purchase Guidelines provide a fi xed preferential tariff of NT$2.00 per kwh for power generated by a qualifi ed renewable energy power generator. In addition, under Taiwanese law, a company is required to have profi t-seeking enterprise licences issued by local governments in the area where its business is run. infravest has two profi t-seeking licences, issued by the Taipei City government and the Miaoli County government. There is no expiration date for these profi t-seeking enterprise licences. Future Opportunities Improving the generation capacity of the WECs by upgrading to 2.3MW units Potential additional acquisition of wind projects in Taiwan and across Asia to develop and exploit synergies and economies of scale 13 German Index of Industrial Producer Prices (domestic sales) and the Index of Gross Hourly Wages of Capital Goods Industry Employees.


73 MACQUARIE INTERNATIONAL INFRASTRUCTURE FUND LIMITED ANALYST PACK 66 67


74
75 Taiwan Broadband Communications ASSET NAME LOCATION EQUITY INVESMENT MIIF'S INTEREST Taiwan Broadband Communications (TBC) Taiwan S$161.8 million (post return of capital) 20.0% interest Asset Overview TBC was established in 1999 and is the third largest cable TV (CATV) infrastructure owner and operator in Taiwan. It is the sole licensee and provider of CATV in its fi ve franchise areas passing over one million homes. As at 31 December 2007, TBC has 688,860 Basic cable subscribers, 19,373 Premium digital subscribers and provides broadband services to 111,177 subscribers. Asset Location TBC South Taoyuan (Nan Taoyuan) South Miaoli (Chi Yuan) North Miaoli (Shin Ho) Asset Snapshot NUMBER OF FRANCHISE AREAS HOMES PASSED Five Over 1 million BASIC TV SUBSCRIBERS 688,860 as at 31 December 2007 SERVICES Taichung (Chun Chien) Basic CATV Broadband Premium Digital TV Hsinchu County (Best) MACQUARIE INTERNATIONAL INFRASTRUCTURE FUND LIMITED ANALYST PACK 68 69
 is made through a series of interposing entities via its interest in Cable TV S.A.")
76 Ownership Structure MIIF has a 20.0% economic interest in TBC. MIIF s investment in TBC of S$161.8 million (post return of capital) is made through a series of interposing entities via its interest in Cable TV S.A. This investment comprises ordinary shares, convertible notes and shareholder loan notes. Macquarie-managed funds' economic interest in TBC is 80.0%.
77 Financing Structure Cable TV S.A. has an unsecured term loan facility of NT$3.3 billion currently fully drawn. In addition, Cable TV S.A. s 100% owned subsidiaries, TBC Holdings B.V. and its Taiwan onshore holding companies (collectively called TBC Group) have a senior term loan of the equivalent of NT$23 billion, of which NT$21 billion has been drawn. Of the senior term loan facility NT$8.5 billion is drawn offshore in US$ and NT$12.5 billion is drawn on-shore, denominated in local currency (NT$). The lenders require that the TBC Group maintain a hedging plan to mitigate the interest rate exposure under the NT$ debt and currency and interest rate exposure under the US$ debt. For the NT$ loans, the TBC Group has executed a two-year swap for 50% of the loan outstanding and a three-year swap for 35% of the loan outstanding (i.e 85% of the debt is hedged until March 2009 and 35% until March 2010). TBC also has in place a revolving facility of NT$2.0 billion for working capital, general corporate requirements and for the purpose of funding expansion-related capital expenditure. Tranche A of the term loan facility and the revolving facility matures in September 2014 and Tranche B of the term loan facility matures in September Business Description TBC is the sole licensee and provider of Community Antenna Television (CATV) or, as it is more commonly known, cable television, in its franchise areas, with 688,860 subscribers. Contracts are one to three months long and generally pre-paid. Contracts are also renewed automatically. In Taiwan, CATV is the dominant broadcast medium accessed by 80% to 85% of the population. Whilst TBC enjoys strong recurring cash fl ows from its basic CATV service, signifi cant growth potential exists from the continued roll-out of digital television and bundling broadband, premium content, and additional valueadded services on existing network infrastructure for which capacity exists. Regulatory ownership restrictions; operator licensing requirements; the ability to source content; as well as cost and practicality of building a new cable network; and establishing a customer base create signifi cant barriers to entry for potential new entrant CATV operators within TBC s operating regions. Basic CATV TBC s basic CATV services are provided over a 10,570 kilometre Hybrid Co-axial Fibre (HFC) network spread over the fi ve franchise areas of Nan Taoyuan, Hsin Chu, North Miaoli, South Miaoli and Taichung City. TBC currently offers its basic cable TV subscribers approximately 100 channels of diverse content. Broadband TBC s broadband offering provides high speed internet access to subscribers in its franchise areas using cable modem technology. TBC completed a technology upgrade in early 2007 to facilitate a signifi cant increase in broadband internet speeds, currently providing subscribers with up to a 16Mbps offering. TBC Broadband subscribers are also able to obtain cable telephony or Voice Over Internet Protocol services over the network enabling local, national and international calls. TBC has an arrangement with Eastern Broadband Communications under which TBC receives a commission per cable phone subscriber. MACQUARIE INTERNATIONAL INFRASTRUCTURE FUND LIMITED ANALYST PACK 70 71

78 Premium Digital TV TBC s Premium Digital TV offering includes: An additional 31 video and 30 music channels which are not subject to regulatory price caps; and Interactive video services. Regulation in Taiwan The CATV industry in Taiwan is governed by the laws of broadcasting, telecommunications and fair trade. Currently, the Broadcasting and Television Law governs the cable television industry as a whole, while certain aspects of regulation, such as licensing of individual system operators, are regulated under the Cable Radio and Television Law. The Telecommunications Act governs the issue and administration of Type I and Type II telecommunications licences, for the provision of leased circuits and internet services, respectively. The Fair Trade Law regulates trade practices and competition. Until recently, cable operators in Taiwan were principally regulated by the Government Information Offi ce (GIO) and the Ministry of Transportation and Telecommunications (MOTC). The National Communications Commission (NCC) was established in March 2006 as the central independent regulator, consolidating the functions of the GIO and MOTC with respect to cable television regulation. Notwithstanding this regulatory consolidation, the CATV Review Committee (CTRC) remains independent as the body responsible for setting national price caps for cable operators as well as the approval, issuance, and renewal of CATV operating licences.
79 In addition, local governments impose local tariff limits within the national cap set by the CTRC. Each initial Systems Operation (SO) licence was expressed to be effective for nine years to facilitate the regulation of the industry initially. Each licence is renewable provided that a renewal application is fi led during the six months following the eighth anniversary of the date on which the original licence was issued. The existing licences of most of the SOs (including TBC) will expire in 2008 or The NCC has not yet stipulated any additional criteria or regulations which may apply regarding these renewal applications beyond the fi ling of a renewal application. The fi rst SO licence due for renewal in February 2008 has recently been renewed. Summary Performance Year ended 31 December 2007 Year ended 31 December 2006 Basic CATV No. of ending subscribers 688, ,785 Premium Digital TV No. of ending subscribers 19,373 16,009 Penetration rate (%) % 2.4% Broadband No. of ending subscribers 111,177 92,723 Penetration rate (%) % 13.9% ARPU NT$ 15 Basic Premium Digital TV Broadband Revenue (NT$ million) 6, ,971.0 Operating expenditure (NT$ million) 2, ,495.9 EBITDA (NT$ million) 3, ,475.1 EBITDA margin 59.6% 58.2% 14 Penetration rate is calculated as a percentage of Basic subscribers. 15 Average revenue per user (ARPU) includes subscription revenue and other revenue from installation, advertising and channel leasings. In order to be able to receive Broadband or premium digital TV services, subscribers need to apply for basic cable TV. MACQUARIE INTERNATIONAL INFRASTRUCTURE FUND LIMITED ANALYST PACK 72 73


80
81 Macquarie European Infrastructure Fund ASSET NAME LOCATION EQUITY INVESTMENT MIIF'S INTEREST Macquarie European Infrastructure Fund (MEIF) Developed European countries S$194.8 million 6.3% direct investment Asset Overview MEIF is a limited partnership that was established to acquire and manage a diversifi ed portfolio of infrastructure and related assets located in developed European countries. Ownership Structure of MEIF MIIF has a 6.3% direct interest in MEIF. Macquarie-managed funds' economic interest in MEIF is 24.5%. Rhône * NRE is subject to completion MACQUARIE INTERNATIONAL INFRASTRUCTURE FUND LIMITED ANALYST PACK 74 75
82 Distribution History MEIF distributions have historically been paid half yearly for the periods ending 31 March and 30 September. March distributions have historically been paid in April. September distributions have historically been paid in October. S$ million Year ended 31 December 2007 Year ended 31 December 2006 Distributions to MIIF MEIF Portfolio 16 The composition of MEIF s diversifi ed portfolio of high quality European infrastructure and related assets are outlined below: Bristol International Airport 13% Wales & West Utilities 10% Wightlink 6% Thames Water 19% Obragas/NetH 2% Arlanda Express 6% MEIF Renewables 12% Brussels Airport 6% Autoroutes Paris- Rhin-Rhône 26% By Sub-Sector By Currency & Country Road 25% Airports 19% France ( ) 26% Sweden (SEK) 7% Belgium ( ) 6% Ports and Ferries 6% Renewable Energy 12% UK ( ) 59% Rail 6% Netherlands ( ) 2% Regulated Utilites 31% 16 Figures are based on MEIF s most recent valuation as at 31 December 2007 which values NRE at zero until the investment is completed. Numbers are subject to rounding.

83 Arlanda Express Asset Overview The high speed, dedicated rail link between Stockholm s main international and domestic airport at Arlanda and Stockholm Central Station, at the centre of the city. MEIF completed the acquisition of its 100.0% interest in Arlanda Express in April 2004 for an equity investment of SEK450.0 million. Asset Snapshot SUB-SECTOR PASSENGERS SERVED (2007) LENGTH OF RAIL MARKET SHARE OF AIRPORT PASSENGERS 15.3% Rail 2.8 million 42 kilometres CONCESSION Exclusive until 2040 Financial Performance Year ended 31 December 2007 SEK million Year ended 31 December 2006 SEK million Revenue Operating expenditure (257) (253) EBITDA MACQUARIE INTERNATIONAL INFRASTRUCTURE FUND LIMITED ANALYST PACK 76 77

84 Brussels Airport Asset Overview Belgium s major airport and the gateway to the heart of Europe. MEIF completed the acquisition of its 10.0% interest in Brussels Airport in December 2004 for an equity investment of million. Asset Snapshot SUB-SECTOR PASSENGERS SERVED (2007) TERMINAL CAPACITY RUNWAY CAPACITY MARKET SHARE OF AIRPORT PASSENGERS LICENCE Airport 17.8 million million passengers per annum 74 co-ordinated fl ight movements per hour Approximately 85% of total airline passenger traffi c in Belgium Indefi nite operating licence and freehold ownership of operating land Financial Performance Year ended 31 December 2007 million Year ended 31 December 2006 million Revenue Operating expenditure (163.6) (160.5) EBITDA

85 MEIF Renewables Asset Overview MEIF Renewables is a portfolio of renewable power generation assets located in the UK, France and Sweden. MEIF acquired its 100.0% interest in MEIF Renewables in March and June 2005, September 2006 and February 2007 respectively for a total acquisition cost of million. Asset Snapshot SUB-SECTOR GENERATION CAPACITY (2007) LICENCE Financial Performance Renewable energy 863 GWh Indefi nite operating licence April - December 2007 million* April - December 2006 million Revenue Operating expenditure (36.5) (25.5) EBITDA * Unaudited results for the half-year ending 31 December MACQUARIE INTERNATIONAL INFRASTRUCTURE FUND LIMITED ANALYST PACK 78 79

86 Wales & West Utilities Asset Overview Regulated gas distribution business located in Wales and the southwest of England. MEIF completed the acquisition of its 31.0% interest in Wales & West Utilities in June 2005 for an equity investment of million. Asset Snapshot SUB-SECTOR POPULATION SERVED (2007) LENGTH OF NETWORK VOLUME OF GAS DELIVERED LICENCE Gas distribution 7.4 million 35,000 km 69,423 GWh Perpetual Financial Performance Year ended 31 December 2007 million Year ended 31 December 2006 million Revenue Operating expenditure (90.0) (88.8) Replacement expenditure (42.8) (43.9) Exceptional items (0.9) (2.8) EBITDA (pre-exceptionals)

87 Wightlink Asset Overview Wightlink is the major ports and ferries operator between the UK mainland and the Isle of Wight, transporting passengers, cars, coaches and freight on three routes between six ports. MEIF completed the acquisition of its 100.0% interest in Wightlink in July 2005 for an equity investment of 88.5 million. Asset Snapshot SUB-SECTOR CROSSINGS (2006) 70,000 FOOT PASSENGERS (2006) VEHICLES (2006) VESSELS Financial Performance Ferry services million million Eight vehicle and passenger ferries and three passenger-only catamarans April - December 2007 million April - December 2006 million Revenue Operating expenditure (28.6) (27.9) EBITDA MACQUARIE INTERNATIONAL INFRASTRUCTURE FUND LIMITED ANALYST PACK 80 81

88 Autoroutes Paris-Rhin- Rhône Asset Overview Autoroutes Paris-Rhin-Rhône (APRR) is the fourth-largest tolled motorway network in Europe. The business comprises two separate concession companies, APRR and AREA. The motorway network links France s two largest cities: Paris and Lyon and interconnects France, Switzerland and Italy. It predominately comprises of inter-urban roads with minimal bypass risk. MEIF acquired its 20.4% interest in APRR in February and April 2006 respectively for a total acquisition cost of million. Asset Snapshot SUB-SECTOR LENGTH OF ROADS AVERAGE DAILY TRAFFIC MILLIONS OF VEHICLE KM TRAVELLED (2007) 20,810 CONCESSIONS Toll roads 2,215 kilometres 25,575 vehicles APRR and AREA each with 27 years

89 Financial Performance 17 Year ended 31 December 2007 million Year ended 31 December 2006 million Revenue 1, , APRR is a French public company listed on the Euronext Stock Exchange. Only the traffi c and revenue results are published on a quarterly basis. MACQUARIE INTERNATIONAL INFRASTRUCTURE FUND LIMITED ANALYST PACK 82 83
 is located around Schipol Airport.")
90 Dutch Utilities Asset Overview NRE is the sixth largest incumbent gas and electricity distribution network in the Netherlands. NRE s networks are located in the southeast of the Netherlands in and around the city of Eindhoven. Obragas is contiguous to NRE and Haarlemmermeergas (NetH) is located around Schipol Airport. The completion of NRE, which was expected in October 2007, has been further delayed as a result of political developments in the Netherlands. Given the delays that have occurred MEIF is no longer legally required to invest in NRE except in the unlikely event that privatisation is permitted by the third quarter of The investment in NRE remains a possibility through a convertible loan agreement which MEIF is progressing with NRE s municipal shareholders. MEIF called 72.0 million for the acquisition of NRE. In parallel with efforts to push for a successful completion, MEIF is looking at other opportunities. Depending on the nature and timing of those opportunities and the results of the continuing efforts at NRE, MEIF may decide that it is appropriate to direct the called funds to an alternative investment. The acquisition of Obragas was completed on 1 June Subsequently, on 12 July 2007, MEIF invested 53.7 million in the networks through subordinated debt which will convert to equity following the introduction of privatisation legislation. MEIF has had economic exposure to the asset from 1 July 2006.
 LENGTH OF NETWORK LICENCE Financial Performance Gas and electricity distribution 545,000 connections 9,995 kilometres Indefi nite operating licence")
91 The businesses are continuing to work on the integration of Obragas and NetH operations with those of NRE. The integration is expected to complete by the end of October Asset Snapshot SUB-SECTOR POPULATION SERVED (2007) LENGTH OF NETWORK LICENCE Financial Performance Gas and electricity distribution 545,000 connections 9,995 kilometres Indefi nite operating licence Year ended 31 December 2007 million Year ended 31 December 2006 million Revenue Operating expenditure (15.2) (15.6) EBITDA MACQUARIE INTERNATIONAL INFRASTRUCTURE FUND LIMITED ANALYST PACK 84 85

92 Bristol International Airport Asset Overview The major regional airport serving the southwest of England is the ninth largest airport in the UK. MEIF completed the acquisition of its 50.0% interest in Bristol International Airport in December 2006 for an equity investment of million. Asset Snapshot SUB-SECTOR PASSENGERS SERVED (2007) TERMINAL CAPACITY RUNWAY CAPACITY LICENCE Airport 5.8 million Over 6 million passengers per annum 30 co-ordinated fl ight movements per hour Indefi nite operating licence and freehold ownership of operating land Financial Performance Year ended 31 December 2007 million Year ended 31 December 2006 million Revenue Operating expenditure (23.3) (22.0) EBITDA

93 Thames Water Asset Overview The largest water and wastewater services company in the UK. MEIF completed the acquisition of its 12.4% interest in Thames Water in December 2006 for an equity investment of million. Asset Snapshot SUB-SECTOR WATER AND WASTEWATER CUSTOMERS LENGTH OF WATER MAINS LENGTH OF SEWERS WATER SUPPLY AREA LICENCE Financial Performance Utilities 13.3 million 31,100 kilometres 67,700 kilometres 5,500 square metres Water and wastewater services operating licence, with 25 years rolling notice for termination. April December 2007 million April December 2006 million Revenue 1, ,344.0 Operating expenditure (462.7) (655.2) MACQUARIE INTERNATIONAL INFRASTRUCTURE FUND LIMITED ANALYST PACK EBITDA


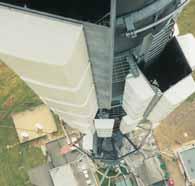
94
95 Overview of the Analyst Model Model Formatting and Key Assumptions Standard techniques and formatting used in the Analyst Model include the following: all formulae are in black text; all user inputs are in blue text with variable inputs indicated by shading with a light grey background; certain historical information (particularly revenues and expenses) and fi xed inputs have been included to increase the model s usability and is identifi ed by red text shaded with a light grey background; unique formulae that vary from the standard formulae in a row are indicated by red text with no shading; all dates are period end dates unless indicated otherwise; and any MIIF securities that are issued during a period are on issue for the entirety of that period. Structure of the Analyst Model The analyst model is a spreadsheet prepared using Microsoft Excel. The spreadsheet currently contains 15 worksheets, including seven asset worksheets as outlined in the diagram below. The purpose, content and key variable inputs of these worksheets are described in the remainder of this section. MACQUARIE INTERNATIONAL INFRASTRUCTURE FUND LIMITED ANALYST PACK 88 89
96 Using the Analyst Model It is essential that users activate the Analysis ToolPak option within Microsoft Excel in order to operate the model. Users must enter appropriate values into all variable input cells, which contain blue text and a light grey background. When assessing the inputs to be entered, it is imperative that users adhere to the conventions within the model: Values currently entered into these cells are for illustrative purposes only and contain arbitrary values (0 or 1). Users must assess the appropriateness of values in all variable input cells throughout the model; With the exception of growth assumptions, all amounts, regardless of whether they represent infl ows or outfl ows to the asset or entity, should be entered as positive values. The model will convert the inputs as required or indicate that a negative number should be entered; Inputs are to be entered in the units and currencies specifi ed; and All dates are to be the period ending unless otherwise specifi ed. Certain historical information has been included to increase the model s usability. Historical actuals and non-variable inputs are in cells with red text and a light grey background and should not be changed. Where formulae vary across a row, unique cells contain red text and a white background. Worksheet Cover Upon opening the Analyst Model, users will be prompted to accept or reject the terms of the disclaimer. Worksheet Structure This worksheet contains the model structure diagram, with links to specifi c sections. It also includes notes about the use of the model, details of the colour coding and supporting information. Worksheet Economic Inputs This worksheet contains general macroeconomic assumptions, including infl ation, interest rates, risk-free rates and foreign exchange rates. Worksheet Investments and Divestments This worksheet contains information about MIIF s recent divestments and investments and allows the user to consider prospective divestments in non-asian assets such as Arqiva, CAC and MEIF.

97 Worksheet Arqiva This worksheet generates cashfl ow forecasts as well as a value for MIIF s investment in Arqiva. The following table outlines variable inputs that are key drivers of the calculations in this worksheet, as well as notes on these inputs. Section Acquisition Assumptions Escalation Assumptions Description This section shows the acquisition assumptions, including MIIF s percentage of interest in Arqiva Escalation index based on infl ation rate and timing Revenue Assumptions Operating Expense Assumptions Capital Expenditure Assumptions Other Cash Flow Assumptions Financing Assumptions Equity Assumptions This sections allows the user to make assumptions on the revenue growth rates. Publicly available historical revenue breakdown has been provided for the user This section allows the user to make assumptions on the operating expense growth rates. Publicly available historical expenses have been provided for the user This section allows the user to make assumptions about the real growth and maintenance capital expenditure This section allows the user to make assumptions about the amount of synergy savings that may result from the NGW and Arqiva merger. It also allows the user to make any other adjustments that may impact the cash fl ows This section allows the user to make assumptions on the senior debt, junior debt, refi nancing and the capital expenditure facility The user must also select the amount (using a multiple of EBITDA) of the terminal value of Arqiva MACQUARIE INTERNATIONAL INFRASTRUCTURE FUND LIMITED ANALYST PACK 90 91
98 The main calculations are set out in the table below: Section Revenues Operating Expenses Capital Expenditure Debt Shareholder Loan Cashfl ows Distribution Terminal Value MIIF Valuation Key Metrics Description Revenue building blocks are converted to nominal revenues Expense building blocks are converted to nominal expenses Capital expenditure building blocks are converted to nominal capital expenditure Calculation of debt schedules (including refi nancing) and interest expense Calculation of shareholder loan interest semi-annual payments which occurs in June and December This section contains the calculation of the cash from operations, cash for debt service and cash for equity distribution Cash available to shareholders comprised of equity distribution and shareholder loan interest payment. Although the analyst model calculates distributions quarterly, it must be noted that distributions from Arqiva are received semi annually for the period ending December and June. This section determines the terminal value based on the assumptions made in the Equity Assumptions section This section calculates the equity value of MIIF s investment in Arqiva in both GBP and SGD dollars as well as the equity IRR which is intended to represent the realised IRR from the investment since the investment was made, taking into account all cash infl ows (actual distributions received) all cash outfl ows (actual investment made) assuming that the investment is disposed for an amount equal to its valuation as at the valuation date This section calculates the EBITDA margin, Debt Service Coverage Ratio, Gearing Ratio and prospective yield

99 Worksheet 'CAC' This worksheet generates cashfl ow forecasts as well as value for MIIF s investment in CAC. The following table outlines the sections on the variable inputs that are key drivers of the calculations in this worksheet, as well as notes on these inputs. Section Acquisition Assumptions Escalators Description This section shows the acquisition assumptions, including MIIF s percentage of interest in CAC. The equity contribution for Counsel Corporation LTC portfolio add-on acquisition which is to be injected by MIIF in March 2009 has also been modelled This section allows the user to assume the amount by which NPC, PSS, Raw Food and OA rates increase above or below infl ation. Also, the user must assume the nominal amount by which Semi-Private and Private room premiums increase as well as the amount by which revenues and expenses increase above or below infl ation Facilities Summary Operational Assumptions Revenue Assumptions Operating Expense Assumptions Financing Assumptions This section contains information on each LTC Facility. For the homes that are not accredited, the user must assume the date on which each facility becomes accredited, and therefore receives additional funding. Additional rows have been built-in so as to provide the fl exibility to allow for the acquisition of future homes This section allows the user to assume the weighted-average occupancy under the categories of Semi-Private, Private and Total beds for each quarter. Note that it is possible to have an occupancy rate over 100% for basic/ward beds in cases where private rooms are being provided at basic rates. As a check, please see the resultant preferred occupancy rate This sections allows the user to make assumptions on revenue rates, most of which are pre loaded The user may assume overspending in any of the NPC, PSS and Raw Food envelopes. The user must assume the amount of maintenance capital expenditures in each period This section allows the user to assume the margin applicable to the current debt and whether the current debt would be refi nanced at its maturity. The debt facility used to fund the Counsel Corporation LTC portfolio acquisition has been included and the user must also make assumptions as to the margin applicable to this debt. 20% of this debt will be repaid within one year, pro rate by CAC s partners via an equity injection MACQUARIE INTERNATIONAL INFRASTRUCTURE FUND LIMITED ANALYST PACK Equity Assumptions The user must also assume what percentage of free cash fl ow is distributed to the owners of CAC as well as select the amount (using a multiple of EBITDA) of the terminal value of CAC 92 93
100 The main calculations are set out in the table below: Section Revenues Expenses Debt Cash Flow Terminal Value MIIF Valuation Key Metrics Description This section allows the user to assume the percentage of total revenues that are inter-company. Also, the user must assume the amount of Other LTC Revenue, Preferred Health Care Services, and Other Revenue from Retirement Homes and Ontario Long Term Care Providers This section allows the user to assume the amount of expenses in the following categories: Other LTC Expenses (outside of fl ow through envelopes), LTC Property Taxes, Head Offi ce, Preferred Health Care Services, Other Expenses (Retirement Homes and Ontario Long Term Care Providers) Calculation of debt schedules (including refi nancing) and interest expense. The user must assume the timing and amount of the debt repayments This section contains the calculation of the construction funding revenue and cash for debt service, and for equity distribution. Although the analyst model calculates distributions quarterly, it must be noted that distributions from CAC are received monthly This section determines the terminal value based on the assumptions made in the Equity Assumptions section This section calculates the equity value of MIIF s investment in CAC in both CAD and SGD as well as the equity IRR which is intended to represent the realised IRR from the investment since the investment was made, taking into account: all cash infl ows (actual distributions received); all cash outfl ows (actual investment made); and assuming that the investment is disposed for an amount equal to its valuation as at the valuation date This section calculates the EBITDA margin, Debt Service Coverage Ratio, Gearing Ratio and prospective yield

101 Worksheet CXP This worksheet generates cashfl ow forecasts as well as value for MIIF s investment in CXP. The following table outlines the sections on the variable inputs that are key drivers of the calculations in this worksheet, as well as notes on these inputs. Section Acquisition Assumptions Escalation Assumptions Taxation Assumptions Real Average Tariff Assumptions Volume Assumptions Other Revenue Assumptions Operating Expense Assumptions Capital Expenditure Assumptions Financing Assumptions Equity Assumptions Description This section shows the acquisition assumptions, including MIIF s percentage of interest in CXP Escalation index based on infl ation rate and timing This section allows the user to assume the withholding tax rate for the asset Relates to increases in tariffs, which are charged on total volume. The user must assume how much the tariffs would increase by as a % of infl ation This section allows the user to make assumptions on the volume growth for steel, non steel, containers and forestry Other revenue items include dockage, storage, wharfage and other logistics revenue. This section allows the user to make assumptions on the revenue growth for such items This section allows the user to make assumptions on the operating expenses which relates to increases in direct and overhead costs This section allows the user to make assumptions about the total capital expenditure and the percentage of which is allocated to maintenance capital expenditure This section allows the user to make assumptions on the senior debt and refi nancing The user must assume what percentage of free cash fl ow is distributed to shareholders, taking into account that equity distributions are restricted by accumlated net income. The user must also select the amount (using a mulitple of EBITDA) of the terminal value of CXP 94 95
102 The main calculations are set out in the table below: Section Revenues Operating Expenses Capital Expenditure Debt Cashfl ows Bank Account Terminal Value MIIF Valuation Key Metrics Description Revenue building blocks are converted to nominal revenues Expense building blocks are converted to nominal expenses Calculates maintenance capex and growth capex Calculation of debt schedule (including refi nancing) and interest expense This section contains the calculation of the cash from operations, cash for debt service and cash for equity distribution. Although the analyst model calculates distributions quarterly it must be noted that distributions from CXP are received annually for the period ending June Depending on the user's assumption as to the percentage of free cash fl ow distributed to shareholders, there may be some cash remaining in the bank. Not all the cash available for equity is distributed, hence leaving some cash in the bank. This section calculates the closing cash balance and the interest earned on the cash This section determines the terminal value based on the assumptions made in the Equity Assumptions section This section calculates the equity value of MIIF s investment in CXP in both RMB and SGD as well as the equity IRR which is intended to represent the realised IRR from the investment since the investment was made, taking into account: all cash infl ows (actual distributions received); all cash outfl ows (actual investment made); and assuming that the investment is disposed for an amount equal to its valuation as at the valuation date This section calculates the EBITDA margin, Debt Service Coverage Ratio, Gearing ratio and prospective yield

103 Worksheet HNE This worksheet generates cashfl ow forecasts as well as value for MIIF s investment in HNE. The following table outlines the sections on the variable inputs that are key drivers of the calculations in this worksheet, as well as notes on these inputs. Section Acquisition Assumptions Escalation Assumptions Taxation Assumptions Traffi c Assumptions Toll Assumptions Operating Expense Assumptions Capital Expenditure Assumptions Equity Assumptions Financing Assumptions Description This section shows the acquisition assumptions, including MIIF s percentage of interest in HNE Escalation index based on infl ation rate and timing This section allows the user to assume the witholding tax rate for the asset The user must assume the growth in traffi c from the prior corresponding period The toll rate is a weighted average toll rate for each vehicle type. Although MIIF does not expect any increases in the toll rate per km in the short to medium term, since the toll rate used in the model is based on revenue from each vehicle type and the number of vehicles, there may be some fl uctation in the weighted average toll rate between the periods. Hence, the user must assume the growth in the toll rates per vehicle type This section allows the user to make assumptions on the operating expenses which include salaries and administrative expenses. Routine maintenance costs include road body maintenance and electrical and mechanical costs This section allows the user to make assumptions about the real major capital expenditure which includes overlaying the pavement The user must assume what percentage of free cash fl ow is distributed to shareholders taking into account that equity distributions are restricted by accumulated net income This section allows the user to make assumptions on the senior debt and refi nancing. The quantum debt facility and discount on the PBOC rate based on agreed terms with the China Construction Bank (CCB) have been provided to the user. The scheduled repayment profi le agreed with CCB is back-ended, with more debt being repaid in the later years 96 97
104 The main calculations are set out in the table below: Section Revenues Operating Expenses Capital Expenditure Debt Cashfl ows Bank Account MIIF Valuation Key Metrics Description Calculation of total toll revenue Expense building blocks are converted to nominal expenses. Calculation of operating tax which is a tax on toll revenue Calculates major capital expenditure Calculation of debt schedule (including refi nancing) and interest expense This section contains the calculation of the cash from operations, cash for debt service and cash for equity distribution. Although the analyst model calculates distributions quarterly, it must be noted that distributions from HNE are received annually for the period ending December Depending on the user's assumption as to the percentage of free cash fl ow distributed to shareholders, there may be some cash remaining in the bank. Not all the cash available for equity may be distributed as distributions are limited by accumulated net income, hence leaving some cash in the bank. This section calculates the closing cash balance and the interest earned on the cash This section calculates the equity value of MIIF s investment in HNE in both RMB and SGD as well as the equity IRR which is intended to represent the realised IRR from the investment since the investment was made, taking into account: all cash infl ows (actual distributions received); all cash outfl ows (actual investment made); and assuming that the investment is disposed for an amount equal to its valuation as at the valuation date This section calculates the EBITDA margin, Debt Service Coverage Ratio, Gearing Ratio and prospective yield
105 Worksheet infravest This worksheet generates cashfl ow forecasts as well as a value for MIIF s investment in infravest. The following table outlines the sections on the variable inputs that are key drivers of the calculations in this worksheet, as well as notes on these inputs. Section Acquisition Assumptions Escalation Assumptions Taxation Assumptions Revenue Assumptions Operating Expense Assumptions Description This section shows the acquisition assumptions, including MIIF s percentage of interest in infravest Escalation index based on infl ation rate and timing This section allows the user to assume the withholding tax rate for the asset Annual energy generation from infravest is expected to be 181,878 MWh. This amount has been divided equally between the quarters for simplicity. It must be noted however, that energy production may be subject to seasonality, with the autumn and winter months forecast to have higher wind speed than the spring and summer months This section provides the user with the real maintenance cost stipulated in the O&M contract. Other expenses which include land usage and staff salaries, are not signifi cant and must be assumed by the user Financing Assumptions Equity Assumptions This section allows the user to make assumptions on the senior debt and any refi nancing in the future. The quantum of the debt facility and swap rates based on agreed terms have been provided to the user The user must assume what percentage of free cash fl ow is distributed to shareholders taking into account that equity distributions are restricted by accumulated net income. The user must also select the amount (using a multiple of EBITDA) of the terminal value of infravest 98 99
106 The main calculations are set out in the table below: Section Revenues Operating Expenses Debt Cashfl ows Cash Balance Terminal Value MIIF Valuation Key Metrics Description Calculation of total revenue Calculation of debt schedules (including refi nancing) and interest expense Calculation of debt schedule (including refi nancing) and interest expense This section contains the calculation of the cash from operations, cash for debt service and cash for equity distribution. Although the analyst model calculates distributions quarterly, it must be noted that distributions from infravest are received annually for the period ending December Depending on the user s assumption as to the percentage of free cash fl ow distributed to shareholders, there may be some cash remaining in the bank. This section calculates the closing cash balance and the interest earned on the cash This section determines the terminal value based on the assumptions made in the Equity Assumptions section This section calculates the equity value of MIIF s investment in infravest in both NTD and SGD as well as the equity IRR which is intended to represent the realised IRR from the investment since the investment was made, taking into account: all cash infl ows (actual distributions received); all cash outfl ows (actual investment made); and assuming that the investment is disposed for an amount equal to its valuation as at the valuation date. This section calculates the EBITDA margin, Debt Service Coverage Ratio, Gearing Ratio and prospective yield

107 Worksheet TBC This worksheet generates cashfl ow forecasts as well as value for MIIF s investment in TBC. The following table outlines the sections on the variable inputs that are key drivers of the calculations in this worksheet, as well as notes on these inputs. Section Acquisition Assumptions Escalation Assumptions Taxation Assumptions Subscriber Assumptions Revenue Assumptions Operating Expense Assumptions Capital Expenditure Assumptions Other Cash Flow Assumptions Financing Assumptions Equity Assumptions Description This section shows the acquisition assumptions, including MIIF s percentage of interest in TBC Escalation index based on infl ation rate and timing This section allows the user to assume the withholding tax rate for the asset The user must make assume the growth in the number of average subscribers for Basic Cable TV, Premium Digital TV and Broadband. The number of subscribers takes the average between the number of subscribers at the beginning of the period and the number of subscribers at the end of the period The user must assume the growth in the Average Revenue Per User for Basic Cable TV, Premium Digital TV and Broadband This section allows the user to make assumptions on the cost of sales. Publicly available historical information has been provided for the user This section allows the user to make assumptions about the real growth and maintenance capital expenditure This section allows the user to make assumptions about any other cash fl ow assumptions impacting cash fl ow from operations This section allows the user to make assumptions on the senior debt, offshore debt, mezzanine debt, capex facility and refi nancing The user must also assume what percentage of free cash fl ow is distributed to the owners of TBC as well as select the amount (using a multiple of EBITDA) of the terminal value of TBC
108 The main calculations are set out in the table below: Section Revenues Operating Expenses Capital Expenditure Debt Cashfl ows Bank Account Terminal Value MIIF Valuation Key Metrics Description Calculation of total subscriber revenue Expense building blocks are converted to nominal expenses Capital expenditure building blocks are converted to nominal capital expenditure Calculation of debt schedules (including refi nancing) and interest expense This section contains the calculation of the cash from operations, cash for debt service and cash for equity distribution. Although the analyst model calculates distributions quarterly, it must be noted that distributions from TBC are received semi annually for the period ending June and December Depending on the user s assumption as to the percentage of free cash fl ow distributed to shareholders, there may be some cash remaining in the bank. This section calculates the closing cash balance and the interest earned on the cash This section determines the terminal value based on the assumptions made in the Equity Assumptions section This section calculates the equity value of MIIF s investment in TBC in both NTD and SGD as well as the equity IRR which is intended to represent the realised IRR from the investment since the investment was made, taking into account: all cash infl ows (actual distributions received); all cash outfl ows (actual investment made); and assuming that the investment is disposed for an amount equal to its valuation as at the valuation date This section calculates the EBITDA margin, Debt Service Coverage Ratio, Gearing Ratio and prospective yield

109 Worksheet MEIF This worksheet generates cashfl ow forecasts for MEIF, as well as a value for MIIF s equity interest in MEIF. The key drivers of this value are the timing and size of future MEIF drawdowns which have been provided. MIIF is not expected to make further commitments in MEIF. It should be noted that future distributions will refl ect both growth in distributions from existing MEIF investments, as well as distributions from future investments as they are made. A constant dividend growth assumption will be assumed, unless the user inputs forecast semi-annual yield. The main calculations are set out in the table below: Section Equity Valuation Key Metrics Description Calculation of the present value of future dividends for valuation purposes. Actual quarterly valuations in both the local currency (EUR) and SGD have also been provided. The Equity IRR subsequent to the acquisition date refl ects the internal rate of return realised from the investment since the investment was made, taking into account: all cash infl ows (actual distributions received); all cash outfl ows (actual investment made); and assuming that the investment is disposed for an amount equal to its valuation as at the valuation date. Prospective yield MACQUARIE INTERNATIONAL INFRASTRUCTURE FUND LIMITED ANALYST PACK

110 Worksheet MIIF This worksheet demonstrates the cash fl ow and the generation of distributable cash of MIIF, by collecting the distributions of the individual assets and deducting fund-level expenses including management and administration and debt related costs. Share Capital The user must make assumptions as to the percentage increase in MIIF s share price (per quarter), the cost of raising equity and the discount at which the new shares would be issued with a maximum discount rate of 10%. Capital Raising The user must input the amount of equity expected to be raised. Shares on issue will adjust accordingly. Scrip Dividend Scheme (SDS) The implementation of a SDS for MIIF was approved by MIIF shareholders in November In this section, the user is able to assume the percentage of SDS participation. Shares on issue will adjust accordingly.
111 Base Fees Fee Rebates MEIF pay their respective managers a base fee. These managers are also members of MCGL, hence the portion of base fees paid by these funds that is attributed to MIIF s interest is subtracted from base fees payable by MIIF. This section calculates the size of these fee rebates. MIIF Base Fees Under the terms of the management agreement between MIIF and MIMAL, MIIF must compensate MIMAL, a member of the MCGL, through base fees and performance fees. The base fee is payable quarterly and is calculated as 1.5% per annum of MIIF s Net Investment Value. Performance Fees The user must indicate the amount of performance fees earned by MIIF as well as whether the performance fees are taken in cash or scrip by using the drop down menus. Loan Facility MIIF s debt facility of S$440 million (announced on 14 March 2008) is available to meet future drawdowns for acquisitions. Realised proceeds from the disposal of assets are assumed to be used to repay the debt facility. The margin on the interest rate must be assumed by the user. Other Expenses The user must make assumptions as to the real value of MIIF s other operating costs. MIIF Cashfl ow This section calculates the maximum possible dividends that MIIF is able to pay its shareholders. Valuation This section calculates the Net Asset Value Per Security and the dividend per security. The user must make an assumption as to the discount rate to calculate the present value of the forecast dividends per security. MACQUARIE INTERNATIONAL INFRASTRUCTURE FUND LIMITED ANALYST PACK
112 Worksheet Asset Summary This worksheet compiles information from the individual asset worksheets and displays the key components into numerical and graphical outputs. It provides the user with a high level breakdown of the performance of each of the individual assets, on an annual basis, over the given time period. Worksheet Fund Summary This worksheet is an annual summary, presenting the user with both numerical and graphical outputs. This worksheet gives the user a high level overall performance of the fund. Worksheet Data This worksheet compiles information from the individual asset worksheets and calculates proportionally consolidated cash fl ows for the fund, net debt, distributions and valuation. It also complies information which feeds into the Fund Summary and Asset Summary worksheets. Additions to the Analyst Model Should users wish to add further calculations to the Analyst Model, it is recommended that these calculations be incorporated via new worksheets instead of adding them to existing worksheets. In particular, it is recommended that users do not insert additional rows or columns to existing worksheets. This will assist in dealing with future updates to the Analyst Model with minimal disruption.


113 4 MACQUARIE INTERNATIONAL INFRASTRUCTURE FUND LIMITED ANALYST PACK
Investor Presentation
 Investor Presentation 12 16 May 2008 Important Notice Disclaimer Macquarie International Infrastructure Fund Limited (MIIF) is a Bermudian registered mutual fund company listed on the Singapore Exchange
Macquarie International Infrastructure Fund Limited SGX Report for the Quarter and Year ended 31 December 2007
 Macquarie International Infrastructure Fund Limited SGX Report for the Quarter and Year ended 31 December 2007 WS: 13298_1 Unaudited Financial Results= Table of Contents Introduction... 2 Financial Highlights...
Third Quarter 2008 Results Presentation
 MACQUARIE INTERNATIONAL INFRASTRUCTURE FUND Third Quarter 2008 Results Presentation 12 November 2008 MACQUARIE INTERNATIONAL INFRASTRUCTURE FUND Important Notices Disclaimer Macquarie International Infrastructure
Macquarie International Infrastructure Fund Limited
 Macquarie International Infrastructure Fund Limited SGX Quarterly Report for the period ended 31 March 2007 Macquarie Infrastructure Management (Asia) Pty Limited (Manager of Macquarie International Infrastructure
MACQUARIE INTERNATIONAL INFRASTRUCTURE FUND LIMITED
 MACQUARIE INTERNATIONAL INFRASTRUCTURE FUND LIMITED SGX Quarterly Report for the quarter and year ended 31 December 2013 CONTENTS REPORT SUMMARY... 1 REPORT SUMMARY PERFORMANCE REVIEW OF MACQUARIE INTERNATIONAL
Annual General Meeting
 Annual General Meeting 16 April 2009 Important Notices Disclaimer Macquarie International Infrastructure Fund Limited (MIIF) is a Bermudian registered mutual fund company listed on the Singapore Exchange
The Office of the Adjudicator BTS Reference Offer Guidance. 20 February 2015, Version 1.0
 The Office of the Adjudicator BTS Reference Offer Guidance 20 February 2015, Version 1.0 Contents Version History... 3 Definitions... 4 1.Document Purpose:... 6 2.Introduction:... 7 3.Summary of Part B
Annual General Meeting
 MACQUARIE INTERNATIONAL INFRASTRUCTURE FUND LIMITED Annual General Meeting 8 March 2013 Agenda 1 2 3 MIIF Chairman s Address Formal Proceedings Questions Presenter Heng Chiang Meng Heng Chiang Meng 4 Refreshments
MACQUARIE INTERNATIONAL INFRASTRUCTURE FUND LIMITED
 MACQUARIE INTERNATIONAL INFRASTRUCTURE FUND LIMITED SGX Quarterly Report for the quarter and year ended 31 December 2014 CONTENTS REPORT SUMMARY... 1 REPORT SUMMARY... 2 PERFORMANCE REVIEW OF MACQUARIE
Regulatory Accounting Principles and Methodologies 2011/12
 Arqiva Broadcast Holdings Limited (formerly Macquarie UK Broadcast Holdings Limited) Regulatory Accounting Principles and Methodologies Prepared by Regulatory Finance Document Reference: RAPM 2012 Release
Arqiva Group Limited. Regulatory Accounting Principles and Methodologies 2016/17
 Regulatory Accounting Principles and Methodologies 2016/17 Released: 4 October 2017 Arqiva Group Limited Regulatory Accounting Principles and Methodologies 2016/17 Document Reference: RAPM 2017 Release
Arqiva Group Limited (formerly Arqiva Broadcast Holdings Limited) Regulatory Accounting Principles and Methodologies 2015/16
 Regulatory Accounting Principles and Methodologies 2015/16") Regulatory Accounting Principles and Methodologies 2015/16 Released: 27 September 2016 Arqiva Group Limited (formerly Arqiva Broadcast Holdings Limited) Regulatory Accounting Principles and Methodologies
Regulatory Accounting Principles and Methodologies 2015/16 Released: 27 September 2016 Arqiva Group Limited (formerly Arqiva Broadcast Holdings Limited) Regulatory Accounting Principles and Methodologies
Macquarie UK Broadcast Holdings Group. Maintained in accordance with Section 15.5 of the Undertakings Competition Commission
 Macquarie UK Broadcast Holdings Group Regulatory Accounting Principles and Methodologies Maintained in accordance with Section 15.5 of the Undertakings Competition Commission given to the Dated: 17 November
APPENDIX 4E PRELIMINARY FINAL REPORT
 FAIRFAX MEDIA LIMITED ACN 008 663 161 APPENDIX 4E PRELIMINARY FINAL REPORT Results for Announcement to the Market 2 Underlying Trading Performance 3 Compliance Statement 4 Consolidated Income Statement
JUNE QUARTER & HALF YEAR 2014 RESULTS PRESENTATION
 JUNE QUARTER & HALF YEAR 2014 RESULTS PRESENTATION 12 August 2014 IMPORTANT NOTICE AND DISCLAIMER Disclaimer Asian Pay Television Trust (APTT) is a business trust registered under the Business Trusts Act
To: The Issuer Security Trustee, the Rating Agencies and the Paying Agents
 SCHEDULE 7 FORM OF INVESTOR REPORT/QUARTERLY INVESTOR REPORT Template for Investor Report To: The Issuer Security Trustee, the Rating Agencies and the Paying Agents General Overview Arqiva is one of the
Arqiva Broadcast Parent Limited and Arqiva Group Parent Limited
 Arqiva Broadcast Parent Limited and Arqiva Group Parent Limited Financial Report Six months ended 31 December 2014 Arqiva Broadcast Parent Limited and Arqiva Group Parent Limited 1 CONTENTS Page FORWARD
MARCH QUARTER 2014 RESULTS PRESENTATION 6 May 2014
 MARCH QUARTER 2014 RESULTS PRESENTATION 6 May 2014 IMPORTANT NOTICE AND DISCLAIMER Disclaimer Asian Pay Television Trust (APTT) is a business trust registered under the Business Trusts Act (Chapter 31A
Macquarie International Infrastructure Fund Limited (MIIF) MIIF AGREES TO SELL ENTIRE INTEREST IN HUA NAN EXPRESSWAY
 MIIF AGREES TO SELL ENTIRE INTEREST IN HUA NAN EXPRESSWAY") Macquarie International Infrastructure Fund Limited EC36305 Penboss Building 50 Parliament Street 2nd Floor Hamilton HM 12 BERMUDA Telephone +65 6601 0777 Fax +65 6601 0653 Internet www.macquarie.com/miif
Macquarie International Infrastructure Fund Limited EC36305 Penboss Building 50 Parliament Street 2nd Floor Hamilton HM 12 BERMUDA Telephone +65 6601 0777 Fax +65 6601 0653 Internet www.macquarie.com/miif
Arqiva Broadcast Parent Limited and Arqiva Group Parent Limited
 Arqiva Broadcast Parent Limited and Arqiva Group Parent Limited Financial Report Nine month period ended 31 March 2017 Arqiva Broadcast Parent Limited and Arqiva Group Parent Limited 1 CONTENTS Page FORWARD
Arqiva Broadcast Parent Limited and Arqiva Group Parent Limited
 Arqiva Broadcast Parent Limited and Arqiva Group Parent Limited Financial Report Nine month period ended Arqiva Broadcast Parent Limited and Arqiva Group Parent Limited 1 CONTENTS Page FORWARD LOOKING
Year ending June 2017 presentation. Presenter: Liliana Solomon, Chief Financial Officer Date: 18 th September 2017
 Year ending June 2017 presentation Presenter: Liliana Solomon, Chief Financial Officer Date: 18 th September 2017 1 Disclaimer This presentation has been prepared by and is the sole responsibility of Arqiva
CLASS C MQ GATEWAY GOLD MQ GATEWAY TRUST PRODUCT DISCLOSURE STATEMENT - PART A
 CLASS C MQ GATEWAY GOLD MQ GATEWAY TRUST PRODUCT DISCLOSURE STATEMENT - PART A CLASS C UNITS MQ PORTFOLIO MANAGEMENT LIMITED ABN 55 092 552 611 AFSL NO. 238321 IMPORTANT NOTICE Investments in the MQ Gateway
REGUS GROUP PLC INTERIM REPORT
 REGUS GROUP PLC INTERIM REPORT SIX MONTHS ENDED JUNE 2006 FINANCIAL HIGHLIGHTS FOR THE SIX MONTHS PERIOD ENDED 30 JUNE 2006 (a) REVENUE 302.6m (2005: 216.0m) 40.1% CASH GENERATED FROM OPERATIONS 56.6m
Arqiva. Year ending 30 June 2014 results presentation. Copyright Arqiva Limited
 Arqiva Year ending 30 June 2014 results presentation Copyright Arqiva Limited 2014 1 Disclaimer This material has been prepared by and is the sole responsibility of Arqiva Broadcast Holdings Limited and
NOTES TO THE FINANCIAL STATEMENTS
 These notes form an integral part of the fi nancial statements. The fi nancial statements were authorised for issue by the directors on 28 February 2006. 1 Domicile and Activities City Developments Limited
SEPTEMBER QUARTER 2016 RESULTS PRESENTATION
 SEPTEMBER QUARTER RESULTS PRESENTATION 9 November IMPORTANT NOTICE AND DISCLAIMER Disclaimer Asian Pay Television Trust ( APTT ) is a business trust registered under the Business Trusts Act (Chapter 31A
Notes to the consolidated financial statements
 Notes to the consolidated financial statements Overview Strategy Performance Sustainable Business Model Corporate governance Financial statements 1. Group organisation Givaudan SA and its subsidiaries
FSL TRUST MANAGEMENT PTE. LTD. (Incorporated in Singapore) Company Registration No: R DIRECTORS STATEMENT AND FINANCIAL STATEMENTS
 Company Registration No: R DIRECTORS STATEMENT AND FINANCIAL STATEMENTS") Company Registration No: 200702265R DIRECTORS STATEMENT AND FINANCIAL STATEMENTS 31 DECEMBER 2015 31 DECEMBER 2015 CONTENTS PAGE Directors Statement 1-2 Independent Auditors Report 3-4 Statement of Financial
Company Registration No: 200702265R DIRECTORS STATEMENT AND FINANCIAL STATEMENTS 31 DECEMBER 2015 31 DECEMBER 2015 CONTENTS PAGE Directors Statement 1-2 Independent Auditors Report 3-4 Statement of Financial
CLASS D MQ GATEWAY WATER CLASS E MQ GATEWAY ASIA CLASS F MQ GATEWAY AUSTRALIA VS JAPAN CLASS G MQ GATEWAY GLOBAL HINDSIGHT
 CLASS D MQ GATEWAY WATER CLASS E MQ GATEWAY ASIA CLASS F MQ GATEWAY AUSTRALIA VS JAPAN CLASS G MQ GATEWAY GLOBAL HINDSIGHT MQ GATEWAY TRUST PRODUCT DISCLOSURE STATEMENT - PART A CLASS D, CLASS E, CLASS
Shareholders information. Contents for the year ended 31 December Basis of preparation and presentation. Group Equity Value
 Shareholders information for the year ended 31 December 2009 Contents 163 215 163 Basis of preparation and presentation Group Equity Value 174 Group Equity Value 176 Change in Group Equity Value 177 Return
ITV plc Final Results th March 2009
 ITV plc Final Results 2008 4th March 2009 1 Introduction Michael Grade Executive Chairman 2 Agenda Introduction and overview Financial review Current trading and strategic update Michael Grade Ian Griffiths
Arqiva Broadcast Parent Limited and Arqiva Group Parent Limited
 Arqiva Broadcast Parent Limited and Arqiva Group Parent Limited Financial Report Three month period ended 30 September 2017 Arqiva Broadcast Parent Limited and Arqiva Group Parent Limited 1 CONTENTS Page
THE BLACKROCK INFRASTRUCTURE EQUITY STRATEGY INTELLIGENT BY DESIGN
 THE BLACKROCK INFRASTRUCTURE EQUITY STRATEGY INTELLIGENT BY DESIGN the equity infrastructure strategy WHY INFRASTRUCTURE? Infrastructure is one of the world s fastest growing sectors. It includes fundamental
Year ending June 2018 presentation
 Year ending June 2018 presentation Presenter: Jane Aikman, Chief Financial Officer Version: Final 1 Disclaimer This presentation has been prepared by and is the sole responsibility of Arqiva Group Limited
The World...Connected
 The World...Connected DISCLAIMER This presentation has been prepared and published by Vodacom Group (Proprietary) Limited. Vodacom Group (Proprietary) Limited is a private company and as such is not required
Fund Information. Fund Name. Fund Category. Fund Investment Objective. Fund Performance Benchmark. Fund Distribution Policy
 Fund Information Fund Name (PISGIF) Fund Category Equity (Shariah-compliant) Fund Investment Objective To seek capital growth and income by investing in a portfolio of Shariahcompliant growth and dividend
The Comptroller and Auditor General s Report on Accounts to the House of Commons
 HM Treasury The Comptroller and Auditor General s Report on Accounts to the House of Commons The fi nancial stability interventions This is an extract from the Certifi cate and Report of the Comptroller
Group Annual Financial Statements
 Page 54 Annual Financial Statements 1. ACCOUNTING POLICIES The accounting policies of the are set out on pages 35 to 49 2. INTEREST AND SIMILAR INCOME Company 30 June 30 June 30 June 30 June Advances to
Capital Asia. Product Disclosure Statement. The easy way to invest in Asia. Capital Asia. Everything for the DIY investor
 Capital Asia Capital Asia Product Disclosure Statement The easy way to invest in Asia Issued by Commonwealth Bank of Australia ABN 48 123 123 124, AFSL 234945 Issue date 22 May 2006 Everything for the
Statement of Investment Principles
 Statement of Investment Principles July 2009 Contents Introduction 1 Governance of the Pension Protection Fund 2 Strategic management of the Fund s assets 3 Risk measurement and management 4 Investment
UBS Emerging Companies Conference - 17 October 2007
 UBS Emerging Companies Conference - 17 October 2007 October 2007 1 Important Notice This presentation has been prepared by HFA Holdings Limited (HFA) and is supplied on the following conditions which are
Sanlam Annual Report Contents. Basis of preparation and presentation: 167
 Sanlam Annual Report 2008 166 Shareholders information for the year ended 31 December 2008 Contents Basis of preparation and presentation: 167 Group Equity Value: Group Equity Value: 178 Change in Group
ANNUAL GENERAL MEETING 21 April 2016
 ANNUAL GENERAL MEETING 21 April 2016 IMPORTANT NOTICE AND DISCLAIMER Disclaimer Asian Pay Television Trust ( APTT ) is a business trust registered under the Business Trusts Act (Chapter 31A of Singapore)
ESTATE PLANNING IEP CARE & IEP CARE COVER SERVICE OVERVIEW
 ESTATE PLANNING IEP CARE & IEP CARE COVER SERVICE OVERVIEW WELCOME TO INGENIOUS At Ingenious, we believe that preparing for changing circumstances is a cornerstone of sound fi nancial planning especially
For personal use only
 FY16 FULL YEAR RESULTS REVIEW Agenda GROUP RESULTS OVERVIEW BUSINESS UNIT REVIEW OUTLOOK Eastlands Shopping Centre BSA completed the mechanical services upgrade and extension to one 29/08/2016 BSA Limited
MQ gateway trust. Distributor to the Offer
 CLASS A MQ GATEWAY BRIC 100% CLASS B MQ GATEWAY BRIC 90% MQ gateway trust PROduct Disclosure Statement - Part A Distributor to the Offer CLASS A AND CLASS B UNITS MQ PORTFOLIO MANAGEMENT LIMITED ABN 55
MQ Term Plus. Supplementary Product Disclosure Statement 2 October 2007 MACQUARIE BANK LIMITED IMPORTANT INFORMATION
 MACQUARIE BANK LIMITED MQ Term Plus Supplementary Product Disclosure Statement 2 October 2007 IMPORTANT INFORMATION This is a Supplementary Product Disclosure Statement ( SPDS ), and supplements the Product
MARCH QUARTER 2018 RESULTS PRESENTATION 14 May 2018
 MARCH QUARTER 2018 RESULTS PRESENTATION 14 May 2018 IMPORTANT NOTICES AND DISCLAIMER Disclaimer Asian Pay Television Trust ( APTT ) is a business trust registered under the Business Trusts Act (Chapter
ASIAN PAY TELEVISION TRUST SGX QUARTERLY REPORT FOR THE QUARTER AND HALF-YEAR ENDED 30 JUNE 2015
 ASIAN PAY TELEVISION TRUST SGX QUARTERLY REPORT FOR THE QUARTER AND HALF-YEAR ENDED 30 JUNE CONTENTS REPORT SUMMARY... 1 REPORT SUMMARY... 2 PERFORMANCE REVIEW OF ASIAN PAY TELEVISION TRUST... 4 INTRODUCTION...
DBS BANK (HONG KONG) LIMITED. (Incorporated in Hong Kong with limited liability)
 LIMITED. (Incorporated in Hong Kong with limited liability)") DBS BANK (HONG KONG) LIMITED (Incorporated in Hong Kong with limited liability) GROUP INTERIM FINANCIAL DISCLOSURE STATEMENTS FOR THE SIX MONTHS ENDED 30 JUNE 2011 TABLE OF CONTENTS Page Unaudited consolidated
DBS BANK (HONG KONG) LIMITED (Incorporated in Hong Kong with limited liability) GROUP INTERIM FINANCIAL DISCLOSURE STATEMENTS FOR THE SIX MONTHS ENDED 30 JUNE 2011 TABLE OF CONTENTS Page Unaudited consolidated
Consolidated income statement
 Marks and Spencer Group plc Annual report and fi nancial statements 88 Financial statements Consolidated income statement 52 weeks ended 29 March 52 weeks ended 30 March Notes Revenue 2, 3 10,309.7 10,026.8
The Grant Samuel Epoch Global Equity Shareholder Yield Funds
 The Grant Samuel Epoch Global Equity Shareholder Yield Funds Supplementary Product Disclosure Statement Date: 1 November 2009 This document is a Supplementary Product Disclosure Statement dated 1 November
ASIAN PAY TELEVISION TRUST SGX QUARTERLY REPORT FOR THE QUARTER AND YEAR ENDED 31 DECEMBER 2016
 ASIAN PAY TELEVISION TRUST SGX QUARTERLY REPORT FOR THE QUARTER AND YEAR ENDED 31 DECEMBER CONTENTS REPORT SUMMARY... 1 REPORT SUMMARY... 2 PERFORMANCE REVIEW OF ASIAN PAY TELEVISION TRUST... 5 INTRODUCTION...
National Grid Transco. Acquisition of Crown Castle UK
 National Grid Transco Acquisition of Crown Castle UK Roger Urwin Chief Executive Strategic rationale Group strategy focused on network management Gridcom totally consistent with strategy Crown Castle UK
Fund Information. Fund Name. Fund Category. Fund Investment Objective. Fund Performance Benchmark. Fund Distribution Policy
 Fund Information Fund Name (PIEMOF) Fund Category Equity (Shariah-compliant) Fund Investment Objective To achieve capital growth through investments in Shariah-compliant companies with mid and small market
SOUTHERN CROSS AUSTEREO FY17 INVESTOR PRESENTATION. 24 August 2017
 SOUTHERN CROSS AUSTEREO FY17 INVESTOR PRESENTATION 24 August 2017 1 Disclaimer Summary information The material in this presentation has been prepared by Southern Cross Media Group Limited ABN 91 116 024
Product Disclosure Statement
 Product Disclosure Statement UBS Fixed IncomePlus PDS dated 13 February 2008 Issued by UBS AG, Australia Branch ABN 47 088 129 613, AFSL 231087 Important notice This document is a Product Disclosure Statement
GLOBAL INVESTMENTS LIMITED (A mutual fund company incorporated with limited liability in Bermuda)
") GLOBAL INVESTMENTS LIMITED (A mutual fund company incorporated with limited liability in Bermuda) LETTER TO SHAREHOLDERS 27 MARCH 2012 GLOBAL INVESTMENTS LIMITED (A mutual fund company incorporated with
GLOBAL INVESTMENTS LIMITED (A mutual fund company incorporated with limited liability in Bermuda) LETTER TO SHAREHOLDERS 27 MARCH 2012 GLOBAL INVESTMENTS LIMITED (A mutual fund company incorporated with
For personal use only
 Investor Update 1Q17 Overview Half Year to 31 December 2016 Well positioned for growth and diversification. NPAT 1 $5.6 million NPAT 1 (Before merger transaction and restructure costs) $8.2 million Net
NZX IPO MASTERCLASS The Wynyard Listing Story. 5 September 2014
 NZX IPO MASTERCLASS The Wynyard Listing Story 5 September 2014 DISCLAIMER The information provided in this document is a guide only and intended for general information purposes. It shall not constitute
FY RESULTS. July 28, 2017
 FY 206-7 RESULTS July 28, 207 Agenda Highlights 2 Operational performance 3 Financial performance 4 Outlook 2 Delivering or over-delivering on all objectives REVENUES Financial outlook Actual performance
Power your way to higher yields
 Schroder Asian Income SGD Class Power your way to higher yields * Distributions at a variable percentage per annum of the net asset value per unit of the Schroder Asian Income SGD Class (the Fund ) will
Macquarie Communications Infrastructure Group
 Macquarie Communications Infrastructure Comprising Macquarie Communications Infrastructure Trust and its controlled entities, Macquarie Communications Infrastructure Limited and its controlled entities
January - September 2015 Results
 January - September 2015 Results 23 rd October 2015 Disclaimer The information and forward-looking statements contained in this presentation have not been verified by an independent entity and the accuracy,
If you would like more information, please call our Investor Services Team on or visit us online at
 This guide has been created to make investment literature easier to understand and to clarify some of the more common terms. Emphasis has been placed on clarity and brevity rather than attempting to cover
INDEPENDENT AUDITORS REPORT CONSOLIDATED STATEMENT OF CHANGES IN STOCKHOLDERS EQUITY CONSOLIDATED STATEMENT OF INCOME
 INDEPENDENT AUDITORS REPORT CONSOLIDATED STATEMENT OF CHANGES IN STOCKHOLDERS EQUITY To the Shareholders of FirstCaribbean International Bank (Jamaica) Limited We have audited the accompanying fi nancial
Man AHL Diversified (Guernsey)
") Man AHL Diversified (Guernsey) January 2011 AHL a market leading quantitative investment manager Strength through size, capital position, independence and global presence One of the world s largest, independent
Man AHL Diversified (Guernsey) January 2011 AHL a market leading quantitative investment manager Strength through size, capital position, independence and global presence One of the world s largest, independent
ASIAN PAY TELEVISION TRUST SGX QUARTERLY REPORT FOR THE QUARTER ENDED 30 SEPTEMBER 2016
 ASIAN PAY TELEVISION TRUST SGX QUARTERLY REPORT FOR THE QUARTER ENDED 30 SEPTEMBER CONTENTS REPORT SUMMARY... 1 REPORT SUMMARY... 2 PERFORMANCE REVIEW OF ASIAN PAY TELEVISION TRUST... 5 INTRODUCTION...
ASIAN PAY TELEVISION TRUST SGX QUARTERLY REPORT FOR THE QUARTER ENDED 31 MARCH 2016
 ASIAN PAY TELEVISION TRUST SGX QUARTERLY REPORT FOR THE QUARTER ENDED 31 MARCH CONTENTS REPORT SUMMARY... 1 REPORT SUMMARY... 2 PERFORMANCE REVIEW OF ASIAN PAY TELEVISION TRUST... 4 INTRODUCTION... 5 SELECTED
Shin Corporation Plc.
 Shin Corporation Plc. Opportunity Day May 18, 2011 The Leader of Telecommunication and Media in Thailand Opportunity day May 18, 11 Vision We are the leading value creation asset management company in
ANNUAL REPORT & FINANCIAL STATEMENTS TAMILNADU PETROPRODUCTS LIMITED ( )
") ANNUAL REPORT & FINANCIAL STATEMENTS OF WHOLLY OWNED SUBSIDIARY / SUBSIDIARY COMPANIES OF TAMILNADU PETROPRODUCTS LIMITED (2009-10) CERTUS INVESTMENT & TRADING LIMITED (AS AT 31ST DECEMBER 2009) CERTUS
ANNUAL REPORT & FINANCIAL STATEMENTS OF WHOLLY OWNED SUBSIDIARY / SUBSIDIARY COMPANIES OF TAMILNADU PETROPRODUCTS LIMITED (2009-10) CERTUS INVESTMENT & TRADING LIMITED (AS AT 31ST DECEMBER 2009) CERTUS
Rogers Communications Inc.
 Rogers Communications Inc. INTERIM CONDENSED CONSOLIDATED FINANCIAL STATEMENTS (unaudited), 2018 and 2017 Rogers Communications Inc. 1 First Quarter 2018 Rogers Communications Inc. Interim Condensed Consolidated
RBS UK Balanced Sector Index
 RBS UK Balanced Sector Index What is an index? An index is a tool for measuring the performance of a collection of financial assets. It may, for example, be composed of shares in companies from a specific
Appendix 4D. ABN Reporting period Previous corresponding December December 2007
 Integrated Research Limited Appendix 4D Half year report ---------------------------------------------------------------------------------------------------------------------------- Appendix 4D Half year
BT Margin Lending Application
 BT Margin Lending Application Contents 2 Chess explanation 3 Risk disclosure statement 4 Guarantor and Third Party additional risk disclosure statement 5 Privacy disclosure and consent 7 BT Margin Loan
Bendigo Managed Funds
 wealth Bendigo Managed Funds Product Disclosure Statement Dated 30 September 2010 The Responsible Entity and Issuer of the Bendigo Managed Funds is Sandhurst Trustees Limited, ABN 16 004 030 737 AFSL 237906,
ANNUAL REPORT NOTES TO THE CONSOLIDATED FINANCIAL STATEMENTS 1. GROUP PERFORMANCE 1.1 REVENUES 2016 $ $ 000. Note
 ANNUAL REPORT 57 1. GROUP PERFORMANCE 1.1 REVENUES Note Revenue and other income From continuing operations Advertising revenue 283,332 247,163 Services revenue 10,416 11,704 Other revenue 4,855 166 Revenue
NETLINK NBN TRUST AND ITS SUBSIDIARIES
 NETLINK NBN TRUST AND ITS SUBSIDIARIES FINANCIAL STATEMENTS ANNOUNCEMENT For The Third Quarter and 31 December 2018 Contents Page INTRODUCTION... 2 SUMMARY OF THE TRUST GROUP RESULTS... 3 CONSOLIDATED
JAMES MURDOCH CHIEF EXECUTIVE OFFICER FORWARD-LOOKING STATEMENTS
 JAMES MURDOCH CHIEF EXECUTIVE OFFICER FORWARD-LOOKING STATEMENTS This document contains certain forward-looking statements within the meaning of the United States Private Securities Litigation Reform Act
WORLD LEADER IN NARROWBAND MESH NETWORKS. General Meeting Presentation. 2 October 2017
 WORLD LEADER IN NARROWBAND MESH NETWORKS General Meeting Presentation 2 October 2017 1 Disclaimer The information contained in this confidential document ( Presentation ) has been prepared by CyanConnode
Fund Information. Fund Name. Fund Category. Fund Investment Objective. Fund Performance Benchmark. Fund Distribution Policy
 Fund Information Fund Name (PRSF) Fund Category Equity Fund Investment Objective To achieve consistent capital growth over the medium long term period and achieve a steady growth in income. Fund Performance
AMP Capital Advantage Core Infrastructure Fund
 AMP Capital Advantage Core Infrastructure Fund Product Disclosure Statement Issued 15 January 2018 Issued by AMP Capital Funds Management Limited ABN 15 159 557 721 AFSL 426455 Contents About AMP Capital
PRIME MEDIA GROUP LIMITED HALF-YEAR REPORT 31 DECEMBER Contents
 PRIME MEDIA GROUP LIMITED HALF-YEAR REPORT 31 DECEMBER 2012 Contents Appendix 4D Half-Year Financial Report ABN: 97 00 0 7 6 4 86 7 Appendix 4D HALF-YEAR ENDED 31 DECEMBER 2012 Name of entity PRIME MEDIA
January March 2017 Results 28 th April 2017 Q1 2017
 January March 2017 Results 28 th April 2017 Q1 2017 Results January March 2017. 28 th April 2017 2 Disclaimer The information and forward-looking statements contained in this presentation have not been
Wealth Management Explore the potential of Secured Wealth Lending
 Wealth Management Explore the potential of Secured Wealth Lending sc.com/sg The fi nancial fl exibility to meet your needs Our Secured Wealth Lending Facility is an overdraft facility obtained against
For personal use only
 GROWTHPOINT PROPERTIES AUSTRALIA TRUST ARSN 120 121 002 GROWTHPOINT PROPERTIES AUSTRALIA LIMITED ABN 33 124 093 901 AFSL 316409 ASX ANNOUNCEMENT GROWTHPOINT PROPERTIES AUSTRALIA (ASX Code: GOZ) RESULTS
Shin Corporation. Macquarie Thailand Corporate Day. Building a stronger portfolio. Mrs.Siripen Sitasuwan President & Group CFO
 Shin Corporation Macquarie Thailand Corporate Day Mrs.Siripen Sitasuwan President & Group CFO November 30 December 2, 2005 Building a stronger portfolio SHIN Corporation Mkt cap of Bt 111.7bn* (US$2.7bn)
CommInvest Term Deposits
 CommInvest Term Deposits Dated 01 June 2014 General Information & Terms and Conditions This brochure includes: General Information CommInvest Term Deposit Terms & Conditions You should read this brochure
Connected. Always. Arqiva Group Limited Registered number
 Connected. Always. Arqiva Group Limited Registered number 05254001 Annual Report For the year ended 30 June 2017 Annual Report for the year ended 30 June 2017 Corporate information As at the date of this
ASIAN PAY TELEVISION TRUST SGX QUARTERLY REPORT FOR THE QUARTER AND HALF-YEAR ENDED 30 JUNE 2016
 ASIAN PAY TELEVISION TRUST SGX QUARTERLY REPORT FOR THE QUARTER AND HALF-YEAR ENDED 30 JUNE CONTENTS REPORT SUMMARY... 1 REPORT SUMMARY... 2 PERFORMANCE REVIEW OF ASIAN PAY TELEVISION TRUST... 5 INTRODUCTION...
Arqiva Group Limited. (formerly Arqiva Broadcast Holdings Limited) Registered number
 Registered number") (formerly Arqiva Broadcast Holdings Limited) Registered number 05254001 Annual Report and Consolidated Financial Statements For the year ended 30 June 2016 Corporate information As at the date of this
(formerly Arqiva Broadcast Holdings Limited) Registered number 05254001 Annual Report and Consolidated Financial Statements For the year ended 30 June 2016 Corporate information As at the date of this
SES: STEADY DEVELOPMENT THROUGH Q3
 PRESS RELEASE SES: STEADY DEVELOPMENT THROUGH Q3 Luxembourg, 27 October 2010 SES S.A., a leading global satellite operator (Euronext Paris and Luxembourg Stock Exchange: SESG), reports financial performance
Dip IFR. Diploma in International Financial Reporting. Thursday 10 June The Association of Chartered Certified Accountants.
 Diploma in International Financial Reporting Thursday 10 June 2010 Time allowed Reading and planning: Writing: 15 minutes 3 hours This paper is divided into two sections: Section A This ONE question is
MACQUARIE BANK ANNOUNCES 51 PER CENT INTERIM PROFIT INCREASE
 Macquarie Bank Limited ABN 46 008 583 542 No.1 Martin Place Telephone (61 2) 8232 3333 Treasury 8232 3600 Facsimile 8232 4227 Sydney NSW 2000 Facsimile (61 2) 8232 7780 Foreign Exchange 8232 3666 Facsimile
For personal use only. Investor Update. January
 1 Investor Update January 2019 www.aspermont.com The leading media services provider to the global resources industry 2 Aspermont is ASX listed with offices in Australia, UK, Brazil, North America and
30 November 2018 Ordinary Share. Key Portfolio Data. Monthly Commentary. Monthly Return Attribution. Company Information
 Summary The Funding Circle SME Income Fund (the Fund ) is a Guernsey closed-ended investment company listed on the Main Market of the London Stock Exchange. Its investment objective is to provide shareholders
THE TRENDLINES GROUP LTD.
 LTD. (Incorporated in Israel) (Company Registration No. 513970947) The Trendlines Group Ltd. (the Company ) was listed on Catalist of the Singapore Exchange Securities Trading Limited (the SGX-ST ) on
Deutsche Global Infrastructure Fund (TOLLX)
") Global Infrastructure Fund (TOLLX) A step beyond MLPs Important risk information Any fund that concentrates in a particular segment of the market will generally be more volatile than a fund that invests
Global Infrastructure Fund (TOLLX) A step beyond MLPs Important risk information Any fund that concentrates in a particular segment of the market will generally be more volatile than a fund that invests
Basel III Pillar III disclosures
 Basel III Pillar III disclosures 1. EXECUTIVE SUMMARY This report has been prepared in accordance with Pillar III disclosure requirements prescribed by the Central Bank of Bahrain, herein referred to as