Third Quarter Fiscal 2013 Financial Results. June 19, 2013
|
|
|
- Peregrine Gibbs
- 5 years ago
- Views:
Transcription

1 Third Quarter Fiscal 2013 Financial Results June 19, 2013
2 Forward-Looking Statement FORWARD LOOKING STATEMENT: This presentation contains forward-looking statements, including those regarding our anticipated financial results for our third quarter of fiscal year 2013; the anticipated closing date of the Nypro acquisition; the continuation of diversification during the fourth fiscal quarter as the Nypro acquisition is finalized; our generation of $1 billion in cash flow from operations during fiscal year 2013 and our currently expected fourth quarter of fiscal year 2013 net revenue (including that of our segments), core operating income, GAAP operating income, core and GAAP earnings per share results and the components thereof. The statements in this presentation are based on current expectations, forecasts and assumptions involving risks and uncertainties that could cause actual outcomes and results to differ materially. These risks and uncertainties include, but are not limited to: our determination as we finalize our financial results for our third fiscal quarter of fiscal year 2013 that our financial results and conditions differ from our current preliminary unaudited numbers set forth herein; the Nypro transaction failing to close or closing later than expected; our ability to diversify our business during the fourth fiscal quarter; fluctuations in our stock s market price; fluctuations in operating results and cash flows; unexpected, adverse seasonal impacts on demand; changes in macroeconomic conditions, both in the U.S. and internationally; our financial performance during and after the current economic conditions; our ability to maintain and improve costs, quality and delivery for our customers; risks and costs inherent in litigation; whether our realignment of our capacity will adversely affect our cost structure, ability to service customers and labor relations; our ability to take advantage of perceived benefits of offering customers vertically integrated services; changes in technology; competition; anticipated growth for us and our industry that may not occur; managing rapid growth; managing rapid declines in customer demand and other related customer challenges that may occur; our ability to successfully consummate acquisitions and divestitures; managing the integration of businesses we acquire; risks associated with international sales and operations; retaining key personnel; our dependence on a limited number of large customers; business and competitive factors generally affecting the electronic manufacturing services industry, our customers and our business; other factors that we may not have currently identified or quantified; and other risks, relevant factors and uncertainties identified in our Annual Report on Form 10-K for the fiscal year ended August 31, 2012, subsequent Reports on Forms 10-Q and 8-K and our other securities filings. Jabil disclaims any intention or obligation to update or revise any forward-looking statements, whether as a result of new information, future events or otherwise. 2
3 Third Quarter 2013 Income Highlights Three months ended May 31, 2013 May 31, 2012 Net revenue $4,467.8 $4,250.9 GAAP operating income GAAP net income GAAP diluted earnings per share $103.7 $50.1 $0.24 $156.6 $101.3 $0.48 Core operating income 1 Core earnings 4 Core diluted earnings per share 2 $176.9 $115.6 $0.56 $190.3 $134.4 $0.64 (In millions, except EPS) 3


4 Third Quarter 2013 Segment Results Diversified Manufacturing 40% Annual decrease of 4% Core operating income 1 5.6% Enterprise & Infrastructure 31% Annual increase of 4% Core operating income 1 2.3% High Velocity 29% Annual increase of 23% Core operating income 1 3.4% Total Company Annual increase of 5% Core operating income 1 4% Specialized Services 25% Healthcare & Instrumentation 5% Industrial & Clean Tech 10% 4
5 Year-over-Year Performance Nine Months Ended Q3 FY13 Q3 FY12 Cash Balance $1,352M $742M Cash Flow from Operations $810M $192M EBITDA 3 $825M $810M EBITDA 3 as % of Revenue 6.1% 6.3% Core ROIC 7 23% 26% 5
6 Business Update Net Capital Expenditures Q3 CapEx: $80M Tracking to $700M in FY 2013 Acquisition of Nypro Regulatory and Anti-Trust approvals obtained Anticipated to close on July 1,
7 Restructuring Summary Non-Cash Charges Q3 FY 2013 Q4 FY 2013 FY 2014 FY 2015 $5M $8M $14M $18M Cash Charges $23M $60M $60M - Total $28M $68M $74M $18M -A majority of the actual cash outlay estimated to be incurred in FY14 7
8 Fourth Quarter Outlook
9 Fourth Fiscal Quarter 2013 Guidance Net Revenue Guidance $4.45B - $4.65B GAAP Operating Income $63M - $83M GAAP Diluted EPS $ $0.12 Core Operating Income 1 $165M - $185M Core Diluted EPS 2 $ $0.58 9
10 Fourth Quarter 2013 Segment Guidance Diversified Manufacturing - estimated to remain consistent year-on-year Enterprise & Infrastructure - estimated to remain consistent year-on-year High Velocity - estimated to increase 15% year-on-year 10
11 CEO Remarks & Business Outlook


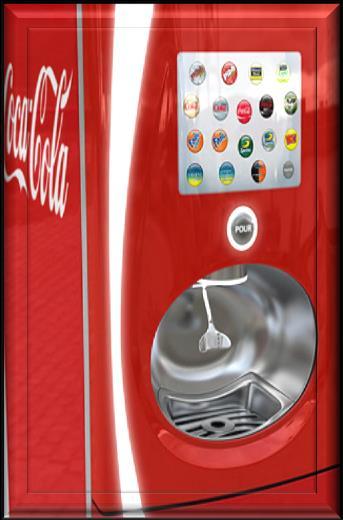
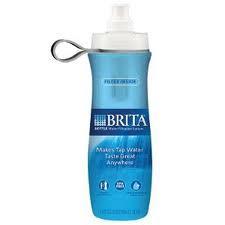

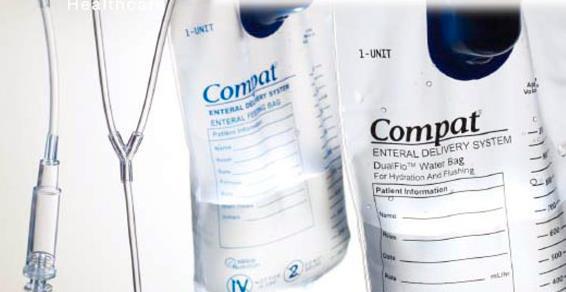
12 Nypro Acquisition Supports Jabil s Diversification Business Mix Healthcare: 50% Packaging: 25% Consumer: 25% 12
13 Jabil Since Fiscal 2006 FY 2006 FY Revenue $10 Billion $18 Billion Employees 75, ,000 Square Footage 15 Million 25 Million Number of Countries Reflects estimates for FY13 13
14 Fiscal Year 2014 Illustration $3.00 $2.80 $2.60 $2.40 $2.20 $2.24 $ $0.22 $ $0.15 $ $0.31 $2.77 $2.00 $1.80 $1.60 $1.40 $1.20 $1.00 FY13 E Nypro Healthcare & Packaging* Restructuring Benefits Organic Growth FY14 E -Illustrative of Core EPS 2 growth in Fiscal Year 2014 *Does not include transaction costs and purchase accounting 14
15 Appendix
16 Third Quarter 2013 Operating Performance Sales, General & Administrative Research & Development Amortization of Intangibles Stock-Based Compensation Net Interest Expense Q $149.1M $6.5M $3.5M $15.7M $31.9M Core Tax Rate 5 21% Capital Expenditures $81.5M 16
17 Quarterly Sectors Percentage of Net Revenue Q4 Q1 Q2 Q3 FY12 FY13 FY13 FY13 Diversified Manufacturing Specialized Services Healthcare & Instrumentation Industrial & Clean Tech 25% 8% 12% 31% 5% 11% 31% 6% 10% 25% 5% 10% Subtotal 45% 47% 47% 40% Enterprise & Infrastructure 30% 30% 31% 31% High Velocity 25% 23% 22% 29% 17
18 Fourth Quarter 2013 Operating Guidance Q Sales, General & Administrative 3.4% Research & Development $7M Amortization of Intangibles $5M Stock-Based Compensation $16M Net Interest Expense $33M Core Tax Rate 5 21% 18
19 Balance Sheet & Ratio Trends Q3 FY12 Q3 FY13 Sales cycle* 12 days 4 days Inventory turns 7 7 Core return on invested capital ROIC 7 24% 22% *Days in accounts receivable + days in inventory days in accounts payable 19
20 Reconciliation of Non-GAAP Financial Measures The financial results disclosed in this presentation include certain measures calculated and presented in accordance with GAAP. In addition to the GAAP financial measures, Jabil provides supplemental, non-gaap financial measures to facilitate evaluation of Jabil s core operating performance. The non-gaap financial measures disclosed in this presentation exclude certain amounts that are included in the most directly comparable GAAP measures. The non- GAAP or core financial measures disclosed in this presentation do not have standard meaning and may vary from non- GAAP financial measures used by other companies. Management believes core financial measures are a useful measure that facilitates evaluating the past and future performance of Jabil s ongoing operations on a comparable basis. Jabil reports core operating income, core return on invested capital, core earnings and core earnings per share to provide investors an additional method for assessing operating income, earnings and earnings per share from what it believes are its core manufacturing operations. 1. Core operating income excludes amortization of intangibles, stock-based compensation expense and related charges, restructuring and related charges, impairment of notes receivable and related charges, goodwill impairment charges, certain distressed customer charges, settlement of receivables and related charges and loss on disposal of subsidiaries. 2. Core EPS excludes amortization of intangibles, stock-based compensation expense and related charges, restructuring and related charges, impairment of notes receivable and related charges, goodwill impairment charges, certain distressed customers charges, settlement of receivables and related charges, loss on disposal of subsidiaries, certain other expenses, net of tax and certain deferred tax valuation allowance charges. 3. Core operating income 1 + depreciation expense. 4. Core Earnings excludes amortization of intangibles, stock-based compensation expense and related charges, restructuring and related charges, impairment of notes receivable and related charges, goodwill impairment charges, certain distressed customers charges, settlement of receivables and related charges, loss on disposal of subsidiaries, certain other expenses, net of tax and certain deferred tax valuation allowance charges. 20
21 Reconciliation of Non-GAAP Financial Measures 5. Core Tax Rate excludes amortization of intangibles, stock-based compensation expense and related charges, restructuring and related charges, impairment of notes receivable and related charges, goodwill impairment charges, certain distressed customers charges, settlement of receivables and related charges, loss on disposal of subsidiaries, certain other expenses, net of tax and certain deferred tax valuation allowance charges. 6. Core operating income 1 / net revenue 7. Year-to-date Core Return on Invested Capital (ROIC) is calculated by annualizing the Company s after-tax non-gaap fiscal year-to-date operating income and dividing that by an average net invested capital asset base. After-tax non- GAAP operating income excludes expenses and charges relating to the amortization of intangibles, stock-based compensation expense and related charges, restructuring and related charges, impairment of notes receivable and related charges, goodwill impairment charges, certain distressed customer charges, settlement of receivables and related charges and loss on disposal of subsidiaries, net of tax. The net invested capital is defined as the sum of the averages of stockholders equity and current and non-current portions of notes payable and long term debt, adjusted for the average cash and cash equivalents. The average is based on the addition of the account balance as of the end of the Company's third fiscal quarter to the account balance as of the end of the Company's prior fiscal year and dividing by two. 8. Free Cash Flow defined as Cash Provided by Operating Activities less Net Cash used in Investing Activities. 9. FCF Yield defined as Free Cash Flow 8 as a percentage of EBITDA. 10. GAAP ROIC defined as ((GAAP operating income * (1 tax rate)) + (interest expense * tax rate))*2)/(average stockholders equity + average notes payable and long-term debt, less current installment + average current installments of notes payable and long-term debt less average cash and cash equivalents). 11. Core EBITDA margin defined as core operating income 1 before depreciation expense divided by net revenue. 21
Fourth Quarter 2018 Earnings and First Quarter 2019 Guidance. September 25th 2018
 Fourth Quarter 2018 Earnings and First Quarter 2019 Guidance September 25th 2018 FORWARD LOOKING STATEMENTS Forward Looking Statements: These presentations contain forward-looking statements, including
SECOND QUARTER 2018 EARNINGS PRESENTATION MARCH 15, 2018
 SECOND QUARTER 2018 EARNINGS PRESENTATION MARCH 15, 2018 FORWARD LOOKING STATEMENTS Forward Looking Statements: This presentation contains forward-looking statements, including those regarding our anticipated
Fourth Quarter 2017 Earnings Review. September 27, 2017
 Fourth Quarter 2017 Earnings Review September 27, 2017 Forward-Looking Statements 2 Forward Looking Statements: This presentation contains forward-looking statements, including those regarding our anticipated
FY18 Earnings & Investor Briefing. September 25 th 2018
 FY18 Earnings & Investor Briefing September 25 th 2018 FORWARD LOOKING STATEMENTS Forward Looking Statements: These presentations contain forward-looking statements, including those regarding our anticipated
Jabil Posts Third Quarter Results
 Jabil Posts Third Quarter Results Reaffirms EPS Targets for FY18 and FY19; Extends Capital Return Framework St. Petersburg, FL June 14, 2018. Today, Jabil Inc. (NYSE: JBL), reported preliminary, unaudited
Jabil Posts First Quarter Results
 Jabil Posts First Quarter Results St. Petersburg, FL December 14, 2017. Today Jabil Inc. (NYSE: JBL), reported preliminary, unaudited financial results for its first quarter of fiscal year 2018, including
Jabil Posts Second Quarter Results Reiterates Positive Outlook
 Jabil Posts Second Quarter Results Reiterates Positive Outlook St. Petersburg, FL March 15, 2018. Today Jabil Inc. (NYSE: JBL), reported preliminary, unaudited financial results for its second quarter
October 26, Earnings Summary Third Quarter FY 2016
 October 26, 2016 Earnings Summary Third Quarter FY 2016 SAFE HARBOR Certain information contained in this presentation may constitute forward-looking statements within the meaning of the Private Securities
Digital River, Inc. Fourth Quarter Results (In thousands, except share data) Subject to reclassification
 Subject to reclassification") (In thousands, except share data) Consolidated Balance Sheets (Unaudited) 2012 2011 Assets Current assets Cash and cash equivalents $ 542,851 $ 497,193 Short-term investments 162,794 223,349 Accounts receivable,
(In thousands, except share data) Consolidated Balance Sheets (Unaudited) 2012 2011 Assets Current assets Cash and cash equivalents $ 542,851 $ 497,193 Short-term investments 162,794 223,349 Accounts receivable,
Digital River, Inc. First Quarter Results (In thousands, except share data) Subject to reclassification
 Subject to reclassification") (In thousands, except share data) Consolidated Balance Sheets (Unaudited) December 31, Assets Current assets Cash and cash equivalents $ 500,742 $ 542,851 Short-term investments 144,615 162,794 Accounts
(In thousands, except share data) Consolidated Balance Sheets (Unaudited) December 31, Assets Current assets Cash and cash equivalents $ 500,742 $ 542,851 Short-term investments 144,615 162,794 Accounts
JABIL CIRCUIT, INC. AND SUBSIDIARIES CONDENSED CONSOLIDATED BALANCE SHEETS (in thousands)
") CONDENSED CONSOLIDATED BALANCE SHEETS February 28, 2015 August 31, 2014 ASSETS Current assets: Cash and cash equivalents $ 966,414 $ 1,000,249 Accounts receivable, net 1,269,171 1,208,516 Inventories 2,105,183
CONDENSED CONSOLIDATED BALANCE SHEETS February 28, 2015 August 31, 2014 ASSETS Current assets: Cash and cash equivalents $ 966,414 $ 1,000,249 Accounts receivable, net 1,269,171 1,208,516 Inventories 2,105,183
Bottomline Technologies Reconciliation to Non GAAP Measures Three Months Ended June 30, 2013
 Reconciliation to Measures Three Months Ended June 30, 2013 Non Cash Amortization of Equity Based Integration Restructuring Interest GAAP Intangible Assets Compensation Related Expenses Expenses Expense
2
 1 2 3 4 5 6 Ashland Global Holdings Inc. and Consolidated Subsidiaries Table 1 STATEMENTS OF CONSOLIDATED INCOME (LOSS) (In millions except per share data - preliminary and unaudited) Three months ended
DANA HOLDING CORPORATION Quarterly Financial Information and Reconciliations of Non-GAAP Financial Measures
 Quarterly Financial Information and Reconciliations of Non-GAAP Financial Measures Non-GAAP Financial Measures Adjusted EBITDA is a non-gaap financial measure which we have defined as earnings from continuing
First Quarter Fiscal Quarter Ended December 31, 2016
 First Quarter Fiscal 2017 Quarter Ended December 31, 2016 Safe Harbor Statement Certain statements made during this presentation, including the Company's outlook for the second quarter fiscal year 2017
Fiscal 2019 First Quarter Results. October 30, 2018
 Fiscal 2019 First Quarter Results October 30, 2018 Safe Harbor This presentation contains forward-looking statements within the meaning of Section 27A of the Securities Act of 1933, as amended, and Section
JABIL CIRCUIT, INC. AND SUBSIDIARIES CONDENSED CONSOLIDATED BALANCE SHEETS
 CONDENSED CONSOLIDATED BALANCE SHEETS (In thousands) 2011 2010 ASSETS Current assets: Cash and cash equivalents $ 888,611 $ 744,329 Trade accounts receivable, net 1,100,926 1,408,319 Inventories 2,227,339
CommScope Holding Company, Inc. Condensed Consolidated Statements of Operations (Unaudited -- In thousands, except per share amounts)
") Condensed Consolidated Statements of Operations (Unaudited -- In thousands, except per share amounts) Three Months Ended March 31, 2018 2017 Net sales $ 1,120,517 $ 1,137,285 Operating costs and expenses:
Condensed Consolidated Statements of Operations (Unaudited -- In thousands, except per share amounts) Three Months Ended March 31, 2018 2017 Net sales $ 1,120,517 $ 1,137,285 Operating costs and expenses:
GILAT SATELLITE NETWORKS LTD. CONDENSED CONSOLIDATED STATEMENTS OF OPERATIONS U.S. dollars in thousands (except share and per share data)
") CONDENSED CONSOLIDATED STATEMENTS OF OPERATIONS (except share and per share data) 2016 2015 2016 2015 Audited Revenues $ 279,551 $ 197,543 $ 80,345 $ 67,682 Cost of revenues 204,061 143,318 56,147 47,181
CONDENSED CONSOLIDATED STATEMENTS OF OPERATIONS (except share and per share data) 2016 2015 2016 2015 Audited Revenues $ 279,551 $ 197,543 $ 80,345 $ 67,682 Cost of revenues 204,061 143,318 56,147 47,181
Q2 FY2018 Earnings Call. GAAP to non-gaap Reconciliations. May 17, 2018 EXTERNAL USE
 Q2 FY Earnings Call GAAP to non-gaap Reconciliations May 17, EXTERNAL USE RESULTS Non-GAAP Adjusted Gross Profit Reported gross profit - GAAP basis Certain items associated with acquisitions 1 Non-GAAP
Reconciliation of key non-gaap consolidated financial metrics to Legacy Cypress metrics. Three months ended March 29, 2015 Impact of the merger and
 Reconciliation of key non-gaap consolidated financial metrics to Legacy Cypress metrics Three months ended March 29, 2015 Impact of the merger and Spansion Legacy Consolidated operations Cypress Revenue
Q Preliminary Earnings Results Summary May 3, 2018
 Q1 2018 Preliminary Earnings Results Summary May 3, 2018 SAFE HARBOR STATEMENT This presentation may contain projections or other forward-looking statements within the meaning Section 27A of the Private
2
 News Release 1 2 3 4 5 6 Ashland Global Holdings Inc. and Consolidated Subsidiaries Table 1 STATEMENTS OF CONSOLIDATED INCOME (LOSS) (In millions except per share data - preliminary and unaudited) Three
Second Quarter Fiscal Quarter Ended April 1, 2017
 Second Quarter Fiscal 2017 Quarter Ended April 1, 2017 Safe Harbor Statement Certain statements made during this presentation, including the Company's outlook for the third quarter fiscal year 2017 and
Digital River, Inc. Second Quarter Results (Unaudited, in thousands) Subject to reclassification
 Subject to reclassification") (Unaudited, in thousands) Condensed Consolidated Balance Sheets As of December 31, 2008 2007 Assets: Current assets Cash and cash equivalents $ 276,927 $ 381,788 Short-term investments 201,297 315,636
(Unaudited, in thousands) Condensed Consolidated Balance Sheets As of December 31, 2008 2007 Assets: Current assets Cash and cash equivalents $ 276,927 $ 381,788 Short-term investments 201,297 315,636
Q Preliminary Earnings Results Summary. February 1, 2018
 Q4 2017 Preliminary Earnings Results Summary February 1, 2018 SAFE HARBOR STATEMENT This presentation may contain projections or other forward-looking statements within the meaning Section 27A of the Private
Brooks Automation, Inc. 4 th Quarter Fiscal 2013 Financial Results Conference Call
 Brooks Automation, Inc. 4 th Quarter Fiscal 2013 Financial Results Conference Call November 14, 2013 Safe Harbor Statement Safe Harbor Statement under the U.S. Private Securities Litigation Reform Act
Sanmina. Q1 FY 19 Results. January 28, 2019 WHAT WE MAKE, MAKES A DIFFERENCE
 Sanmina Q1 FY 19 Results January 28, 2019 WHAT WE MAKE, MAKES A DIFFERENCE Concept to Delivery / Advanced Technology / Manufacturing & Global Supply Chain Solutions / Systems & Intelligence Safe Harbor
ON SEMICONDUCTOR CORPORATION AND SUBSIDIARIES UNAUDITED CONSOLIDATED STATEMENT OF OPERATIONS (in millions, except per share data)
") UNAUDITED CONSOLIDATED STATEMENT OF OPERATIONS (in millions, except per share data) March 28, 2014 Quarter Ended December 31, 2013 March 29, 2013 Revenues $ 706.5 $ 718.0 $ 661.0 Cost of revenues 455.7
UNAUDITED CONSOLIDATED STATEMENT OF OPERATIONS (in millions, except per share data) March 28, 2014 Quarter Ended December 31, 2013 March 29, 2013 Revenues $ 706.5 $ 718.0 $ 661.0 Cost of revenues 455.7
Q Preliminary Earnings Results Summary. November 1, 2018
 Q3 2018 Preliminary Earnings Results Summary November 1, 2018 SAFE HARBOR STATEMENT This presentation may contain projections or other forward-looking statements within the meaning Section 27A of the Private
Sanmina. Q2 FY 18 Results. April 23, 2018 WHAT WE MAKE, MAKES A DIFFERENCE
 Sanmina Q2 FY 18 Results April 23, 2018 WHAT WE MAKE, MAKES A DIFFERENCE Concept to Delivery / Advanced Technology / Manufacturing & Global Supply Chain Solutions / Systems & Intelligence Safe Harbor Statement
Coherent, Inc. Consolidated Statement of Operations - GAAP
 Consolidated Statement of Operations - GAAP (In thousands except percentages and per share data, unaudited) March 31, December 30, September 30, July 1, April 1, December 31, October 1, July 2, April 2,
Conduent Announces Fourth Quarter and Full-Year 2016 Results; Reaffirms Long-Term Outlook
 News from Conduent For Immediate Release Conduent Incorporated 100 Campus Drive Florham Park, NJ. 07932 www.conduent.com Conduent Announces Fourth Quarter and Full-Year 2016 Results; Reaffirms Long-Term
Sanmina. Q3 FY 18 Results. July 30, 2018 WHAT WE MAKE, MAKES A DIFFERENCE
 Sanmina Q3 FY 18 Results July 30, 2018 WHAT WE MAKE, MAKES A DIFFERENCE Concept to Delivery / Advanced Technology / Manufacturing & Global Supply Chain Solutions / Systems & Intelligence Safe Harbor Statement
Q Earnings Presentation
 Q3 2017 Earnings Presentation October 18, 2017 design develop deliver advanced technology Forward-Looking Statements This document contains forward-looking statements within the scope of the Securities
2
 News Release 1 2 3 4 5 6 Ashland Global Holdings Inc. and Consolidated Subsidiaries Table 1 STATEMENTS OF CONSOLIDATED INCOME (In millions except per share data - preliminary and unaudited) Three months
Sanmina. Q4 & FY 18 Results. October 29, 2018 WHAT WE MAKE, MAKES A DIFFERENCE
 Sanmina Q4 & FY 18 Results October 29, 2018 WHAT WE MAKE, MAKES A DIFFERENCE Concept to Delivery / Advanced Technology / Manufacturing & Global Supply Chain Solutions / Systems & Intelligence Safe Harbor
Q Supplement. August 6, 2014
 Q2 2014 Supplement August 6, 2014 Disclaimer Please note that in this presentation, we may discuss events or results that have not yet occurred or been realized, commonly referred to as forward-looking
DOLLAR TREE, INC. REPORTS RESULTS FOR THE THIRD QUARTER FISCAL ~ Sales increased to $4.95 billion and Same-Store Sales increased 2.
 REPORTS RESULTS FOR THE THIRD QUARTER FISCAL 2015 ~ Sales increased to $4.95 billion and Same-Store Sales increased 2.1% ~ CHESAPEAKE, Va. November 24, 2015 Dollar Tree, Inc. (NASDAQ: DLTR), North America's
Q Financial Supplement
 Reconcilation of GAAP and Non-GAAP Financial Measures Non-GAAP Net Income and Non-GAAP EPS (in thousands except per share data) 2014 2015 Three Months Ending June 30, Low Range Guidance (1) High Range
ON SEMICONDUCTOR CORPORATION AND SUBSIDIARIES UNAUDITED CONSOLIDATED STATEMENT OF OPERATIONS (in millions, except per share data)
") ON SEMICONDUCTOR CORPORATION AND SUBSIDIARIES UNAUDITED CONSOLIDATED STATEMENT OF OPERATIONS (in millions, except per share data) Quarter Ended October 2, Year Ended Revenues $ 840.3 $ 904.2 $ 864.2 $
ON SEMICONDUCTOR CORPORATION AND SUBSIDIARIES UNAUDITED CONSOLIDATED STATEMENT OF OPERATIONS (in millions, except per share data) Quarter Ended October 2, Year Ended Revenues $ 840.3 $ 904.2 $ 864.2 $
3 rd Quarter 2018 Earnings Release Conference Call
 3 rd Quarter 2018 Earnings Release Conference Call October 31, 2018 1 2018 Belden Inc. belden.com @beldeninc Safe Harbor Statement Our commentary and responses to your questions may contain forward-looking
Third Quarter 2018 Teleconference Supplemental Data
 Third Quarter 2018 Teleconference Supplemental Data Cautionary Statement Forward-Looking Information This communication contains forward looking statements as that term is defined in the Private Securities
Reconciliation of Non-GAAP Measures
 Earnings Before Interest, Taxes, Depreciation, Amortization and Goodwill & Intangible Asset Impairment Q4-2015 Q4-2016 Net income applicable to TRC Companies, Inc.'s common shareholders $6.8 $5.9 Interest
Selling, general and administrative expenses 35,645 33,787. Net other operating income (292) (270) Operating profit 44,202 17,756
 (270) Operating profit 44,202 17,756") Condensed Interim Consolidated Income Statement For the quarter ended September 30 Continuing operations Revenue 328,071 258,941 Cost of sales 248,516 207,668 Gross profit 79,555 51,273 Selling, general
Condensed Interim Consolidated Income Statement For the quarter ended September 30 Continuing operations Revenue 328,071 258,941 Cost of sales 248,516 207,668 Gross profit 79,555 51,273 Selling, general
Teradyne, Inc. Certain Non-GAAP financial measures discussed during the Third Quarter of 2011 Earnings Conference Call October 2011
 Teradyne, Inc. Certain Non-GAAP financial measures discussed during the Third Quarter of 2011 Earnings Conference Call October 2011 On the Company s earnings conference call on October 27, 2011, the following
Waste Management, Inc. Condensed Consolidated Statements of Operations (In Millions, Except Per Share Amounts) (Unaudited)
 (Unaudited)") Condensed Consolidated Statements of Operations (In Millions, Except Per Share Amounts) Quarters Ended June 30, Operating revenues $ 3,158 $ 2,952 Costs and expenses: Operating 1,996 1,786 Selling, general
Condensed Consolidated Statements of Operations (In Millions, Except Per Share Amounts) Quarters Ended June 30, Operating revenues $ 3,158 $ 2,952 Costs and expenses: Operating 1,996 1,786 Selling, general
Net sales $ 1,890 $ 1,738 $ 7,745 $ 7,467 Cost of sales 1,444 1,406 5,794 5,683 Gross profit ,951 1,784
 Condensed Consolidated Statements of Operations - Unaudited Three Months Ended Twelve Months Ended December 31, December 31, 2012 2011 2012 2011 Net sales $ 1,890 $ 1,738 $ 7,745 $ 7,467 Cost of sales
Pentair Reports Second Quarter 2018 Results
 News Release Pentair Reports Second 2018 Results Second quarter sales of $781 million. Second quarter GAAP EPS of $0.44 and adjusted EPS of $0.71. The company completed the previously announced tax-free
EMERSON AND SUBSIDIARIES CONSOLIDATED OPERATING RESULTS (AMOUNTS IN MILLIONS EXCEPT PER SHARE, UNAUDITED)
") CONSOLIDATED OPERATING RESULTS (AMOUNTS IN MILLIONS EXCEPT PER SHARE, UNAUDITED) Table 1 Quarter Ended March 31 Percent Change Net sales $3,579 $3,574 % Costs and expenses: Cost of sales 2,037 2,017 SG&A
CONSOLIDATED OPERATING RESULTS (AMOUNTS IN MILLIONS EXCEPT PER SHARE, UNAUDITED) Table 1 Quarter Ended March 31 Percent Change Net sales $3,579 $3,574 % Costs and expenses: Cost of sales 2,037 2,017 SG&A
ON SEMICONDUCTOR CORPORATION AND SUBSIDIARIES UNAUDITED CONSOLIDATED STATEMENT OF OPERATIONS (in millions, except per share data)
") UNAUDITED CONSOLIDATED STATEMENT OF OPERATIONS (in millions, except per share data) Revenue $ 1,455.9 $ 1,377.6 $ 1,338.0 $ 2,833.5 $ 2,774.7 Cost of revenue (exclusive of amortization shown below) 900.9
UNAUDITED CONSOLIDATED STATEMENT OF OPERATIONS (in millions, except per share data) Revenue $ 1,455.9 $ 1,377.6 $ 1,338.0 $ 2,833.5 $ 2,774.7 Cost of revenue (exclusive of amortization shown below) 900.9
Gross margin 2,329 2,079 12% 4,516 3,991 13%
 Condensed Consolidated Statements of Income (Loss) and Related Financial Highlights (in millions, except per share amounts and percentages; unaudited) Net revenue: Products $ 10,961 $ 10,938 0% $ 21,144
Parker Hannifin Corporation. 4 th Quarter & Fiscal Year 2018 Earnings Release
 Parker Hannifin Corporation 4 th Quarter & Fiscal Year 2018 Earnings Release August 2, 2018 Forward-Looking Statements and Non-GAAP Financial Measures Forward-looking statements contained in this and other
Fiscal 2018 Fourth Quarter Results. July 26, 2018
 Fiscal 2018 Fourth Quarter Results July 26, 2018 Safe Harbor This presentation contains forward-looking statements within the meaning of Section 27A of the Securities Act of 1933, as amended, and Section
Q Financial Results
 Q2 2018 Financial Results August 1, 2018 Copyright Fortinet Inc. All rights reserved. Safe Harbor Statement Information, statements and projections contained in these presentation slides and related conference
CORNING INCORPORATED AND SUBSIDIARY COMPANIES CONSOLIDATED STATEMENTS OF INCOME (Unaudited; in millions, except per share amounts)
") CONSOLIDATED STATEMENTS OF INCOME (Unaudited; in millions, except per share amounts) Three Months Ended Nine Months Ended September 30, September 30, 2018 2017 2018 2017 Net sales $ 3,008 $ 2,607 $ 8,255
CONSOLIDATED STATEMENTS OF INCOME (Unaudited; in millions, except per share amounts) Three Months Ended Nine Months Ended September 30, September 30, 2018 2017 2018 2017 Net sales $ 3,008 $ 2,607 $ 8,255
Waste Management, Inc. Condensed Consolidated Statements of Operations (In Millions, Except Per Share Amounts) (Unaudited)
 (Unaudited)") Condensed Consolidated Statements of Operations (In Millions, Except Per Share s) Operating revenues $ 2,935 $ 2,810 Costs and expenses: Operating 1,881 1,725 Selling, general and administrative 351 337
Condensed Consolidated Statements of Operations (In Millions, Except Per Share s) Operating revenues $ 2,935 $ 2,810 Costs and expenses: Operating 1,881 1,725 Selling, general and administrative 351 337
Fourth Quarter and Full-Year 2018 Earnings Call February 20, 2019
 Fourth Quarter and Full-Year 2018 Earnings Call February 20, 2019 1 2019 2017 ServiceSource International, Inc. All rights reserved. Important Information This presentation refers to certain non-gaap financial
Parker Hannifin Corporation. 2 nd Quarter Fiscal Year 2017 Earnings Release
 Parker Hannifin Corporation 2 nd Quarter Fiscal Year 2017 Earnings Release February 2, 2017 Forward-Looking Statements and Non-GAAP Financial Measures Forward-looking statements contained in this and other
VISTEON CORPORATION AND SUBSIDIARIES CONSOLIDATED STATEMENTS OF OPERATIONS (Dollars in Millions, Except Per Share Data) (Unaudited)
 (Unaudited)") CONSOLIDATED STATEMENTS OF OPERATIONS (Dollars in Millions, Except Per Share Data) (Unaudited) Three Months Ended Six Months Ended June 30 June 30 2018 2017 2018 2017 Sales $ 758 $ 774 $ 1,572 $ 1,584
CONSOLIDATED STATEMENTS OF OPERATIONS (Dollars in Millions, Except Per Share Data) (Unaudited) Three Months Ended Six Months Ended June 30 June 30 2018 2017 2018 2017 Sales $ 758 $ 774 $ 1,572 $ 1,584
Q Financial Results
 Q1 2018 Financial Results May 3, 2018 Copyright Fortinet Inc. All rights reserved. Safe Harbor Statement Information, statements and projections contained in these presentation slides and related conference
Second Quarter 2018 Financial Results. July 31, 2018
 Second Quarter 2018 Financial Results July 31, 2018 1 Cautionary Note Regarding Forward- Looking Statements This presentation contains forward-looking statements, including, without limitation, those related
San Jose, California, May 3, 2018 VIAVI (NASDAQ: VIAV) today reported results for its third fiscal quarter ended March 31, 2018.
 today reported results for its third fiscal quarter ended March 31, 2018.") VIAVI ANNOUNCES THIRD QUARTER FISCAL 2018 RESULTS Third Quarter Net revenue of $219.4 million, up $23.4 million or 11.9% year-over-year GAAP operating margin of 0.2%, up 800 bps year-over-year Non-GAAP
VIAVI ANNOUNCES THIRD QUARTER FISCAL 2018 RESULTS Third Quarter Net revenue of $219.4 million, up $23.4 million or 11.9% year-over-year GAAP operating margin of 0.2%, up 800 bps year-over-year Non-GAAP
Q Earnings. October 31, 2018
 Q4 2018 Earnings October 31, 2018 Forward-Looking Statements and Non-GAAP Financial Measures Forward-Looking Statements This presentation contains certain forward-looking statements within the meaning
Pentair Reports Third Quarter 2015 Results
 News Release Pentair Reports Third 2015 Results Third quarter sales of $1.6 billion. Total sales declined 12 percent consisting of a 5 percent decline in core sales and FX translation impact of negative
Coherent, Inc. Consolidated Statement of Operations - GAAP
 Consolidated Statement of Operations - GAAP (In thousands except percentages and per share data, unaudited) April 1, December 31, October 1, July 2, April 2, January 2, October 3, July 4, April 4, December
FY 2018 Second Quarter Earnings Supplemental Information
 FY 2018 Second Quarter Earnings Supplemental Information 09 November 2017 Forward-Looking Statements Certain statements in this presentation and other oral and written statements made by Vista Outdoor
Itron, Inc. Comparison of Key 2015 Financial Metrics to Preliminary Results Announced February 17, Total operating expenses 486, ,839
 Itron, Inc. Comparison of Key 2015 Financial Metrics to Preliminary Results Announced February 17, 2016 (Unaudited, in thousands, except per share data) (announced Feb. 17, 2016) Preliminary FY 2015 Final
August 8, Conduent Q Earnings Results
 August 8, 2018 Conduent Q2 2018 Earnings Results Cautionary Statements Forward-Looking Statements This report contains forward-looking statements, as defined in the Private Securities Litigation Reform
SELLING, GENERAL AND ADMINISTRATIVE EXPENSES 170, ,985 41,506 45,195 86,702 44, ,068 46, ,219 45,556 46,792 92,348 50, ,820
 Unaudited Investors Report 2015 2016 2017 2018 ($ in Thousands, Except Per Share Data) Total Total 1st Qtr 2nd Qtr 6 mos 3rd Qtr 9 mos 4th Qtr Total 1st Qtr 2nd Qtr 6 mos 3rd Qtr 9 mos REVENUE 2,299,321
THE HAIN CELESTIAL GROUP, INC. Consolidated Balance Sheets (In thousands)
") Consolidated Balance Sheets (In thousands) March 31, 2017 (Unaudited) June 30, 2016 ASSETS Current assets: Cash and cash equivalents $ 162,642 $ 127,926 Accounts receivable, net 241,738 278,933 Inventories
Consolidated Balance Sheets (In thousands) March 31, 2017 (Unaudited) June 30, 2016 ASSETS Current assets: Cash and cash equivalents $ 162,642 $ 127,926 Accounts receivable, net 241,738 278,933 Inventories
4 th Quarter 2018 Earnings Release Conference Call
 4 th Quarter 2018 Earnings Release Conference Call February 20, 2019 1 2019 Belden Inc. belden.com @beldeninc Safe Harbor Statement Our commentary and responses to your questions may contain forward-looking
Coherent, Inc. Consolidated Statement of Operations - GAAP
 Consolidated Statement of Operations - GAAP (In thousands except percentages and per share data, unaudited) December 31, October 1, July 2, April 2, January 2, October 3, July 4, April 4, December 27,
Brooks Automation, Inc. Financial Results Conference Call
 Brooks Automation, Inc. 1st Quarter Fiscal2014 Financial Results Conference Call February 6, 2014 Safe Harbor Statement Safe Harbor Statement under the U.S. Private Securities Litigation Reform Act of
CSG SYSTEMS INTERNATIONAL, INC. DISCLOSURES FOR NON-GAAP FINANCIAL MEASURES
 CSG SYSTEMS INTERNATIONAL, INC. DISCLOSURES FOR NON-GAAP FINANCIAL MEASURES Use of Non-GAAP Financial Measures and Limitations To supplement its condensed consolidated financial statements presented in
NetApp Q4 and Fiscal Year 2013 Earnings Results
 NetApp Q4 and Fiscal Year 2013 Earnings Results Supplemental Commentary May 21, 2013 This supplemental commentary is provided concurrently with our earnings press release to allow for additional time to
ADVANCED DISPOSAL ANNOUNCES FIRST QUARTER RESULTS Operating income increases $8.7 million and net income improves $9.1 million versus prior year
 Exhibit 99.1 FOR IMMEDIATE RELEASE ADVANCED DISPOSAL ANNOUNCES FIRST QUARTER RESULTS Operating income increases $8.7 million and net income improves $9.1 million versus prior year PONTE VEDRA, Fla. (May
VISTEON CORPORATION AND SUBSIDIARIES CONSOLIDATED STATEMENTS OF OPERATIONS (Dollars in Millions, Except Per Share Data) (Unaudited)
 (Unaudited)") VISTEON CORPORATION AND SUBSIDIARIES CONSOLIDATED STATEMENTS OF OPERATIONS (Dollars in Millions, Except Per Share Data) (Unaudited) 2018 2017 Sales $ 814 $ 810 Cost of sales (685) (681) Gross margin 129
VISTEON CORPORATION AND SUBSIDIARIES CONSOLIDATED STATEMENTS OF OPERATIONS (Dollars in Millions, Except Per Share Data) (Unaudited) 2018 2017 Sales $ 814 $ 810 Cost of sales (685) (681) Gross margin 129
HealthEquity Reports Fourth Quarter and Fiscal Year Ended January 31, 2018 Financial Results
 HealthEquity Reports Fourth Quarter and Fiscal Year Ended January 31, 2018 Financial Results Highlights of the fiscal year include: Revenue of $229.5 million, an increase of 29% compared to FY17. Net income
ECOLAB FOURTH QUARTER REPORTED DILUTED EPS $1.35 ADJUSTED DILUTED EPS $1.54, +12% 2019 ADJUSTED DILUTED EPS FORECAST $5.80 TO $6.
 News Release Ecolab Inc. 1 Ecolab Place, St. Paul, Minnesota 55102 FOR IMMEDIATE RELEASE Michael J. Monahan (651) 250-2809 Andrew C. Hedberg (651) 250-2185 ECOLAB FOURTH QUARTER REPORTED DILUTED EPS $1.35
Fourth Quarter Earnings Call January 25, 2018
 Fourth Quarter Earnings Call January 25, 2018 Financial Data Charts This presentation consists of L3, Inc. general capabilities and administrative information that does not contain controlled technical
DANAHER CORPORATION RECONCILIATION OF GAAP TO NON-GAAP FINANCIAL MEASURES. Three-Month Period Ending
 RECONCILIATION OF GAAP TO NON-GAAP FINANCIAL MEASURES Adjusted Diluted Net Earnings Per Share from Continuing Operations Diluted Net Earnings Per Share from Continuing Operations (GAAP) Three-Month Period
ON SEMICONDUCTOR CORPORATION AND SUBSIDIARIES UNAUDITED CONSOLIDATED STATEMENT OF OPERATIONS (in millions, except per share data)
") - 1 - UNAUDITED CONSOLIDATED STATEMENT OF OPERATIONS (in millions, except per share data) Quarter Ended Year Ended September 29, 2017 Revenues $ 1,377.5 $ 1,390.9 $ 1,261.0 $ 5,543.1 $ 3,906.9 Cost of
- 1 - UNAUDITED CONSOLIDATED STATEMENT OF OPERATIONS (in millions, except per share data) Quarter Ended Year Ended September 29, 2017 Revenues $ 1,377.5 $ 1,390.9 $ 1,261.0 $ 5,543.1 $ 3,906.9 Cost of
Third Quarter 2018 Financial Results. October 24, 2018
 Third Quarter 2018 Financial Results October 24, 2018 1 Cautionary Note Regarding Forward- Looking Statements This presentation contains forward-looking statements, including, without limitation, those
Third Quarter Financial Results 2018
 Third Quarter Financial Results 2018 October 24, 2018 Safe Harbor / Forward Looking Statements Certain statements made in this presentation are forward-looking statements within the meaning of the federal
December 31, 2017 January 1, 2017
 CYPRESS SEMICONDUCTOR CORPORATION CONDENSED CONSOLIDATED BALANCE SHEETS (In thousands) (Unaudited) December 31, January 1, ASSETS Cash, cash equivalents and short-term investments $ 151,596 $ 120,172 Accounts
HealthEquity Reports Third Quarter Ended October 31, 2017 Financial Results
 HealthEquity Reports Third Quarter Ended 2017 Financial Results Highlights of the third quarter include: Revenue of $56.8 million, an increase of 31% compared to Q3 FY17. Net income of $10.5 million, an
Net sales $258.2 $234.6 $507.3 $469.6 Cost of goods sold Gross profit
 Unaudited Consolidated Statements of Operations Three Months Ended Six Months Ended June 30, June 30, (in millions, except per share data) 2005 2004 2005 2004 Net sales $258.2 $234.6 $507.3 $469.6 Cost
VISTEON CORPORATION AND SUBSIDIARIES CONSOLIDATED STATEMENTS OF OPERATIONS (Dollars in Millions, Except Per Share Data) (Unaudited)
 (Unaudited)") CONSOLIDATED STATEMENTS OF OPERATIONS (Dollars in Millions, Except Per Share Data) (Unaudited) 2016 2015 2016 2015 Sales $ 773 $ 812 $ 1,575 $ 1,628 Cost of sales 664 713 1,345 1,417 Gross margin 109 99
CONSOLIDATED STATEMENTS OF OPERATIONS (Dollars in Millions, Except Per Share Data) (Unaudited) 2016 2015 2016 2015 Sales $ 773 $ 812 $ 1,575 $ 1,628 Cost of sales 664 713 1,345 1,417 Gross margin 109 99
Q Financial Results
 Q4 2016 Financial Results February 2, 2017 Copyright Fortinet Inc. All rights reserved. Safe Harbor Statement Information, statements and projections contained in these presentation slides and related
The J. M. Smucker Company
 The J. M. Smucker Company Second Quarter Fiscal 2019 Earnings SUPPLEMENTARY INFORMATION November 28, 2018 Consolidated Results ($ in millions, except per share data) FY19 Q2 FY18 Q2 YoY Change Net Sales
Parker Hannifin Corporation. 1 st Quarter Fiscal Year 2019 Earnings Release
 Parker Hannifin Corporation 1 st Quarter Fiscal Year 2019 Earnings Release November 1, 2018 Forward-Looking Statements and Non-GAAP Financial Measures Forward-looking statements contained in this and other
ServiceNow, Inc. Condensed Consolidated Statements of Operations (in thousands, except share and per share data)
") Condensed Consolidated Statements of Operations (in thousands, except share and per share data) December 31, 2015 December 31, 2014 December 31, 2015 December 31, 2014 Revenues: Subscription $ 244,702
Condensed Consolidated Statements of Operations (in thousands, except share and per share data) December 31, 2015 December 31, 2014 December 31, 2015 December 31, 2014 Revenues: Subscription $ 244,702
SECOND QUARTER 2018 EARNINGS CONFERENCE CALL
 SECOND QUARTER 2018 EARNINGS CONFERENCE CALL Forward Looking Statements & Non-GAAP Disclaimer The following information may contain forward-looking statements, including forward-looking statements within
CORNING INCORPORATED AND SUBSIDIARY COMPANIES CONSOLIDATED STATEMENTS OF (LOSS) INCOME (Unaudited; in millions, except per share amounts)
 INCOME (Unaudited; in millions, except per share amounts)") CONSOLIDATED STATEMENTS OF (LOSS) INCOME (Unaudited; in millions, except per share amounts) March 31, Net sales $ 2,500 $ 2,375 Cost of sales 1,545 1,424 Gross margin 955 951 Operating expenses:. Selling,
CONSOLIDATED STATEMENTS OF (LOSS) INCOME (Unaudited; in millions, except per share amounts) March 31, Net sales $ 2,500 $ 2,375 Cost of sales 1,545 1,424 Gross margin 955 951 Operating expenses:. Selling,
ADVANCED DISPOSAL ANNOUNCES FOURTH QUARTER RESULTS. Strong cash flow generation and disciplined pricing continues
 Exhibit 99.1 FOR IMMEDIATE RELEASE ADVANCED DISPOSAL ANNOUNCES FOURTH QUARTER RESULTS Strong cash flow generation and disciplined pricing continues PONTE VEDRA, Fla. (February 21, 2019) Advanced Disposal
CYPRESS SEMICONDUCTOR CORPORATION CONDENSED CONSOLIDATED BALANCE SHEETS (In thousands, except per-share data) (Unaudited)
 (Unaudited)") CONDENSED CONSOLIDATED BALANCE SHEETS December 31, January 1, 2006 2006 ASSETS Cash, cash equivalents, and investments ( a ) 642,363 393,788 Accounts receivable, net 163,196 151,213 Inventories 119,184
CONDENSED CONSOLIDATED BALANCE SHEETS December 31, January 1, 2006 2006 ASSETS Cash, cash equivalents, and investments ( a ) 642,363 393,788 Accounts receivable, net 163,196 151,213 Inventories 119,184
Reconciliation of Non-GAAP Items Required by SEC Rules
 2016 ACTUAL RESULTS CVS Health is providing non-gaap information that excludes certain items because of the nature of these items and the impact they have on the analysis of underlying business performance
Twelve Months Ended December 31 (In thousands, except per share amounts)
") CONSOLIDATED STATEMENTS OF OPERATIONS (Unaudited) Three Months Ended (In thousands, except per share amounts) 2012 2011 2012 2011 from continuing operations: Service revenues $ 571,581 $ 640,736 $ 2,340,996
CONSOLIDATED STATEMENTS OF OPERATIONS (Unaudited) Three Months Ended (In thousands, except per share amounts) 2012 2011 2012 2011 from continuing operations: Service revenues $ 571,581 $ 640,736 $ 2,340,996
Pentair Reports Fourth Quarter and Full Year 2013 Results
 News Release Pentair Reports Fourth and Full Year 2013 Results Fourth quarter sales of $1.9 billion. Fourth quarter adjusted EPS grew 62 percent to $0.86. Full year adjusted free cash flow exceeded 110