CENTRAL BANK OF LIBERIA (CBL)
|
|
|
- Edgar Nichols
- 5 years ago
- Views:
Transcription

")


1 CENTRAL BANK OF LIBERIA (CBL) MONTHLY ECONOMIC REVIEW JUN VOLUME 4 No. 6
2 The Monthly Economic Review is produced by the Bank s Research, Policy & Planning Department. Inquiries concerning this publication should be addressed to: The Director Research, Policy & Planning Department Central Bank of Liberia P. O. Box 2048 Ashmun & Lynch Streets, Monrovia, Liberia Contacts: / / Fax: 00(231) Table 2: Performances of End-of-Period WAMZ Exchange Rates against the US Dollar Appr (-)/Depr (+) Currency Jun -17 May-18 Jun-18 MoM YoY GHC GMD GNF 8, , , LRD NGN SLL 7, , , Sources: Central Banks of Liberia and WAMA: LRD Liberian Dollar GHC Ghanaian Cedi GMD Gambian Dalasi GNF Guinean Franc NGN Nigerian Naira SLL Sierra Leonean Leone USD US Dollar 9
3 10 Inflation (In percent) 10a Overall (Year-on-year) Rate of Inflation a. Food and Non-alcoholic Beverages Inflation - Domestic Food Inflation Imported Food Inflation b. Transport Inflation c. Imported Fuels Inflation Overall (Month-on-Month) Rate of Inflation b Core Inflation (In percent) Inflation excluding Food & Non-alcoholic Beverages Inflation excluding Imported Food Inflation excluding Domestic Food Inflation excluding Food and Transport c Production (Metric Tons, Carats and Ounces) Iron Ore 469,047 35, ,466 ± 224,021 ± Gold 16,109 17,301 26,061 12,407 Diamond 10,549 13,473 9, Rubber 5,792 4,467 5,094 4,205 Cement 37,980 43,397 35,731 21,863 Beverages (In Liters) Alcoholic 497, ,591 1,269,040 1,247,654 Non-Alcoholic 931,039 1,042,549 1,045, ,621 Total Beverages Production 1,428,186 2,007,140 2,314,447 2,016,275 * US$ converted to L$ ^With liquidity Effect ** Other Deposits Include Official and Manager Checks ***The Minimum Capital Adequacy Ratio is 10% ****The Required Minimum Liquidity Ratio is 15% Reserves exclude ECF borrowing from the IMF ± Provisional, Preliminary, Estimate Revised Not Available (NA) /1 Average Monthly prices of Dated Brent, West Texas Intermediate & Dubai Fateh OVERVIEW The month of June, 2018 witnessed mixed trends in the production of key commodities in the Liberian economy. Commodities including cement, beverages and diamonds declined, while the production of rubber, iron ore and gold increased. Inflation for the month increased on a year-on-year basis mainly on account of the depreciation of the Liberian dollar (LD), while on a month-on-month basis, inflation declined. In the monetary sector, broad money supply (M2) at end-june, 2018 rose above the stock recorded both in the previous month and the corresponding month a year-on-year with net foreign (NFA) and domestic assets (NDA) trended in opposite directions. Disaggregation of currencies in commercial bank loans to private sector revealed that United States dollar (USD) component increased, while the Liberian dollar component fell, both on month-on-month and year-on-year bases. Average exchange rate of the LD vis-à-vis the USD at the end of the review month depreciated when compared with the previous month ended May, During the review month, the Government of Liberia (GoL) net withdrawal of Liberian Dollars amounted to L$3.5 million through T-bills operations. Key financial soundness indicators of the banking industry continued to show robust performance at end June, GoL s fiscal operations at end-june, 2018 showed a fiscal outturn resulting in a surplus while the stock of public debt rose. On the external front, data showed that Liberia s trade balance relatively improved due to a more than proportionate decrease in import payments vis-à-vis export earnings. The gross foreign reserves position of the CBL rose modestly after experiencing another slight increase in the preceding month. 12 1
4 REAL SECTOR & PRICE DEVELOPMENTS Production Analyses of Key Commodities Statistics from the productive sector revealed that the production of various commodities produced in the Liberian economy during the month of June 2018 showed mixed trends when compared with output during the previous month. Except for iron ore, all key commodities, included gold, diamond, beverages, rubber and cement declined in output during the month. Cement output during the month declined by 13,868 metric tons, from 35,731 metric tons produced a month ago. The 38.8 percent drop in output was mainly a result of the occasioning of the heavy downpour of rain which delayed construction activities. Beverages production fell to 2.0 million litres, from 2.3 million litres produced in May. The 12.9 percent or 298,172 litres reduction in production of the commodity was due to inventory build-up. Diamond production during the review period was 128 carats, down from 13,473 carats produced during the preceding month. The 9,738 carats dip in the production of diamond was attributed to slow down in mining activity in anticipation of the heavy rainfall during the reporting month. Rubber output during the month plummeted to an estimated 4,205 metric tons, from a revised 5,094 metric tons produced in the previous month. The slump in production of rubber was attributed to the declining global price of the commodity. Iron ore production grew to an estimated 224,021 metric tons, up from 208,466 metric tons produced during the preceding month. The estimated rise in iron ore production is attributed to the anticipated increase in the price of the commodity on the global market. Gold output decreased to 12,407 ounces, down from 26,061 ounces produced a month ago. The fall in gold production was attributed to the decline in its global market price. 5 CBL's Foreign Exchange Auction (Millions of US$) US Dollar Amount Sold Total Subscription Over (+)- / Under (-) Subscription CBL Bills Auction (Millions of L$) Bill Issued Bill Redeemed Personal Remittances (Millions of US$) Inflows Outflows Net flows Exchange Rate (USD/LD) End of Period Period Average Financial Soundness Indicators (FSI) (In percent) Capital Adequacy Ratio (CAR)*** Non-performing Loans to Total Loans Non-performing Loans (% change) Returns on Assets (ROA) Returns on Equity (ROE) Liquidity Ratio**** /1 Trade data now sourced from Customs (LRA) with larger coverage than BIVAC. 1 demand deposits exclude manager checks from commercial banks Consumer Prices Year-on-year rate of inflation increased by 3.3 percentage points to 24.6 percent at end-june 2018, up from 21.3 percent at end-may The rise in inflation was attributed to increases in all the major subgroups, especially 2 11
5 4 Monetary (Millions of US$) CBL Net Foreign Exchange Reserves Position (Including SDRs) CBL Gross Foreign Reserves (including SDRs) Liberian Dollars in Circulation 16, , , ,236.1 Money Supply (M1) in L$ only 22, , , ,741.6 Broad money (M2) in L$ only 30, , , ,233.3 Broad money (M2) in both L$ and US$* 87, , , ,801.2 (In percent) Liberian Dollar share of Broad Money Interest Rates - Lending rate Average Deposit rates -Savings Time (In Millions of Currencies) Commercial banks loans to private sector - US$ Commercial banks loans to private sector - L$ 4, , , ,341.8 Demand Deposits of commercial banks Demand deposits - US$ Demand deposits - L$ 6, , , , Time & Savings Deposits of commercial banks Time & savings deposits - US$ Time & savings deposits - L$ 7, , , ,428.4 Other Deposits** Table 1: Fact Sheet Actual US$ component of other deposits Liberian $ component of other deposits Transport, mainly due to the increased in the price of petroleum products. On a monthly basis, the rate of inflation increased by 4.6 percentage points to 5.8 percent from 1.1 percent recorded during the month of May, The rise in monthly inflation rate was mainly attributed to the increase. Some subgroups including Transport, Housing, Water, Electricity, Gas and other Fuels and Restaurant & Hotel. MONETARY DEVELOPMENTS Monetary Policy Stance The monetary policy objective of the Central Bank of Liberia (CBL) for June, 2018 remained securely fixed on price stability through broad exchange rate stability. In seeking to achieve its objective, the CBL intervened in the Foreign exchange market by providing foreign exchange through the regular auction and issuing GoL T-bills as the readily available tools to implement its monetary policy operations. Soon, the CBL aims to create a standing deposit facility as an additional monetary policy tool to help mitigate the persistent pressure on the domestic currency. Monetary Aggregates and Credit Provisional statistics on Broad money supply (M2) at end-june 2018 showed that M2 expanded by 10.2 percent to L$95,801.2 million, from L$86,368.9 million recorded at end-may, This growth was mainly on account of expansions in three key instruments: time & saving deposits, demand deposits and currency outside banks. Time & saving deposits and demand deposits rose by 15.0 percent and 11.6 percent, respectively, while currency outside the banking system grew by 2.0 percent when compared with the previous month. All driven by deterioration in the value of the domestic currency and it s pass through to inflation as well as the general expectation that prices will decline in the nearest future thereby causing people to suspend current spending. However, annual comparison showed that broad money grew by 35.4 percent mainly triggered by significant swell in currency outside banks, demand deposits, time & saving deposits and other deposits 3
6 by 38.8 percent, 33.3 percent, 36.8 percent and percent, respectively. Disaggregation of assets components of monetary aggregates showed that net foreign assets (NFA) and net domestic assets (NDA) drifted in opposite directions at end-june, 2018 when compared with both the preceding month and the same month a year ago. Monthly comparison showed that NFA fell by 0.7 percent, but by 7.6 percent on an annualized basis. The monthly decline in NFA was driven by 10.4 percent contraction in foreign assets of the CBL which marginally outweighed the 16.2 percent expansion in foreign assets of banking institutions, while the annual decline was on account of 8.6 percent and 6.1 percent slowdown in foreign assets of CBL and banking institutions, respectively. NDA which remained relatively low when compared with end-may, 2018 expanded by 14.5 percent at end-june 2018 and by 54.5 percent when compared with the corresponding month in The annual increase was mainly on account of 25.2 percent and 36.2 percent increases in net credit to government and credit to the private sector including credit to NBFIs. NDA also rose on a month-on-month basis as a result of 14.9 percent, 18.1 percent and 23.2 percent increases in net credit to government, credit to the private sector and credit to other assets net, respectively. At end-june, 2018, the US dollar share of commercial bank loans to private sector rose by 11.6 percent to US$406.3 million mainly on account of the stability in the value of the US dollar coupled with the fluctuation in the value of the home currency. The Liberian dollars component fell by 38.4 percent to L$2,574.1 million. Year-on-year comparison showed that the US dollar share grew slightly by 4.1 percent while the Liberian dollar share fell by 31.1 percent, both driven mainly by increases in loan to the Extractive, Manufacturing, Trade and Agriculture sectors (for US$ share) and declines in loans to the Construction, Oil & Gas, Trade sectors as well as Personal loans (for L$ share). This trend of private sector credit is explained by the deterioration in the value of the Liberian dollar coupled with the stable value of the US dollar and the expectation of the public. 4 3 External Trade (Value) (Millions of US$) 3a Exports/ O/w Iron Ore O/w Rubber O/w Mineral o/w Cocoa Bean o/w Palm Oil b Imports (F.O.B)/ Minerals, Fuel, Lubricants O/w Petroleum Products Food and Live Animals (including Animal and vegetable oil) O/w Commercial Rice O/w Non-commercial Rice Machinery & Transport Equipment Import (C.I.F) Trade Balance c External Trade (Volume) (Metric Tons) - Rubber 5,792 4,467 5,094 4,205 -Iron Ore 469, ,000± Commercial Rice 138, ,996± 142, ,171 -Non-commercial Rice 1,188 1,250± 1,266 1,314 - Petroleum Products 2,807 5,621 5,544 4,211 - Cocoa Beans 21, Palm Oil 20, ,215 4,405 17,413 9
7 2 Fiscal Operations 2a Revenue, Expenditure & Debt (Millions of US$) Actual Revenue & Grants Projected Revenue & Grants b Expenditure c Public Debt Stock Domestic External d Treasury Securities (Millions of L$) T- Bills Issued T- Bills Redeemed Net GoL Treasury Bills Operations^ Ave. Weighted Discount Rate_T Bills Bond Issued (2 yrs.) amount in Billion T- Bond Issued T- Bond Settled Net GoL Treasury Bond Operations^ Ave. Weighted Discount Rate_T Bond Source: MFDP, CBL Exchange Rate The average exchange rate of the Liberian dollar vis-à-vis the US dollar at end-june, 2018, depreciated by 6.6 percent to L$143.1/US$1.00. The end-ofperiod (EOP) exchange rate for the same period depreciated by 9.1 percent to L$150.8/US$1.00. Annualized comparison indicated that the average exchange rate depreciated by 27.0 percent and the EOP rate, by 33.3 percent. The continuous increasing demand for the US dollar to facilitate imports coupled with the weak nature of the economy s real sector serve as the basis for the sustained and continuous depreciation of the domestic currency. In the West African Monetary Zone (WAMZ), the EOP rate for all currencies in the Zone depreciated with the exception of the Nigeria Naira at end-june, The Guinean Franc marginally depreciated by 0.08 percent while the Gambian Dalasi, the Sierra Leonean Leone, the Ghana Cedis and the Liberian dollar depreciated by 0.34 percent, 0.98 percent, 2.23 percent and 9.05 percent, respectively. The Nigeria Naira appreciated by 0.05 percent. Year-on-year comparisons of currencies in the WAMZ revealed that only the Nigeria Naira appreciated by 0.03 percent while all other currencies in the zone experienced depreciation (see Table 2). Financial Market Developments For the month ended June, 2018, the Government of Liberia (GoL) T-bill operations amounted to a net withdrawal of L$3.5 million, implying that the CBL, on behalf of the government of Liberia, issued L$69.1 million and redeemed L$65.6 million in the reporting month at a discount rate, of 2.90 percent representing a yield of 4 basis points lower than the yield recorded a month ago. Banking Sector Developments The banking industry s performance at end-june, 2018 was promising as shown by key financial soundness indicators. Capital adequacy ratio 8 5
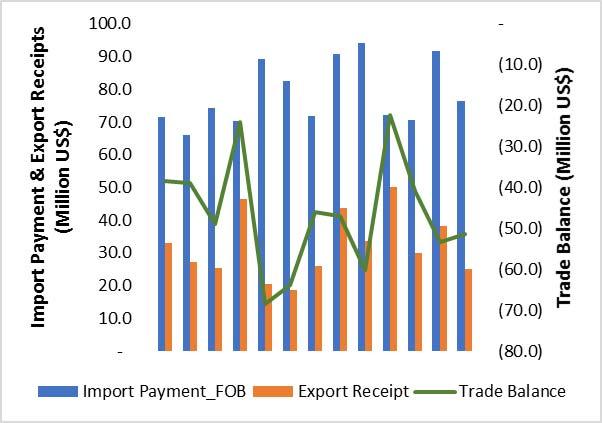
8 (CAR) and liquidity ratio continue to be far beyond the minimum requirements of 10.0 percent and 15.0 percent, respectively. Provisional banking sector data at end-june, 2018 revealed a liquidity ratio of 40.7 percent, compared with 41.5 percent as recorded at end-may, The Sector s CAR preliminarily settled at 27.2 percent compared with the preceding month. Non-performing loans ratio expanded by 17.8 percent to 9.6 percent compared with the figure reported at end-may, In absolute term, the value of non-performing loan grew by 0.4 percent at end-june, 2018, mainly due to creditors confidence to service their loan obligations. FISCAL DEVELOPMENTS Revenue (including Grants) & Expenditures GoL actual fiscal operation in June resulted into a surplus of US$5.4 million compared also with a surplus of US$10.4 million May The slowdown in the surplus recorded in June 2018 was on account of 7.1 percent decline in revenue and grants and a 9.9 percent increase public expenditure. Tax and non-tax revenue & grants accounted for 92.1 percent and 7.9 percent of total revenue and grants during the period under review, respectively. Actual revenue and grants reduced below budgetary projections by US$ 17.9 million during the period under consideration. Recurrent expenditure (including loans and interest payments) and capital expenditure accounted for 99.6 percent and 0.4 percent of total public expenditure, respectively, for the month of June, Liberia s public debt stock for June, 2018 amounted to US$942.6 million, indicating an increase by US$4.6 million (0.5 percent) against the stock of US$938.0 million recorded at end-may, Domestic and external debt stocks constituted 28.2 percent and 71.8 percent of Liberia s total public debt stock at end-june, 2018, respectively (See Table below). EXTERNAL SECTOR DEVELOPMENTS Merchandise Trade Merchandise trade performance at end-june 2018 showed relative improvement. Net trade balance resulted in a deficit of US$50.2 million, a much-improved deficit when compared with the previous month revised deficit of US$53.4 million. The improvement in trade balance for the month was basically a result of declines in both export earnings and import payments Table 1. Imports (FOB) Statistics on import payments during the month of June 2018 showed that payments declined by 16.8 percent to US$76.3 million, from US$91.8 million reported in the previous month. All commodity composition of imports contributed to the fall in payments, but Minerals, Fuel, Lubricants and Food & Live Animals (including animals and vegetable oil) were the major contributing factors to the decline in payments for imports. Exports Preliminary statistics on export earnings during the month of June 2018 showed a decrease of 31.6 percent. Earnings slumped to US$26.2 million, from a revised US$38.3 million recorded at end-may The decrease in export earnings during the month was mainly driven by falls in earnings from mineral (especially gold) which has tended to be a major export commodity and rubber. Receipt from mineral fell by over 50 percent owing to slowdown in mining activities during the month, while that from rubber declined by 12.2 percent due to low production from all the major rubber producers. Gross Foreign Reserves /1 The month-on-month CBL gross FX reserve at end-june 2018 remained relatively stable (only rising modestly) relative to the previous month. Gross foreign reserve climbed by 0.8 percent to US$382.6 million, from US$379.5 million at the end of the preceding month due largely to reductions in the Bank s net liabilities to general government and commercial banks. In term of months of imports, CBL gross forex reserve at end-june, 2018 reflects 3.6 months. /1 Gross International Reserve is being calculated by taking the CBL liquid foreign assets less net liquid liabilities to government and commercial banks plus SDR and Reserve Tranche. 6 7
CENTRAL BANK OF LIBERIA (CBL)
") CENTRAL BANK OF LIBERIA (CBL) MONTHLY ECONOMIC REVIEW SEP. 2017 VOLUME 3 No. 9 The Monthly Economic Review is produced by the Bank s Research, Policy & Planning Department. Inquiries concerning this publication
CENTRAL BANK OF LIBERIA (CBL) MONTHLY ECONOMIC REVIEW SEP. 2017 VOLUME 3 No. 9 The Monthly Economic Review is produced by the Bank s Research, Policy & Planning Department. Inquiries concerning this publication
CENTRAL BANK OF LIBERIA (CBL)
") CENTRAL BANK OF LIBERIA (CBL) MONTHLY ECONOMIC REVIEW OCT. 2017 VOLUME 3 No. 10 The Monthly Economic Review is produced by the Bank s Research, Policy & Planning Department. Inquiries concerning this publication
CENTRAL BANK OF LIBERIA (CBL) MONTHLY ECONOMIC REVIEW OCT. 2017 VOLUME 3 No. 10 The Monthly Economic Review is produced by the Bank s Research, Policy & Planning Department. Inquiries concerning this publication
CENTRAL BANK OF LIBERIA (CBL)
") CENTRAL BANK OF LIBERIA (CBL) MONTHLY ECONOMIC REVIEW DEC. 2017 VOLUME 3 No. 12 The Monthly Economic Review is produced by the Bank s Research, Policy & Planning Department. Inquiries concerning this publication
CENTRAL BANK OF LIBERIA (CBL) MONTHLY ECONOMIC REVIEW DEC. 2017 VOLUME 3 No. 12 The Monthly Economic Review is produced by the Bank s Research, Policy & Planning Department. Inquiries concerning this publication
CENTRAL BANK OF LIBERIA (CBL)
") CENTRAL BANK OF LIBERIA (CBL) MONTHLY ECONOMIC REVIEW JAN. 2018 VOLUME 4 No. 1 The Monthly Economic Review is produced by Research, Policy & Planning Department of the Central Bank of Liberia. Inquiries
CENTRAL BANK OF LIBERIA (CBL) MONTHLY ECONOMIC REVIEW JAN. 2018 VOLUME 4 No. 1 The Monthly Economic Review is produced by Research, Policy & Planning Department of the Central Bank of Liberia. Inquiries
CENTRAL BANK OF LIBERIA (CBL)
") CENTRAL BANK OF LIBERIA (CBL) MONTHLY ECONOMIC REVIEW 138.00 134.00 130.00 126.00 122.00 118.00 114.00 110.00 106.00 102.00 98.00 94.00 90.00 86.00 Jan Feb Mar Apr May Jun Jul Aug Sep Oct Nov Dec Jan Feb
CENTRAL BANK OF LIBERIA (CBL) MONTHLY ECONOMIC REVIEW 138.00 134.00 130.00 126.00 122.00 118.00 114.00 110.00 106.00 102.00 98.00 94.00 90.00 86.00 Jan Feb Mar Apr May Jun Jul Aug Sep Oct Nov Dec Jan Feb
CENTRAL BANK OF LIBERIA (CBL)
") CENTRAL BANK OF LIBERIA (CBL) MONTHLY ECONOMIC REVIEW NOV. 2018 VOLUME 4 No. 11 The Monthly Economic Review is produced by the Central Bank of Liberia (CBL). Inquiries concerning this publication should
CENTRAL BANK OF LIBERIA (CBL) MONTHLY ECONOMIC REVIEW NOV. 2018 VOLUME 4 No. 11 The Monthly Economic Review is produced by the Central Bank of Liberia (CBL). Inquiries concerning this publication should
CENTRAL BANK OF LIBERIA (CBL)
") CENTRAL BANK OF LIBERIA (CBL) MONTHLY ECONOMIC REVIEW JAN. 2019 VOLUME 5 No. 1 The Monthly Economic Review is produced by the Central Bank of Liberia (CBL). Inquiries concerning this publication should
CENTRAL BANK OF LIBERIA (CBL) MONTHLY ECONOMIC REVIEW JAN. 2019 VOLUME 5 No. 1 The Monthly Economic Review is produced by the Central Bank of Liberia (CBL). Inquiries concerning this publication should
CENTRAL BANK OF LIBERIA (CBL)
") CENTRAL BANK OF LIBERIA (CBL) MONTHLY ECONOMIC REVIEW JULY. 2017 VOLUME 3 No. 7 The Monthly Economic Review is produced by the Bank s Research, Policy & Planning Department. Inquiries concerning this publication
CENTRAL BANK OF LIBERIA (CBL) MONTHLY ECONOMIC REVIEW JULY. 2017 VOLUME 3 No. 7 The Monthly Economic Review is produced by the Bank s Research, Policy & Planning Department. Inquiries concerning this publication
MONTHLY ECONOMIC REVIEW
 MONTHLY ECONOMIC REVIEW MAY, 2017 VOLUME 3 No. 5 4 3 2 1 0 1 2 CENTRAL BANK OF LIBERIA (CBL) Exchange Rate (Change) The Monthly Economic Review is produced by the Bank s Research, Policy & Planning Department.
CENTRAL BANK OF LIBERIA (CBL)
") CENTRAL BANK OF LIBERIA (CBL) MONTHLY ECONOMIC REVIEW AUG 2016 VOLUME 2 No. 8 The Monthly Economic Review is produced by the Bank s Research, Policy & Planning Department. Inquiries concerning this publication
CENTRAL BANK OF LIBERIA (CBL) MONTHLY ECONOMIC REVIEW AUG 2016 VOLUME 2 No. 8 The Monthly Economic Review is produced by the Bank s Research, Policy & Planning Department. Inquiries concerning this publication
CENTRAL BANK OF LIBERIA (CBL)
") CENTRAL BANK OF LIBERIA (CBL) MONTHLY ECONOMIC REVIEW March 2016 VOLUME 2 No. 3 The Monthly Economic Review is produced by the Bank s Research, Policy & Planning Department. Inquiries concerning this publication
CENTRAL BANK OF LIBERIA (CBL) MONTHLY ECONOMIC REVIEW March 2016 VOLUME 2 No. 3 The Monthly Economic Review is produced by the Bank s Research, Policy & Planning Department. Inquiries concerning this publication
CENTRAL BANK OF LIBERIA (CBL)
") CENTRAL BANK OF LIBERIA (CBL) MONTHLY ECONOMIC REVIEW JUNE 2016 VOLUME 2 No. 6 The Monthly Economic Review is produced by the Bank s Research, Policy & Planning Department. Inquiries concerning this publication
CENTRAL BANK OF LIBERIA (CBL) MONTHLY ECONOMIC REVIEW JUNE 2016 VOLUME 2 No. 6 The Monthly Economic Review is produced by the Bank s Research, Policy & Planning Department. Inquiries concerning this publication
CENTRAL BANK OF LIBERIA (CBL)
") CENTRAL BANK OF LIBERIA (CBL) MONTHLY ECONOMIC REVIEW JANUARY 2016 VOLUME 2 No. 1 Table 2: Performances of End-of-Period WAMZ Exchange Rates against the US Dollar The Monthly Economic Review is produced
CENTRAL BANK OF LIBERIA (CBL) MONTHLY ECONOMIC REVIEW JANUARY 2016 VOLUME 2 No. 1 Table 2: Performances of End-of-Period WAMZ Exchange Rates against the US Dollar The Monthly Economic Review is produced
FINANCIAL FINANCIAL & ECONOMIC & BULLETIN
 FINANCIAL FINANCIAL & ECONOMIC & BULLETIN ECONOMIC BULLETIN VOLUME 19 No. 2 APRIL JUNE, 2018 April - June, 2018 THE FINANCIAL & ECONOMIC BULLETIN is produced by the Bank s Research, Policy and Planning
BANK OF TANZANIA. Monthly Economic Review
 BANK OF TANZANIA Monthly Economic Review February 2011 1 TABLE OF CONTENTS 1.0 Inflation Developments... 3 Food Supply Situation... 5 2.0 Monetary and Financial Markets Developments... 6 Money Supply and
1.0 BANK OF TANZANIA MONTHLY ECONOMIC REVIEW
 1.0 BANK OF TANZANIA MONTHLY ECONOMIC REVIEW April 2016 Contents 1.0 Inflation and Food Supply Situation... 1 1.1 Inflation Developments... 1 1.2 Food Supply Situation... 1 1.3 Prices of Food Crops...
1.0 BANK OF TANZANIA MONTHLY ECONOMIC REVIEW
 1.0 BANK OF TANZANIA MONTHLY ECONOMIC REVIEW October 2016 Contents 1.0 Inflation and Food Supply Situation... 1 1.1 Inflation Developments... 1 1.2 Food Supply Situation... 2 1.3 Prices of Food Crops...
EC ONO MI C BU LLE TIN
 BANK OF TANZANIA EC ONO MI C BU LLE TIN FOR THE QUARTER ENDING ECONOMIC SEPTEMBER BULLETIN 2018 VOL. L NO. 3 FOR THE QUARTER ENDING SEPTEMBER 2018 VOL. L NO. 3 For any inquiry please contact: Director
Nepal Rastra Bank Research Department
 Nepal Rastra Bank Research Department Current Macroeconomic and Financial Situation of Nepal (Based on Two Months' Data of 2016/17) Economic Outlook 1. Summer crops are expected to improve on account ample
UPDATE ON THE ECONOMIC IMPACT OF THE 2014 EBOLA EPIDEMIC ON LIBERIA, SIERRA LEONE, AND GUINEA
 Public Disclosure Authorized 92860 Public Disclosure Authorized UPDATE ON THE ECONOMIC IMPACT OF THE 2014 EBOLA EPIDEMIC ON LIBERIA, SIERRA LEONE, AND GUINEA DECEMBER 2, 2014 Public Disclosure Authorized
EC ONO MI C BU LLE TIN FOR THE QUARTER ENDING MARCH 2017 VOL. XLIX NO. 1
 EC ONO MI C BU LLE TIN FOR THE QUARTER ENDING MARCH 2017 VOL. XLIX NO. 1 86 BANK OF TANZANIA ECONOMIC BULLETIN FOR THE QUARTER ENDING MARCH 2017 VOL. XLIX NO. 1 For any inquiry please contact: Director
Nicaragua. 1. General trends. 2. Economic policy. The economy grew by 4.5% in 2010, after shrinking by 1.5% in 2009, indicating that Nicaragua
 Economic Survey of Latin America and the Caribbean 2010-2011 197 Nicaragua 1. General trends The economy grew by 4.5% in 2010, after shrinking by 1.5% in 2009, indicating that Nicaragua has recovered from
FINANCIAL & ECONOMIC BULLETIN
 FINANCIAL & ECONOMIC BULLETIN VOLUME 14 No. 4 OCTOBER DECEMBER, 2013 October December, 2013 THE FINANCIAL & ECONOMIC BULLETINis produced by the Bank s Research, Policy and Planning Department. Inquiries
Monthly Report PERFORMANCE OF THE ECONOMY SEPTEMBER 2017 MACROECONOMIC POLICY DEPARTMENT MINISTRY OF FINANCE, PLANNING AND ECONOMIC DEVELOPMENT
 Monthly Report PERFORMANCE OF THE ECONOMY SEPTEMBER 2017 MACROECONOMIC POLICY DEPARTMENT MINISTRY OF FINANCE, PLANNING AND ECONOMIC DEVELOPMENT www.finance.go.ug Table of Contents SUMMARY... 1 REAL SECTOR...
MONETARY POLICY COMMITTEE STATEMENT FOR FIRST QUARTER Governor s Presentation to the Media. 16 th May, 2018
 1 MONETARY POLICY COMMITTEE STATEMENT FOR FIRST QUARTER 2018 Governor s Presentation to the Media 16 th May, 2018 INTRODUCTION 2 The presentation is structured as follows: 1. Decision of the Monetary Policy
Bank of Ghana Monetary Policy Committee Press Release
 Bank of Ghana Monetary Policy Committee Press Release November 26, 2018 Ladies and Gentlemen of the Press, welcome to this morning s press conference following the 85th regular meeting of the Monetary
Nepal Rastra Bank. Research Department. Current Macroeconomic and Financial Situation of Nepal. (Based on Eleven Months' Data of 2016/17)
") Nepal Rastra Bank Research Department Current Macroeconomic and Financial Situation of Nepal Macrofinancial Outlook (Based on Eleven Months' Data of 2016/17) 1. Developments in four areas relating to weather,
Nepal Rastra Bank Research Department Current Macroeconomic and Financial Situation of Nepal Macrofinancial Outlook (Based on Eleven Months' Data of 2016/17) 1. Developments in four areas relating to weather,
PERFORMANCE OF ECONOMY REPORT December 2017
 PERFORMANCE OF ECONOMY REPORT December 2017 MACROECONOMIC POLICY DEPARTMENT MINISTRY OF FINANCE PLANNING AND ECONOMIC DEVELOPMENT www.finance.go.ug TABLE OF CONTENTS LIST OF ACRONYMS... 3 HIGHLIGHTS...
Monthly Report PERFORMANCE OF THE ECONOMY. May 2017 MACROECONOMIC POLICY DEPARTMENT MINISTRY OF FINANCE, PLANNING AND ECONOMIC DEVELOPMENT
 Monthly Report PERFORMANCE OF THE ECONOMY May 2017 MACROECONOMIC POLICY DEPARTMENT MINISTRY OF FINANCE, PLANNING AND ECONOMIC DEVELOPMENT www.finance.go.ug Table of Contents SUMMARY:... 1 REAL SECTOR DEVELOPMENTS:...
HONDURAS. 1. General trends
 Economic Survey of Latin America and the Caribbean 2016 1 HONDURAS 1. General trends Economic growth in Honduras picked up in 2015, reaching 3.6%, compared with 3.1% in 2014. This performance was mainly
EC ONO MI C BU LLE TIN FOR THE QUARTER ENDING DECEMBER 2018 VOL. L NO. 4
 EC ONO MI C BU LLE TIN FOR THE QUARTER ENDING DECEMBER 2018 VOL. L NO. 4 80 BANK OF TANZANIA ECONOMIC BULLETIN FOR THE QUARTER ENDING DECEMBER 2018 VOL. L NO. 4 For any inquiry please contact: Director
BANK OF UGANDA MONTHLY ECONOMIC REVIEW
 BANK OF UGANDA MONTHLY ECONOMIC REVIEW JANUARY 2010 MONTHLY REPORT ON ECONOMIC AND MONETARY DEVELOPMENTS AS AT December 30, 2009 RESEARCH DEPARTMENT BANK OF UGANDA ii TABLE OF CONTENTS TABLE OF CONTENTS.i
MONTHLY ECONOMIC REVIEW
 April 218 a BANK OF TANZANIA MONTHLY ECONOMIC REVIEW April 218 b April 218 April 218 i Contents 1. Inflation and Food Stocks... 1 1.1 Inflation Developments... 1 1.2 Food Stocks... 2 1.3 Prices of Food
Nepal Rastra Bank Research Department
 Nepal Rastra Bank Research Department Current Macroeconomic and Financial Situation of Nepal Macroeconomic Outlook (Based on Three Months' Data of 2017/18) 1. Macroeconomic data available so far suggest
PERFORMANCE OF THE ECONOMY REPORT NOVEMBER 2017
 PERFORMANCE OF THE ECONOMY REPORT NOVEMBER 2017 MACROECONOMIC POLICY DEPARTMENT MINISTRY OF FINANCE, PLANNING AND ECONOMIC DEVELOPMENT www.finance.go.ug Table of Contents SUMMARY... 2 REAL SECTOR DEVELOPMENTS...
Item
 256 POPULATION Total population million; as of 1 July 42.9 45.1 47.0 47.6 47.9 48.0 48.1 48.3 Population density persons per square kilometer 432 454 473 487 490 492 494 487 Population annual change, %
GUATEMALA. 1. General trends
 Economic Survey of Latin America and the Caribbean 2016 1 GUATEMALA 1. General trends In 2015, Guatemala s GDP grew by 4.1% in real terms (a figure similar to the 4.2% recorded the previous year), driven
Monthly Economic Review
 November 14, Volume 8, Issue 11 Outlook for 15 According to revised estimates of the National Bureau of Statistics, real GDP 1 growth is projected to accelerate to 1.5% in 15, up from 8.5% in 14, driven
MONTHLY ECONOMIC REVIEW
 March 218 a BANK OF TANZANIA MONTHLY ECONOMIC REVIEW March 218 b March 218 March 218 i Contents 1. Inflation and Food Stocks... 1 1.1 Inflation Developments... 1 1.2 Food Stocks... 1 1.3 Prices of Food
EC ONO MI C BU LLE TIN FOR THE QUARTER ENDING DECEMBER 2017 VOL. XLIX NO. 4
 EC ONO MI C BU LLE TIN FOR THE QUARTER ENDING DECEMBER 2017 VOL. XLIX NO. 4 BANK OF TANZANIA ECONOMIC BULLETIN FOR THE QUARTER ENDING DECEMBER 2017 VOL. XLIX NO. 4 For any inquiry please contact: Director
MONTHLY ECONOMIC REVIEW
 February 218 a BANK OF TANZANIA MONTHLY ECONOMIC REVIEW February 218 b February 218 February 218 i Contents 1. Inflation and Food Stocks... 1 1.1 Inflation Developments... 1 1.2 Food Stocks... 1 1.3 Prices
GUYANA. 1. General trends
 Economic Survey of Latin America and the Caribbean 2017 1 GUYANA 1. General trends Economic growth in Guyana is estimated to have been 3.3% in 2016, up from 3.2% in 2015. A combination of the largest gold
WEST AFRICAN MONETARY AGENCY (WAMA) Report on Developments in the Exchange Rates of ECOWAS Currencies as at end November 2011
 Report on Developments in the Exchange Rates of ECOWAS Currencies as at end November 2011") WEST AFRICAN MONETARY AGENCY (WAMA) Report on Developments in the Exchange Rates of ECOWAS Currencies as at end November 2011 Freetown, December 2011 Introduction The stabilization of ECOWAS currencies
WEST AFRICAN MONETARY AGENCY (WAMA) Report on Developments in the Exchange Rates of ECOWAS Currencies as at end November 2011 Freetown, December 2011 Introduction The stabilization of ECOWAS currencies
PERU. 1. General trends
 Economic Survey of Latin America and the Caribbean 2015 1 PERU 1. General trends Peru s gross domestic product (GDP) grew by 2.4% in 2014, compared with 5.8% in 2013. This slowdown was due mainly to the
Monetary Policy Report
 CENTRAL BANK OF THE GAMBIA Monetary Policy Report November 20 The Central Bank of The Gambia Monetary Policy Report provides summary of reports presented at the Monetary Policy Committee Meeting. It entails
MONETARY POLICY COMMITTEE STATEMENT FOR THIRD QUARTER Governor s Presentation to the Media. 22 nd November, 2017
 1 MONETARY POLICY COMMITTEE STATEMENT FOR THIRD QUARTER 2017 Governor s Presentation to the Media 22 nd November, 2017 INTRODUCTION 2 The presentation is structured as follows: 1. Decision of the Monetary
MONTHLY ECONOMIC REVIEW
 September 218 a BANK OF TANZANIA MONTHLY ECONOMIC REVIEW September 218 b September 218 September 218 i Contents 1. Inflation and Food Stocks... 1 1.1 Inflation Developments... 1 1.2 Food Stocks... 1 1.3
DOMINICAN REPUBLIC. 1. General trends
 Economic Survey of Latin America and the Caribbean 2016 1 DOMINICAN REPUBLIC 1. General trends The economy of the Dominican Republic grew by 7.0% in 2015, compared with 7.3% in 2014. That growth is driven
GUATEMALA. 1. General trends
 Economic Survey of Latin America and the Caribbean 2014 1 GUATEMALA 1. General trends GDP grew by 3.7% in 2013 in real terms, versus 3.0% in 2012, reflecting the robustness of domestic demand, mainly from
Caleb M Fundanga: Fourth quarter 2010 media briefing
 Caleb M Fundanga: Fourth quarter 2010 media briefing Presented by Dr Caleb M Fundanga, Governor of the Bank of Zambia, Lusaka, 18 February 2011. * * * Executive summary 1. This brief examines monetary
DOMINICAN REPUBLIC. 1. General trends
 Economic Survey of Latin America and the Caribbean 2015 1 DOMINICAN REPUBLIC 1. General trends The economy of the Dominican Republic grew by 7.3% in 2014, compared with 4.8% in 2013, driven by expanding
Current Macroeconomic Situation (Based on the First Three Month's Data of 2009/10)
") Current Macroeconomic Situation (Based on the First Three Month's Data of 2009/10) Monetary Situation Money Supply 1. Broad money (M2) increased by 4.6 percent in the first three months of 2009/10. M2
Current Macroeconomic Situation (Based on the First Three Month's Data of 2009/10) Monetary Situation Money Supply 1. Broad money (M2) increased by 4.6 percent in the first three months of 2009/10. M2
1 RED June/July 2018 JUNE/JULY 2018
 1 RED June/July 20 JUNE/JULY 20 2 RED June/July 20 MAJOR HIGHLIGHTS Headline consumer inflation grew by 4.9 per cent in June 20 compared to 4.8 per cent recorded in May 20 Inflation rate (% y/y) 4.9 (June)
MONTHLY ECONOMIC REVIEW
 October 218 a BANK OF TANZANIA MONTHLY ECONOMIC REVIEW October 218 b October 218 October 218 i Contents 1. Inflation and Food Stocks... 1 1.1 Inflation Developments... 1 1.2 Food Stocks... 1 1.3 Prices
Current Macroeconomic Situation of Nepal
 Current Macroeconomic Situation of Nepal (Based on the Four Months' Data of FY 2012/13) Monetary Situation Money Supply 1. Broad money supply (M2) increased by 4.0 percent during the four months of the
Major Highlights. Recent Economic Developments April/May Central Bank of Swaziland 1
 Major Highlights Annual consumer inflation increased to 7.0 per cent in April 2017 from 6.0 per cent in March 2017. Inflation rate (% y/y) 7.0 (Apr) Discount and prime lending rates remained unchanged
Nepal Rastra Bank Research Department
 Nepal Rastra Bank Research Department Current Macroeconomic and Financial Situation of Nepal (Based on Nine Months' Data of 2017/18) Macroeconomic Outlook 1. As per the recent release of national accounts
Monthly Report PERFORMANCE OF THE ECONOMY JUNE 2018 MACROECONOMIC POLICY DEPARTMENT MINISTRY OF FINANCE, PLANNING AND ECONOMIC DEVELOPMENT
 Monthly Report PERFORMANCE OF THE ECONOMY JUNE 2018 MACROECONOMIC POLICY DEPARTMENT MINISTRY OF FINANCE, PLANNING AND ECONOMIC DEVELOPMENT www.finance.go.ug Table of Contents SUMMARY... 1 REAL SECTOR DEVELOPMENTS...
Monthly Economic and Financial Developments January 2013
 Release Date: 8 March 2013 Monthly Economic and Financial Developments January 2013 In an effort to provide the public with more frequent information on its economic surveillance activities, the Central
EC ONO MI C BU LLE TIN
 BANK OF TANZANIA EC ONO MI C BU LLE TIN FOR THE QUARTER ENDING ECONOMIC JUNE 2018 BULLETIN VOL. L NO. 2 FOR THE QUARTER ENDING JUNE 2018 VOL. L NO. 2 For any inquiry please contact: Director of Economic
MONETARY AND FINANCIAL TRENDS IN THE FIRST NINE MONTHS OF 2013
 MONETARY AND FINANCIAL TRENDS IN THE FIRST NINE MONTHS OF 2013 Introduction This note is to analyze the main financial and monetary trends in the first nine months of this year, with a particular focus
POLICY STATEMENT Consolidating Gains and Charting New Directions: A Strong Financial System for Sustainable Economic Growth
 POLICY STATEMENT 2010 Consolidating Gains and Charting New Directions: A Strong Financial System for Sustainable Economic Growth I. INTRODUCTION This Policy Statement sets out the fundamental objectives
Nepal Rastra Bank Research Department
 Nepal Rastra Bank Research Department Current Macroeconomic and Financial Situation of Nepal Macroeconomic Outlook (Based on Two Months' Data of 2017/18) 1. Notwithstanding the damage caused by flood to
Press Release December adjustment of monetary policy, allowed for a substantial reduction in new credit to Government by the Central Bank.
 Press Release December 2017 Overview During 2017, the Barbados economy continued to face significant macroeconomic challenges associated with declining international reserves, weak public finances and
MONETARY AND FINANCIAL TRENDS IN THE SECOND HALF OF 2012
 MONETARY AND FINANCIAL TRENDS IN THE SECOND HALF OF 2012 The year 2012 recorded a further slowdown in global economic conditions, related to the acuteness of the crisis of confidence, in particular as
BELIZE. 1. General trends
 Economic Survey of Latin America and the Caribbean 2016 1 BELIZE 1. General trends Economic growth fell from 4.1% in 2014 to 1.2% in 2015, as slower activity later in the year pulled down the average for
Monthly Economic Review
 October 214, Volume 8, Issue 1 Outlook for 214 According to the latest estimates from the National Bureau of Statistics, real GDP growth is expected to accelerate to 4.5% in 214, driven mainly by the tourism
MONTHLY ECONOMIC REVIEW
 October 217 a BANK OF TANZANIA MONTHLY ECONOMIC REVIEW October 217 b October 217 October 217 i Contents 1. Inflation and Food Stocks... 1 1.1 Inflation Developments... 1 1.2 Food Stocks... 1 1.3 Prices
CONTENTS. 2. Implementation of monetary policy Inflation Money market Capital market... 10
 CONTENTS 1. Monetary developments... 3 1.1. Factors affecting the development of the money supply... 3 1.2. Structure of the money supply... 5 1.3. Bank lending... 6 1.4. Interest rate development in October
Nepal Rastra Bank Central Office. Current Macroeconomic Situation of Nepal
 Nepal Rastra Bank Central Office Current Macroeconomic Situation of Nepal (Based on the Annual Data of FY 2013/14) Real Sector Gross Domestic Product 1. According to the preliminary estimates of Central
Major Highlights. Recent Economic Developments. September/October,2016. Central Bank of Swaziland 1
 September/October,20 Major Highlights The country s headline inflation increased to 8.3 per cent in Septmber 20 from 8.0 per cent in August 20. Inflation rate (% y/y) 8.3 (Sep) Discount and prime rates
Quarterly Economic Review
 Central Bank of Kenya Quarterly Economic Review April - June 2016 Volume 1 No. 2 OBJECTIVES OF THE CENTRAL BANK OF KENYA The principal objectives of the Central Bank of Kenya (CBK) as established in the
Mauritius Economy Update October 2013
 October 28, 2013 Economics Mauritius Economy Update October 2013 Mauritius, a tropical island situated towards the south east coast of Africa comprises 9 districts Flacq, Grand port, Moka, Pamplemousses,
BANK of ZAMBIA MONETARY POLICY STATEMENT
 BANK of ZAMBIA MONETARY POLICY STATEMENT JULY DECEMBER 2012 Bank of Zambia Mission Statement The principal purpose of the Bank of Zambia is to formulate and implement monetary and supervisory policies
Monthly Economic Review
 September 14, Volume 8, Issue 9 Outlook for 14 According to the latest estimates from the National Bureau of Statistics, real GDP growth is expected to accelerate to 4.5% in 14, driven mainly by the tourism
Economic Survey of Latin America and the Caribbean CHILE. 1. General trends. 2. Economic policy
 Economic Survey of Latin America and the Caribbean 2017 1 CHILE 1. General trends In 2016 the Chilean economy grew at a slower rate (1.6%) than in 2015 (2.3%), as the drop in investment and exports outweighed
1.0 INFLATION DEVELOPMENTS...
 BANK OF TANZANIA Monthly Economic Review November 2009 1 TABLE OF CONTENTS 1.0 INFLATION DEVELOPMENTS... 3 FOOD SUPPLY SITUATION... 5 2.0 MONETARY AND FINANCIAL DEVELOPMENTS... 6 MONEY SUPPLY AND CREDIT
Monthly Economic and Financial Developments February 2007
 Release Date: 3 April Monthly Economic and Financial Developments February In an effort to provide the public with more frequent information on its economic surveillance activities, the Central Bank has
KGkh BANK OF TANZANIA MONTHLY ECONOMIC REVIEW
 KGkh BANK OF TANZANIA MONTHLY ECONOMIC REVIEW June 218 Contents 1. Inflation and Food Stocks... 1 1.1 Inflation Developments... 1 1.2 Food Stocks... 1 1.3 Prices of Food Crops... 2 2. Monetary and Financial
MACROECONOMIC POLICY DEPARTMENT MINISTRY OF FINANCE, PLANNING AND ECONOMIC DEVELOPMENT
 PERFORMANCE OF THE ECONOMY REPORT OCTOBER 2018 MACROECONOMIC POLICY DEPARTMENT MINISTRY OF FINANCE, PLANNING AND ECONOMIC DEVELOPMENT www.finance.go.ug TABLE OF CONTENTS LIST OF TABLES... ii LIST OF FIGURES...
1 RED July/August 2018 JULY/AUGUST 2018
 1 RED July/August 20 JULY/AUGUST 20 2 RED July/August 20 MAJOR HIGHLIGHTS The country s annual consumer inflation remained unchanged at 4.9 per cent in July 20 same as in June 20. Inflation rate (% y/y)
Nepal Rastra Bank Research Department
 Nepal Rastra Bank Research Department Current Macroeconomic and Financial Situation of Nepal (Based on Six Months' Data of 2016/17) Macroeconomic Outlook 1. The current macroeconomic indicators show the
International Monetary Fund Washington, D.C.
 2007 International Monetary Fund May 2007 IMF Country Report No. 07/179 Suriname: Statistical Appendix This Statistical Appendix for Suriname was prepared by a staff team of the International Monetary
CROATIAN NATIONAL BANK. BULLETIN No JANUARY, 2001
 CROATIAN NATIONAL BANK BULLETIN No. 56 - JANUARY, 2001 REAL SECTOR The GDP growth estimate for the third quarter of 2000 confirms the impression of its developments created by the physical volume indicators
Pre-budget economic analysis Key facts and figures
 Pre-budget economic analysis Key facts and figures June 2008 Advisory Table of Contents Page 1 Macro-economic overview 1 2 External sector 10 3 Government finance 16 Appendix 1 - Glossary 21 Section 1
Nepal Rastra Bank Research Department
 Nepal Rastra Bank Research Department Current Macroeconomic and Financial Situation of Nepal (Based on Eight Months' Data of 2017/18) Macroeconomic Outlook 1. The data available so far indicate a mixed
Foreign Trade and Balance of Payments. V{tÑàxÜ f å
 Foreign Trade and Balance of Payments V{tÑàxÜ f å FOREIGN TRADE AND BALANCE OF PAYMENTS Oman's balance of payments position remained comfortable in 2003, with a higher order of surplus in the overall balance
QUARTERLY ECONOMIC REVIEW (QER)
") QUARTERLY ECONOMIC REVIEW (QER) Volume 2 No 4 January - March 2018 OBJECTIVES OF THE CENTRAL BANK OF KENYA The principal objectives of the Central Bank of Kenya (CBK) as established in the CBK Act are:
QUARTERLY ECONOMIC REVIEW (QER) Volume 2 No 4 January - March 2018 OBJECTIVES OF THE CENTRAL BANK OF KENYA The principal objectives of the Central Bank of Kenya (CBK) as established in the CBK Act are:
MEXICO. 1. General trends
 Economic Survey of Latin America and the Caribbean 2015 1 MEXICO 1. General trends Real GDP growth in Mexico in 2014 was 2.1%, up 0.7 percentage points on 2013. This increase stems from a good export performance,
Nepal Rastra Bank Research Department
 Nepal Rastra Bank Research Department Current Macroeconomic and Financial Situation of Nepal (Based on Seven Months' Data of 2017/18) Macroeconomic Outlook 1. The available macroeconomic data of the first
1 RED September/October 2018 SEPTEMBER/OCTOBER 2018
 1 RED September/October 20 SEPTEMBER/OCTOBER 20 2 RED September/October 20 MAJOR HIGHLIGHTS The country s annual consumer inflation grew by 0.2 percentage points to reach 5.1 per cent in September 20,
Current Macroeconomic Situation (Based on the first eight months' data of 2007/08)
") Current Macroeconomic Situation (Based on the first eight months' data of 2007/08) Money Situation Overall Liquidity 1. In the first eight months of 2007/08, broad money (M 2 ) increased by 13.5 percent
Current Macroeconomic Situation (Based on the first eight months' data of 2007/08) Money Situation Overall Liquidity 1. In the first eight months of 2007/08, broad money (M 2 ) increased by 13.5 percent
MANUFACTURING AND MINING
 ECONOMIC REPORT AND BALANCE SHEET 1385 CHAPTER 4 P roduction and investment indices and data in the manufacturing and mining sector in 1391 point to further declines and unfavorable trends which started
QUARTERLY ECONOMIC REVIEW (QER)
") QUARTERLY ECONOMIC REVIEW (QER) Volume 3 No 3 July - September 2018 OBJECTIVES OF THE CENTRAL BANK OF KENYA The principal objectives of the Central Bank of Kenya (CBK) as established in the CBK Act are:
QUARTERLY ECONOMIC REVIEW (QER) Volume 3 No 3 July - September 2018 OBJECTIVES OF THE CENTRAL BANK OF KENYA The principal objectives of the Central Bank of Kenya (CBK) as established in the CBK Act are:
Nepal Rastra Bank Research Department
 Nepal Rastra Bank Research Department Current Macroeconomic and Financial Situation of Nepal (Based on Three Months Data of 2018/19) Major Highlights Inflation remained 4.7 percent on y-o-y basis. Import
Bolivarian Republic of Venezuela
 Economic Survey of Latin America and the Caribbean 2008-2009 107 Bolivarian Republic of Venezuela 1. General trends The Venezuelan economy exhibited less buoyant growth in 2008 than in previous years:
EASTERN CARIBBEAN CURRENCY UNION (ECCU) 1. General trends
 1. General trends") Economic Survey of Latin America and the Caribbean 2016 1 EASTERN CARIBBEAN CURRENCY UNION (ECCU) 1. General trends Overall economic growth in the six ECCU members that are also members of ECLAC slowed
Economic Survey of Latin America and the Caribbean 2016 1 EASTERN CARIBBEAN CURRENCY UNION (ECCU) 1. General trends Overall economic growth in the six ECCU members that are also members of ECLAC slowed
National Bank of the Republic of Macedonia Research Department. Monthly Information 10/2012
 National Bank of the Republic of Macedonia Research Department Monthly Information 1/212 November, 212 Summary During October 212, the National Bank kept the key interest rate at the level of 3.75%, assessing
MONTHLY ECONOMIC REVIEW
 MONTHLY ECONOMIC REVIEW 11111111 111111 111111 111111 1111 111111 1111 1111 111 111 11 11 1 Volume 9 Issue 2 Outlook for 15 According to revised estimates of the National Bureau of Statistics, real GDP
WEST AFRICAN MONETARY AGENCY (WAMA) ECOWAS MONETARY COOPERATION PROGRAMME MACROECONOMIC CONVERGENCE REPORT 2007
 ECOWAS MONETARY COOPERATION PROGRAMME MACROECONOMIC CONVERGENCE REPORT 2007") WEST AFRICAN MONETARY AGENCY (WAMA) ECOWAS MONETARY COOPERATION PROGRAMME MACROECONOMIC CONVERGENCE REPORT 2007 FREETOWN, JUNE 2008 INTRODUCTION. 5 1.0 WORLD ECONOMIC SITUATION AND ECONOMIC COMMUNITY OF
WEST AFRICAN MONETARY AGENCY (WAMA) ECOWAS MONETARY COOPERATION PROGRAMME MACROECONOMIC CONVERGENCE REPORT 2007 FREETOWN, JUNE 2008 INTRODUCTION. 5 1.0 WORLD ECONOMIC SITUATION AND ECONOMIC COMMUNITY OF