First Quarter 2017 Earnings Call
|
|
|
- Melissa Mathews
- 5 years ago
- Views:
Transcription


1 First Quarter 2017 Earnings Call TECNOGLASS INC. May 12 th, 2017 (Nasdaq: TGLS)
2 FORWARD LOOKING STATEMENTS Safe Harbor This presentation includes certain forward-looking statements within the meaning of the Private Securities Litigation Reform Act of including statements regarding future financial performance. future growth and future acquisitions. These statements are based on Tecnoglass current expectations or beliefs and are subject to uncertainty and changes in circumstances. Actual results may vary materially from those expressed or implied by the statements herein due to changes in economic. business. competitive and/or regulatory factors. and other risks and uncertainties affecting the operation of Tecnoglass business. These risks. uncertainties and contingencies are indicated from time to time in Tecnoglass filings with the Securities and Exchange Commission. The information set forth herein should be read in light of such risks. Further. investors should keep in mind that Tecnoglass financial results in any particular period may not be indicative of future results. Tecnoglass is under no obligation to. and expressly disclaims any obligation to. update or alter its forward-looking statements. whether as a result of new information. future events. changes in assumptions or otherwise. FINANCIAL PRESENTATION Certain of the financial information contained herein is unaudited and does not conform to SEC Regulation S-X. Furthermore. it includes EBITDA (earnings before interest. taxes depreciation and amortization) which is a non-gaap financial measure as defined by Regulation G promulgated by the SEC under the Securities Act of as amended. Accordingly. such information may be materially different when presented in Tecnoglass filings with the Securities and Exchange Commission. Tecnoglass believes that the presentation of this non-gaap financial measure provides information that is useful to investors as it indicates more clearly the ability of Tecnoglass to meet capital expenditures and working capital requirements and otherwise meet its obligations as they become due. EBITDA was derived by taking earnings before interest. taxes. depreciation and amortization as adjusted for certain one-time non-recurring items and exclusions. NO OFFER OR SOLICITATION This announcement is not intended to and does not constitute an offer to sell or the solicitation of an offer to subscribe for or buy or an invitation to purchase or subscribe for any securities or the solicitation of any vote or approval in any jurisdiction. nor shall there be any sale. issuance or transfer of securities in any jurisdiction in contravention of applicable law. No offer of securities shall be made except by means of a prospectus meeting the requirements of Section 10 of the Securities Act of as amended. 2

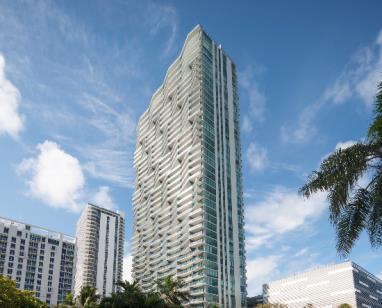
3 OPERATING HIGHLIGHTS 500 Waverly, New York 3

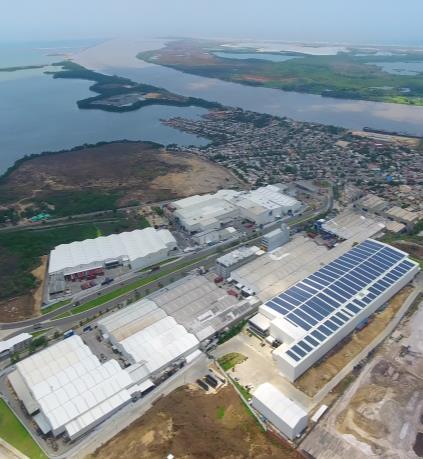
4 1Q 2017 Highlights Expanded backlog by 23% YoY to $474 million, including $50 million GM&P contribution. Operational Achievements Generated another quarter of positive free cash flow by implementing lean manufacturing initiatives and focusing on collection cycles. Completed phase one of solar panel installation at Barranquilla, Colombia facility, a project that is expected to generate significant energy cost and tax savings. Strategic Expansion & Diversification Completed GM&P acquisition, further vertically integrating operations and expanding U.S. presence. Established GM&P West branch, providing immediate access to new opportunities in California and Washington State. Opened sales branch in Pordenone, Italy to serve newly started operations in Europe, Middle East, Africa ( EMEA ) region with LOI already signed for project in Qatar. Enhanced Shareholder Value Announced 12% raise to regular quarterly dividend and reaffirmed commitment longterm dividend program. Successfully refinanced entire existing debt through 5-year $210 million senior unsecured notes offering, which lowered overall cost of funding and improved the capital structure. 4
5 250,00 200,00 150,00 100,00 50,000 - US$ in Thousands 1Q 2017 Summary (1) 1 Revenue 3% increase in revenues YoY to $65.8 million, including one month of GM&P revenues. CAGR FY 14 LTM 17: 15.8.% 305, , , , % Q revenues impacted mainly by projects in backlog shifting into subsequent quarters and two weeks of scheduled maintenance during January. 63,855 65, LTM Q Q Adjusted EBITDA CAGR FY 14 LTM 17: 23.2% Adjusted EBITDA adversely impacted by project mix and higher fixed costs. Current cost structure expected to support 2017 revenue growth and drive margin expansion % 72,034 57,109 69,666 37,220 16,096 13, LTM Q Q U.S. Market Evolution 15% growth in U.S revenues driven by strategic focus on U.S penetration and GM&P acquisition. CAGR FY 14 LTM 17: 24.5% 189, , , , % U.S revenues contributed 70% of total sales, compared to 63% in 1Q Notes: 1. Prior-period financial information in 2015 and 2016 has been retroactively adjusted for ES Windows, acquired under common control Financial statements include one month of GM&P, acquired on March 1, ,118 46, LTM Q Q
6 40% 35% 30% 25% 20% 15% 10% 5% 0% Strong Backlog Supports Future Growth US$ in Millions Strategic acquisitions and project commitments generated 23% increase in backlog year over year to $474 million Backlog up 7% compared to pro forma backlog of $444 million 3 as of fourth quarter Organic backlog increased $28 million vs Q4 2016, driven by healthy quoting activity in U.S. GM&P acquisition contributed $50 million to consolidated Q backlog. Backlog Performance at Quarter End and Growth Evolution (1,2) $ Total Backlog 23% % 4% 0% 3% Q Q Q Q Q Legacy Business Backlog GM&P Backlog % Cumulative Growth Notes: 1. Backlog as of 2016 does not assume GM&P contribution to expected revenues. 2. Backlog as of March 31, 2017 assumes GM&P contribution of $50 million. 3. Pro forma backlog as of December 31, 2016 revised from $479 million prior to exclude GM&P and legacy Tecnoglass inter-company revenues. 6
7 End Market Diversification US$ in Millions Backlog Breakdown by End Market 2Q 16 Backlog $398 3Q 16 Backlog $402 4Q 16 Backlog $396 1Q 17 Backlog $474 6% 12% 6% 1% 3% 4% 3% 4% 82% 93% 93% 93% Commercial Residential (Single Families / Developers) Retail (Dealers) Commercial project work represents majority of backlog, and underlying demand remains strong in key regions. Gaining traction with new residential products which are experiencing positive market acceptance. GM&P acquisition expands and diversifies revenue mix through expertise in design, engineering and installation services 7

8 Geographical Diversification US$ in Millions Backlog Breakdown by Geography 2Q 16 Backlog $398 3Q 16 Backlog $402 4Q 16 Backlog $396 1Q 17 Backlog $474 57% 43% 54% 46% All Other Revenue U.S. (Florida) GM&P acquisition complements strong activity in Florida and expands geographic reach. Quoting activity remains strong and robust in Florida and in other key U.S. markets. Recent strategic expansion efforts have successfully extended Company s presence in the Western U.S., Europe and Middle East regions. Colombia backlog expected to remain elevated given current local construction and infrastructure market dynamics. 8

9 Eco-Friendly Energy Project Initiated Tecnoglass took action in 1Q 2017 to promote environmentally friendly energy uses with ultimate goal of achieving reduction in natural gas and electricity consumption Initiated new partnership with Panasonic LA in February 2017 to produce solar energy for self-consumption. $15 million multi-year investment will create significant tax advantage for Tecnoglass as Colombian government seeks to encourage and incentivize clean energy initiatives. When completed, installed capacity of 12 megawatts has potential to reduce natural gas consumption 21%. Solar Panels Installed on Tecnoglass Soft Coating Facility Stage 1: 7,820 photovoltaic solar panels Installed capacity: 2.5 megawatts Capex: $3 million Achieved: Reduction in natural gas and electricity consumption by 5% Project Target: (1,2) photovoltaic solar panels Installed capacity: 12 megawatts Total Capex: $15 million Notes: 1. The following stages will be defined when 1 stage had finished testing. 2. Projections are based on current demand. 9

10 MARKET UPDATE University of Maryland 10


11 New Markets Represent Significant Opportunity Expanding to West Coast through GM&P customer relationships. Provides additional regional diversification in U.S. Actively bidding on projects in California and Washington State. California experiencing strong commercial construction demand. Efficient access to western U.S through Panama Canal. GM&P Fueling Expansion to California and Washington State. Operational abilities and executional expertise support projects on a global scale. Recently opened office in Pordenonde, Italy to serve EMEA. Expanding footprint through local partners with deep relationships and extensive market knowledge. European economy showing signs of recovery with rising consumer confidence and strong pent up demand. Middle East growth opportunities arising from shifts to higher end glass and away from commodity product. Recent project win in Lusail, Qatar, an entirely new city under construction to be completed at an estimated cost of $45 billion as it prepares to host the 2022 World Cup. 11
 Firms seeing")

12 U.S. Construction Outlook Remains Favorable Construction Indicators Indicate Growth in Billings Across All Regions Architectural Billing Index (1) A strong start for construction outlook in ABI Score > 50 indicates 42 improved construction outlook ABI Index LTM Regional (2) Firms seeing strong conditions entering busy season Midwest 54.6 West 50.2 South 52.6 Northeast 52.4 Architecture firm billings bumped back up in March, with the national ABI score standing at 54.3 in March. Residential report business upturn and institutional firms end first quarter with solid revenue growth. Improvements in US construction markets provide excellent visibility on growth over the next months. Non-Residential Construction Spending FMI U.S. Markets Construction Overview 2017 Non-residential construction spending: continued sector disparities (3) FMI Construction put in place estimated for the United States (Millions of Current Dollars) (4) FMI 2017 Growth Forecasts 6% Commercial Construction 8% Office Space 6% Residential Construction. Source: 1. The American Institute of Architects (AIA) reported the Architecture Billing Index (ABI-March-2017). 50 represents the diffusion center. A score of 50 equals no change to outlook from the previous month. Above 50 shows increase; Below 50 shows decrease Figures represents trailing thee month average ABI scores from March 2016 March 2017 across respective US census regions. 3. D A Davidson. Engineering & Construction. February 6, 2017 Industry Update. 4. Featuring FMI's Construction Outlook. Industry Focus. 12
 JPMorgan EMBI Evolution (Pts) 441 460 478 493 502 30 34 37 38 40 2012 2013 2014 2015 2016 Construction Other Total GDP GDP % growth Building")
13 Infrastructure and Construction Growth Driving Colombia GDP Expansion % Colombian GDP (1) GDP s Performance By Industry (COP$ Thousands of Millions) % % 3.1% 2.0% Colombia s Risk Perception at All-time Low (3) JPMorgan EMBI Evolution (Pts) Construction Other Total GDP GDP % growth Building Construction Licenses in Colombia (2) Housing Area Approved by End Market (Thousands bimonthly in m²) Others B1 12 YTD B1 13 YTD B3 14 YTD B1 15 YTD B1 16 YTD B1 17 YTD Economic sentiment continues to be favorable in Colombia as evidenced by the most recent EMBI indicator. Colombia has attracted significant foreign investment compared to other Emerging Markets given sound trading relationship with U.S. (3) Infrastructure, construction and industrial activity drove 2.0% GDP growth in 2016, partially offset by a challenging commodity environment. The area approved for all types of buildings rose 0.5% the first two month of the year. (2) GDP expected to grow 2.3% and 3.0% in 2017 and 2018, respectively. (4) The Government expects the construction sector to grow 3.9% in (5) Source: 1. DANE. Real GDP for 2016 by Economic Activity February DANE. Statistics of Building Construction Licenses ELIC, April JPMorgan J.P. Morgan Emerging Markets Bond Index (EMBI+), February World Economic and Financial Surveys, WEO Database IMF. International Monetary Fund Edition, April Portafolio. Hay optimismo de cara a la meta del PIB del 2,5% para este año. February

14 FINANCIAL RESULTS & OUTLOOK Streamsong, Florida 14
15 US$ in Millions Financial Highlights 1Q 2017 vs 1Q 2016 (1) Q1 revenues increased 3% YoY to $65.8 million. Revenues impacted by the timing of projects rolling out of backlog, with some significant projects getting pushed into the second half of the year. Gross margin compression mainly associated with higher indirect manufacturing costs, including $3.5 million from GM&P, and lower organic revenues. Additional depreciation of $4 million from recent capacity investments. Adjusted EBITDA adversely impacted by project mix, higher fixed costs and SG&A ramp up during seasonally lowest revenue quarter. Current cost structure expected to support 2017 revenue growth and drive margin expansion. Strong cash generation, with $11.4 million in cash flow from operations in Q and $22.4 million over the last 6 months. 1Q LTM legacy day sales outstanding down 22 day vs FY 2016 and 13 days versus FY (1Q excludes(4) GM&P which only captured 30 days of sales). Significantly reduced capex spend as recent growth capex phase virtually completed. Record cash balance provides ample liquidity and conservative leverage profile of 2.5x net debt to LTM Adjusted EBITDA $Δ %Δ Key Financial Results 1Q 1Q Revenues ($) % Adjusted EBITDA ($) (2) % Net Income ($) % Cash From Operating Activities ($) % Capex ($) (3) % Paid Cash Interests ($) % Paid Cash Dividends ($) % Cash at end of period ($) % Gross Debt ($) % Net Debt ($) (5) % Notes: 1. Prior-period financial information in 2015 and 2016 has been retroactively adjusted for ES Windows, acquired under common control Financial statements includes one month of GM&P, acquired on March 1, Q 2017 Adjusted EBITDA excludes $4.2 Million in Extinguishment of Debt, Bond issuance costs and other non-recurring. 3. Includes acquisition of property and equipment, assets acquired under capital lease and debt. 4. DSO calculated base on Legacy Business as of 1Q 17 LTM and 1Q 16 LTM. 5. Net Debt is calculated as Gross Debt (-) Cash & Equivalents. 15
16 30, 00 25, 00 20, 00 15, 00 10, 00 5, , 00 90, 00 80, 00 70, 00 60, 00 50, 00 40, 00 30, 00 20, 00 10, 00 0 US$ in Thousands Revenue and Adjusted EBITDA Bridge 1Q 2017 vs 1Q 2016 (1) 1Q17-3 Month Revenue Analysis 6,190-3,801 1, , ,855 65,817 1Q 2016 QTD Revenues US net sales Colombia Net Sales Panama Net Sales Other Countries Net Sales Foreing Exchange 1Q 2017 QTD Revenues 1Q17-3 Month EBITDA Analysis - 3, ,899 12,899 12,784 12,784 16,096 1Q 2016 QTD EBITDA Product/Service Mix Volume SGA Non-operating revenues, net 13,728 1Q 2017 QTD EBITDA Notes: 1. EBITDA calculation is adjusted to remove the FX gain and losses related to movements on balance sheet accounts consistent with prior 2016 Adjusted EBITDA Outlook. 2. Prior-period financial information in 2015 and 2016 has been retroactively adjusted for ESWindows, acquired under common control Financial statements Include one month of GM&P, acquired on March 1,
17 90, 00 80, 00 70, 00 60, 00 50, 00 40, 00 30, 00 20, 00 10, % 30% 20% 10% 0% -10% -20% -30% -40% Positive Cash Flow Reflects Lower Capex and Better Working Capital Management (1) US$ in Millions Inventory Days Analysis Days Sales Outstanding FY 15 FY 16 LTM 17 As Reported Proforma (With GM&P) Legacy Business (Without GM&P) FY 15 FY 16 LTM 17 As Reported Proforma (With GM&P) Legacy Business (Without GM&P) Capex Evolution (2) 33% 80,219 14% 12% 3% 42,547 37,611 1,947 FY 15 FY 16 LTM 17 1Q 17 Capex Capex As % of Sales Notes: 1. Prior-period financial information in 2015 and 2016 has been retroactively adjusted for ES Windows, acquired under common control and 2017 Financial statements Includes GM&P, acquired on March Includes acquisition of property and equipment, assets acquired under capital lease and debt. 17
18 % 70. 0% 60. 0% 50. 0% 40. 0% 30. 0% 20. 0% 10. 0% 0.0% % % % 10. 0% 80. 0% 60. 0% 40. 0% 20. 0% 0.0% -20.0% US$ in Millions FY2017 Outlook Double-digit revenue growth supported by very strong backlog levels. Project revenue to grow to a range of $360 million to $390 million and expected to build throughout the year. This growth assumption incorporates 10 months of non inter-company GM&P revenues. Adjusted EBITDA expected to grow at a double-digit pace to a range of $82 million and $90 million for the year. Outlook includes the effect of fully consolidating ESWindows in 2016 and ten months of GM&P as of the March 1, 2017 acquisition date Revenues (1) Adjusted EBITDA (1) Mid Point (2) Mid Point (2) % 22.7% 25.9% 22.9% -0.1% 53.4% 26.1% 19.4% (E) (E) Notes: 1. Prior-period financial information in 2015 and 2016 has been retroactively adjusted for ES Windows, acquired under common control Financial statements include one month of GM&P, acquired on March 1, Represents the Mid Point of 2017 outlook. 18
19 Thank you Questions? (Nasdaq: TGLS) 19

20 APPENDIX Centenario. Cali, Colombia 20
21 Profit & Loss Highlights 1Q 2017 vs 1Q 2016 (1,4) US$ in Thousands Three months ended March 31, 2017 vs ,017 % Sales 2,016 % Sales $ % Revenues 65, % 63, % 1,962 3% Cost of sales 43,565 66% 39,165 61% 4,400 11% Gross profit 22, % 24, % (2,438) -10% SG&A & other operating expenses 15, % 12, % 2,448 19% Operating income 6,862 10% 11,748 18% (4,886) -42% Adjusted EBITDA (2,3) 13,728 21% 16,096 25% (2,368) -15% Non-operating revenues, net 3,452 5% (240) 0% 3, % Gain (loss) on change in fair value of earnout shares 0 0% 3,704 6% (3,704) -100% Gain (loss) on change in fair value of warrant liability 0 0% 5,911 9% (5,911) -100% Interest expense 5,082 8% 3,124 5% 1,958 63% Extinguishment of debt and other non-recurring 3,159 5% 0 0% 3,159 n/a Income (loss) before taxes 2,073 3% 17,999 28% (5,692) -32% Income tax provision 1,042 2% 3,643 6% (2,601) -71% Income after tax 1,031 2% 14,356 22% (3,091) -22% 1.01 Income attributable to minority interest (12) 0% 0 0% (12) n/a Net income (loss) 1,019 2% 14,356 22% (3,079) -21% Basic loss per share Diluted loss per share Basic weighted average common shares 33,480,430 28,220,885 Diluted weighted average common shares 34,195,579 31,360,003 Notes: 1. Prior-period financial information in 2016 has been retroactively adjusted for ES Windows, acquired under common control Financial statements Includes one month of GM&P, acquired on March 1, EBITDA calculation is adjusted to remove the FX gain and losses related to movements on balance sheet accounts consistent with prior 2016 Adjusted EBITDA Outlook Adjusted EBITDA excludes $4.2Million in Extinguishment of Debt and Bond issuance costs and other non-recurring. 21
22 Non-GAAP Reconciliation (1) US$ in Thousands Adjusted EBITDA Reconciliation Three months ended March 31, 2016 June 30, 2016 September 30, 2016 December 31, 2016 March 31, 2017 Adjusted EBITDA 16,096 18,127 18,528 19,283 13,728 Depreciation 3,331 3,737 4,086 4,368 4,905 Adjusted EBIT 12,765 14,390 14,442 14,915 8,823 Interest Expense 3,124 4,242 4,771 4,677 4,919 FX Transaction (Gain)/ Loss 1,257 1,009 (2,434) 1,555 (2,425) Tax Provision 3,643 3,815 6,035 2,579 1,042 One-Time Tax Provision Effect 1,149 1,707 Adjusted Net Income 4,741 5,324 6,070 4,955 3,580 One-Time Tax Provision Effect (1,149) (1,707) One-Time Unbilled Receivable & AR Provision ,509 - One-Time Extinguishment of Debt ,159 One-Time Bond Issuance Costs and Other Non-Recurring ,109 Earnout Shares (3,704) (3,330) 2,630 (270) - Warrant Liability (5,911) (6,687) 12,885 (1,063) - Net (Loss) Income 14,356 15,341 (9,445) 2,928 1,019 Diluted Adjusted Income (Loss) Per Share Earnout Share (0.12) (0.10) 0.09 (0.01) - Warrant Liability (0.19) (0.20) 0.43 (0.04) - Diluted Income (Loss) Per Share (0.32) Diluted Weighted Average Common Shares Outstanding 31,360 32,776 29,626 30,264 34,196 Basic Income (Loss) Per Share (0.32) Diluted Income (Loss) Per Share (0.32) Basic Weighted Average Common Shares Outstanding 28,221 28,548 29,626 29,538 33,480 Diluted Weighted Average Common Shares Outstanding 31,360 32,776 30,344 30,264 34,196 Notes: 1. Adjusted EBITDA, Adjusted EBIT and Adjusted Net Income are not measures of financial performance under generally accepted accounting principles ( GAAP ). Management believes Adjusted EBITDA, Adjusted EBIT and Adjusted Net Income, in addition to operating profit, net income and other GAAP measures, is useful to investors to evaluate the Company s results because it excludes certain items that are not directly related to the Company s core operating performance. Investors should recognize that Adjusted EBITDA, Adjusted EBIT and Adjusted Net Income might not be comparable to similarly-titled measures of other companies. These measures should be considered in addition to, and not as a substitute for or superior to, any measure of performance prepared in accordance with GAAP. Because GAAP financial measures on a forward-looking basis are not accessible, and reconciling information is not available without unreasonable effort, we have not provided reconciliations for forward-looking non-gaap measures. 22
23 Non-GAAP Reconciliation (1) US$ in Thousands Net Debt Reconciliation and Net Three months ended March 31, Short Term Debt and Current Portion of Long Term Debt 60,921 6,624 Long Term Debt 126,494 18,949 Corporate Bond - 201,765 Gross Debt 187, ,338 Cash at the end of the period 22,446 54,372 Net Debt 164, ,966 LTM Adjusted EBITDA 69,666 Net Debt / LTM Adjusted EBITDA 2.5x Notes: 1. Adjusted EBITDA, Adjusted EBIT and Adjusted Net Income are not measures of financial performance under generally accepted accounting principles ( GAAP ). Management believes Adjusted EBITDA, Adjusted EBIT and Adjusted Net Income, in addition to operating profit, net income and other GAAP measures, is useful to investors to evaluate the Company s results because it excludes certain items that are not directly related to the Company s core operating performance. Investors should recognize that Adjusted EBITDA, Adjusted EBIT and Adjusted Net Income might not be comparable to similarly-titled measures of other companies. These measures should be considered in addition to, and not as a substitute for or superior to, any measure of performance prepared in accordance with GAAP. Because GAAP financial measures on a forward-looking basis are not accessible, and reconciling information is not available without unreasonable effort, we have not provided reconciliations for forward-looking non-gaap measures. 23
24 Non-GAAP Reconciliation (1,2,3,4) US$ in Thousands Days Sales Outstanding Reconciliation Trade Accounts Receivable, Net Twelve months ended March 31, 2017 As Reported 103,310 Less GM&P, net 31,039 Legacy Tecnoglass Receivable, Net 72,271 Operating Revenues Twelve months ended March 31, 2017 As Reported 306,978 Less GM&P Successor Period 8,137 Legacy Tecnoglass Operating Revenues 298,842 Twelve months ended March 31, 2017 As Reported 306,978 GM&P Predecessor Period 58,688 Pro Forma Operating Revenues 365,667 Days Sales Outstanding Twelve months ended December 31, Twelve months ended March 31, Trade Accounts Receivable, Net 67,079 92, ,310 Total Operating Revenues 242, , ,978 Days Sales Outstanding, As Reported Trade Accounts Receivable, Net 103,310 Pro Forma Operating Revenues 365,667 Pro Forma Days Sales Outstanding Legacy Tecnoglass Receivable, Net 72,271 Legacy Tecnoglass Operating Revenues 298,842 Legacy Tecnoglass Days Sales Outstanding 87.1 Notes: 1. GM&P Predecessor Period includes revenues for the 11 month period from April 1, 2016 to February 28, GM&P Successor Period includes revenues for the 1 month period from March 1, 2017 to March 31, Pro Forma assumes GM&P acquired on April 1, Legacy Tecnoglass excludes any contribution from the GM&P acquisition predecessor or successor periods. 24
25 Non-GAAP Reconciliation (1,2,3,4) US$ in Thousands Inventory Days Reconciliation Inventory, Net Twelve months ended March 31, 2017 As Reported 56,731 Less GM&P, net 26 Legacy Tecnoglass Inventory, Net 56,705 Cost Of Sales Twelve months ended March 31, 2017 As Reported 196,769 Less GM&P Successor Period 5,215 Legacy Tecnoglass Cost of Sales 191,554 Twelve months ended March 31, 2017 As Reported 196,769 GM&P Predecessor Period 23,061 Pro Forma Cost of Sales 219,830 Inventory Days Twelve months ended December 31, Twelve months ended March 31, Inventory, Net 48,741 55,092 56,731 Total Cost of Sales 151, , ,769 Inventory Days, As Reported Inventory 56,731 Pro Forma Cost of Sales 219,830 Pro Forma Inventory Days 92.9 Legacy Tecnoglass Inventory, Net 56,705 Legacy Tecnoglass Cost of Sales 191,554 Legacy Tecnoglass Inventory Days Notes: 1. GM&P Predecessor Period includes cost of sales for the 11 month period from April 1, 2016 to February 28, GM&P Successor Period includes cost of sales for the 1 month period from March 1, 2017 to March 31, Pro Forma assumes GM&P acquired on April 1, Legacy Tecnoglass excludes any contribution from the GM&P acquisition predecessor or successor periods. 25
SECOND QUARTER 2018 Centenario EARNINGS CONFERENCE CALL. Wyndham Clearwater. Florida, United States. August 8, TECNOGLASS INC.
 Wyndham Clearwater Florida, United States SECOND QUARTER 2018 Centenario EARNINGS CONFERENCE CALL August 8, 2018 - TECNOGLASS INC. (NASDAQ: TGLS) FORWARD LOOKING STATEMENTS Safe Harbor This presentation
Third Quarter 2017 Earnings Call
 Third Quarter 2017 Earnings Call TECNOGLASS INC. November 14, 2017 (NASDAQ: TGLS) FORWARD LOOKING STATEMENTS Safe Harbor This presentation includes certain forward-looking statements within the meaning
2018 FOURTH QUARTER EARNINGS CALL
 NORTH AMERICA S LEADING BUILDING MATERIALS DISTRIBUTOR RESIDENTIAL COMMERCIAL INTERIOR SOLAR 2018 FOURTH QUARTER EARNINGS CALL Forward Looking Statements / Non-GAAP Measures This presentation contains
TECNOGLASS INC. A Leading Manufacturer of Architectural Glass and Windows. Serving the Global Commercial and Residential Construction Industries
 TECNOGLASS INC. A Leading Manufacturer of Architectural Glass and Windows Serving the Global Commercial and Residential Construction Industries Investor Presentation March 2017 Nasdaq: TGLS BVC: TGLSC
2018 Second Quarter Earnings Call. May 8, 2018
 2018 Second Quarter Earnings Call May 8, 2018 Forward Looking Statements / Non-GAAP Measures This presentation contains information about management's view of the Company's future expectations, plans and
Bank of America Merrill Lynch NDR - NYC
 - NYC Company Participants Bank of America Merrill Lynch NDR - NYC John Engquist CHIEF EXECUTIVE OFFICER Brad Barber PRESIDENT AND CHIEF OPERATING OFFICER Kevin Inda VICE PRESIDENT OF INVESTOR RELATIONS
Inspired Entertainment, Inc. Reports Strong Third Quarter FY2018 Results and Completion of its Debt Refinancing
 Inspired Entertainment, Inc. Reports Strong Third Quarter FY2018 Results and Completion of its Debt Refinancing August 13, 2018 - Revenue in the third quarter increased 14.3% as compared to the same quarter
RBC Midwest NDR NASDAQ: HEES. John Engquist CHIEF EXECUTIVE OFFICER Kevin Inda VICE PRESIDENT OF INVESTOR RELATIONS. Company Participants
 Company Participants John Engquist CHIEF EXECUTIVE OFFICER Kevin Inda VICE PRESIDENT OF INVESTOR RELATIONS NASDAQ: HEES August 15-16, 2018 2 Legal Disclaimers Forward-Looking Information This presentation
2018 First Quarter Earnings Call. February 8, 2018
 2018 First Quarter Earnings Call February 8, 2018 Forward Looking Statements / Non-GAAP Measures This presentation contains information about management's view of the Company's future expectations, plans
Q Investors Presentation
 Q2 2017 Investors Presentation Forward Looking Statements and Non-GAAP Measures This presentation contains information about management's view of the Company's future expectations, plans and prospects
Investor Presentation. Second Quarter 2018 NASDAQ: BECN BECN
 Investor Presentation Second Quarter 2018 BECN 1 Disclosures Forward Looking Statements and Non-GAAP Measures This presentation contains forward-looking statements within the meaning of the Private Securities
Q Supplement. August 6, 2014
 Q2 2014 Supplement August 6, 2014 Disclaimer Please note that in this presentation, we may discuss events or results that have not yet occurred or been realized, commonly referred to as forward-looking
XYLEM INC. Q EARNINGS RELEASE FEBRUARY 1, 2018
 XYLEM INC. Q4 2017 EARNINGS RELEASE FEBRUARY 1, 2018 Q4 2017 EARNINGS RELEASE FORWARD-LOOKING STATEMENTS This presentation contains information that may constitute forward-looking statements. Forward-looking
Fourth-Quarter 2018 Results. January 30, 2019
 Fourth-Quarter 2018 Results January 30, 2019 Safe Harbor This presentation includes forward-looking statements which are statements that are not historical facts, including statements that relate to the
BMC STOCK HOLDINGS, INC. Second Quarter 2018 Earnings Presentation July 30, BMC. All Rights Reserved.
 BMC STOCK HOLDINGS, INC. Second Quarter 2018 Earnings Presentation July 30, 2018 2018 BMC. All Rights Reserved. CLICK Disclaimer TO EDIT TITLE This presentation contains "forward-looking statements" within
J.P. Morgan Homebuilding and Building Products Conference May 15, 2018
 J.P. Morgan Homebuilding and Building Products Conference May 15, 2018 Forward-Looking Statements Items in this presentation, and statements by KB Home management in relation to this presentation or otherwise,
Q Earnings. Webcast Presentation November 1, 2018
 Q3 2018 Earnings Webcast Presentation November 1, 2018 2 Q3 2018 Earnings Webcast 11/1/18 Safe Harbor Statement All statements made herein that are not historical facts should be considered as forward-looking
Pangaea Logistics Solutions Ltd. Reports Financial Results for the Three Months and Year Ended December 31, 2017
 Pangaea Logistics Solutions Ltd. Reports Financial Results for the Three Months and Year Ended December 31, 2017 Company posts strong earnings after two years of industry turmoil NEWPORT, RI - March 21,
Fourth Quarter 2015 Earnings Call
 Fourth Quarter 2015 Earnings Call February 25, 2016 Rob Wagman President & Chief Executive Officer Nick Zarcone Executive Vice President & Chief Financial Officer Joe Boutross Director, Investor Relations
NOVELIS Q3 FISCAL 2019 EARNINGS CONFERENCE CALL
 NOVELIS Q3 FISCAL 2019 EARNINGS CONFERENCE CALL February 5, 2019 Steve Fisher President and Chief Executive Officer Dev Ahuja Senior Vice President and Chief Financial Officer SAFE HARBOR STATEMENT Forward-looking
Masonite International Investor Presentation NYSE: DOOR
 Masonite International Investor Presentation NYSE: DOOR Spring 2015 Safe Harbor / Non-GAAP Financial Measure SAFE HARBOR / FORWARD LOOKING STATEMENT This investor presentation contains forward-looking
Third Quarter 2015 Earnings Call October 29, 2015
 Third Quarter 2015 Earnings Call October 29, 2015 Rob Wagman President & Chief Executive Officer Nick Zarcone Executive Vice President & Chief Financial Officer Joe Boutross Director, Investor Relations
Credit Suisse 6 th Annual Industrials Conference November 2018
 Credit Suisse 6 th Annual Industrials Conference November 2018 Safe Harbor This presentation includes forward-looking statements which are statements that are not historical facts, including statements
Investor Deck December 2018
 Investor Deck December 2018 Safe Harbor This presentation includes forward-looking statements which are statements that are not historical facts, including statements that relate to the mix of and demand
NASDAQ: MLHR. Herman Miller, Inc. Investor Presentation Second Quarter FY2013
 NASDAQ: MLHR Herman Miller, Inc. Investor Presentation Second Quarter FY2013 Forward Looking Statements This information contains forward-looking statements within the meaning of Section 27A of the Securities
Fourth Quarter 2018 Earnings Conference
 Earnings Conference Fourth Quarter 2018 Earnings Conference John Engquist EXECUTIVE CHAIRMAN OF THE BOARD Brad Barber CHIEF EXECUTIVE OFFICER AND PRESIDENT Leslie Magee CHIEF FINANCIAL OFFICER Kevin Inda
EFI Q Earnings Call. July 20, 2015
 EFI Q2 2015 Earnings Call July 20, 2015 Safe Harbor For Forward-Looking Statements Certain statements in this press release are forward-looking statements within the meaning of Section 27A of the Securities
EFI Q Earnings Call. April 23, 2015
 EFI Q1 2015 Earnings Call April 23, 2015 Safe Harbor For Forward-Looking Statements Certain statements in this presentation are forward-looking statements within the meaning of Section 27A of the Securities
Horizon Global Third Quarter 2017 Earnings Presentation
 Horizon Global Third Quarter 2017 Earnings Presentation October 31, 2017 Q1 2016 Earnings 1 Safe Harbor Statement Forward-Looking Statements This presentation may contain "forward-looking statements" as
Q and FY 2015 Investor Presentation
 Q4 2015 and FY 2015 Investor Presentation Legal Disclaimer This presentation contains "forward-looking statements" within the meaning of the Private Securities Litigation Reform Act of 1995. All statements
Third Quarter Presentation
 Third Quarter Presentation November 6, 2018 Presented by: Jerry Volas, CEO Robert Buck, President & COO John Peterson, CFO SAFE HARBOR Statements contained in this presentation that are not historical
Where Intelligence Meets Infrastructure
 Where Intelligence Meets Infrastructure Earnings Conference Call For The Fourth Quarter and Year Ended September 30, 2018 November 6, 2018 These slides are not intended to be a stand-alone presentation,
4Q 2017 Presentation. February 27, 2018
 4Q 2017 Presentation February 27, 2018 SAFE HARBOR Statements contained in this presentation that are not historical and reflect our views about future periods and events, including our future performance,
Rent-A-Center today is
 INVESTOR PRESENTATION FIRST QUARTER 2014 Safe Harbor This presentation contains forward-looking statements that involve risks and uncertainties. Such forward-looking statements generally can be identified
EFI Q Earnings Call. July 17, 2014
 EFI Q2 2014 Earnings Call July 17, 2014 Safe Harbor For Forward-Looking Statements Certain statements in this press release are forward-looking statements within the meaning of Section 27A of the Securities
Fourth Quarter and Full Year Earnings Call March 1, 2019
 Fourth Quarter and Full Year Earnings Call March 1, 2019 Safe Harbor & Non-GAAP Financial Measures Cautionary Notice Statements in this news release and the schedules hereto that are not purely historical
Novelis Q4 and Fiscal Year 2016 Earnings Conference Call
 Novelis Q4 and Fiscal Year 2016 Earnings Conference Call May 10, 2016 Steve Fisher President and Chief Executive Officer Steve Pohl Vice President and Interim Chief Financial Officer 1 Safe Harbor Statement
BAML 2018 Leveraged Finance Conference Presentation. December 4, 2018
 BAML 2018 Leveraged Finance Conference Presentation December 4, 2018 Disclaimer Forward-Looking Statement Any "forward-looking" statements, within the meaning of Section 27A of the Securities Act of 1933
SunPower Reports Third-Quarter 2013 Results
 October 30, 2013 SunPower Reports Third-Quarter 2013 Results -- Q3 2013 GAAP Revenue of $657 Million, Non-GAAP Revenue of $619 Million -- Q3 2013 GAAP Earnings per Share of $0.73, Non-GAAP Earnings per
4Q 2018 Highlights and Operating Results. Products. Technology. Services. Delivered Globally.
 4Q 2018 Highlights and Operating Results Products. Technology. Services. Delivered Globally. Table of Contents Page 3 Safe Harbor Statement and Non-GAAP Financial Measures 4 Sales Overview 9 Overview of
CFO Commentary on Third-Quarter 2014 Results
 CFO Commentary on Third-Quarter 2014 Results Summary The third quarter 2014 results compared to last year s third quarter were as follows: Revenue of $361.6 million up 14.0% from $317.2 million Gross margin
Q3 Fiscal Year 2013 Earnings Conference Call
 NASDAQ: CMCO Q3 Fiscal Year 2013 Earnings Conference Call January 25, 2013 Timothy T. Tevens President & Chief Executive Officer Gregory P. Rustowicz Vice President - Finance & Chief Financial Officer
Pentair KeyBanc Capital Markets Industrial, Automotive & Transportation Conference
 Pentair KeyBanc Capital Markets Industrial, Automotive & Transportation Conference John L. Stauch Chief Financial Officer May30, 2013 PENTAIR FORWARD-LOOKING STATEMENTS CAUTION CONCERNING FORWARD-LOOKING
Q Earnings. Webcast Presentation August 2, 2018
 Q2 2018 Earnings Webcast Presentation August 2, 2018 2 Q2 2018 Earnings Webcast 8/2/18 Safe Harbor Statement All statements made herein that are not historical facts should be considered as forward-looking
Q Financial Results
 Q1 2018 Financial Results May 3, 2018 Copyright Fortinet Inc. All rights reserved. Safe Harbor Statement Information, statements and projections contained in these presentation slides and related conference
Fourth Quarter and FY 2017 Earnings. February 26, 2018
 Fourth Quarter and FY 2017 Earnings February 26, 2018 Forward Looking Statements Some of the statements made in this presentation are forward-looking and are made pursuant to the safe harbor provision
j2 Global Reports Third Quarter 2018 Results
 j2 Global Reports Third Quarter 2018 Results November 6, 2018 Achieves Record Third Quarter Revenues (up 7.0% to $292.7 million vs. Q3 2017) Announces Twenty-Ninth Consecutive Quarterly Dividend Increase
ANIXTER ANNOUNCES ACQUISITION OF HD SUPPLY S POWER SOLUTIONS BUSINESS JULY 15, 2015
 ANIXTER ANNOUNCES ACQUISITION OF HD SUPPLY S POWER SOLUTIONS BUSINESS JULY 15, 2015 Products. Technology. Services. Delivered Globally. 1 SAFE HARBOR AND NON-GAAP FINANCIAL MEASURES Safe Harbor Statement
SECOND QUARTER 2018 BUSINESS REVIEW. Jonathan W. Painter, President & CEO Michael J. McKenney, Executive Vice President & CFO
 SECOND QUARTER 2018 BUSINESS REVIEW Jonathan W. Painter, President & CEO Michael J. McKenney, Executive Vice President & CFO Forward-Looking Statements The following constitutes a Safe Harbor statement
Fiscal First Quarter 2017 Earnings Conference Call
 Fiscal First Quarter 2017 Earnings Conference Call May 5, 2017 Forward-Looking Statements This presentation includes certain statements relating to future events and our intentions, beliefs, expectations,
Second Quarter 2017 Earnings August 4, 2017
 Second Quarter 2017 Earnings August 4, 2017 2 Forward-Looking Statements This presentation includes forward-looking statements within the meaning of the safe harbor provisions of the United States Private
Investor Presentation April 2015
 Investor Presentation April 2015 Forward-looking statements Certain statements included herein constitute forward looking statements within the meaning of the U.S. Private Securities Litigation Reform
FOURTH QUARTER FISCAL YEAR May 18, 2017
 FOURTH QUARTER FISCAL YEAR 2017 FINANCIAL RESULTS May 18, 2017 CAUTIONARY STATEMENT UNDER THE PRIVATE SECURITIES LITIGATION REFORM ACT This presentation and discussion contains certain forward looking
Q Investor Presentation
 Q3 2016 Investor Presentation Legal Disclaimer This presentation contains "forward-looking statements" within the meaning of the Private Securities Litigation Reform Act of 1995. All statements contained
WABASH NATIONAL CORPORATION Q4 Earnings Release
 WABASH NATIONAL CORPORATION 2018 Q4 Earnings Release SAFE HARBOR STATEMENT AND NON-GAAP FINANCIAL MEASURES This presentation contains certain forward-looking statements as defined by the Private Securities
First Quarter 2016 Earnings
 First Quarter 2016 Earnings Disclaimer Forward-Looking Statements This presentation contains forward-looking statements within the meaning of the Federal Private Securities Litigation Reform Act of 1995.
Analog Devices Reports Fourth Quarter and Fiscal Year 2017 Results
 November 21, Analog Devices Reports Fourth Quarter and Fiscal Year Results NORWOOD, Mass.--(BUSINESS WIRE)-- Analog Devices, Inc. (Nasdaq: ADI), today announced financial results for its fourth quarter
Q Earnings. Webcast Presentation April 26, 2018
 Q1 2018 Earnings Webcast Presentation April 26, 2018 2 Q1 2018 Earnings Webcast 4/26/18 Safe Harbor Statement All statements made herein that are not historical facts should be considered as forward-looking
FirstService Corporation
 FirstService Corporation Investor Presentation November 2017 Forward Looking Statements Certain statements included herein constitute forward looking statements within the meaning of the U.S. Private Securities
EFI Q Earnings Call. January 25, 2017
 EFI Q4 2016 Earnings Call January 25, 2017 Safe Harbor For Forward-Looking Statements Certain statements in this presentation are forward-looking statements within the meaning of Section 27A of the Securities
First Quarter Fiscal 2016 Earnings Conference Call
 First Quarter Fiscal 2016 Earnings Conference Call May 4, 2016 Forward-Looking Statements This presentation includes forward-looking statements, within the meaning of Section 27A of the Securities Act
SYNNEX Concentrix Division Announces the Acquisition of Convergys
 Filed by SYNNEX Corporation pursuant to Rule 425 under the Securities Act of 1933, as amended and deemed filed pursuant to Rule 14a-12 under the Securities Exchange Act of 1934, as amended Subject Company:
Q EARNINGS CALL
 Tom Goeke Chief Executive Officer Q2 2017 EARNINGS CALL JULY 27, 2017 IMPORTANT INFORMATION Forward Looking Statements These slides contain (and the accompanying oral discussion will contain) forward looking
CDW Corporation. Webcast Conference Call February, CDW.com
 CDW Corporation Webcast Conference Call February, 7 2018 CDW.com 800.800.4239 Today's Agenda Fourth Quarter and YTD 2017 Results Key Performance Drivers and Strategic Progress Financial Results ASC 606
EARNINGS PRESENTATION Third Quarter 2018
 EARNINGS PRESENTATION Third Quarter 2018 DISCLAIMER 2 Discussion of Forward-Looking Statements by Newmark Group, Inc. and BGC Partners, Inc. Statements in this document regarding BGC and Newmark that are
Q Investor Presentation
 Q1 2016 Investor Presentation Legal Disclaimer This presentation contains "forward-looking statements" within the meaning of the Private Securities Litigation Reform Act of 1995. All statements contained
XYLEM INC. Q EARNINGS RELEASE MAY 1, 2018
 XYLEM INC. Q1 2018 EARNINGS RELEASE MAY 1, 2018 Q1 2018 EARNINGS RELEASE FORWARD-LOOKING STATEMENTS This presentation contains information that may constitute forward-looking statements. Forward-looking
2Q 2017 Highlights and Operating Results
 2Q 2017 Highlights and Operating Results July 25, 2017 1 2Q 2017 Highlights and Operating Results Table of Contents Page(s) 1 Sales Overview and Highlights 4-5 2 NSS Overview 6-7 3 EES Overview 8-9 4 UPS
First Quarter 2018 Earnings Call. May 10, 2018
 First Quarter 2018 Earnings Call May 10, 2018 Forward-Looking Statements This presentation includes certain statements relating to future events and our intentions, beliefs, expectations, and predictions
EFI Q E i arn ngs C C l a l ll July 25th, 2016
 EFI Q2 2016 Earnings Call July 25 th, 2016 Safe Harbor For Forward-Looking Statements Certain statements in this presentation are forward-looking statements within the meaning of Section 27A of the Securities
XYLEM INC. Q EARNINGS RELEASE OCTOBER 30, 2018
 XYLEM INC. Q3 2018 EARNINGS RELEASE OCTOBER 30, 2018 Q3 2018 EARNINGS RELEASE FORWARD-LOOKING STATEMENTS This presentation contains information that may constitute forward-looking statements. within the
New Revenue Rules ASC 606. September 5, 2017
 New Revenue Rules ASC 606 September 5, 2017 2 Welcome Safe Harbor Non-GAAP Financial Measures and Other Key Performance Measures To supplement our condensed consolidated financial statements, which are
United Rentals to Acquire RSC Holdings
 United Rentals to Acquire RSC Holdings Investor Presentation DECEMBER 2011 Introductory Information Cautionary Statement Regarding Forward-Looking Statements This document contains forward-looking statements
February 14, Q Earnings Presentation
 February 14, 2019 Q4 2018 Earnings Presentation Certain statements contained in this presentation that are not historical facts, including any statements as to future market conditions, results of operations,
Q215 Earnings Call. August 5, Silver Spring Networks. All rights reserved.
 Earnings Call August 5, 2015 Forward-Looking Statements This document contains forward-looking statements that involve risks and uncertainties. These forwardlooking statements include statements regarding
Second Quarter 2018 Earnings Conference Call. May 1, 2018
 Second Quarter 2018 Earnings Conference Call May 1, 2018 1 Safe Harbor Statement Our commentary and responses to your questions may contain forward-looking statements, including our outlook for the remainder
Investor Update September / October 2017
 Investor Update September / October 2017 [Beacon logo] Forward Looking Statements and Non-GAAP Measures This presentation contains forward-looking statements within the meaning of the Private Securities
4Q 2017 Highlights and Operating Results
 4Q 2017 Highlights and Operating Results January 30, 2018 1 4Q 2017 Highlights and Operating Results Table of Contents Page(s) 1 Sales Overview 4-8 2 Financial Performance Trends 9-16 3 Leverage Metrics
Quarterly Investor Presentation. First Quarter 2017
 Quarterly Investor Presentation First Quarter 2017 Forward Looking Statements This presentation contains statements about future events and expectations that constitute forward looking statements. These
FormFactor, Inc. Reports Strong Fourth Quarter and Full Year 2017 Results. Company anticipates continued growth and market share gains in 2018
 News Release Investor Contact: Stan Finkelstein Investor Relations (925) 290-4321 ir@formfactor.com FormFactor, Inc. Reports Strong Fourth Quarter and Full Year Results Company anticipates continued growth
Q4 & Full Year 2017 Earnings. Webcast Presentation February 1, 2018
 Q4 & Full Year 2017 Earnings Webcast Presentation February 1, 2018 2 Q4 & FY 2017 Earnings Webcast 2/1/18 Safe Harbor Statement All statements made herein that are not historical facts should be considered
Q EARNINGS 8/1/2018 CONFERENCE CALL. Copyright 2017 ARRIS Enterprises, LLC. All rights reserved
 Q2 2018 EARNINGS 8/1/2018 CONFERENCE CALL Copyright 2017 ARRIS Enterprises, LLC. All rights reserved Safe Harbor FORWARD-LOOKING STATEMENTS Statements made in this presentation, including those related
Quarterly Update FY16 Fourth Quarter. November 8, 2016
 Quarterly Update FY16 Fourth Quarter November 8, 2016 Johnson Controls International plc Cautionary Statement Regarding Forward-Looking Statements Johnson Controls International plc has made statements
NASDAQ: MLHR. Herman Miller, Inc. Raymond James 36 th Annual Institutional Investors Conference March 4, 2015
 NASDAQ: MLHR Herman Miller, Inc. Raymond James 36 th Annual Institutional Investors Conference March 4, 2015 1 Forward Looking Statements This information contains forward-looking statements within the
FY 2018 Third Quarter Earnings Conference Call. August 7, 2018
 FY 2018 Third Quarter Earnings Conference Call August 7, 2018 Agenda TransDigm Overview, W. Nicholas Howley Highlights and Outlook Executive Chairman Operating Performance and Market Review Kevin Stein
Q Earnings Call. November 5, 2012
 Q4 2012 Earnings Call November 5, 2012 Forward-Looking Statements and Non-GAAP Measures Forward-Looking Statements -- This presentation contains certain forward-looking statements within the meaning of
Veritiv Corporation Second Quarter 2016 Financial Results August 9, 2016
 Veritiv Corporation Second Quarter 2016 Financial Results August 9, 2016 Tom Morabito Director of Investor Relations 2 Safe Harbor Provision Certain statements contained in this presentation regarding
Q Financial Results
 Q2 2018 Financial Results August 1, 2018 Copyright Fortinet Inc. All rights reserved. Safe Harbor Statement Information, statements and projections contained in these presentation slides and related conference
Q Financial Results
 Q4 2016 Financial Results February 2, 2017 Copyright Fortinet Inc. All rights reserved. Safe Harbor Statement Information, statements and projections contained in these presentation slides and related
RGS Energy Reports First Quarter 2014 Results
 RGS Energy Reports First Quarter 2014 Results LOUISVILLE, CO, May 14, 2014 RGS Energy (NASDAQ: RGSE), a nationwide leader of turnkey solar energy solutions for residential, commercial, and utility customers,
First Quarter 2018 May 3, 2018
 First Quarter 2018 May 3, 2018 Safe Harbor Please note that in this presentation, we may discuss events or results that have not yet occurred or been realized, commonly referred to as forward-looking statements.
US Ecology, Inc. Q Earnings Conference Call
 US Ecology, Inc. Q2 2018 Earnings Conference Call August 3, 2018 1 Today s Hosts Jeff Feeler Chairman & Chief Executive Officer Eric Gerratt Executive Vice President & Chief Financial Officer Steve Welling
EFI Q Earnings Call. October 21, 2014
 EFI Q3 2014 Earnings Call October 21, 2014 Safe Harbor For Forward-Looking Statements Certain statements in this press release are forward-looking statements within the meaning of Section 27A of the Securities
Management s Prepared Remarks Third Quarter Conference Call November 6, 2018
 Management s Prepared Remarks Third Quarter Conference Call November 6, 2018 Tabitha Zane Vice President, Investor Relations On the call today are Jerry Volas, Chief Executive Officer, Robert Buck, President
NOVELIS Q2 FISCAL 2018 EARNINGS CONFERENCE CALL
 NOVELIS Q2 FISCAL 2018 EARNINGS CONFERENCE CALL November 2, 2017 Steve Fisher President and Chief Executive Officer Devinder Ahuja Senior Vice President and Chief Financial Officer SAFE HARBOR STATEMENT
Q4 & FY 2017 EARNINGS PRESENTATION MARCH 13, 2018
 Q4 & FY 2017 EARNINGS PRESENTATION MARCH 13, 2018 FORWARD-LOOKING STATEMENTS & NON-GAAP FINANCIAL INFORMATION 2 FORWARD-LOOKING STATEMENTS This presentation contains, and management may make on our call
Fourth Quarter and Full Year 2017 Conference Call
 Fourth Quarter and Full Year 2017 Conference Call Investor Presentation St. Paul, MN January 24, 2018 Safe Harbor & Regulation G 2 Safe Harbor Statement Certain matters discussed today may include 'forward
Quarterly Update FY17 Fourth Quarter. November 9, 2017
 Quarterly Update FY17 Fourth Quarter November 9, 2017 1 Johnson Controls plc. November 9, 2017 Johnson Controls International plc Cautionary Statement Regarding Forward-Looking Statements Johnson Controls
3Q Presentation. November 7, 2017
 3Q Presentation November 7, 2017 SAFE HARBOR Statements contained in this presentation that are not historical and reflect our views about future periods and events, including our future performance, constitute
Albemarle Corporation Fourth Quarter 2017 Earnings and Non-GAAP Reconciliations Conference Call/Webcast Wednesday, February 28 th, :00am ET
 Albemarle Corporation Fourth Quarter 2017 Earnings and Non-GAAP Reconciliations Conference Call/Webcast Wednesday, February 28 th, 2018 9:00am ET Proprietary Information of Albemarle Corporation. Forward-Looking