Corporate Presentation and 1Q16 Results
|
|
|
- Rolf Nelson
- 5 years ago
- Views:
Transcription


1 Corporate Presentation and 1Q16 Results
2 Disclaimer This presentation may contain statements that present expectations of the Management of Mills Estruturas e Serviços de Engenharia S/A ( Mills ) about future events or results. Such statements are based on beliefs and assumptions of our Management taken with our best knowledge and information to which Mills currently has access. All statements, when based on future expectations, and not on historical facts, involve various risks and uncertainties, and are not performance guarantees. Mills and employees cannot guarantee that such statements will prove to be correct. Such risks and uncertainties include factors relating to the Brazilian economy, the capital markets, the infrastructure, real estate, and oil and gas sectors, competitive pressures, among others, and governmental rules that are subject to change without notice. For additional information on the factors that may give rise to results different from those estimated by Mills, please consult the reports filed with the the Brazilian Comissão de Valores Mobiliários (CVM). 2
3 1. Industry Overview 2. Company Overview 3. Business Units 4. Financial Profile 3
4 Brazil Macro Fundamentals In R$ million The uncertainties in the economic and political environments continue to impact the markets in which we operate. The deterioration of the fiscal situation of the Government and the lack of confidence in the market resulted in the paralysis of the economy. There is a hope that the new government can carry out reforms and foster infrastructure investments. GDP Growth Inflation¹ 7,5% 10,6% 2,7% 1,0% 2,3% 0,1% 5,9% 6,5% 5,8% 5,9% 6,4% -3,8% Interest Rates² BNDES Disbursements R$ billion 8,75% 12,25% 7,25% 10,00% 11,00% 14,25% 168,4 138,9 156,0 190,4 187,8 135,9 18,1 4 Source: Brazilian Central Bank (1) IPCA end of period (2) Selic end of period
5 Brazil lags behind other BRIC countries in quality of infrastructure There is a significant demand for better infrastructure in Brazil, which can reduce the country s growth bottleneck. The quality of Brazil s highways, railways, ports and air transport are very poor, increasing the cost of Brazil. Infrastructure quality ranking for BRIC countries ( ) Index 1.0 (best) Highways Railways Ports Air Transport China 0,7 China 0,7 China 0,6 China 0,7 India 0,6 India 0,6 India 0,6 India 0,6 Russia 0,4 Russia 0,6 Russia 0,6 Russia 0,6 Brazil 0,4 Brazil 0,2 Brazil 0,4 Brazil 0,5 USA 0,8 USA 0,7 USA 0,8 USA 0,9 5 Source: The Global Competitiveness Report
6 Investments in infrastructure in Brazil are historically low Country growth requires more investments in infrastructure. In order for Brazil to boost its economic growth and approach in years the quality of infrastructure of advanced emerging economies, it needs to invest in infrastructure approximately 6% of its GDP. Investment in Infrastructure Brazil (% GDP) Investment in Infrastructure (% GDP) 16% Thailand (2009) = 15.6 Thailand (2003) = 15.4 China (2010) = 13.4 China (2003) = 7.3 5,4 0,5 14% 12% India ( ) = 6.0 Chile ( ) = 5.1 2,0 3,6 0,2 10% 8% India ( ) = 4.8 Chile (2001-6) = 4.6 Peru ( ) = 4.2 India ( ) = 4.1 0,8 1,5 2,3 2,3 2,1 0,2 0,2 0,2 0,4 0,6 0,6 0,9 0,7 0,7 0,5 2,1 1,5 0,8 0,6 0,7 1971/ / / / /14 Electricity Telecom Transportation Water and Sanitation Total (% GDP) 6% 4% 2% 0% Brazil ( ) = 2.3 Brazil (2007) = 1.8 Peru (2001-6) = 1.5 Level of investment necessary to maintain the capital stock per capita 4-6% Level of investment in infrastucture necessary to reach the current levels of South Korea and other industrialized countries of East Asia 5-7% Level of investment Other Contries and necessary to boost its investments its economic growth and approach in years the advanced emerging economies Source: InterB 6
7 Brazilian Outlook On May 12, 2016 the acting President Michel Temer announced a provisory measure (MP 727) to launch the infrastructure program Programa de Parcerias de Investimento PPI (Program of Investment Partnerships), focused on job creations, with the goal to expand investment opportunities, employment and stimulate technological development. The program wants to ensure expansion with quality" of infrastructure, with adequate rates and prices, strengthening the regulatory role of the State and the autonomy of the regulatory agencies. Details of the program have not been announced. Main changes expected in the new program, according to the brazilian press articles: Projects rates of return will be established by the market and would not have a cap pre-established by the Federal Government; Exclude the state owned company Infraero and Valec from new airport and railway concessions s shareholder structure, given the current fiscal consolidation environment. Source: Brazilian newspapers 7
8 New Logistics Investment Program (PIL) of the Federal Govt. Estimated investments in R$ billion Total length to be invested (new and existing concessions - in Km) Airports 8,5 Railroads Ports 37,4 Highways Highways 66,1 Railroads 86,4 until ,2 35% Total 198,4 After ,2 65% PIL Source:
9 1. Industry Overview 2. Company Overview 3. Business Units 4. Financial Profile 9

10 Our Company Complete in engineering products and services, in Brazil for more than 60 years. With ability to plan, integrate services and products for the construction and industry sectors. We invest in the expertise of our team of professionals, which, allied to our diversified experience, allows us to deliver prompt, clever and reliable solutions that increase our clients results and productivity in construction works. National Coverage:19 States and Federal District in 33 locations Highlights & Shareholder Structure¹ Approximately 1,600 employees Capillary attendance to the whole country 2 business segments: Construction and Rental Portfolio with more than 50 products Board of Directors and Executive Officers 0,4% Shares in Treasury 1,3% Nacht Family 34,5% Free Float 63,8% 10 (1) As of April
11 Construction Rental Business Units Market leader, extensive track record, with more than 60 years of experience in the infrastructure sector. Focus on Infrastructure, Industrial, Residential and Commercial projects. Sales and rental of concreting and shoring, providing engineering solutions, services of technical planning, project and supervision related to equipment. Market leader; started in 2008 Focus Civil Construction, Industry, Retail and Others. Rental and sale of motorized access equipment, such as aerial work platforms and telescopic handlers. 1Q16: Equipment volume: approximately 114,000 tons Average duration of contracts: 18 months for infrastructure projects and 8 months for real estate projects Number of active contracts: 192 for infrastructure and 816 for real estate 1Q16: Equipment volume: approximately 6,100 equipment Average duration of contracts: 7 months for long term contracts and 2 months for spot contracts Number of active contracts: 2,011 11


 In 2007. two private equity funds.")


12 Company History Founded on First Brazilian manufacture of formwork by license agreement with NOE- Schaltechnik from Germany Sells Events Unit Acquired Jahu Ltda Initiates its Rental Unit 50`s Catedral da Sé 90`s Ferrovia do Aço 80`s hydroelectric power plant Lajeado Paiva construction work Maracanã Stadium Joint Venture with Aluma Systems Inc. of Canada (until 2001) In two private equity funds. managed by IP, and Axxon, became our shareholders. Acquiring, each one, 10%. Mills IPO 2013 Petrobras Oil platform 2016 Cable-stayed bridge BRT Transcarioca 12 Sale of the Industrial Services business unit Capital Increase. with the issuance of 47,528,517 new common shares, in the total amount of R$ 124,999,999.71


13 What We Do? Formwork Special systems Shoring Access 13
14 Presence on all Construction Phases Our work starts on preliminary economic and technical viability studies and go until the end of the projects. Thus, we ensure the use of the best engeneering solutions. Viability Studies Executive Projects Implementation (Construction Site) Foundation Structure Finishing The knowledge and strategic partnerships allow us to provide the BEST solution in terms of quality, costs, risks, deadlines and interferences. Our product mix enables the execution of the best solutions. Supply of scaffolding, aerial work platforms, water tank shoring etc. Supply of scaffolding, forms and shoring. Supply of shoring systems, formwork, scaffolding, aerial work platforms and telehandlers. Supply of aerial work platforms, mast climbing work platform, liftpod and scaffolding. 14


15 Strengths and Competitive Advantages Best-in-class engineering and technical capabilities and SLA Know-how to work in complex projects, such as bridges, subways and hydroelectric power plants; Recognition of its differentiated services and reliability; Market leader in its core business units Largest footprint and fleet in Brazil in all business units High capillarity: present in 19 States and Federal District in 33 locations; 114,000 tons of equipment in the Construction business unit vs 60,000 tons of equipment of the second player; 6,100 equipment in the Rental business unit vs 2,900 equipment of the second player Diversified revenue streams Diversified revenue base serves several segments through its business units; Rental: Construction 48% and Non-construction 37% Heavy Construction: Urban Mobility 29%, Logistics 38%, Industrial 16%, Others 17% Real Estate: 57% Residential, 25% Commercial and Others 17% Strong brand name and reputation Undisputable track record, with more than 60 years of history; Strong and long-term customer base around 3,000 active contracts in all business units Corporate Governance Listed on Bovespa at the highest corporate level (Novo Mercado) since 2010; Audited by Big Four Companies and currently by KPMG; Professional Management 15
16 Lean Organizational Structure to Face Market Challenges Sérgio Kariya CEO Ricardo Gusmão Commercial Officer for Construction Avelino Garzoni Engineering and Operations Officer Marcelo Yamane Rental Executive Gustavo Zeno CFO and IRO T.B.N Human Resources Executive Construction Headcount as of December Shared Services Engineering Rental Construction ¹ 2011¹ 2012¹ (1) Excludes Industrial Services, sold in 2013
17 Management Team Committed with Corporate Governance High Corporate Governance Standards Board comprised of 6 members, of which 3 are independent Fiscal Council, permanent, since 2012 Professional Management: Board s segregation (CEO and Chairman) Code of Conduct Audited by Big Four Companies and currently by KPMG Listed in Novo Mercado (High level of corporate governance of BM&FBOVESPA) since 2010 ERP system (SAP) 17
18 1. Industry Overview 2. Company Overview 3. Business Units 4. Financial Profile 18


 Viaduct")
")

19 Construction: Strong Background Projects Subway Line 4 (São Paulo) Viaduct Rodovia Dutra (São Paulo) Cable-stayed bridge BRT Transcarioca (Rio de Janeiro) 19

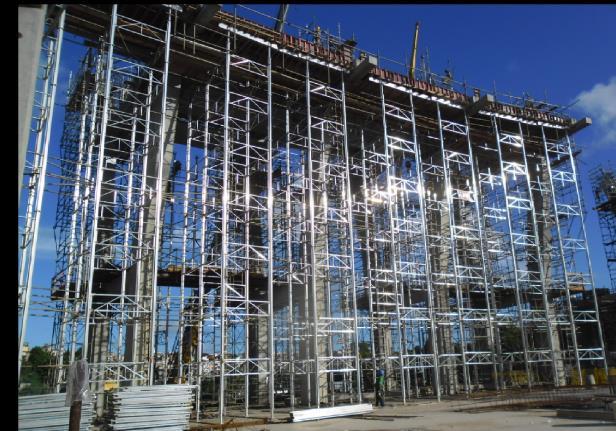


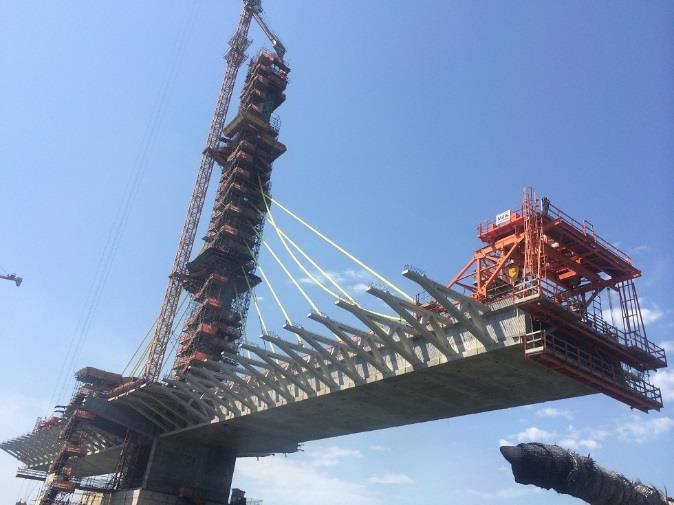

20 Construction: Strong Background Balanced Cantilevers and Trusses Concrete Formworks Shoring Systems 20
21 Construction: Strategy and Growth Drivers Growth Drivers Strategy Country growth requires more investment in infrastructure Huge potential investment in infrastructure in Brazil for upcoming years Significant investment from basic industries Increasing technical expertise requirements Increasing penetration of industrialized formwork Growing demand for full service solutions as provided by Mills Underdeveloped country in infrastructure Mills equipment volume: approximately 114,000 tons Equipment volume of 2º player in Brazil: approximately 60,000 tons Mills equipment volume is enough to supply the market in Brazil and several markets in Latin America. For the commercial business, focus on small industries and more complex projects other than residential Enhance relationship with midsized construction companies Careful selection and substantial investments in training to maintain highly qualified staff, superior to competition Introduction of new products to ensure equipment quality in line with top international standards International Market: establishment of new distribution channels and hiring of commercial representatives Brazilian market: development of sales partners in the Real Estate market 21
 Central west Vale s S11D Project Transposition of São Francisco River CSN Plant Southeast Salvador BA093 and Metropolitan Central-west and South Papuda Penitenciary Guaíba Bridge - RS South")
22 Construction: Main Works with Mills Participation North and Northeast North Corredor expresso Aguanambi (express roadway) Northeast Usina hidrelétrica São Manoel (hydroelectric plant) Ponte Tauape (bridge) Central west Vale s S11D Project Transposition of São Francisco River CSN Plant Southeast Salvador BA093 and Metropolitan Central-west and South Papuda Penitenciary Guaíba Bridge - RS South Southeast Nova Tamoios Highway Transbrasil Sorocaba and São José dos Campos Hospital Galvani Mining Company Cofins Airport Duplication Sanitation project Metropolitan Line 5 and Line 6 Monorail Linha Ouro Imigrantes Viaduct Beltway 22


23 Rental: Main Products Aerial Work Platforms Telescopic Handlers Others Equipment sale Technical Assistance Trainning 23

24 Rental: Market Perspective The market of aerial platform gained traction in 2007 with the revision of the Regulatory Safety Labor Norm 18 (NR18), which establishes that workers must be lifted with the use of motorized access equipment and economic growth. The current volume in Brazil (2015) is around 34,000 equipment, Mills owns approximately 6,100 equipment and the second player approximately 2,900. AWP¹ Rental Fleet per inhabitants A measure of market maturity is to assess the ratio: MEWP rental fleet versus country population Volume of Equipment Purchased in Brazil Potential Market Europe US CAN CHN BRA Source: Mills AWP¹: Mobile Elevating Work Platform
25 Rental: Strategy and Growth Drivers Growth Drivers Strategy Less than 20% of the Brazilian demand for equipment is actually rented (vis-à-vis Europe 80% and US 50%) Market penetration through substitution of less secure and efficient access methods Brazilian safety labor regulation driving demand for AWP (NR-18) Increasing client concern and demands for safety and productivity Immature market with low penetration Largest asset base and geographic presence Safest way to work on height Surpass Customer expectations (Availability + Reliability + Service Levels) Best in Class Service Level Agreement Differentiation through service Focused on growing non-construction segment Geographic expansion in the medium term Sinergy with the Construction business unit 25
26 1. Industry Overview 2. Company Overview 3. Business Units 4. Financial Profile 26
27 Summary Financials In R$ million Net Revenue Costs and Expenses ¹ 2011¹ 2012¹ 2013¹ LTM 1Q16 Equipment Rental Sales Technical assistance and others ¹ 2011¹ 2012¹ 2013¹ 2014² 2015³ LTM 1Q16³ COGS SG&A ADD Ebitda and Ebitda Margin Net profit 450,0 400,0 350,0 300,0 250,0 200,0 150,0 47,5% 47,0% 168,4 217,4 50,9% 339,0 419,3 50,4% 340,7 42,9% 28,0% 161,2 26,3% 142,8 60,0% 50,0% 40,0% 30,0% 20,0% 103,3 92,2 151,5 166,8 75,7 100,0 50,0 10,0% 2010¹ 2011¹ 2012¹ 2013¹ 2014² 2015³ LTM 1Q16³ 0,0 2010¹ 2011¹ 2012¹ 2013¹ 2014² 2015³ LTM1Q16³ 0,0% -60,1-63,4 27 Ebitda Ebitda Margin (1) Excluding Industrial Services business unit. sold in (2) Excluding easy set formwork cost adjustments of R$ 14.6 million in 2014 (3) Excluding Construction impairment of R$ 30.9 million and Rohr impairment of R$26.2 million in 2015
28 Rental Revenue Breakdown In R$ million Construction Business Unit Heavy Construction: Per Source of Resources R$ 23.9 million Heavy Construction: Per sector R$ 23.9 million Real Estate: Per Type R$ 15.8 million Power 4.6% Others 7.0% Railways 12.7% PPP 13.0% Private 47.3% Public 39.7% Sanitation 5.1% Industrial 16.2% Urban Mobility 28.8% Highways 21.1% Airports and ports 4.6% Others 17% Commercial 25% Residential 57% Rental Business Unit 28 Net Revenue per Type of Service R$ 76.4 million Sales 2% Others 2% Semi new equip. sales 30% Technical Assistance 1% Rental 65% Per Use R$ 49.9 million Non- Constructio n 37% Spot 15% Constructio n 48% Public: resources from the government Private: resources from the private sector. PPP (public private partnership) : resources from the government and the private sector
29 Utilization Rate and Net Revenue In R$ million 100% 90% Volume Utilization Rate Construction Net Revenue 80% 70% 60% 50,3 4,2 6,3 39,7 50% 40% 30% Utilization rate Average LTM 1Q16 = 47.9% Average 1Q16 = 44.1% 20% 10% 0% 1Q10 1T10 3T10 3Q10 1T11 1Q113T11 3Q111T12 1Q123T12 3Q121T13 1Q13 3T13 3Q13 1T14 1Q14 3T14 3Q14 1T151Q15 3T153Q15 1T161Q16 100% 90% 80% 70% Rental 4Q15 4T15 Volume Price Preço and e Mix Mix 1T16 1Q16 59,7 5,8 4,0 49,9 60% 50% 40% Utilization rate Average LTM 1Q16 = 61.6% Average 1Q16: 59.0% 30% 20% 10% 0% 1Q10 1T10 3T10 3Q10 1T11 1Q113T11 3Q111T12 1Q123T12 3Q121T13 1Q13 3T13 3Q13 1T14 1Q14 3T143Q14 1T151Q15 3T153Q15 1T161Q16 4Q15 4T15 Volume Price Preço and e Mix 1Q16 1T16 (*) Non segmentation of the utilization rate in the business unit Construction because the inventory of the equipment used in real estate and Infrastructure are shared Volume: variation of the revenue due to the rented volume in tons (Construction) and quantity of machines(rental) Price and Mix: variation of the revenue due to the variation of prices and products mix. 29
30 Free Cash Flow In R$ million Even on an adverse scenario. the Company remains generating free cash flow Cash Flow 295,5 383,7 372,7 288,3 281,9 158,9 198,9 116,1 80,8 79, Q16³ -31,2-208,9-154,3-356,5 Adjusted Operating Cash Flow¹ Adjusted Free Cash Flow 2 ¹Before interests paid referring to debentures and investment in rental. ² Before interests paid referring to debentures ³ includes R$ 29.2 million of revenue from sales of semi new equipment 30
 1.900,0 1.700,0 1.500,0 1.300,0 1.100,0 900,0 700,0 500,0 300,0 100,0-100,0 1.661,8 4,0% 1.617,7 2,0% 1.562,5 1.505,8 1.")
31 Consolidated: Financial Performance In R$ million Due to the reduction of the investments and assets sales. the average capital invested tends to fall. since it illustrates the average in the period. ROIC (LTM) 1.900, , , , ,0 900,0 700,0 500,0 300,0 100,0-100, ,8 4,0% 1.617,7 2,0% 1.562, , ,5 675,8 712,4 696,9 0,8% 654,7 632,5-2,9% -3,8% 801,5 776,3 747,2 716,6 681,7 1Q15 2Q15 3Q15 4Q15 1Q16 6,0% 4,0% 2,0% 0,0% -2,0% -4,0% -6,0% -8,0% -10,0% -12,0% Construction Rental Others¹ ROIC Invested Capital: is defined as the sum of the equity plus third parties capital (including all onerous. bank and nonbank debts) being both the average amounts in the last thirteen months. (1) Includes Rohr, Events and Industrial Services business units 31
32 Main Initiatives In R$ million ROIC Decomposition Net Revenue COGS (199.2) NOPAT (55.2) (15.3) SG&A² (257.4) (200.3) Depreciation: (166.8) ROIC LTM -3.8% Adjusted ¹-1.0% Construction: -5.3% Rental: 5.1% TI (rate of 30%) Rohr Dividends 1.5 Invested Capital 1,439.5 Net Rental PP&E Others ROIC = NOPLAT/Average Invested Capital ¹ Excluding impairment (R$57.1 million) from NOPAT ² including ADD in the amount of R$ 26.3 million
33 Summary Financials In R$ million 2010¹ 2011¹ 2012¹ 2013¹ 2014² 2015³ LTM 1Q16³ % Part Net Revenues Consolidated % Construction % Rental % Ebitda Consolidated % Construction % Rental % Others % Ebitda Margin Consolidated 47.5% 47.0% 50.9% 50.4% 42.9% 28.0% 26.3% Construction 45.3% 43.1% 48.0% 44.7% 36.3% 11.4% 9.3% Rental 53.6% 53.4% 55.7% 57.9% 53.0% 45.2% 43.1% Rental Equipment CAPEX Consolidated % Construction % Rental % Utilization rate (volume) Construction 76.5% 73.6% 75.4% 72.3% 63.0% 49.9% 47.9% Rental 77.9% 77.8% 72.5% 73.0% 63.2% 61.9% 61.6% Covenants EBITDA*/Net financial results >= Net Debt/EBITDA* <= (1) Excluding Industrial Services business unit, sold in 2013 (2) Excluding easy set formwork cost adjustments of R$14.6 million in 2014 (3) Excluding Construction impairment of R$30.9 million and Rohr impairment of R$26.2 million in 2015
34 Indebtedness In R$ million Gross Debt Profile Principal Amortization Schedule 31,2% 17.1% 31.0% 21.9% 21.9% 8.0% 68,8% 424 R$ 90 million already paid in April/16 Short Term Long Term We do not have foreign currency exposure Cash position Participation of the balance due (principal) excluding payment made in April/16 2.3% Indebtedness on 03/31/ ,4% ,3% IPCA CDI TJLP R$ 484 million considering the amount paid in April Principal Interests Gross Debt Cash Net Debt 34
35 Rewards and Recognition 2016 Elected as a Company with Contribution to secure access height - IAPA Awards 2015 Elected as pioneer company in Motorized Access IAPA Awards 2014 Elected best material supplier and best product in PINI s (national key magazine) ranking Executives ranked as the best of Latin America by Institutional Investidor magazine: Investor Relations, CEO and CFO Elected IPAF training center of the year IAPA Awards Elected best material supplier for Vale Ranked amongst the top 5 rental companies of motorized access equipment with the fastest growth and the 30rd largest of the world, according to Access International ranking Ranked amongst the top 10 well succeeded IPOs of the decade, according to Capital Aberto magazine ranking of 2011 Executives ranked as the best of Latin America by Institutional Investidor magazine: Investor Relations, CEO and CFO Elected best material supplier for Vale 2011 Elected Best Company for Access of the Year IAPA Awards Recognized for its contribution for Concrete Show - the largest technology event for the construction industry in Latin America 35

36 Key Takeaways Infrastructure investment needs to be substantially increased to meet social needs and support economic growth; Largest footprint: present in 19 States and Federal District in 33 locations; Largest fleet in Brazil in all business units; AWP: Immature market with low penetration and the safest way to work on height; Efforts to increase presence in the international market; Sales of assets aiming at to real estate market (lower turnover); Strengthen relationships with mid-sized construction companies Focus on non-construction markets for the Rental unit Continuous search for operational efficiency Management committed to Corporate Governance Agility and Matchless Executions Reliability Best in Class Solutions National Coverage Tailor Made Projects Complete Product Portfolio 36
37 Mills Investor Relations Phone: +55 (21)
Corporate Presentation and 1Q16 Results
 Corporate Presentation and 1Q16 Results Disclaimer This presentation may contain statements that present expectations of the Management of Mills Estruturas e Serviços de Engenharia S/A ( Mills ) about
Corporate Presentation and 4Q16 Results
 Corporate Presentation and 4Q16 Results 1. Company Overview 2. Revenue Drivers 3. Financial Profile 2 Our Company Complete in engineering products and services, in Brazil for more than 60 years. With ability
Corporate Presentation and 3Q17 Results
 Corporate Presentation and 3Q17 Results 1 Company Overview 2 Market Outlook 3 Financial Profile 2 Overview of Mills Complete in engineering products and services, in Brazil for more than 65 years. Company
Corporate Presentation
 Corporate Presentation June 2015 Executive Summary Heavy Construction Real Estate Rental Mills - Business Units Market leader. extensive track record, with more than 60 years of experience Focus on: large
Presentation of 2Q13 Results
 Presentation of 2Q13 Results Disclaimer This presentation may include declarations about Mills expectations regarding future events or results. All declarations based upon future expectations, rather than
Presentation of 1Q13 Results
 Presentation of 1Q13 Results Disclaimer This presentation may include declarations about Mills expectations regarding future events or results. All declarations based upon future expectations, rather than
Corporate Presentation March 2013
 Corporate Presentation March 2013 Disclaimer This presentation may include declarations about Mills expectations regarding future events or results. All declarations based upon future expectations, rather
Corporate Presentation
 Corporate Presentation November 2014 Executive Summary Heavy Construction Real Estate Rental Mills - Business Units Market leader, extensive track record, with more than 60 years of experience Focus on:
Net revenue % 2.5% EBITDA % -1.5% EBITDA margin (%) 46.7% 51.7% 49.7%
 46.7% 51.7% 49.7%") Investor Relations BM&FBOVESPA: MILS3 and OTC-US: MILTY Mills: Net cash flow becomes positive Rio de Janeiro, August 6, 2014 Mills Estruturas e Serviços de Engenharia S.A. (Mills) presented in the second
Investor Relations BM&FBOVESPA: MILS3 and OTC-US: MILTY Mills: Net cash flow becomes positive Rio de Janeiro, August 6, 2014 Mills Estruturas e Serviços de Engenharia S.A. (Mills) presented in the second
Presentation of 4Q12 Results
 Presentation of 4Q12 Results Disclaimer This presentation may include declarations about Mills expectations regarding future events or results. All declarations based upon future expectations, rather than
Blau Farmacêutica reaches Net Revenues of R$334 million and EBITDA of R$79 million on the first half of 2018
 Blau Farmacêutica reaches Net Revenues of R$334 million and EBITDA of R$79 million on the first half of 2018 São Paulo, August 13 th, 2018 - Blau Farmacêutica, one of the main Brazilian pharmaceutical
3Q14 Earnings Conference Call
 3Q14 Earnings Conference Call 2 Group Overview CONTAX IS THE LEADING CRM BPO COMPANY IN SOUTH AMERICA Contax Group at a glance Contax Group footprint and portfolio of services Contax Group Highlights 4
Mills Estruturas e Serviços de Engenharia S.A.
 Mills Estruturas e Serviços de Engenharia S.A. Quarterly information as at (A free translation of the original report in Portuguese containing financial statements prepared in accordance with accounting
Brazil s economic growth and use of the BNDES financing for strategic infrastructure projects. Tokyo June 21, Luciano Coutinho President
 Brazil s economic growth and use of the BNDES financing for strategic infrastructure projects Tokyo June 21, 2011 Luciano Coutinho President Brazil begins a new development cycle The Brazilian economy
2Q17 Net Revenues reached R$304.2 million, 4.7% below prior year, with revenues in Europe at historical high levels
 São Paulo, Brazil, August, 8 th 2017 - Metalfrio Solutions S.A. (FRIO3) ( Metalfrio ), one of the world s largest manufacturers of plug in commercial refrigeration equipment, announces its results for
Improving the Governance of State Owned Enterprises
 Improving the Governance of State Owned Enterprises by Liège Ayub for World Bank Int l Conference on Alternative Approaches for Increasing Infrastructure in Latin America and the Caribbean Lima, Peru on
Blau reaches LTM Net Revenues of R$ 677 million, the highest of its history
 Blau reaches Net Revenues of R$ 677 million, the highest of its history São Paulo, November 09 th, 2018 - Blau Farmacêutica, one of the main Brazilian pharmaceutical companies in the non-retail segment,
Blau reaches Net Revenues of R$618 million and Adjusted EBITDA of R$185 million in 2017, 43,3% and 78,3% respectively above the previous year
 Blau reaches Net Revenues of R$618 million and Adjusted EBITDA of R$185 million in 2017, 43,3% and 78,3% respectively above the previous year São Paulo, April 23 rd 2018 - Blau Farmacêutica, one of the
Investor Presentation
 March, 2010 1 Disclaimer This document can contain statements which constitute forward-looking statements. Such forward-looking statements are dependent on estimates, data or methods that may be incorrect
Earnings Release 4Q14
 Earnings Release 4Q14 Earnings 4Q14 Fleury ON (Bovespa FLRY3) (Bloomberg FLRY3 BZ; Thomson FLRY3-BR) Debentures: BRFLRYDBS007, BRFLRYDBS015 e BRFLRYDBS023 On December 31 st 2014: Shares Outstanding 156,293,356
Presentation of the Group
 The world s leading infrastructure developer Presentation of the Group Key figures & Global Strategy July 2012 Grupo ACS The world s leading infrastructure & concessions developer Engineering contractor
Localiza Rent a Car S.A.
 Localiza Rent a Car S.A. Confins airport branch Belo Horizonte 24h reservation 0800 979 2000 www.localiza.com 1 Integrated business platform 28,080 cars 172 agencies 1.2 million clients 16,600 cars 405
2015 and 4Q15 Results FLRY3. March 2016
 2015 and Results FLRY3 March 2016 Disclosure This presentation may contain forward-looking statements. Such statements are not statements of historical facts and reflect the beliefs and expectations of
Merger Presentation 90, 90, 90
 228, 132, 106 85, 134, 180 233, 234, 235 254, 221, 34 Merger Presentation 90, 90, 90 1, 64, 148 226, 31, 29 December 2017 UNIDAS TRACK-RECORD 1985-2000 2001-2009 2010-2012 2013-2015 2016 Foundation SAG
Institutional Presentation
 Institutional Presentation 2018 02.2 2 DISCLAIMER This presentation may contain certain forward-looking projections and trends that neither represent realized financial results nor historical information.
MAHLE REPORTS ADJUSTED EBITDA¹ OF R$ MILLION IN THE 2Q17; MARGIN OF 19.2%
 MAHLE REPORTS ADJUSTED EBITDA¹ OF R$ 110.9 MILLION IN THE 2Q17; MARGIN OF 19.2% Mogi Guaçu (SP), August 10, 2017 - MAHLE Metal Leve S.A. (B3: LEVE3), a Brazilian autoparts company that manufactures and
Investor Presentation. February 2008
 Investor Presentation February 2008 1 1 Highlights Among the most competitive steel companies in the world Strong low cost structure as a result of diversified production processes and multiple raw material
Highlights (4Q15 and full year 2015 vs 2014) President & CEO Petros Diamantides said:
 President & CEO Petros Diamantides said:") São Paulo, Brazil, March, 1st 2016 - Metalfrio Solutions S.A. (FRIO3) ( Metalfrio ), one of the world s largest manufacturers of plug in commercial refrigeration equipment, announces its results for the
São Paulo, Brazil, March, 1st 2016 - Metalfrio Solutions S.A. (FRIO3) ( Metalfrio ), one of the world s largest manufacturers of plug in commercial refrigeration equipment, announces its results for the
2015 Earnings Conference Call
 2015 Earnings Conference Call André B. Gerdau Johannpeter President & CEO Harley Lorentz Scardoelli CFO Heavy plate rolling mill starts operating in July at the Ouro Branco mill (MG). World steel demand
Commenting on the results, President & CEO Petros Diamantides said:
 São Paulo, Brazil, March, 5 th 2018 - Metalfrio Solutions S.A. (FRIO3) ( Metalfrio ), one of the world s largest manufacturers of plug in commercial refrigeration equipment, announces its results for the
OVERVIEW. Doing Business in Brazil Practical Business and Legal Considerations. Fabiano Gallo September, 2016
 OVERVIEW Doing Business in Brazil Practical Business and Legal Considerations Fabiano Gallo September, 2016 Impeachment of President Dilma Roussef I m p e a c h m e n t of P r e s i d e n t D i l m a R
IMPORTANT INFORMATION
 INSTITUTIONAL PRESENTATION Dec/2013 IMPORTANT INFORMATION This document contains forward-looking information to take into account regarding the business prospects, operational and financial results estimates
Investor Presentation 2017
 Investor Presentation 2017 Gerdau steel in the world www.gerdau.com 1 Outlook Gerdau Highlights 2 Economic outlook GDP Growth 2016 2017f 2018f World 3.1% 3.5% 3.6% US 1.6% 2.3% 2.5% Brazil -3.6% 0.5% 2.5%
Commenting on the results, President & CEO Petros Diamantides said:
 São Paulo, Brazil, May, 24 th 2018 - Metalfrio Solutions S.A. (FRIO3) ( Metalfrio ), one of the world s largest manufacturers of plug in commercial refrigeration equipment, announces its results for the
Investor Presentation
 March, 2010 1 Disclaimer This document can contain statements which constitute forward-looking statements. Such forward-looking statements are dependent on estimates, data or methods that may be incorrect
Management Proposal. Ordinary (and Extraordinary) General Meeting
 General Meeting") Management Proposal Ordinary (and Extraordinary) General Meeting General Meeting Manual April 27, 2017 1 Index I. Management Proposal... 3 II. Call Notice... 4 III. Guidance for Participation... 6 IV.
Management Proposal Ordinary (and Extraordinary) General Meeting General Meeting Manual April 27, 2017 1 Index I. Management Proposal... 3 II. Call Notice... 4 III. Guidance for Participation... 6 IV.
JSL S.A. and its subsidiaries Quarterly information at March 31, 2018 and report on review of quarterly information
 Quarterly information at March 31, 2018 and report on review of quarterly information (A free translation of the original report in Portuguese, as filed with the Brazilian Securities Commission (CVM),
Corporate presentation March 2018
 Corporate presentation March 2018 Agenda Overview and Strategy Financial Performance Healthcare Sector in Brazil Expansion Plan Ownership Structure and Governance 2 Agenda Overview and Strategy Financial
Jefferies Industrials Conference. August 11, 2015
 Jefferies Industrials Conference August 11, 2015 Forward-Looking Statements & Accounting Standards Cautionary Statement on Forward-Looking Statements: This document contains forward-looking statements
4Q2010 Conference Call Gerdau S.A. Consolidated IFRS
 4Q2010 Conference Call Gerdau S.A. Consolidated IFRS André Gerdau Johannpeter President and CEO Osvaldo B. Schirmer Vice-President and IRO March 3, 2011 1 Global Context 2010 vs. 2009 Growth of 15% in
Institutional Presentation
 Institutional Presentation October 2016 Caixa para descrição. Disclaimer This presentation contains estimates and forward-looking statements regarding our strategy and opportunities for future growth.
Institutional Presentation Caixa para descrição.
 Institutional Presentation 2016 Caixa para descrição. Disclaimer This presentation contains estimates and forward-looking statements regarding our strategy and opportunities for future growth. Such information
Corporate presentation May 2017 FLRY3
 Corporate presentation May 2017 FLRY3 Agenda Overview and Strategy Financial Performance Healthcare Sector in Brazil Expansion Plan Ownership Structure and Governance 2 Agenda Overview and Strategy Financial
Investor Presentation
 Investor Presentation 2017 www.gerdau.com 1 Outlook Gerdau Highlights 2 Better outlook for steel consumption Region / Country (in mt and %) 2017f 17/16 World 1,535 1.3% European Union 158 0.5% NAFTA 135
Ricardo Teles / Agência Vale. Vale s Performance in 2Q17
 Ricardo Teles / Agência Vale Vale s Performance in 2Q17 Rio de Janeiro, July 27 th, 2017 1 Agenda 2 This presentation may include statements that present Vale's expectations about future events or results.
Consolidated Income Statement - (R$ MM) 2Q16 2Q15. Balance Sheet 1Q Equity 2, , % Net Debt¹ % O ther 1Q
 2Q16 2Q15. Balance Sheet 1Q Equity 2, , % Net Debt¹ % O ther 1Q") Qualicorp S.A. BOVESPA:QUAL3 Shares Outstanding (06/30/2016) 274.325.288 shares Free Float (06/30/2016) 215.096.548 shares (78.4%) Cash and Cash Equivalents (06/30/2016) R$333.2 million São Paulo, August
Qualicorp S.A. BOVESPA:QUAL3 Shares Outstanding (06/30/2016) 274.325.288 shares Free Float (06/30/2016) 215.096.548 shares (78.4%) Cash and Cash Equivalents (06/30/2016) R$333.2 million São Paulo, August
Consolidated Income Statement - (R$ MM) 1Q16 1Q15. Balance Sheet 1Q Equity 2, , % Net Debt¹ % O ther 1Q
 1Q16 1Q15. Balance Sheet 1Q Equity 2, , % Net Debt¹ % O ther 1Q") Qualicorp S.A. BOVESPA:QUAL3 Last Price May 11 th, 2016 R$ 15.00/share São Paulo, May 11, 2016. QUALICORP S.A (BM&FBOVESPA: QUAL3), one of the leading full-service healthcare benefits administrator and
Qualicorp S.A. BOVESPA:QUAL3 Last Price May 11 th, 2016 R$ 15.00/share São Paulo, May 11, 2016. QUALICORP S.A (BM&FBOVESPA: QUAL3), one of the leading full-service healthcare benefits administrator and
Valid reports Net Revenue of R$412.1 million in 3Q17, down 3.2% from 3Q16 and up 5.2% from 2Q17.
 Valid reports Net Revenue of R$412.1 million in, down 3.2% from and up 5.2% from 2Q17. Rio de Janeiro, November 8 th 2017 Valid (B 3 : VLID3 - ON) announces today its results for the third quarter of 2017
Institutional Presentation December 31, 2015
 Institutional Presentation December 31, 2015 Disclaimer The statements contained in this report regarding the outlook on business, estimations on financial and operational results and growth prospects
EARNINGS RELEASE 1Q18
 , EARNINGS RELEASE Curitiba, May 8, 2018 RUMO S.A. (B3: RAIL3) ( Rumo ) and COSAN LOGÍSTICA S.A. (B3: RLOG3) ( Cosan Logística ) today announced their results for the first quarter of 2018 (), composed
Investor Presentation
 Investor Presentation 2017 www.gerdau.com 1 Outlook Gerdau Highlights 2 Better outlook for steel consumption Region / Country (in mt and %) 2017f 17/16 World 1,535 1.3% European Union 158 0.5% NAFTA 135
Corporate presentation August 2017 FLRY3
 Corporate presentation August 2017 FLRY3 Agenda Overview and Strategy Financial Performance Healthcare Sector in Brazil Expansion Plan Ownership Structure and Governance 2 Agenda Overview and Strategy
Positive free cash flow of R$68 million in 4Q16
 Positive free cash flow of R$68 million in São Paulo, February 23, 2017 Marfrig Global Foods S.A. Marfrig (BM&FBOVESPA Novo Mercado: MRFG3 and Level 1 ADR: MRTTY) announces today its results for the fourth
BRICs: actual growth and cooperation perspectives. International Advisory Council 3 rd Metting August 15, Luciano Coutinho President
 BRICs: actual growth and cooperation perspectives International Advisory Council 3 rd Metting August 15, 2011 Luciano Coutinho President Emerging countries remain ahead in worldwide growth Annual Growth
Consolidated Information
 Dear Shareholders: In, Gerdau prioritized positive free cash generation, which amounted to R$2.3 billion. This was achieved, in spite of the challenging scenario in the world steel industry, by reducing
Full Year Results 2014
 Legal disclaimer Information in this presentation may involve guidance, expectations, beliefs, plans, intentions or strategies regarding the future. These forward-looking statements involve risks and uncertainties.
April 26, Q11 Earnings Release. April 27, 2011
 April 26, 2011 1Q11 Earnings Release Share Price (03/31/2011) ROMI3 R$ 11.25/share Market Capitalization (03/31/2011) R$ 841 million US$ 516 million Number of shares (03/31/2011) Common: 74,757,547 Total:
1Q16 Results. Investor Relations Contact: Felipe Enck Gonçalves CFO and Investor Relations Director
 1Q16 Results Investor Relations Contact: Felipe Enck Gonçalves CFO and Investor Relations Director +55 (31) 3615-8400 ri@logcp.com.br www.logcp.com.br/relacoes-com-investidores A LOG COMMERCIAL PROPERTIES
JBS 3Q14 Results Presentation November 13 th, 2014
 JBS 3Q4 Results Presentation November 3 th, 04 Disclaimer This release contains forward-looking statements relating to the prospects of the business, estimates for operating and financial results, and
2Q17 Results Presentation
 2Q17 Results Presentation August 9, 2017 p. 1 2Q17 Highlights Growth of 97.4% in Net Income, reaching R$11.1 million in the quarter, Growth of 42.3% in the number of RAC daily rentals, to a record 2.7
4Q17 and 2017 Earnings Release
 4Q17 and 2017 Earnings Release Dear Investors, The Company remains focused on its strategy of growth with profitability, surpassing the mark of 208 thousand cars in fleet. In 2Q18, we maintained a strong
4Q14 Highlights. TUPY - Global reference in castings. Record EBITDA margin in a still challenging domestic scenario.
 TUPY - Global reference in castings A free translation of the original in Portuguese Z 4Q14 Highlights Record EBITDA margin in a still challenging domestic scenario. Conference Call Date: 02/27/2014 English/Portuguese
T4F Entretenimento S.A.
 T4F Entretenimento S.A. 1Q17 Earnings Release T4F Entretenimento S.A. BM&FBOVESPA: SHOW3 Quotation Closing on 03/31/2017: R$6.41 1Q17 Average Volume: 109.0 thousand (0.33% of the free float) Price on 05/10/2017:
Brookfield Incorporações S.A. Institutional Presentation 2012
 Brookfield Incorporações S.A. Institutional Presentation 2012 Important information This document contains forward-looking information to take into account regarding the business prospects, operational
Investor Presentation May Alaskan Way Viaduct (SR 99) Replacement Project, Seattle
 Replacement Project, Seattle") Investor Presentation May 2018 Alaskan Way Viaduct (SR 99) Replacement Project, Seattle Forward-Looking Statements Statements contained in this presentation that are not purely historical are forward-looking
Investor Presentation May 2018 Alaskan Way Viaduct (SR 99) Replacement Project, Seattle Forward-Looking Statements Statements contained in this presentation that are not purely historical are forward-looking
CAMIL ANNOUNCES ITS THIRD QUARTER RESULTS (3Q17) The Company reached an EBITDA of R$128.9 million with EBITDA margin of 11.
 The Company reached an EBITDA of R$128.9 million with EBITDA margin of 11.") CAMIL ANNOUNCES ITS THIRD QUARTER RESULTS (3Q17) The Company reached an EBITDA of R$128.9 million with EBITDA margin of 11.1% in 3Q17 São Paulo, January 11, 2018 Camil Alimentos S.A. ("Company" or "Camil")
CAMIL ANNOUNCES ITS THIRD QUARTER RESULTS (3Q17) The Company reached an EBITDA of R$128.9 million with EBITDA margin of 11.1% in 3Q17 São Paulo, January 11, 2018 Camil Alimentos S.A. ("Company" or "Camil")
JLG Industries, Inc. Delivering on the Plan. Credit Suisse Global Leveraged Finance Conference March 28, 2006
 JLG Industries, Inc. Delivering on the Plan Credit Suisse Global Leveraged Finance Conference March 28, 2006 Credit Suisse Conference 1 March 28, 2006 JLG Representatives Bill Lasky Chairman, President
Novembro de EDP Energias do Brasil
 Novembro de 2009 EDP Energias do Brasil Disclaimer This presentation may include forward-looking statements of future events or results according to regulations of the Brazilian and international securities
Consolidated Income Statement - (R$ MM) Balance Sheet 1Q Equity 2, , % Net Debt¹ % O ther 1Q
 Balance Sheet 1Q Equity 2, , % Net Debt¹ % O ther 1Q") Qualicorp S.A. BOVESPA: QUAL3 Shares Outstanding (3/30/2018) 283,176,825 shares São Paulo, May 10th 2018. QUALICORP S.A (B3: QUAL3), one of the leading full-service healthcare benefits trader, administrator
Qualicorp S.A. BOVESPA: QUAL3 Shares Outstanding (3/30/2018) 283,176,825 shares São Paulo, May 10th 2018. QUALICORP S.A (B3: QUAL3), one of the leading full-service healthcare benefits trader, administrator
2 nd QUARTER 2015 RESULTS
 2 nd QUARTER 2015 RESULTS DASA announces growth of 9.6% in Gross Revenue of R$815.0 million in DASA ON Bovespa: DASA3 Last Quoted price: R$10.00 Average daily trade volume R$0.5 Million in Market value
Investor Presentation December Alaskan Way Viaduct (SR-99) Replacement Project, Seattle
 Replacement Project, Seattle") Investor Presentation December 2017 Alaskan Way Viaduct (SR-99) Replacement Project, Seattle Forward-Looking Statements Statements contained in this presentation that are not purely historical are forward-looking
Investor Presentation December 2017 Alaskan Way Viaduct (SR-99) Replacement Project, Seattle Forward-Looking Statements Statements contained in this presentation that are not purely historical are forward-looking
INSTITUTIONAL PRESENTATION
 INSTITUTIONAL PRESENTATION DISCLAIMER This presentation contains estimates and forward-looking statements regarding our strategy and opportunities for future growth. Such information is mainly based on
CONTAX PARTICIPAÇÕES S.A. (Exact name of Registrant as specified in its Charter) Contax Holding Company (Translation of Registrant's name in English)
 Contax Holding Company (Translation of Registrant's name in English)") 6-K 1 contaxpr4q10_6k.htm EARNINGS RELEASE 4Q10 UNITED STATES SECURITIES AND EXCHANGE COMMISSION Washington, D.C. 20549 FORM 6-K REPORT OF FOREIGN ISSUER PURSUANT TO RULE 13a-16 OR 15d-16 OF THE SECURITIES
6-K 1 contaxpr4q10_6k.htm EARNINGS RELEASE 4Q10 UNITED STATES SECURITIES AND EXCHANGE COMMISSION Washington, D.C. 20549 FORM 6-K REPORT OF FOREIGN ISSUER PURSUANT TO RULE 13a-16 OR 15d-16 OF THE SECURITIES
Corporate presentation August 2018
 Corporate presentation August 2018 Agenda Overview and Strategy Financial Performance Healthcare Sector in Brazil Expansion Plan Ownership Structure and Governance 2 Agenda Overview and Strategy Financial
$100bn forecast in new investment following privatization of infrastructure assets for highways, railways, ports and airports
 Everywhere you do business $100bn forecast in new investment following privatization of infrastructure assets for highways, railways, ports and airports For information on doing business in Brazil, please
JSL S.A. and its subsidiaries Quarterly information at March 31, 2018 and report on review of quarterly information
 Quarterly information at March 31, 2018 and report on review of quarterly information (A free translation of the original report in Portuguese, as filed with the Brazilian Securities Commission (CVM),
Investor Presentation
 Investor Presentation 2017 www.gerdau.com 1 Outlook Gerdau Highlights 2 Region / Country (in Mt and %) 2017f 17/16 World 1,622 7.0% European Union 162 2.5% Better outlook for steel consumption NAFTA 139
Consolidated Income Statement - Balance Sheet 1Q Equity 2, , % Net Debt¹ % Other 1Q
 Qualicorp S.A. BOVESPA:QUAL3 Shares Outstanding (04/30/2017) 282,373,588 shares Free Float (04/30/2017) 236,056,267 shares (83.6%) Cash and Cash Equivalents (03/31/2017) R$688.1 million Investor Relations
Infrastructure Investments in Brazil
 Infrastructure Investments in Brazil 2 Limited investment in infrastructure... Infrastructure investments have tended towards 2.1% to 2.3% of GDP in the last two-and-a-half decades. Sharp declines in energy
Corporate Presentation 2Q16 Results. August 2016
 Corporate Presentation Results August 2016 1 Disclaimer The information contained in this presentation concerning Votorantim S.A. and its subsidiaries ( Votorantim ) may be deemed to include statements
Equitable access to basic services: the case of Sabesp
 Equitable access to basic services: the case of Sabesp São Paulo December, 2008 Three highlights... Sabesp is strongly committed to public policies and market standards for efficiency and profitability
D.A. Davidson & Co. Engineering & Construction Conference September 20, 2017 Chicago, IL
 D.A. Davidson & Co. Engineering & Construction Conference September 20, 2017 Chicago, IL Alaskan Way Viaduct (SR-99) Replacement Project, Seattle Forward-Looking Statements Statements contained in this
BUSINESS MEETING BRAZIL - CHINA. Brazilian Association of Infrastructure and Basic Industries. São Paulo May 13, 2011
 Brazilian Association of Infrastructure and Basic Industries BUSINESS MEETING BRAZIL - CHINA São Paulo May 13, 2011 Ralph Lima Terra Executive Vice-President 1 ABDIB AND INFRASTRUCTURE 2 ABDIB AND INFRASTRUCTURE
Springs Global: E-commerce revenue more than doubled yoy
 Springs Global: E-commerce revenue more than doubled yoy São Paulo, August 14 th, 2018 - Springs Global Participações S.A. (Springs Global), the Americas largest company in bedding, tabletop and bath products,
Highlights of the Period (*)
") B2W ANNOUCES GROSS REVENUE GROWTH OF 50% AND EBITDA GROWTH OF 67% FOR 1H07 Rio de Janeiro, Brazil, August 9, 2007 B2W Companhia Global do Varejo (Bovespa: BTOW3), company resultant from the merger between
B2W ANNOUCES GROSS REVENUE GROWTH OF 50% AND EBITDA GROWTH OF 67% FOR 1H07 Rio de Janeiro, Brazil, August 9, 2007 B2W Companhia Global do Varejo (Bovespa: BTOW3), company resultant from the merger between
Qualicorp Consultoria e Corretora de Seguros S.A.
 Qualicorp Consultoria e Corretora de BOVESPA: QUAL3 Shares Outstanding (6/30/2018) 283,176,826 shares Free Float (6/30/2018) 282,276,689 shares ( 99.7%) Cash and Cash Equivalents (6/30/2018) R$400.0 million
4Q16. Discussion Material
 Discussion Material - 2016 March, 2017 Disclaimer This document may contain prospective statements, which are subject to risks and uncertainties as they were based on expectations of the Company s management
EARNINGS RELEASE 1Q18 RESULTADOS
 EARNINGS RELEASE 1Q18 CONFERENCE CALL IN ENGLISH May 11 th, 2018 - Friday 10:00 a.m. (US ET) 11:00 a.m. (BRT) / 3:00 p.m. (London) Connecting Number: +1 (412) 317 6776 Code: Valid Webcast: click here Valid
FORWARD LOOKING STATEMENTS
 May 2015 FORWARD LOOKING STATEMENTS We are making some forward looking statements today that use words like outlook or target or similar predictive words. Such forward looking statements involve risks
Institutional Presentation 4Q17
 Institutional Presentation 4Q17 DISCLAIMER This presentation contains estimates and forward-looking statements regarding our strategy and opportunities for future growth. Such information is mainly based
INVESTORS MEETING. APIMEC 4Q13 and 2013
 INVESTORS MEETING APIMEC 4Q13 and 2013 Agenda History Company Profile Fundamentals 4Q13 Results and 2013 Additional Comments 2 Time Line June 2013 Brado Logística capitalization Discontinuation of Argentine
2017 RESULTS. JBS ended 2017 with a 18.9% higher EBITDA of R$13.4 billion. FY free cash flow was R$2.8 billion
 2017 RESULTS JBS ended 2017 with a 18.9% higher EBITDA of R$13.4 billion FY free cash flow was R$2.8 billion In 2017, net revenue was R$163.2 billion, equivalent to US$51.5 billion Gross profit totaled
Agenda. 1. Highlights FY 2012 Results. 2. Operational Performance Priorities for Financials. 5. Conclusion
 1MARCH 2013 Legal Disclaimer Information in this presentation may involve guidance, expectations, beliefs, plans, intentions or strategies regarding the future. These forward-looking statements involve
TOTVS S.A. Interim financial information (ITR) at June 30, 2017 and Independent auditor s report on the review of interim financial information
 at June 30, 2017 and Independent auditor s report on the review of interim financial information") TOTVS S.A. Interim financial information (ITR) at June 30, 2017 and Independent auditor s report on the review of interim financial information Interim financial information (ITR) - 6/30/2017 - TOTVS S.A.
TOTVS S.A. Interim financial information (ITR) at June 30, 2017 and Independent auditor s report on the review of interim financial information Interim financial information (ITR) - 6/30/2017 - TOTVS S.A.
3nd Quarter Results. November Economic - Financial Office and Investor Relations Office
 3nd Quarter Results November - 2011 - Economic - Financial Office and Investor Relations Office Disclaimer This presentation may contain forward-looking statements referring to SABESP s business outlook,
4Q17 and 2017 Earnings Release Operating and Financial Highlights
 Mogi das Cruzes, March 22, 2018 JSL (B3: JSLG3 and Level 1 ADR: JSLGY), the Company with the broadest portfolio of logistics services in Brazil and the leader in terms of net revenue, announces its 4Q17
Highlights of the Period
 B2W REPORTS A 39% GROWTH IN GROSS REVENUE, 50% IN EBITDA AND AN IMPROVEMENT OF 32 DAYS ON THE CASH CONVERSION CYCLE IN 1Q08. Rio de Janeiro, May 08, 2008 B2W Companhia Global do Varejo (BOVESPA: BTOW3),
Positive Free Cash Flow of R$39 million in 3Q16
 3Q16 Earnings Release Positive Free Cash Flow of R$39 million in 3Q16 São Paulo, November 10, 2016 Marfrig Global Foods S.A. Marfrig (BM&FBovespa Novo Mercado: MRFG3 and Level 1 ADR: MRTTY) announces today
INSTITUTIONAL PRESENTATION 3Q18. p. 1
 INSTITUTIONAL PRESENTATION 3Q18 p. 1 Market under transformation and with high growth potential Company ready to capture increase in profitability PROFITABILITY Scale business with high dilution potencial
1Q14 Results. May Economic - Financial Office and Investor Relations Office
 1Q14 Results May 2014- Economic - Financial Office and Investor Relations Office Disclaimer This presentation may contain forward-looking statements referring to SABESP s business outlook, operating and