SEATTLE S BEST COFFEE? Using ZRS and the Zacks Valuation Model to identify factors impacting equity valuations in 3 minutes or less
|
|
|
- Randolph Freeman
- 5 years ago
- Views:
Transcription


1 Using ZRS and the Zacks Valuation Model to identify factors impacting equity valuations in 3 minutes or less SEATTLE S BEST COFFEE?
 has grown from a small Seattle coffee shop into the world s largest coffeehouse, with locations in 58 counties and annual revenues exceeding $11 billion.")
 and Negative (bearish) arguments for a given stock.")
2 Starbucks: Can this International coffeehouse add value to your portfolio? For over 40 years Starbucks has been providing coffee, pastries and assorted beverages to the masses. Since it went public in 1992, Starbucks (SBUX) has grown from a small Seattle coffee shop into the world s largest coffeehouse, with locations in 58 counties and annual revenues exceeding $11 billion. It s useful before delving into the fundamental analysis of Starbucks to first look at the qualitative reports provided by the Sell Side brokers. Consensus Sell Side research is available within the Digest section of ZRS. In this single report one will find key consensus Positive (bullish) and Negative (bearish) arguments for a given stock. Additionally, you ll find recent news, target price and valuation and the key drivers behind the stock valuation. Below is an excerpt from the Starbucks Digest Report, outlining Key Positive and Negative Arguments: A read through these reports provides important information on the company and a good starting point for further analysis. Next we will start off by looking at a simple Performance Chart of Starbucks:
, one can compare the relative performance of Starbucks versus the S&P 500 to reveal when Starbucks has outperformed the market and vice versa.")
3 As you can see, following the most recent financial crisis in 2008 Starbucks has seen a healthy recovery, substantially outperforming the S&P 500 over the last 5 years. Using Zacks Research System (ZRS), one can compare the relative performance of Starbucks versus the S&P 500 to reveal when Starbucks has outperformed the market and vice versa. A downward trend indicates that the market is outperforming Starbucks, while an upward trend indicates the opposite. Notice in the above Performance graph relative to the S&P 500 Starbucks took a major hit in the years leading up to the financial crisis (represented by gray recession shading), but rebounded strong and has continued to outperform the S&P 500 since. To achieve further insight into the relationship between Starbucks and the overall market, it is also useful to view the Performance graph in absolute terms. As we can see from the below graph, Starbucks tends to move in the same general direction as the broad market, which is to be expected of a retail stock.


4 Also notice that in recent weeks, following a negative Q3 Earnings Surprise (see above), Startbucks has seen a sharp decline in both absolute and relative return, prompting several questions: 1. With the recent sell off, did the market overreact to the negative Earnings Surprise, making now a good time to buy into Starbucks? 2. With the recent sell off, will Starbucks continue to fall, making the stock a value trap? 3. Based on forecasts and current market conditions, what should Starbucks be valued at? The following commentary and analysis will explain how to uncover these answers and others using Zacks Research System (ZRS) and the Zacks Valuation Model (ZVM).

5 Zacks Valuation Model The Zacks Valuation Model is a visually oriented, five factor discounted earnings model that first appears in default mode. Default model inputs are derived exclusively from data contained within ZRS; no subjective adjustments to the data have been made by the Zacks analyst staff. Default results are objectively set with algorithms that generate the best possible starting point for analysis from which users are expected to provide overrides based on individual knowledge or forecasts of both company specific and macro economic factors. The Zacks Valuation Model can quantify any combination of: 1. Earnings forecasts 2. Earnings growth forecasts 3. Equity risk premium forecasts 4. Interest rate forecasts 5. Company specific risk issues. Chart Design: o Yellow line price line o Orange line operating earnings line (scaled by 10) o Red Model Earnings Tendency Line Chart Components: o Expected GR MN Consensus mean growth rate forecast of long term earnings growth, normally 3 5 years o MET GR Expected GR MN minus 1 standard deviation, also equal to the default slope of the earnings line o Model Return The Current and 1 year forecast return including dividends. Positive number: trading at a discount to current EPS growth forecast; Negative number: trading at a premium to current EPS growth forecast. o (MIG button) Sets the Current Model Return to zero. Note that when Current Model Return equals zero the model is in equilibrium; the Model PE equals the Actual PE and the Model Price equals the Actual Price, resulting in a market implied growth rate (MET GR) The Zacks Valuation Model is not a Black Box equity price generating tool, rather it is an exploratory tool through which analytical issues should be raised, researched and evaluated. The model will provide valuable results only when all default criteria has been analyzed, evaluated and overridden where necessary.
 from ZVM. Assuming default model inputs including a long term earnings growth forecast of 15.")
6 ZVM Analysis: The above graph illustrates the basic model inputs (risk free rate, equity risk premium, company specific risk, EPS F12M and consensus growth rate mean) and both Current and 1 Year outputs (Model PE F12M, Model Return, Model Price and Model EPS F12M) from ZVM. Assuming default model inputs including a long term earnings growth forecast of 15.73%, we can see that Starbucks might be undervalued by virtue of its current Model Return of 23.08%. Assuming a default forward 12 month EPS of 2.11 and a current Model Return of 23.08%, what level of earnings growth are investors pricing Starbucks at today? The current Model Return of 23.08% is effectively signaling that the investment community is not paying 15.73% 3 5 year forecast growth, but rather something much less. The ZVM can be used to calculate the market implied earnings growth rate. As one of the inputs into ZVM, the Model Earnings Trend Growth Rate (MET GR) is the slope of the Model Earnings Trend Line. As stated previously, the default growth rate input is calculated from the long term consensus growth rate estimate minus the standard deviation of the growth rate estimates amongst analysis. So in essence, the Model Earnings Trend Growth Rate is a conservative estimate of analysts estimates. So instead of using the default growth rate input, let s assume the market is currently efficient. By clicking the (MIG) button, all other inputs are held constant and the Model Earnings Trend Growth Rate is adjusted to a Current Model Return of 0%. This will allow us to view the market s earnings growth rate expectations based on the stock s current price. (See below)
7 Note that when the current Model Return is zero, the Model PE equals the Actual PE and the Model Price equals the Actual Price, resulting in a market implied growth rate (MET GR). In essence, MET GR now represents the 3 5 year growth rate at which the market (investment community) is currently paying for the stock. At this point, given the model input assumptions, one can assume that the broad market has placed a fair value on Starbucks at a 13.36% annual forecasted long term earnings growth rate. By taking the view that the market is efficient, we assume that all information and expectations are accurately reflected in stock prices. As we can see, there is a perceived difference between how the street (sell side) is currently pricing Starbucks stock versus implied valuations from the investment community as quantified by the Zacks Valuation Model (ZVM) market implied growth rate. So prior to making any buy or sell decisions based solely on the output provided by Zacks Valuation Model, we must ask ourselves if the consensus forecast earnings growth of 15.73% is sustainable and supportable? And is the market implied earnings growth rate of 13.36% sustainable and supportable? To figure this out we must delve further into the ZRS platform.

8 ZRS Analysis: To determine the accuracy of the valuations, its inputs and earnings growth forecasts, we need to first start by looking at a chart of historical forward P/E s for Starbucks. For Starbucks to be truly valued as a 15.73% growth stock it must attain a Model PE F12M of 29X. If we look at historic PE multiples, it is clear that in the past Starbucks has achieved multiples in excess of This tells us that ZVM s Model PE of based on default inputs is very plausible. Though, historic PE multiples alone do not confirm the accuracy of ZVM s prediction, it does however provide us with a basis from which to compare current multiples and market conditions to historic multiples and market conditions. To further confirm the accuracy of the ZVM prediction, we need to put the valuation ratios into context. Essentially, we need to examine how Starbucks PE multiples were affected by macroeconomic trends. We can do this by creating a custom 1 4 Panel chart within ZRS. The following four panel chart (from top to bottom) has PE F12M, Equity Risk Premium, Price Close and EPS BNRI.

9 As we can see from the four panel chart above, the equity risk premium has steadily increased over the past decade due to heightened risk aversion coupled with a decrease in interest rates. You ll also notice that the ERP and PE multiples have a strong inverse relationship, ie as ERP increases PE decreases. We can see that, based on forward earnings multiple history, 29X multiples are in fact attainable but not at current Equity Risk Premium levels north of 6%. Since 2007, forward earnings multiples of 29X were only attainable at Equity Risk Premium Levels between 4% and 5%. We can accurately conclude from this analysis that based on current levels of Equity Risk Premium, a valuation of 15.73% long term growth is simply not attainable until Equity Risk Premium levels decline. Next, we need to drill down and look at company specific metrics to further examine whether Starbucks valuation and forecasted earnings growth are sustainable and supportable. This can easily be done using the customized Margins View charts within ZRS. The following four panel chart (from top to bottom) shows Revenue TTM, Capital Expenditures, Gross Margin TTM and EBIT Margin TTM.

10 Since margins tend to be cyclical over the long term, most analysis of these trends should be done by viewing at least 20 years of data. As you can see from the above margin charts, Starbucks is a little unique in that their margins are not as cyclical as one may expect. A quick look at the chart shows that historically, the two margins (i.e. Gross Margin and EBIT Margin) have been pretty flat up until 2006, at which point they started to trend downward until they finally bottomed out in late 2008, at which point they rebounded sharply. Since revenue has increased over that same time period, we can conclude that the increase in margins is attributed to the company s top line growth and operating efficiencies (i.e. costs), in particular Capital Expenditures. Upon further investigation into the Comparative Sell Side Models provided in ZRS (see below), we see that Starbucks spent a lot of money on new stores from which may have contributed to the sharp decline in margins. Then, you ll notice in they actually closed most likely their least profitable stores, leading to a rebound in total margins. Finally, you ll also notice analysts project Starbucks to increase Total Stores in the upcoming years. (More discussion on this later) We can also conclude since both margins rebounded at a much higher rate than revenue that the increase in margins is primarily due to cost cutting measures (operating efficiency) as opposed to revenue growth (top line). To further analyze the model s prediction, let s take a closer look at ZVM s predicted growth rate relative to historic growth rates. We can do this by using Zack s unique Growth & Margin page within the Financials tab in ZRS:

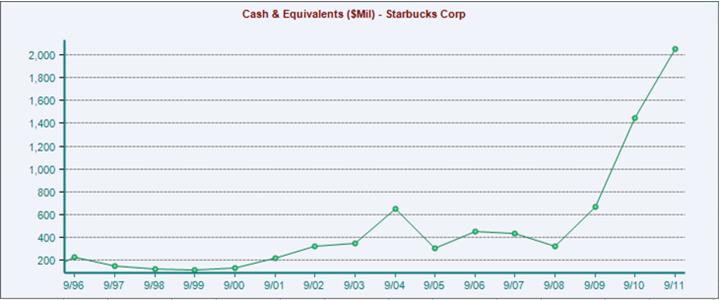
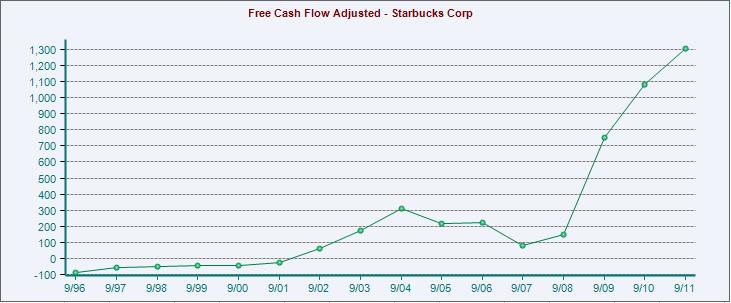
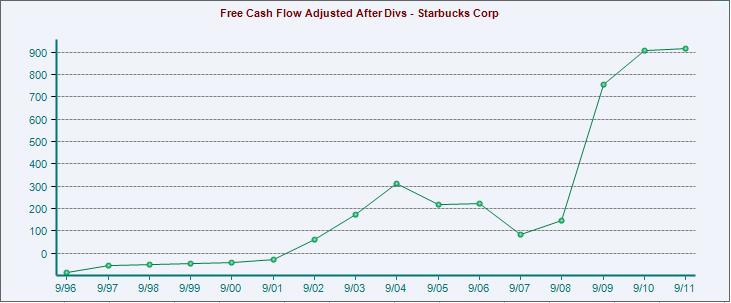
11 Zacks Growth and Margin view allows one to focus in on short term and long term diluted vs. aggregate growth in earnings and revenues. Incorporated into this view are year over year quarterly growth rates as well as sequential quarter to quarter growth rates in conjunction with EPS Surprise, Net Margins and year over year quarterly share changes. Upon first glance at the table, it s apparent that the 13.36% earnings growth, currently priced into the market, seems accurate relative to the lower of the top line (revenue) versus bottom line (earnings) growth. Although, considering what we learned from the Margins View, Earnings growth has been driven primarily by operating efficiencies as can seen by the steep rise in EBIT margins. Therefore, assuming Starbucks has trimmed all the fat so to speak and they can actually maintain record high EBIT Margin levels, their future Earnings growth will be dependent on primarily revenue growth. In other words, margins held equal, Starbucks Earnings Growth should translate to 1:1 to Revenue growth. So with that in mind, and given that Starbucks near term revenue growth is projected at 11%, it would seem that 13.36% Earnings Growth might be a little steep or that the market may be pricing in an acceleration in revenue growth post the next 4 quarters. Having drilled further into Starbucks fundamentals, we have uncovered evidence that the current market may have overvalued the firm. On the other hand, there is some support on the behalf that Starbucks is fairly valued, and perhaps even undervalued assuming Starbucks can maintain their operating margins and continue to grow revenues. But let s not stop there; let s take a look at how Starbucks has been managing their Cash Flow:
12

13 We can see that Starbucks especially in recent history has been effectively managing its cash flows. They continue to return capital to their investors via dividend disbursements, while simultaneously increasing their cash balance in absolute terms. In particular, since 2007 Starbucks has seen an adjusted Free Cash Flow increase of over 1200%. This excess cash gives Starbucks the discretion to use it in a number of ways. They can return capital to investors through a stock buyback program or by increasing their current dividend, or in an attempt to grow their top line they could increase capital expenditures in the form of new domestic or international stores. In summary, let us recall some of the fundamental data and trends previously expounded relative to Starbucks: 1. Relative cumulative outperformance over the past 5 year periods versus the S&P Relative cumulative outperformance over the past 5 and 10 years versus its relative industry peer composite. 3. Steady top line revenue growth over the last 10 years. 4. Strong bottom line margin growth over the last 5 years. 5. Effective cash flow management: quarterly dividend while growing a robust cash balance. Now, these facts can be added to the other information that was found using ZVM and ZRS: 6. Analysts consensus estimate of the 3 5 year earnings growth rate is expected to be 18.12%, which deviates slightly from the conservative default estimate of 15.73% used in the valuation. 7. Currently, the market is pricing an implied earnings growth rate of 13.36%, which is slightly lower than the analysts consensus estimate and ZVM s default earnings growth rate of 18.12% and 15.73%. 8. Based on the Growth and Margin view analysis, 13.36% implied growth appears to be factoring in revenue acceleration beyond what is being quantified in the next 4 quarter consensus revenue forecast. 9. Margins peaked and now appear to be flattening, indicating that future earnings will be mostly dependent on top line growth. 10. Despite ultra low interest rates and increasing equity premium over the past 5 years, its PE multiples have been quite stable due to Starbucks margin growth during that period. Given the evidence collected, it seems plausible that the investment community is in fact pricing in a return to revenue growth and that Starbucks could be undervalued if revenue growth were to actually accelerate. What we do know is that due to the leveling out of margins EBIT Margins must be at least maintained at current levels while Starbuck s expands top line revenue growth. Starbucks has done an impressive job of managing free cash flow, growing a substantial cash balance over the last 5 years. This gives Starbucks the necessary resources to continue their expansion into Europe and China (see Sell Side Model below) and continue re investing in other product lines they see fit.
Using ZRS and the Zacks Valuation. Model to identify factors impacting equity valuations in 3 minutes or less
 Using ZRS and the Zacks Valuation Model to identify factors impacting equity valuations in 3 minutes or less FAMILY DOLLAR (FDO) Family Dollar: Is this Recessionary Outperformer Still an Attractive Stock?
STARBUCKS & WHOLE FOODS MARKET: S&P 500 Laggards of 2014 ON THE Rebound IN 2015?
 Using ZRS and the Zacks Valuation Model to identify factors impacting equity valuations in 3 minutes or less Tim Nyland, CFA Managing Director Zacks Institutional Services January 26, 2015 STARBUCKS &
Walgreens A Prescription for Margin Recovery?
 Zacks Investment Research 12/30/2010 Walgreens A Prescription for Margin Recovery? Walgreens is a national retail pharmacy chain and considered the leader in innovative drugstore retailing. Walgreens pioneered
Demo 3 - Forecasting Calculator with F.A.S.T. Graphs. Transcript for video located at:
 Demo 3 - Forecasting Calculator with F.A.S.T. Graphs Transcript for video located at: http://www.youtube.com/watch?v=de29rsru9js This FAST Graphs, Demo Number 3, will look at the FAST Graphs forecasting
Manager. Microsoft (MSFT) Identifying Stocks Poised to Outperform
 Identifying Stocks Poised to Outperform") 3 Manager Using ZRS and the Zacks Valuation Model to identify factors impacting equity valuations in 3 minutes or less Tim Nyland, CFA Managing Director Microsoft (MSFT) Identifying Stocks Poised to Outperform
3 Manager Using ZRS and the Zacks Valuation Model to identify factors impacting equity valuations in 3 minutes or less Tim Nyland, CFA Managing Director Microsoft (MSFT) Identifying Stocks Poised to Outperform
CIF Stock Recommendation Report (Fall 2012)
") Section (A) Summary Date: 11/29/12 Analyst Name: Eric Russell CIF Stock Recommendation Report (Fall 2012) Company Name and Ticker:_Tiffany & Co (TIF) Recommendation Buy: Yes No Target Price: $71.00 Stop-Loss
Section (A) Summary Date: 11/29/12 Analyst Name: Eric Russell CIF Stock Recommendation Report (Fall 2012) Company Name and Ticker:_Tiffany & Co (TIF) Recommendation Buy: Yes No Target Price: $71.00 Stop-Loss
What Will Happen To the Stock Market When Interest Rates Rise? Part 1
 What Will Happen To the Stock Market When Interest Rates Rise? Part 1 July 21, 2016 by Chuck Carnevale of F.A.S.T. Graphs Introduction Interest rates have been in a freefall for the better part of the
CIF Stock Recommendation Report (Fall 2012)
") Date: 10/11/12 Analyst Name: Joseph Brendel CIF Stock Recommendation Report (Fall 2012) Section (A) Summary Company Name and Ticker: Prudential (PRU) Recommendation Buy: No Target Price: 35 Sector: Financials
Date: 10/11/12 Analyst Name: Joseph Brendel CIF Stock Recommendation Report (Fall 2012) Section (A) Summary Company Name and Ticker: Prudential (PRU) Recommendation Buy: No Target Price: 35 Sector: Financials
Global Economic and Market Outlook for Gavyn Davies, Chairman, Fulcrum Asset Management
 Global Economic and Market Outlook for 2018 Gavyn Davies, Chairman, Fulcrum Asset Management After many years of persistent downgrades to consensus GDP forecasts, 2017 has seen the first upgrades since
CIF Stock Recommendation Report (Fall 2012)
") Date: December 3, 2012 Analyst Name: Chris Letcher CIF Stock Recommendation Report (Fall 2012) Company Name and Ticker: Northern Trust Corporation (NTRS) Section (A) Summary Recommendation Buy: No Target
Date: December 3, 2012 Analyst Name: Chris Letcher CIF Stock Recommendation Report (Fall 2012) Company Name and Ticker: Northern Trust Corporation (NTRS) Section (A) Summary Recommendation Buy: No Target
SP500 Market Forecast for July 2011
 SP500 Market Forecast for July 2011 This document is designed to provide the trader and investor of the Standard and Poor s 500 with an overview of the seasonal tendency as well as the current cyclic pattern
PSYCHEMEDICS CORP. (PMD)
") DECEMBER 10, 2018 This article was written with David J. Flood from The Investor s Podcast Introduction Pychemedics Corporation is a U.S. based medical diagnostics & research company whose principal business
DECEMBER 10, 2018 This article was written with David J. Flood from The Investor s Podcast Introduction Pychemedics Corporation is a U.S. based medical diagnostics & research company whose principal business
20 Dividend Growth Stocks To Buy Today For Your Retirement Portfolios: Part 1
 20 Dividend Growth Stocks To Buy Today For Your Retirement Portfolios: Part 1 August 7, 2015 by Chuck Carnevale of F.A.S.T. Graphs Introduction We are in the seventh year of a strong bull market, and stock
CIF Stock Recommendation Report (Fall 2012)
") Date:_10/9/2012 Analyst Name: Scott R. Mertens CIF Stock Recommendation Report (Fall 2012) Company Name and Ticker:_JPMorgan Chase_(JPM) Section (A) Summary Recommendation Buy: Yes Target Price: $49.24
Date:_10/9/2012 Analyst Name: Scott R. Mertens CIF Stock Recommendation Report (Fall 2012) Company Name and Ticker:_JPMorgan Chase_(JPM) Section (A) Summary Recommendation Buy: Yes Target Price: $49.24
U.S. Stocks: Can We Capture Acceptable Returns From Here?
 March 2015 For discretionary use by investment professionals. U.S. Stocks: Can We Capture Acceptable Returns From Here? Editor s Note: The following commentary was written by Litman Gregory co founder
Current Ratio - General Fund
 Current Ratio - General Fund Are General Fund expenses able to be paid as they come due? Description: This measure is designed to focus on the liquidity position of the County s General Fund that has arisen
The Yield Curve WHAT IT IS AND WHY IT MATTERS. UWA Student Managed Investment Fund ECONOMICS TEAM ALEX DYKES ARKA CHANDA ANDRE CHINNERY
 The Yield Curve WHAT IT IS AND WHY IT MATTERS UWA Student Managed Investment Fund ECONOMICS TEAM ALEX DYKES ARKA CHANDA ANDRE CHINNERY What is it? The Yield Curve: What It Is and Why It Matters The yield
Profit Margins Expand to New Highs to Boost 2Q17 Results
 Profit Margins Expand to New Highs to Boost 2Q17 Results August 7, 2017 by Urban Carmel of The Fat Pitch Summary: The headline numbers for 2Q17 financial reports are good: S&P profits are up 19% yoy; sales
Fund Managers Get Bullish
 Fund Managers Get Bullish November 15, 2017 by Urban Carmel of The Fat Pitch Summary: Global equities have risen 18% so far in 2017 and yet, until this month, fund managers have held significant amounts
Analyzing the Elements of Real GDP in FRED Using Stacking
 Tools for Teaching with Analyzing the Elements of Real GDP in FRED Using Stacking Author Mark Bayles, Senior Economic Education Specialist Introduction This online activity shows how to use FRED, the Federal
CIF Sector Recommendation Report (Fall 2012)
") Date: 4/24/13 Analyst: Kyle Temple CIF Sector Recommendation Report (Fall 2012) Sector Technology Review Period 4/8-4/19 Section (A) Sector Performance Review Cougar Investment Fund Sector Review Spreadsheet
Date: 4/24/13 Analyst: Kyle Temple CIF Sector Recommendation Report (Fall 2012) Sector Technology Review Period 4/8-4/19 Section (A) Sector Performance Review Cougar Investment Fund Sector Review Spreadsheet
JOHN MORIKIS: SEAN HENNESSY:
 JOHN MORIKIS: You ll be hearing from Jay Davisson, our president of the Americas Group, Cheri Pfeiffer, our president of our Diversified Brands Division, Joel Baxter, our president of our Global Supply
Market Insight: Turn Down the News Volume, Listen to the Market
 August 9, 2018 Market Insight: Turn Down the News Volume, Listen to the Market If you just listened to the news headlines, it would be hard to find reasons to like this market. Trade Wars ; Tariff Threats
April The Value Reversion
 April 2016 The Value Reversion In the past two years, value stocks, along with cyclicals and higher-volatility equities, have underperformed broader markets while higher-momentum stocks have outperformed.
XTF Research App: Delivering Micro Trends to Your Desktop
 XTF Research App: Delivering Micro Trends to Your Desktop by: SA Editors December 02, 2010 This article is part of a regular series in which we interview our App Providers - the folks that develop the
CIF Stock Recommendation Report (Spring 2013)
") Date: 2/26/13 Analyst Name: Frank McLaughlin CIF Stock Recommendation Report (Spring 2013) Company Name and Ticker: PPG Industries Inc. (PPG) Section (A) Summary Recommendation Buy: Yes No Target Price:
Date: 2/26/13 Analyst Name: Frank McLaughlin CIF Stock Recommendation Report (Spring 2013) Company Name and Ticker: PPG Industries Inc. (PPG) Section (A) Summary Recommendation Buy: Yes No Target Price:
S&P 500 Update: Week ending May 11th 2018
 S&P 500 Update: Week ending May 11th 2018 1. Market Recap: The S&P 500 closed higher by 2.2% for week and broke out of some key resistance areas and a short term downtrend. There are 4 topics now setting
Trailing PE Forward PE 8.1. Buy 6 Analysts. 1-Year Return: 21.4% 5-Year Return: 143.6%
 Last Close 43.85 (CAD) Avg Daily Vol 35,574 52-Week High 54.80 Trailing PE 12.3 Annual Div 1.24 ROE 20.1% LTG Forecast -- 1-Mo -1.2% 2019 April 04 TORONTO Exchange Market Cap 593M 52-Week Low 30.42 Forward
Valuation Multiples: A Tool for Fundamental & Firm Analysis
 Valuation Multiples: A Tool for Fundamental & Firm Analysis Bridget Lyons Sacred Heart University Valuation multiples include such metrics as price to earnings (P/E), enterprise value to earnings before
User Guide for Schwab Equity Ratings Report
 User Guide for Schwab Equity Ratings Report The Schwab Equity Ratings Report will help you make informed decisions on equities by providing you with important additional information and analysis. Each
Utilities Sector Outlook
 Utilities Sector Outlook UTILITIES SECTOR REPORT 11 October 2017 ANALYST(S) Andy Pusateri, CFA Andy Smith, CFA Edward Jones clients can access the full research report with full disclosures on any of the
INTRODUCTION TO OPTION PUTS SERIES 9
 Hello again, This week we will summarize another strategy for trading Options. PUTS, which are the exact opposite of CALLS. Options are considered more risky trades because of the time decay involved.
BlackRock Inc: Fundamental Stock Research Analysis
 BlackRock Inc: Fundamental Stock Research Analysis May 9, 2013 by Team of F.A.S.T. Graphs Before analyzing a company for investment, it s important to have a perspective on how well the business has performed.
DRAM Weekly Price History
 1 9 17 25 33 41 49 57 65 73 81 89 97 105 113 121 129 137 145 153 161 169 177 185 193 201 209 217 225 233 www.provisdom.com Last update: 4/3/09 DRAM Supply Chain Test Case Story A Vice President (the VP)
All data published in this report is available on FactSet. Please contact or FACTSET for more information.
 John Butters, Senior Earnings Analyst jbutters@factset.com Media Questions/Requests media_request@factset.com April 13, 2018 Key Metrics Earnings Scorecard: For Q1 2018 (with 6% of the companies in the
Emerson Electric: High-yield, Sound Valuation and 59 Consecutive Years of Dividend Increases, Part 2
 Emerson Electric: High-yield, Sound Valuation and 59 Consecutive Years of Dividend Increases, Part 2 May 27, 2016 by Chuck Carnevale of F.A.S.T. Graphs Introduction When I m looking for a stock to add
CIF Stock Recommendation Report (Spring 2013)
") Date: 4/08/2013 Analyst Name: Frank McLaughlin CIF Stock Recommendation Report (Spring 2013) Section (A) Summary Company Name and Ticker: Monsanto Co. (MON) Recommendation Buy: Yes Target Price: $115 Sector:
Date: 4/08/2013 Analyst Name: Frank McLaughlin CIF Stock Recommendation Report (Spring 2013) Section (A) Summary Company Name and Ticker: Monsanto Co. (MON) Recommendation Buy: Yes Target Price: $115 Sector:
EQUITY STRATEGY FOCUS January, 2018
 EQUITY STRATEGY FOCUS January, 2018 IN VIEW: The Equity Landscape Equity prices are trading at levels that are more reflective of future expectations rather than current economic data. To date, U.S. consumer
CIF Stock Recommendation Report (Fall 2012)
") Date: 2/27/13 Analyst Name: Eric Klaasen CIF Stock Recommendation Report (Fall 2012) Company Name and Ticker: Costco Wholesale Corporation (COST) Section (A) Summary Recommendation Buy: No Target Price:
Date: 2/27/13 Analyst Name: Eric Klaasen CIF Stock Recommendation Report (Fall 2012) Company Name and Ticker: Costco Wholesale Corporation (COST) Section (A) Summary Recommendation Buy: No Target Price:
Starbucks (SBUX): Secret Menu. July John M. Zolidis
: Secret Menu. July John M. Zolidis") Starbucks (SBUX): Secret Menu July 2 2018 John M. Zolidis An earlier version of this presentation was given at ValueX Vail on June 28, 2018 Presentation Outline Summary of the set-up and current issues
Starbucks (SBUX): Secret Menu July 2 2018 John M. Zolidis An earlier version of this presentation was given at ValueX Vail on June 28, 2018 Presentation Outline Summary of the set-up and current issues
Better Sales And Profit Growth Are Behind Good 1Q17 Results, Not Financial Engineering
 Better Sales And Profit Growth Are Behind Good 1Q17 Results, Not Financial Engineering May 5, 2017 by Urban Carmel of The Fat Pitch Summary: S&P profits are up 22% yoy. Sales are 7.2% higher. By some measures,
GLOBAL ECONOMICS & CAPITAL MARKET COMMENTARY
 AUGUST 2017 GLOBAL ECONOMICS & CAPITAL MARKET COMMENTARY GLOBAL ECONOMICS Douglas E. White, CFA Chief Investment Officer Executive Vice President (617) 896-3518 dwhite@e-winslow.com Rand Folta, CFA Executive
A Cautionary Signal After Today's Strong Gain
 A Cautionary Signal After Today's Strong Gain November 29, 2017 by Urban Carmel of The Fat Pitch Summary: Waterfall events like the current one tend to most often reverberate into the weeks ahead. Indices
CIF Stock Recommendation Report (Spring 2013)
") Date: February 6, 2013 Analyst Name: Matt Leid CIF Stock Recommendation Report (Spring 2013) Section (A) Summary Company Name and Ticker: Noble Corporation (NE) Recommendation Buy: Yes No Target Price:
Date: February 6, 2013 Analyst Name: Matt Leid CIF Stock Recommendation Report (Spring 2013) Section (A) Summary Company Name and Ticker: Noble Corporation (NE) Recommendation Buy: Yes No Target Price:
Do Moving Average Strategies Really Work?
 Do Moving Average Strategies Really Work? August 19, 2014 by Paul Allen Advisor Perspectives welcomes guest contributions. The views presented here do not necessarily represent those of Advisor Perspectives.
NOT WORTH BEING CUTE SELLING OUT OF EXPENSIVE MARKETS HASN T ADDED VALUE HISTORICALLY
 INVESTMENT STRATEGY COMMENTARY NOT WORTH BEING CUTE SELLING OUT OF EXPENSIVE MARKETS HASN T ADDED VALUE HISTORICALLY October 27, 2017 Some investors are expressing concern about stock market valuations
Instructions for completing Share Appraisal Form (SAF)
") ASX online courses - Instructions Instructions for completing Share Appraisal Form (SAF) The information you need to complete the SAF is available from a variety of sources, including: Financial section
ASX online courses - Instructions Instructions for completing Share Appraisal Form (SAF) The information you need to complete the SAF is available from a variety of sources, including: Financial section
Solid Sales Growth and Margins At New Highs Drive 3Q17 Results
 Solid Sales Growth and Margins At New Highs Drive 3Q17 Results November 14, 2017 by Urban Carmel of The Fat Pitch Summary: For the third quarter (3Q17), S&P earnings rose 12% yoy, sales grew 6% and profit
Strong Buy 2 Analysts
 Last Close 0.36 (CAD) Avg Daily Vol 173,853 52-Week High 0.46 Trailing PE -- Annual Div -- ROE -21.8% LTG Forecast -- 1-Mo 5.9% 2019 April 08 TSX VENTURE Exchange Market Cap 124M 52-Week Low 0.13 Forward
INVESTING IN HUMAN PROGRESS 10 OVER 10 DIVIDEND. INVESTMENT STRATEGY by Dr. Ian Mortimer and Matthew Page, CFA Fund Co-managers
 INVESTING IN HUMAN PROGRESS 10 OVER 10 DIVIDEND TM INVESTMENT STRATEGY by Dr. Ian Mortimer and Matthew Page, CFA Fund Co-managers TM I N V E S T M E N T R E S E A R C H S E R I E S 1. I N T R O D U C T
CIF Stock Recommendation Report (Fall 2012) Summary
 Summary") Date: 11/6/2012 Analyst Name: Kyle Temple CIF Stock Recommendation Report (Fall 2012) Company Name and Ticker: Dover Corp Summary DOV Recommendation Buy: Yes No Target Price: $65.00 Sector: Industrials
Date: 11/6/2012 Analyst Name: Kyle Temple CIF Stock Recommendation Report (Fall 2012) Company Name and Ticker: Dover Corp Summary DOV Recommendation Buy: Yes No Target Price: $65.00 Sector: Industrials
Do Not Say You Were Not Warned - Again
 Do Not Say You Were Not Warned - Again "What The Fed did, and I was part of it, was front-loaded an enormous market rally in order to create a wealth effect... and an uncomfortable digestive period is
USER S GUIDE EVA METHODOLOGY EVA SCORECARD EVA IS A REGISTERED TRADEMARK OF STERN & STEWART & CO. NY, NY STOCKPOINTER, INC.
 USER S GUIDE EVA METHODOLOGY EVA SCORECARD EVA IS A REGISTERED TRADEMARK OF STERN & STEWART & CO. NY, NY. 2001 STOCKPOINTER, INC. Revised July 2018 Introduction to Inovestor The Economic Value Added (EVA)
.. /-!"::- '..- ( \.- - '-/../ '
 ....'-/ -!"::- ' ( \.-../ ' /- Triple Shot Forex Trading System The term "Day Trading" usually refers to the act of buying and selling a financial instrument within the same day. In the Forex market, a
3.36pt. Karl Whelan (UCD) Term Structure of Interest Rates Spring / 36
 Term Structure of Interest Rates Spring / 36") 3.36pt Karl Whelan (UCD) Term Structure of Interest Rates Spring 2018 1 / 36 International Money and Banking: 12. The Term Structure of Interest Rates Karl Whelan School of Economics, UCD Spring 2018 Karl
3.36pt Karl Whelan (UCD) Term Structure of Interest Rates Spring 2018 1 / 36 International Money and Banking: 12. The Term Structure of Interest Rates Karl Whelan School of Economics, UCD Spring 2018 Karl
The wisdom of crowds: crowdsourcing earnings estimates
 Deutsche Bank Markets Research North America United States Quantitative Strategy Date 4 March 2014 The wisdom of crowds: crowdsourcing earnings estimates Quantitative macro and micro forecasts for the
STUDY ON THE PERFORMANCE DRIVERS FOR EMERGING MANAGERS THREE YEARS ENDING DECEMBER 31, Property of FIS Group, Inc.
 STUDY ON THE PERFORMANCE DRIVERS FOR EMERGING MANAGERS THREE YEARS ENDING DECEMBER 31, 2006 BY: TINA BYLES WILLIAMS, CIO AND CEO, FIS GROUP, INC XIAOFAN YANG, VICE PRESIDENT, FIS GROUP, INC Performance
Quality Value Momentum Strategy
 Quality Value Momentum Strategy Ford Equity Research 11722 Sorrento Valley Road, Suite I San Diego, CA 92121 800.842.0207 (USA) 858.455.6316 Fax www.fordequity.com Background Can a low-turnover portfolio
Stock Rover Profile Metrics
 Stock Rover Profile Metrics Average Volume (3m) The average number of shares traded per day over the past 3 months. Company Unit: Name The full name of the company. Employees The number of direct employees.
CIF Stock Recommendation Report (Spring 2015)
") Date: March 4, 2015 Analyst Name: Brady Arnone, CJ Lee CIF Stock Recommendation Report (Spring 2015) Section (A) Investment Summary Recommendation Buy: Yes Sector: Technology Company Name and Ticker: Visa
Date: March 4, 2015 Analyst Name: Brady Arnone, CJ Lee CIF Stock Recommendation Report (Spring 2015) Section (A) Investment Summary Recommendation Buy: Yes Sector: Technology Company Name and Ticker: Visa
Dividends, Buybacks and the Prospect of Future Returns
 WisdomTree Research MARKET INSIGHTS [ May 2016 ] Dividends, Buybacks and the Prospect of Future Returns BY JEREMY SCHWARTZ, CFA, DIRECTOR OF RESEARCH, TRIPP ZIMMERMAN, CFA, ASSOCIATE DIRECTOR OF RESEARCH
How to Forecast Future Stock Returns: Part 3
 How to Forecast Future Stock Returns: Part 3 Chuck Carnevale - Monday, July 16, 2012 Introduction In Part 1 and Part 2 of this three-part series, we established the basic principles of valuation and provided
CIF Sector Recommendation Report (Fall 2012)
") CIF Sector Recommendation Report (Fall 2012) Date:4/3/2013 Analyst: Trevor Boren Sector: Healthcare Review Period: 3/20/2013 4/02/2013 Section (A) Sector Performance Review Review sector performance relative
CIF Sector Recommendation Report (Fall 2012) Date:4/3/2013 Analyst: Trevor Boren Sector: Healthcare Review Period: 3/20/2013 4/02/2013 Section (A) Sector Performance Review Review sector performance relative
Happy Birthday Bull Market
 Happy Birthday Bull Market March 10, 2015 by Burt White of LPL Financial The current bull market, one of the most powerful in the S&P 500 s history, celebrates its sixth birthday today, March 9, 2015.
A Slowdown is in the Bag, but What About a Recession?
 A Slowdown is in the Bag, but What About a Recession? January 11, 2019 by Martin Pring of Pring Turner Capital Group There is little doubt that the US economy is in a state of slowdown. That s actually
Growth and Value Investing: A Complementary Approach
 Growth and Value Investing: A Complementary Approach March 14, 2018 by Stephen Dover, Norman Boersma of Franklin Templeton Investments Growth and value investing are often seen as competing styles, with
Equity Research. Bank of the Ozarks, Inc. (OZRK-NSDQ) OUTLOOK SUMMARY DATA ZACKS ESTIMATES. Hold Prior Recommendation. Current Recommendation
 OUTLOOK SUMMARY DATA ZACKS ESTIMATES. Hold Prior Recommendation. Current Recommendation") Equity Research July 14, 2006 Scott A. Jaggers, CFA www.zacks.com 155 North Wacker Drive Chicago, IL 60606 Bank of the Ozarks, Inc. (OZRK-NSDQ) Current Recommendation Hold Prior Recommendation Sell Date
Equity Research July 14, 2006 Scott A. Jaggers, CFA www.zacks.com 155 North Wacker Drive Chicago, IL 60606 Bank of the Ozarks, Inc. (OZRK-NSDQ) Current Recommendation Hold Prior Recommendation Sell Date
Rocky Mountain ECONOMIST: Labor force participation rates have fallen sharply THE
 THE Rocky Mountain ECONOMIST: Economic information for Colorado, New Mexico and Wyoming 1 st Quarter 201 4 Effect of Aging on Labor Force Participation Rates in the Mountain States by Alison Felix, Economist
Trailing PE Forward PE Hold 6 Analysts. 1-Year Return: 8.9% 5-Year Return: -8.1%
 PASON SYSTEMS INC (-T) Last Close 20.14 (CAD) Avg Daily Vol 171,050 52-Week High 22.10 Trailing PE 54.4 Annual Div 0.72 ROE 8.0% LTG Forecast -- 1-Mo 1.5% October 18 TORONTO Exchange Market Cap 1.7B 52-Week
The Long-Suffering Bull Market The primary movement is the broad basic trend generally known as a bull market.. Robert Rhea, The Dow Theory, 1932
 Dow Theory for the 21 st Century Schannep Timing Indicator COMPOSITE Indicator The Long-Suffering Bull Market The primary movement is the broad basic trend generally known as a bull market.. Robert Rhea,
The Case for Treasury Inflation-Protected Securities
 STRATEGY INSIGHTS MAY 2014 The Case for Treasury Inflation-Protected Securities by John Hendricks, Executive Vice President and Senior Portfolio Manager Inflation can erode the real value of an investor
CIF Stock Recommendation Report (Fall 2012)
") Date: 11/4/12 Analyst Name: Trevor Boren CIF Stock Recommendation Report (Fall 2012) Company Name: CVS Caremark Corp. Ticker: CVS Section (A) Summary Recommendation Buy: Yes No Target Price: N/A Stop-Loss
Date: 11/4/12 Analyst Name: Trevor Boren CIF Stock Recommendation Report (Fall 2012) Company Name: CVS Caremark Corp. Ticker: CVS Section (A) Summary Recommendation Buy: Yes No Target Price: N/A Stop-Loss
The hedge fund sector has grown at a rapid pace over the last several years. There are a record number of hedge funds,
 The hedge fund sector has grown at a rapid pace over the last several years. There are a record number of hedge funds, and hedge fund of funds in the marketplace. While investors have considerably more
Where Is the Global Economy Going?
 Key Points Where Is the Global Economy Going? July 28, 2018 by Vitali Kalesnik Michele Mazzoleni Jim Masturzo of Research Affiliates Investors are wise to look at more granular classifications of the business
Trailing PE Forward PE Buy 1 Analyst. 1-Year Return: -26.2% 5-Year Return: 71.3%
 RICHELIEU HARDWARE (-T) Last Close 24.56 (CAD) Avg Daily Vol 124,594 52-Week High 33.69 Trailing PE 20.6 Annual Div 0.24 ROE 15.6% LTG Forecast -- 1-Mo 13.0% 2019 January 10 TORONTO Exchange Market Cap
GuruFocus User Manual: Interactive Charts
 GuruFocus User Manual: Interactive Charts Contents: 1. Introduction and Overview a. Accessing Interactive Charts b. Using the Interactive Chart Interface 2. Basic Features a. Financial Metrics b. Graphing
CIF Sector Recommendation Report (Fall 2012)
") Date: 12/4/2012 Analyst: Frank McLaughlin CIF Sector Recommendation Report (Fall 2012) Sector: Industrials Review Period: 11/16/2012-11/30/2012 Section (A) Sector Performance Review Copy/paste Sector Review
Date: 12/4/2012 Analyst: Frank McLaughlin CIF Sector Recommendation Report (Fall 2012) Sector: Industrials Review Period: 11/16/2012-11/30/2012 Section (A) Sector Performance Review Copy/paste Sector Review
Nasdaq Chaikin Power US Small Cap Index
 Nasdaq Chaikin Power US Small Cap Index A Multi-Factor Approach to Small Cap Introduction Multi-factor investing has become very popular in recent years. The term smart beta has been coined to categorize
Job creation continues, and the unemployment rate has dropped to 5% Earnings are expected to grow about 5% to 8% for 2016
 2016 Market Outlook Many analysts and investors have low expectations for 2016 Bullish Case U.S. economy continues in expansion mode. Job creation continues, and the unemployment rate has dropped to 5%
CIF Sector Recommendation Report (Fall 2012)
") Date: 11/27/2012 Analyst: Joseph Brendel CIF Sector Recommendation Report (Fall 2012) Sector: Finance Review Period: Monday, November 12 - Friday, November 23 Section (A) Sector Performance Review Copy/paste
Date: 11/27/2012 Analyst: Joseph Brendel CIF Sector Recommendation Report (Fall 2012) Sector: Finance Review Period: Monday, November 12 - Friday, November 23 Section (A) Sector Performance Review Copy/paste
Pro Strategies Help Manual / User Guide: Last Updated March 2017
 Pro Strategies Help Manual / User Guide: Last Updated March 2017 The Pro Strategies are an advanced set of indicators that work independently from the Auto Binary Signals trading strategy. It s programmed
HOW-TO GUIDE FM 2244 Building 3, Suite 170 Austin, Texas
 HOW-TO GUIDE 1. Understand our value investment philosophy The Prudent Speculator follows an approach to investing that focuses on broadly diversified investments in undervalued stocks for their long-term
Axioma s new Multi-Asset Class (MAC) Risk Monitor highlights recent trends in market and portfolio
 Risk Monitor highlights recent trends in market and portfolio") Introducing the New Axioma Multi-Asset Class Risk Monitor Christoph Schon, CFA, CIPM Axioma s new Multi-Asset Class (MAC) Risk Monitor highlights recent trends in market and portfolio risk. The report
Introducing the New Axioma Multi-Asset Class Risk Monitor Christoph Schon, CFA, CIPM Axioma s new Multi-Asset Class (MAC) Risk Monitor highlights recent trends in market and portfolio risk. The report
U.S. Equities: Navigating a Slow Growth Environment
 SITUATION ANALYSIS U.S. Equities: Navigating a Slow Growth Environment Executive summary Equities ended first quarter by posting lackluster results largely due to economic uncertainty and heightened geopolitical
INTERNATIONAL EQUITIES
 2018 Global Market Outlook Press Briefing INTERNATIONAL EQUITIES Justin Thomson Portfolio Manager, CIO, Equity November 14, 2017 FOR 2018 GLOBAL MARKET OUTLOOK PRESS BRIEFING. PROVIDED TO DESIGNATED MEMBERS
Monthly Market Risk Update: March 2019
 Monthly Market Risk Update: March 2019 March 14, 2019 by Brad McMillan of Commonwealth Financial Network Market risks come in three flavors: recession risk, economic shock risk, and risks within the market
Portfolio Management Commentary
 Portfolio Management Commentary Quarter Ending September 30, 2016 First things first, let s dissect the current market environment to see where the bias exists for investors. As usual, we begin with the
CIF Stock Recommendation Report (Fall 2012)
") CIF Stock Recommendation Report (Fall 2012) Date: Nov 27 th 2012 Analyst Name: Tung Linh Company Name and Ticker: W.W. Grainger, Inc. (GWW) Section (A) Summary Recommendation Buy: No Target Price: Stop-Loss
CIF Stock Recommendation Report (Fall 2012) Date: Nov 27 th 2012 Analyst Name: Tung Linh Company Name and Ticker: W.W. Grainger, Inc. (GWW) Section (A) Summary Recommendation Buy: No Target Price: Stop-Loss
Trailing PE Forward PE Buy 11 Analysts. 1-Year Return: 3.0% 5-Year Return: -19.7%
 ENCANA CORP (-T) Last Close 14.70 (CAD) Avg Daily Vol 3.3M 52-Week High 18.54 Trailing PE 188.1 Annual Div 0.08 ROE 0.7% LTG Forecast 36.4% 1-Mo -7.8% October 12 TORONTO Exchange Market Cap 14.0B 52-Week
Zacks Earning Trends
 August 6, 2014 Zacks Earning Trends Sheraz Mian SMian@Zacks.com Q3 Earnings Estimates Not Falling As Much The Q2 earnings season has turned out to be better relative to other recent reporting periods the
MARKET-BASED VALUATION: PRICE MULTIPLES
 MARKET-BASED VALUATION: PRICE MULTIPLES Introduction Price multiples are ratios of a stock s market price to some measure of value per share. A price multiple summarizes in a single number a valuation
Investor Goals. Index. Investor Education. Goals, Time Horizon and Risk Level Page 2. Types of Risk Page 3. Risk Tolerance Level Page 4
 Index Goals, Time Horizon and Risk Level Page 2 Types of Risk Page 3 Risk Tolerance Level Page 4 Risk Analysis Page 5 Investor Goals Risk Measurement Page 6 January 2019 Investor Education Investor Education
CIF Stock Recommendation Report (Fall 2012)
") Date: 10/11/12 Analyst Name: Matthew Landen CIF Stock Recommendation Report (Fall 2012) Company Name and Ticker: UnitedHealth Group Inc (UNH) Section (A) Summary Recommendation Buy: No Target Price: Stop-
Date: 10/11/12 Analyst Name: Matthew Landen CIF Stock Recommendation Report (Fall 2012) Company Name and Ticker: UnitedHealth Group Inc (UNH) Section (A) Summary Recommendation Buy: No Target Price: Stop-
Which Is the Better Valuation Metric? The P/E Ratio or the PEG Ratio: Part 1
 Which Is the Better Valuation Metric? The P/E Ratio or the PEG Ratio: Part 1 October 28, 2016 by Chuck Carnevale of F.A.S.T. Graphs Introduction Recently, I have been engaged in rather intense discussions
REFLECTING ON NASDAQ 6,000
 LPL RESEARCH WEEKLY MARKET COMMENTARY May 1 2017 REFLECTING ON NASDAQ 6,000 Burt White Chief Investment Offcer, LPL Financial Jeffrey Buchbinder, CFA Market Strategist, LPL Financial KEY TAKEAWAYS The
Financial Markets Perspective
 Financial Markets Perspective 4101 Main Street, Suite C Hilton Head Island, SC 29926 843.342.3044 www.victoriacapitalus.com FUNDAMENTALS MATTER January 2014 A BRIEF SUMMARY OF THE CURRENT ECONOMY Last
Applying fundamental & technical analysis in stock investing
 Applying fundamental & technical analysis in stock investing Today s Agenda Fundamental Analysis Topics include a basic overview, a discussion on ways to use it, and hands on tool demonstrations Trading
Crestmont Research. Yet, before anyone knew it, the end of the cycle was in the rear-view mirror rather than beyond the distant horizon.
 Crestmont Research Back To The Horizon: EPS Cycles Again By Ed Easterling December 31, 2008 (update) All Rights Reserved Earnings had been increasing at double-digit growth rates for five consecutive years
Analyzing Recent Changes in Southern Company s Indicators
 Analyzing Recent Changes in Southern Company s Indicators By Vincent Kruger Dec 23, 2016. 08:16 PM What s ahead for Southern Company's Stock? Chart indicators It hasn t been a merry season for utilities
Trailing PE -- Forward PE -- Hold 13 Analysts. 1-Year Return: -7.6% 5-Year Return: -89.4%
 OBSIDIAN ENERGY (-T) Last Close 1.21 (CAD) Avg Daily Vol 202,689 52-Week High 1.85 Trailing PE -- Annual Div -- ROE -12.3% LTG Forecast -- 1-Mo -6.2% October 04 TORONTO Exchange Market Cap 614M 52-Week