Fundamental analysis and valuation of Prosafe Production
|
|
|
- Blaise Price
- 6 years ago
- Views:
Transcription

1 Cand. merc. Applied Economics & Finance Department of Economics MASTER THESIS Fundamental analysis and valuation of Prosafe Production 20. December 2008 Written by Anders W. Eide Supervisor Carsten Kyhnauv Copenhagen Business School 2008
2 0 Executive summary The main objective of this master thesis was to determine the fair value of Prosafe Production s equity. The company was listed on Oslo Stock Exchange on June 2 nd 2008 following the split from Prosafe SE in May the same year. The company is a leading owner and operator of Floating Production, Storage and Offloading vessels. Currently, the company owns and operates seven vessels, five FPSOs and two FSOs. In addition, three tankers are being converted to FPSOs, which are expected to start operating in early The floating production industry has experienced strong growth in recent years, and this trend is expected to continue as a response to oil fields moving into deeper waters and more distant locations. The oil industry is highly cyclical, and the current strong up-cycle has obviously affected the FPSO industry in a positive way. Prosafe Production is well positioned in the industry to take advantage of this fact, and the company currently has several long-term contracts that will secure a strong cash flow for the coming years. In order to value the company, a fundamental analysis approach has been used. The PESTE model, Porter s five forces and a SWOT analysis has been applied in order to determine Prosafe Production s strategic position. This strategic analysis, together with a financial statement analysis, has been the basis for forecasting future financial statements. The fair value of Prosafe Production has been conducted using the enterprise DCF model. I have estimated the fair value of the company s equity to be USD 1681,0 million, corresponding to a share price of NOK 35,4 on August 22 nd At the same date, the observed share price at Oslo Stock Exchange was NOK 24,4. Thus, according to my estimations, the company was undervalued by NOK 10 per share. At the end of this thesis, I have performed a sensitivity analysis in order to determine the sensitivity of estimated share price towards two important parameters, WACC and growth rate. This analysis uncovered that small changes in estimated WACC and growth rate would lead to relatively large changes in the share price, and the valuation performed is more sensitive to changes in WACC than changes in growth. 2
3 Table of contents 0 Executive summary... 1 Table of contents Introduction Motivation for choice of topic Problem statement Structure of the thesis Methodology Delimitations Criticism of sources Presentation of Prosafe Production Public Limited Prosafe Production s history Structure and ownership Vision and strategy Prosafe Production s field of operations Strategic analysis The FPSO industry PESTE analysis Political and legal factors Economical factors Social factors Technological factors Environmental factors Porter s Five Forces Threat of new entrants Bargaining power of buyers Bargaining power of suppliers Threat of substitutes Intensity of rivalry SWOT analysis Financial statement analysis Accounting principles Accounting adjustments and corrections
4 4.2.1 Corrections Calculation of NOPLAT Calculation of invested capital Calculation of ROIC Forecasting of future financial statements Income statement forecast Operating revenues Operating expenses Other items on the income statement Balance sheet forecast Assets Equity and liabilities Valuation of Prosafe Production Valuation theory Weighted average cost of capital Capital structure Cost of equity After-tax cost of debt WACC estimation Free cash flow Continuing value Non operating assets Non equity claims Valuation of Prosafe Production Sensitivity analysis WACC and growth Marginal tax rate Conclusion Bibliography Appendices
5 1 Introduction In this chapter I will discuss my reasons for choosing to write a valuation thesis and describe how the thesis is structured. Also, I will state my problem definition and comment on the delimitations that I have made. 1.1 Motivation for choice of topic Through my studies at Copenhagen Business School, I have gained theoretical knowledge and interest towards the valuation subject. I have chosen valuation because I want to dig deeper into the subject, in order to enhance my understanding and knowledge, because this is something I think will be useful in my professional career. The reason for choosing Prosafe Production is that I found the company and industry very interesting. The company was split from Prosafe SE, which was a combined accommodation/service rig and floating production company, in May, and was listed as a new company on Oslo Stock Exchange June 2 nd. I find it interesting to follow the new company and see how it develops in its early days. Also, since I am born in the city of Stavanger, which is called the oil capital of Norway, I wanted to write about a company within the oil industry. After my studies I am going to start working as an analyst within the oil and gas industry for a bank in Stavanger. Therefore I see this thesis as a great opportunity for me to gain knowledge and information about the industry. The valuation date is set to August 22 nd All information released after this date has not been considered when valuating the company. 1.2 Problem statement The problem statement that will be answered in this thesis is: What is the fair value of Prosafe Production s equity, based on a fundamental analysis? 5
6 In order to give a qualified answer to the problem statement, the following sub questions will be answered in the various sections of this thesis: Strategic analysis In order to determine future profit potential it is necessary to identify the environment influencing Prosafe Production. o What are the main characteristics of the FPSO industry? o What are the macroeconomic factors influencing the FPSO industry? o What is the strategic position of Prosafe Production in the FPSO industry? Financial statement analysis It is important to analyse historical financial statements in order to elucidate financial performance and trends from previous years. o Which corrections to historical financial statements have to be made in order to get a reliable measure of previous year s financial performance? o Which items on the financial statements are related to Prosafe Production s core operations? o How has Prosafe Production s financial performance developed? Forecasting of future financial statements Based on the strategic- and financial statement analysis, future financial statements will be estimated in order to uncover future free cash flow. o What are the forecast drivers for the items in the future financial statements? o How will the financial statements for the next 10 years develop? Valuation of Prosafe Production Based on the forecasted financial statements and estimated weighted average cost of capital, the fair value of Prosafe Production s equity can be determined. o What is Prosafe Production s estimated WACC? o What is the fair value of Prosafe Production s equity using the discounted cash flow model? 6
7 Sensitivity analysis Since a valuation based on the discounted cash flow model is very sensitive to important parameters, it is necessary to uncover how sensitive the company value is to these parameters. o How will changes in important parameters influence the company s fair value? 1.3 Structure of the thesis This thesis is divided into four main parts. The first part is an introduction to the thesis, and a presentation of Prosafe Production and the company s field of operations. This is done in order for the reader to get a general overview of the thesis and the company being analysed. The second part of the thesis is the analysis part. The first section analyses the different characteristics of the FPSO industry. Afterwards, I will conduct a strategic analysis to uncover the macroeconomic and competitive environmental factors influencing Prosafe Production s operations. Furthermore, I will make a financial statement analysis to analyze the company s historical financial performance. Based on the abovementioned sections, I will forecast future financial statements. In the third part, I will start with a theoretical introduction to explain and discuss the financial and valuation models applied in this thesis. Furthermore, I will on the basis of forecasted financial statements make an estimate of Prosafe Productions fair value based on the chosen valuation model, in order to answer the selected problem statement. The thesis will be completed with a sensitivity analysis and a discussion based on the results in previous parts. The structure of the thesis is shown in the figure below. 7

8 Figure Structure of the thesis Source: Own contribution 1.4 Methodology This thesis will be built on the fundamental analysis approach. This means that the forecasting part, which will be the basis for the valuation part, is based on a strategic- and financial statement analysis. This will secure that all factors surrounding the company will be examined and analysed 1. I have not been in contact with Prosafe Productions during the writing of this thesis. Thus, it is written based on public available information from Prosafe Production and other reliable sources. The methodology and models used in this thesis will now be discussed. However, the theory behind the models will be explained in the sections they have been applied. 1 Plenborg og Petersen, 2005, p
9 Strategic analysis In order to analyse the macroeconomic factors influencing the FPSO industry, and to analyse Prosafe Productions strategic position, I have chosen the PESTE model and Porter s Five Forces respectively. These models will ensure that the reader get a good overview and understanding of the FPSO industry and the company s operations. The findings from the PESTE model and Porter s Five Forces will be summarised in a SWOT model at the end of the chapter. Financial statement analysis The financial statement analysis performed will be based on financial information from the years 2005 to 2007 released in connection with the listing on Oslo Stock Exchange in June this year, as well as financial information from the first six months of In the financial statement analysis, Net Operating Profit Less Adjusted Tax (NOPLAT) and invested capital will be estimated in order to separate the company s core operations from financing activities. Based on these estimates, Return on Invested Capital (ROIC) will be calculated in order to uncover how the company has performed during these previous years. Valuation In order to value the company, the discounted cash flow (DCF) model will be used. I could also have used other models, such as the economic value added (EVA) model, but since these two models will give the same answer if applied correctly, I have decided to use only the DCF model. The DCF model calculates future free cash flows and continuing value so I can estimate the fair value of Prosafe Productions equity. The free cash flows will be discounted using the company s estimated Weighted Average Cost of Capital (WACC), which has been estimated based on the Capital Asset Pricing Model (CAPM), future cost of debt and expected capital structure. 1.5 Delimitations I have applied a practical approach when writing this thesis. As a consequence, the focus of this thesis has not been to review and criticise written literature, but rather to focus on emphasizing the chosen models and theory. 9
10 All the models and theory applied in this thesis are common and extensively used for this kind of analysis. Consequently, some of the models and theory used will not be explained in detail as I assume that these models are well-known to the reader. Furthermore, the valuation is based on how the company appears at present. This means that I have not considered possible future conversion projects and subsequent contract agreements, as well as possible premiums for being a potential acquisition target. Further delimitations and assumptions will be commented upon when applied. 1.6 Criticism of sources In order to analyse Prosafe Production and the FPSO industry, external sources has been used. The information is mainly gathered from the company s home page, articles on the internet, as well as industry reports and analyst reports released by different investment banks. The financial information that has been used in the financial statement analysis was released by the company before the listing on Oslo Stock Exchange. The information released only contains numbers for the years 2005 to 2007, thus the period for the financial statement analysis is a bit short. Furthermore, the low level of details in the financial information has caused some difficulties when analysing this information. As a consequence, I have been forced to make a lot of assumptions that might influence the estimated numbers. For this reason, the financial statement analysis part is not as thorough as it ideally should be. The main sources for information regarding the FPSO industry are from Prosafe Production, Pareto Securities 2 and a report from Arctic Securities 3. Even though the report from Arctic Securities was released in October 2007, I still believe that the information put out in the report is relevant in the current FPSO market. I find all three sources to be reliable as neither of them would profit from releasing untrustworthy information. 2 Pareto Securities, Prospectus Prosafe Production, May Arctic Securities, Initiating FPSO sector coverage, Oct
11 Furthermore, this thesis has been written over a period of seven months. During this time the world has experienced a financial crisis, influencing both the FPSO industry as well as many of the important parameters estimated in this thesis. Even so, I believe that the assumptions made throughout this thesis are still valid. Prosafe Production operates in an industry that is late cyclical, and because of the company s position in the high-end segment of the FPSO industry as well as being fully financed to take up new projects, this financial crisis is not expected to affect the company in the short-term. However, if oil prices continue to fall and the challenges in the world s financial markets prevail for a longer period, growth in the FPSO market will slow down, and this is likely to affect Prosafe Production in the long-term. 11
12 2 Presentation of Prosafe Production Public Limited 2.1 Prosafe Production s history Prosafe Production s history goes back to 1972 when Morco AS was founded. It was around this time the Norwegian oil adventure started to take off. The company was given drilling contracts on the Ekofisk field, the pioneer in Norwegian oil history. Several ownership changes makes Morco change its name to Norcem Drilling, Aker Drilling and later a part of Transocean ASA. These companies were mainly drilling companies, and Prosafe was not established until 1997, when the platform drilling and technical services business units were de-merged from Transocean as a new company. This company was listed on Oslo Stock Exchange as Procon Offshore ASA. After the merge with Safe Offshore ASA, the company changed its name to Prosafe ASA. Safe Offshore controlled at the point of the merge three accommodation and service rigs, and the company s business segments was expanded with Offshore Support Services. Prosafe continued to grow within this segment through investments in accommodation and service rigs, and as of today the company is the world s leading owner and operator of semi-submersible accommodation and service rigs. In 2001 Prosafe expanded after acquiring Nortrans Offshore Ltd, and due to this acquirement the company entered into the floating production storage and offloading segment (FPSO). In 2005 the company sold Prosafe Drilling Services to KCA Deutag Drilling Norge, in order to focus on their core business (floating production and offshore support services). Prosafe later moved their headquarters to Cyprus. In May 2008 Prosafe was split into two companies, Prosafe SE, a focused accommodation / service rig company, and Prosafe Production, a focused floating production company. The main purpose of the split of Prosafe into two separate entities was to make visible to the market to a larger degree the underlying values of Prosafe. Also, the split allows management of the two companies to further increase their focus on the respective specialized areas of operation. 12
13 2.2 Structure and ownership Prosafe Production is the group holding company for the subsidiaries set out in figure 2.1 below. Prosafe Production Public Limited is the parent company of the group and is headquartered in Larnaca, Cyprus. The group has a floating production business division which is headquartered in Singapore. Figure Company structure Source: Pareto Securities, Prospectus Prosafe Production The company has issued a total number of shares, which is owned by a total of shareholders. The 20 largest shareholders are pictured in figure 2.2 below. 13
14 Figure Ownership structure Largest shareholders Name of Shareholder Number of Shares Percentage 1 BW Offshore Cyprus Limited ,44 % 2 Prosafe Holding Ltd ,75 % 3 Folketrygdfondet ,02 % 4 BW Offshore Cyprus Ltd ,48 % 5 Brown Brothers Harriman & CO ,10 % 6 Bank of New York, Brussels Branch ,87 % 7 Goldman Sachs & Co - Equity ,48 % 8 GMO Foreign Fund ,31 % 9 Prosafe SE ,19 % 10 UBS AG, London Branch A/C ,03 % 11 BW LPG FPSO I Ltd ,96 % 12 UBS AG, London Branch S/A ,81 % 13 JP Morgan Chase Bank ,76 % 14 RBC Dexia Investors Client Treaty Account ,72 % 15 Mellon Bank AS Agent Mellon ,58 % Bank NA A/C Mellon Nominee 1 16 Mellon Bank AS Agent Mellon ,57 % Bank NA A/C Mellon ABN 15 OM 17 State Street Bank AN A/C ,55 % Client Omnibus D 18 GMO Erisa Pool Trust ,36 % 19 JP Morgan Chase Bank ,26 % Petercam Lending ACC 20 HSBC Bank PLC Clients' ,13 % account 15% Total 20 largest ,37 % Total % Source: Own contribution, Prosafe Production The ownership structure can be characterized as relatively fragmented with many small shareholders. The largest shareholder is by far BW Offshore, which is also one of Prosafe Production s main competitors. The company is listed on Oslo Stock Exchange with ticker code PROD and traded at NOK 37 on June 2 nd 4, which was the first day of trading. Since then the share price has decreased slowly down to NOK 24,4 on August 22 nd. Prosafe Production currently has a total of about 1120 employees and they had operating revenues of USD 150, 4 millions in Oslo Børs, 14
15 2.3 Vision and strategy Prosafe Production has the following vision and corporate strategy. Vision Prosafe Production s vision is to be the preferred provider of floating production solutions 5 Corporate strategy The company aims to be the leading player in the segment for owning, converting and operating FPSO units worldwide. Prosafe Production wants to be the best FPSO player over time in terms of safe, efficient and profitable operations. Its long term ambition is to create supplementary volume from the sale of technology developed in-house Prosafe Production s field of operations Prosafe Production provides complete floating production storage and offloading systems (FPSOs) and floating storage and offloading systems (FSOs). FPSO and FSO units are similar in appearance to a ship, but quite differently designed. A FPSO contains the necessary production and processing facilities to operate as a regular fixed oil and gas platform. The unit is moored on location and connected to the wells. The FPSO is usually moored through a traditional spread mooring arrangement, which keeps the unit in a fixed position, or with a turret mooring system, which allows the unit to weather vane or rotate freely around the point of mooring in response to weather conditions. A FSO is very similar to a FPSO, except for the processing possibilities. FSOs are mainly used in oil fields where it is not possible or efficient to lay a pipeline to the shore. The company currently owns and operates a fleet of five FPSO units and two FSO units, and has further three vessels undergoing conversion to FPSOs which are expected to start operations in early One of these vessels, FDPSO Azurite, will be the world s first FPSO with drilling capacity 7. Furthermore, the company is positioned to start up another two new conversion projects in 2008, one being the newly acquired Very Large Crue Carrier (VLCC) M/T Takama, who will be converted into a FPSO upon the reward of a firm contract Prosafe Production, Q1 08 presentation, May 08 15
16 Prosafe Productions core business is the design, engineering, conversion and operation of FPSO/FSO vessels. The company converts existing Aframax, Suezmax and VLCC tankers into FPSOs and FSOs after contract agreements with the oil company 8. The vessels are specially designed to meet the oil company s requirements, and will most certainly undergo different modifications before the vessels can start operating for a different oil company. Prosafe Production currently has several long-term contracts, especially for their FPSO vessels that all have contracts that extend far into the next decade. This also includes the three ongoing conversion projects, which all have secured contracts on highly favourable terms. The company focuses mainly on the benign water markets outside West Africa, Australasia and Brazil. These markets are relatively new deepwater fields with limited or no infrastructure, and are expected to grow significantly in coming years. An overview over Prosafe Production s fleet and its contract status, as well as the company s current operations can be found in Appendix
17 3 Strategic analysis This strategic analysis will undertake an external analysis of macroeconomic conditions, as well as an analysis of the industry that Prosafe Production operates in. In the first section I will define the main characteristics of the FPSO industry, as well as estimated supply and demand. In the second section I will use the PESTE model to investigate the macro economical issues that influence Prosafe Production. In the next section I will analyse the industry based on Porter s Five Forces, to identify potential possibilities and threats within the floating production industry. Finally, I will sum up my findings with a SWOT-analysis to elucidate Prosafe Productions strategic profile. 3.1 The FPSO industry At the start of oil production from offshore locations, all oil platforms were originally placed on the seabed. Since then offshore oil production has moved into deeper waters and more distant locations, and this has led to the development of various floating production solutions. Compared to traditional fixed platform production systems, most floating production systems minimize the time to first oil and generally cost less to build in deep waters 9. Floating production systems are installed at the oilfield for a period of time, usually many years, to produce oil much in the same way as a fixed unit. Majority of the projects that use floating production systems are located in fields that lack infrastructure and connection to onshore areas, and it is therefore necessary to provide temporary storage at the production site before transporting the oil to shore by means of shuttle tankers. Furthermore, as field size decrease, installing pipeline infrastructure may not be economically feasible. Also, using floating production systems lowers field abandonment costs at the end of a field s production lifecycle. As a result, the demand for floating production units has developed very positively over the last years 10. There are currently four types of floating production units. The different types of units are 11 : FPSO: Floating production, storage and offloading unit. Vessels equipped to lift, process and store oil, as well as offloading possibilities. 9 Arctic Securities, Initiating FPSO sector coverage, Oct Pareto Securities, Prospectus Prosafe Production, May Arctic Securities, Initiating FPSO sector coverage, Oct
18 Production semis: Semi submersible rigs that vary greatly in size and complexity. Spar platforms: The platform consists of a large cylinder supporting a typical platform. The large cylinder serves to stabilize the platform in the water. TLP: Tension leg platforms that are permanently moored by means of tethers or tendons grouped at each of the structure s corners. A group of tethers is called a tension leg. Neither Production semis, Spars or TLPs have storage capabilities; hence an FSO is usually attached to the unit. On the other hand, these units generally have drilling capabilities, something which is not very common for FPSOs. Below, I have made an overview of the different floating production units. Figure Overview of different floating production units Main characteristics Potential drawback Main geographical areas FPSO Storage capacity Riser quantity limited West Africa Deck area High-cost risers Brazil Deepwater capabilities No access to wells North Sea Redeployment possible Semi Drilling capabilities Riser quantity Favourable motion characteristics Deck area Spar Drilling capabilities Steel risers Deepwater capabilities Access to wells TLP Drilling capabilities Steel risers Access to wells Past achievements High-cost risers Well access limited Limitations on deck load Storage capacity No harsh environments capabilities Riser quantity limited Limitations on deck load Storage capacity High-cost design No deepwater capabilities Limitations on deck load Storage capacity Brazil North Sea US Gulf of Mexico US Gulf of Mexico US Gulf of Mexico West Africa Source: Arctic Securities, Initiating FPSO sector coverage, Oct
 and currently counts around 300 units 12. Some FPSOs are built based on speculation, but the vessels are normally built upon the reward of a firm contract.")
19 The overall floating production market has displayed a strong growth with a compounded annual growth rate of around 10% for the last 10 years ( , see figure 3.2 below) and currently counts around 300 units 12. Some FPSOs are built based on speculation, but the vessels are normally built upon the reward of a firm contract. Generally, Semi s, TLP s or Spar s are always built against contracts, as investments in these units are substantially higher than for the average FPSO. Furthermore, these units are to an even higher degree built against field specific criteria. Figure Growth in floating production fleet (numbers include units under construction/conversion, idle, in yard, and working) Source: Arctic Securities, Initiating FPSO sector coverage, Oct 2007 The largest regional markets for floaters are the North Sea, Latin America, North America and Asia Pacific. In addition, the market in Africa is relatively large, and is expected to grow significantly in coming years 13. FPSO units are the most popular type of floating production solution. They account for 62% of the production floaters now in operation and 74% of the production floaters on order. FPSOs are located in all major offshore areas, except on the US side of the Gulf of Mexico 14. The market for FPSOs has developed gradually. During the period , the fleet has experienced an average compounded annual growth rate of around 12% 15, thus 12 Arctic Securities, Initiating FPSO sector coverage, Oct Arctic Securities, Initiating FPSO sector coverage, Oct Pareto Securities, Prospectus Prosafe Production, May Arctic Securities, Initiating FPSO sector coverage, Oct
20 growing faster than the total floating production market. This is a result of the FPSO being a relatively cheap and versatile production unit, well suited for the estimated production profiles of smaller fields, which is increasingly the type of fields developed by the oil and gas companies today. FPSOs are either directly owned by oil companies or chartered from a FPSO owner. Confidence in the ability of FPSO owners to deliver and operate facilities cost-effectively has increased, leading to a strong growth in the market for chartered FPSOs. The trend towards chartering units is expected to continue as the operators are looking to reduce their asset exposure. Smaller fields typically favour chartered FPSOs as the operator cannot justify the full capital expenditure of a FPSO for a field with limited number of years of production. Furthermore, chartering FPSOs will decrease the oil companies exposure to project risks and reduce the need for in-house FPSO expertise, as well as operations management. Finally, the operators will not have to handle re-deployment or disposal of the unit after end of production. The contractor owned FPSO fleet is a fragmented market. The growth potential in this market has triggered several new entrants, while little consolidation of ownership has taken place 16. The market can therefore be divided into three segments, high-, medium- and lowend. The segments can be distinguished by characteristics such as size of projects, level of in-house engineering and technology possibilities, and to some extent customers 17. Proven track record and established relationships are important in the high-end of the industry, as major oil companies tend to prefer to co-operate with well-established players with proven concepts. The low-end segment is characterized by tough competition, indigenous companies, newcomers and older FPSOs being re-deployed from higher-end segments. Furthermore, many of the conversion projects in this segment are based on speculation. The outlook for the FPSO market is positive. After the number of contracts increased significantly during , the market experienced a downfall in new contract rewards during However, due to shift towards deepwater oil and gas developments, as well as average field sizes decreasing and being increasingly located in remote areas away from 16 Arctic Securities, Initiating FPSO sector coverage, Oct Arctic Securities, Initiating FPSO sector coverage, Oct

21 infrastructure, the market demand for FPSOs is expected to grow in coming years. Below there is an estimate of future FPSO demand. Figure Estimated FPSO demand in coming years Source: Prosafe Production Q1 08 presentation, May 2008 FPSOs are generally contracted for rather long time periods. Since 1995 the average firm contract length has been eight years 18. Lately, contract length has been somewhat shorter than the average. One explanation is that smaller fields are being developed, where production length is uncertain. Another explanation is that options are increasingly being attached to the contracts, as oil companies value the increased flexibility this provides. 3.2 PESTE analysis Macroeconomic factors are something that Prosafe Production is subjugated to, but can not influence. These factors are yet essential for the company, and changes in the macroenvironment may influence the company just as much as changes within the FPSO market or strategic changes made by Prosafe Production itself. I will therefore use the PESTE 18 Arctic Securities, Initiating FPSO sector coverage, Oct
22 model to analyze how factors in the macro-environment influence Prosafe Production. The PESTE model consists of the following factors 19 : Political and legal Economical Social Technological Environmental Figure PESTE model Macro-economical factors Political and legal Social Economical Environmental Technological Source: Own contribution, based on Hill & Jones (2004) Political and legal factors The oil and gas industry is to a large extent regulated by national and international laws, regulations and certifications. Even though the industry is highly international, there are no common standards regarding laws and regulations. However, there exist international cooperations and agreements to ensure resemblance within laws and regulations in the industry. Laws and regulations are administrated by national institutions to ensure that the 19 Hill and Jones,
23 companies in the oil and gas industry focus on health, environment and safety issues. Despite these common laws and regulations, there exist differences between countries. On the Norwegian continental shelf, for example, laws and regulations are administrated by the Norwegian Petroleum Directorate and the Petroleum Safety Authority, and certifications are given by Det Norske Veritas. Norway has been seen as a leading nation when it comes to laws and regulations of the oil and gas industry, but the system is also known as strict and bureaucratic. In other markets, especially emerging markets, laws and regulations are not that strict and the companies spend less time and money to comply with rules and regulations here. The industry is also under the influence by differences in working environment legislation. These differences will influence the profitability in the industry, and as seen in many other industries, companies in the oil industry have also moved to countries with lower production costs Economical factors The economical factors have great influence on the oil and gas industry. There are many different factors that will influence the economy in this industry, such as interest rate, inflation and currency changes, but I will in the following focus on the most important factor, which is the oil price. The oil price has great influence on the world economy. Overall, an oil price increase leads to a transfer of income from importing to exporting countries through a shift in terms of trade. The magnitude of the direct effect of a given price increase depends on several factors, such as the share of the cost of oil in national income, the degree of dependence on imported oil and the ability of end-users to reduce their consumption and switch away from oil 20. Naturally, an increased oil price over a longer period will have a significant impact on the macroeconomic relations in the world. An increase in oil price can also lead to inflation, increased input costs, reduced non-oil demand and lower investment in net oil-importing countries. 20 International Energy Agency, Analysis of the impact of high oil prices on the global economy, May
24 Currently, the oil price is on a record high, and together with the US sub-prime mortgage crisis, there is fear that a constantly high oil price may add more uncertainty to the future of the world economy 21. High oil prices will lead to a restrained individual consumption capacity, which will hamper overall economic growth. Furthermore, a high oil price will increase the risk of worldwide inflation. Together with the sub-prime mortgage crisis, which has triggered a lack of financial fluidity, the high oil price has put western central banks in a dilemma on whether to increase interest rates to reduce potential inflation, or decrease interest rates in order to stimulate fluidity. In figure 3.5 below, there is an overview of oil price fluctuations since Evidently we can see that political instability, especially in the Middle-East, has had great impact on the oil price. Figure Changes in oil price and historic incidents Source: WTRG Economics The level of activity in the oil and gas industry has historically been cyclical, since it is largely dictated by oil price trends. For oil and gas companies the oil price is a critical factor when deciding whether to start test drilling and production on a new oil field or not. This is a long-term process, and therefore it may take a while before FPSO companies gets affected by the price change. The main source of revenue for the oil and gas companies is naturally
25 oil trade and the company s profitability is therefore directly attached to oil price developments. Day rates, which are the daily price the oil and gas companies pay FPSO companies, are determined by supply and demand in the market. When several oil fields becomes profitable, demand for FPSO units will increase, which consequently leads to higher day rates. A decrease in the oil price will lead to a lower demand and excess supply, decreasing the FPSO companies day rates. For the FPSO business, activity levels have traditionally been relatively robust in relation to oil price fluctuations 22. This is due to the companies operations that generally focus on the production phase of the oil fields. In combination with day rate charters which can be of long duration, the FPSO companies are not that affected by daily oil price fluctuations. However, the FPSO companies will most certainly be influenced by a persistent low oil price, which will decrease the day rates and demand for FPSO units. Trying to predict the future oil price is a resource-demanding and difficult task. A full oil price analysis will be too comprehensive for this thesis. I will, however, try to give a short insight into the most important factors, and look at some oil price estimates done by Energy Information Administration (EIA), since the oil price will have a great influence on Prosafe Productions future cash flows. As with other markets, the oil market is driven by supply and demand. In the short-term, we can assume that supply is equal to production capacity, even though OPEC and other oil manufacturers may induct production restraints. In the long-term, supply is determined by investments in proven oil-reserves and wildcat drilling, along with technological improvements, subsequently leading to increased capacity. A high oil price will justify these investments, and increase supply in the long-term. The demand for oil is determined by several factors. Economic growth, technological improvements, capacity constraints and numerous of other factors, such as political factors, will influence demand in both short- and long-term. Demand and oil price are negatively correlated, a high oil price will lead to consumers substituting oil for alternative energy 22 Prosafe SE, Annual report
26 sources. Technological developments can influence demand in both directions. In the near future, it is natural to think that technological developments will increase demand, while in a longer-term technological improvements may lead to lower demand as a response to other energy sources. The many factors influencing the oil price and the great uncertainty surrounding these factors, makes it nearly impossible to forecast the future oil price, especially in the longterm. In July 2008 EIA released a short-term energy outlook, projecting the WTI (West Texas Intermediate) crude oil price to average $127 per barrel in 2008, and $133 per barrel in Figure Short-term crude oil price forecast Source: EIA, Short-Term Energy outlook, July 2008 According to EIA 24, the oil market remains tight, evidenced by rising prices, low surplus production capacity, and the concern that global supply growth may not keep pace with demand growth over the near term. World oil consumption has continued to grow despite 7 consecutive years of rising prices. While oil consumption in OECD countries has decreased by barrels per day during 2008, this has been offset by an increase in consumption by 1,2 million barrels per day in non-oecd nations led by China and the Middle East. Global consumption in 2009 is expected to increase by 1,4 million barrels per day because of upward revisions in projected 2009 economic growth in some regions, such as Latin EIA, Short-Term Energy outlook, July

27 America. If financial strains in the United States spread to foreign nations, depressing economic growth, consumption growth would also slow. During 2008, non-opec supply has been a lot lower than expected. At the beginning of 2008, non-opec supply growth was projected to rise by barrels per day in 2008 and by over 1,5 million barrels per day in Production is now expected to rise by only barrels per day in 2008 and by barrels per day in Supply growth has been limited by faster declines in older fields and delays in expansion projects. For OPEC countries, supply has averaged an estimated 32,3 million barrels per day during second quarter of 2008, and is projected to average 32,7 million barrels per day in the third quarter 25. EIA has also released International Energy Outlook 2008 (IEO08), trying to forecast world marketed energy consumption and oil prices for the period According to EIA s reference case, world marketed energy consumption is projected to grow by 50 percent over this period. Fossil fuels supply the largest share of world energy consumption over the projection period, but their share is expected to fall from 37 percent in 2005 to 33 percent in 2030, largely because world oil prices are expected to remain relatively high. In the IEO08 reference case, world oil price in nominal terms decline from current high levels to around $70 per barrel in 2015, then rise steadily to $113 per barrel in Figure World oil price projections Source: EIA, International Energy Outlook EIA, Short-Term Energy outlook, July
28 In addition to the reference case, IEO08 includes a high price case that helps to quantify the uncertainty associated with long-term projections of future oil prices. In the high price case world oil prices are projected to be at $186 per barrel in nominal terms, nearly 65 percent higher than the reference case. Given current market conditions, it appears that world prices are on a path that more closely resembles the projection in the reference case than the high price case. As we can understand, projecting future oil price is a difficult task. One should not rely too much on these projections, but they are the closest we get to a possible oil price development Social factors Social factors include population growth, demographic changes, among other things. Changes in social trends can impact on the demand for a firm's products and the availability and willingness of individuals to work. In 2005 the world population was estimated to be just over 6,5 billion people. In the period from 2005 till 2050, the world population is estimated to grow with 41 percent, giving a world population of over 9 billion people 26. Europe is the only continent where population is expected to decrease, whereas population in Africa is expected to increase by over 100 percent. All other equal, the population growth will lead to higher demand for oil, seeing that consumption will increase as a result of higher population. Furthermore, the average age of the world s population is increasing. This will be a problem when trying to recruit qualified personnel in the future. There is also a problem with getting qualified personnel to move to low-cost countries, as more and more companies move their business to these countries Technological factors I will not go into details in this section since I have covered many of the technological factors in other sections. However, the oil and gas industry has from its beginning had an
29 enormous technological development. This will certainly continue in the future, not only for developing new products and solutions, but also to reduce cost and be more efficient Environmental factors The world energy consumption is larger than ever, and this is expected to grow even further. As mentioned under section 3.2.2, EIA predicts world energy consumption to grow by 50 percent in the period This growing energy consumption has set focus on climate changes, which is probably the greatest environmental threat the world is facing. Over a decade ago, most countries joined an international treaty, the United Nations Framework Convention on Climate Change, to consider what can be done to reduce global warming. More recently, a number of nations approved an addition to the treaty, the Kyoto Protocol, which sets out legally binding targets for greenhouse gas reduction by at least 5 percent from their 1990 level during the commitment period 2008 to Currently, the Kyoto signatories are negotiating the second phase of the agreement. During the period from 2013 to 2017, industrialised countries need to reduce their CO 2 emissions by 18 percent from 1990 levels, and by 30 percent between 2018 and The focus on environment protection has created challenges for the oil and gas industry, since fossil energy is the world s largest contributor to CO 2 emissions. However, until alternative energy resources are developed in a large scale, this will not affect oil and gas production to a large extent in the near future. 3.3 Porter s Five Forces In this section I will analyse the industry that Prosafe Production operates in, and to do that I will use Porter s Five Forces. The model was developed by Michael E. Porter in 1979, and he identified five forces that are widely used to assess the structure of any industry. Below there is a figure that describes the framework of this model. 27 The Kyoto Protocol, p EREC and Greenpeace, Jan. 2007, p.4 29
30 Figure Porter s Five Forces Source: Michael E. Porter New entrants to an industry can raise the level of competition, thereby reducing its attractiveness. The threat of new entrants largely depends on the barriers to entry. Key barriers to entry include economies of scale, capital requirements, customer switching cost etc. The bargaining power of buyers describes the effect that your customers have on profitability of your business. Buyers have the most power when they are large and purchase much of your output, low costs and low risk bound to change supplier, products are standardised etc. Bargaining power of suppliers is the companies negotiation position towards the suppliers. The bargaining power of suppliers depends on how many buyers and dominant suppliers there are in the market, access to substituted products, costs of changing supplier etc. 30
31 Threat of substitutes can lower industry attractiveness and profitability because it will limit price levels. The threat of substitutes depends on buyers willingness and cost to substitute, product characteristics, and the relative price and performance of substitutes. All the elements above influence the intensity of rivalry in the industry. Furthermore, there are many other elements influencing the rivalry, primary the size and numbers of competitors, as equal competitors will increase the intensity in the market. Also, this intensity will depend on the degree of product differentiation in the market, as well as exit barriers and switching costs. Together, the strength of the five forces determines the profit potential in an industry by influencing the prices, costs and required investments of businesses the elements of return on investment Threat of new entrants The FPSO market has seen a large number of newcomers in recent years. However, this is likely to diminish in the near future. The market currently has several natural barriers of entry. The industry is severely short of human capital, a crucial factor for FPSO development. It will be both difficult and expensive to recruit experienced key personnel for new FPSO start-ups. This is also true for other parts of the oil industry. Oil companies are looking to reduce future E&P projects as a response to reduced supply of skilled personnel, which in turn will reduce demand for floating production units. The FPSO industry is a capital intensive industry, and since access to capital and debt financing is increasingly becoming an issue because of the unstable economic market at the moment, the industry is expected to see fewer newcomers enter into the market. Furthermore, yard capacity for conversion and new build projects is tight, as well as increasing lead times from suppliers of critical components. Due to the increased competition, especially the low-end segment has experienced a decrease in superior returns. Prosafe Production is positioned in the high-end segment of the FPSO industry. Barriers of entry are especially high in this segment. The players in this segment possess significant engineering resources as well as in-house technology. Furthermore, operators in this 31
32 segment are required to demonstrate proven track records for on time delivery, automatically decreasing the threat of new entrants. Since the level of entry has been high recently, I believe that the FPSO market is more likely to experience consolidation among existing players, rather than additional new entrants Bargaining power of buyers The main buyers for Prosafe Production are the national and international oil and gas companies. The buyers in the industry are relatively few and large, basically giving the buyers a strong bargaining power against the FPSO players. However, due to the current strong cycle in the oil and gas industry, the power of the buyers is reduced. The demand for FPSO units will increase by a large number, for the oil and gas companies to sustain the desired level of production. This is confirmed by the record high dayrates the market currently is observing. Within the FPSO industry, a strong relationship between company management and oil and gas companies are crucial. The oil and gas companies prefer established players with a proven track record of on time and within budget delivery. Unique technology and conversion experience are highly important, as well as organisational know-how on the back of a strong focus on safety, environment and operational standard. Prosafe Production certainly holds these qualities. The company has an in-house developed turret-mooring technology that gives the company a competitive advantage, as well as a long track record of converting FPSOs on time and within budget, and operating FPSOs 29. Furthermore, the company had an extremely high operating regularity of 99,3% in , which confirms quality of designs and technical solutions. These qualities have given Prosafe Production a strong position when negotiating with their buyers. However, the company has experienced cost overruns on their latest conversion projects. The company has also had trouble agreeing upon new conversion projects this year. This may be a sign of increased bargaining power of the company s buyers Prosafe Production, Q1 08 presentation, May 08 32
33 3.3.3 Bargaining power of suppliers Prosafe Productions main supplier is the shipyards. The yards are extremely important for the company s main business and holds therefore great negotiation power. Furthermore, due to the strength of current cycle in the oil business, yards have seen record order-books for a long time and are occupied. Quality yards are sold out and have rather long delivery time for new units, and this increases suppliers bargaining power even further. However, larger players with strong relations to the yard have provided themselves with some leverage in negotiations. Prosafe Production has got an excellent relationship with Keppel (Singapore), where all three ongoing conversion projects are taking place, as well as six completed conversions. Their strong relationship has to some degree reduced the bargaining power of the yard. The other main supplier for Prosafe Production is the need for a highly qualified work force. As I pointed out in section 3.3.1, there is currently a lack of qualified personnel in the industry. This has led to high bargaining power among the most attractive workers in the industry. However, Prosafe Production is a company that focuses on inventing their own inhouse technology, and is, as one of the leading players in the FPSO industry, a highly attractive work place. To sum up, the suppliers in the industry have substantial bargaining power against the players in the FPSO market. However, taking into consideration Prosafe Productions position in the market and strong relationship with Keppel, this threat is negligible for the company at the moment Threat of substitutes The main substitute for floating production solutions is subsea piping systems. This solution can be preferred by oil and gas companies in well-established oil fields (in oil fields with a well developed infrastructure), or on oil fields located close to the shore. However, due to the development of new oil fields in deeper waters, floating production units are on the verge of becoming the preferable solution. 33
34 As mentioned under section 3.1, there are four types of different floating production units. Among these different units, the FPSO unit is the preferred solution because of its flexibility. Based on this, I believe the threat of substitutes to be relatively low at this moment Intensity of rivalry Prosafe Productions competitors in the high-end segment are SBM Offshore, Modec, BW Offshore and Bluewater. SBM Offshore is the world s largest FPSO company, currently operating a fleet of 16 units with another six under construction. The relatively low number of players in this segment decreases the intensity of rivalry. The players in this segment also focus on different markets around the world. Furthermore, because of the strong cycle of the oil business, the demand for FPSOs is high at the moment. Also, as mentioned under section 3.1, many oil and gas companies will in the future charter FPSO instead of operating the units themselves, leading to an increase in demand for FPSOs operated by FPSO companies. This increased demand will reduce intensity of rivalry between the players. However, since this is a highly cyclical business, the uncertainty about the number of future contracts may increase the level of competition in this segment. Furthermore, this market is highly sensitive towards the oil price. At the current strong oil price, the oil and gas companies have significant incentives to increase production levels from existing units or extend field life, leading to a lower intensity of rivalry. A lower oil price will lead to lower demand for FPSOs and the battle to receive contracts will intensify. 3.4 SWOT analysis I will now present a summary of the strategic analysis section in a SWOT analysis. The model comprises Prosafe Production s internal strength and weaknesses, as well as the external opportunities and threats the company is facing. 34
35 Table SWOT Strengths An established player located in the high-end segment of the FPSO business. In-house developed turret-mooring technology. Proven track record of on time and within budget delivery. Quality of designs and technical solutions. Strong relationship between company management and oil and gas companies. Excellent relationship with Keppel. Strong focus on safety, environment and operational standard. Strong contract backlog Opportunities Strong cycle in the oil and gas industry. Flexibility of FPSO units. High barriers of entry in the highend segment. High projected oil-price. No adequate substitutes Less intensity of rivalry due to expected consolidation in the FPSO market. Source: Own contribution Weaknesses Cost overruns in latest conversion projects. Trouble winning two new FPSO conversion projects. High dependency on key personnel. Cyclical exposed Threats Alternative energy resources New technology that outdates FPSO units. The industry is severely short of human capital Economic instability in the world at the moment. Increased competition with lower oil-prices. 35
36 4 Financial statement analysis I will begin the valuation process by analysing Prosafe Production s historical financial performance. This analysis is vital to get an understanding of the company s past performance, and will provide an essential perspective for developing and evaluating forecasts for future performance. A good analysis will focus on the key drivers of value: return on invested capital (ROIC), growth and free cash flow (FCF) 31. High returns and growth result in high cash flows, which in turn drives value 32. A company s reported financial statements mix operating performance, non-operating performance, and capital structure. In order to measure the company s operating performance one should reorganize the accountant s financial statements into new statements that separate operating items, non-operating items, and financial structure 33. I will in this section begin by analysing historical financial statements to see if there have been any noteworthy changes in accounting principles during the period. If the changes have a major impact, the financial statements should be adjusted as if the same policies were applied every year. The reason is to provide a more correct picture of Prosafe Production s profitability. I will continue by determining which items in the financial statements that are associated with the company s core operations, and thereafter calculate invested capital and net operating profits less adjusted tax (NOPLAT). These terms are necessary to calculate ROIC in order to analyse the company s ability to generate profit on the invested capital. 4.1 Accounting principles As mentioned in the beginning of this thesis, Prosafe Production was split as a separate company from Prosafe SE in May this year. As a consequence, the company has not issued financial statements as a separate company up until now. However, the company has released financial information from the period in connection with the listing on Oslo Stock Exchange in June. The financial information has been prepared in reference to standards and interpretations issued by the International Accounting Standards Board, but 31 Koller et al., 2005, p Koller et al., 2005, p Koller et al., 2005, p
37 the information is not in accordance with International Financial Reporting Standards. The reason is that Prosafe Production Public Ltd acquired its subsidiaries in April 2008 and did therefore not control its subsidiaries prior to that date 34. Consequently Prosafe Production Public Ltd is not permitted by IAS 27 to present consolidated financial information. Accordingly the financial information is prepared on a basis that combines the results and assets and liabilities of Prosafe Production Public Ltd and its subsidiaries by applying the principles underlying the consolidation procedures of IAS 27 for each of the three years to 31 December 2005, 2005, Internal transactions within the Combined Entity have been eliminated on combination 35. In the preparation of the financial information, the management in Prosafe Production has applied estimates and assumptions which have influenced the annual accounts. The estimates and assumptions are assessed on a continuous basis. According to Prosafe Production, the judgements which have the most significant effect on the amounts recognised in the financial information relate to depreciation of fixed assets and impairment test of goodwill and fixed assets 36. Since the financial information is prepared specifically for the purpose of the prospectus released in connection with the listing on Oslo Stock Exchange, there haven t been any changes in accounting principles for the period. Naturally, it is therefore not necessary to make any adjustments regarding accounting differences in order for the financial information to be comparable. Prosafe Production has also released a condensed interim financial statement for the first six months of I will not make any corrections regarding operational leases on these figures below. The reason is that the financial statement released does not provide me with enough information to properly estimate the effects of the corrections. If I were to correct the financial information, I would have to make a lot of vague assumptions, and I believe that this would create more noise to the estimates than useful information. However, I will correct the income statement for the disposal of shares in Teekay Petrojarl ASA, as this is an 34 Prosafe Production, Audited financial report as per 14 May Prosafe Production, Audited financial report as per 14 May Prosafe Production, Audited financial report as per 14 May
38 extraordinary item, and necessary information is properly specified in the notes in the information released. 4.2 Accounting adjustments and corrections In this section I will account for the corrections I have made in Prosafe Production s income statement and balance sheet. The corrections are made in order to calculate a reliable NOPLAT and invested capital, and to ensure consistency between them Corrections Correction 1: Extraordinary items Most of the items in the income statement are expected to be of a persistent character. However, in the income statement from the first six months of 2008, the company has experienced costs that are most unlikely to occur in the future. I have collected these items under extraordinary items in order to get a more correct picture of the company s operating profit this year. Restructuring and listing expenses Prosafe Production experienced expenses of USD 5 million related to the listing on Oslo Stock Exchange in June this year. This has had a negative effect on the company s EBIT. Since this kind of expenses is not expected to be repeated in the future, I have corrected the income statement for 2008 by excluding the restructuring and listing expenses from operating expenses, and included it in the item extraordinary items. The correction is showed in table 4.1 below. Book loss from sale of shares in Teekay Petrojarl ASA Prosafe Production sold all its shares in Teekay Petrojarl ASA on June 20 th The sale of these shares resulted in a book loss of USD 52,6 million, and was included in other financial items in the income statement. Since this is a financial item, it does not have any effect on EBIT. However, I have assumed that this is an extraordinary item, and therefore it will not be forecasted in future periods. The corrections are shown in the following table. 38
39 Table Correction 1 Extraordinary items Correction 1 - Extraordinary items USDm Income statement Operating expenses - uncorrected 51,7 Restructuring and listing expenses 5,0 Operating expenses - corrected 46,7 Other financial items - uncorrected (41,9) Book loss from sale of shares 52,6 Other financial items - corrected 10,7 Effects EBIT 5,0 Extraordinary items (57,6) Source: Own contribution Correction 2: Capitalisation of operating leases According to the financial information released in May 2008, Prosafe Production is committed to make payments in respect of operating leases. Although not stated, I assume that these leases are considered a part of the company s operations. The lease agreements should therefore be treated as if the company had borrowed money to purchase the asset. The asset and debt should be recorded on the company s balance sheet, and interest should be deducted from operating profit 37. To derive the value of operating leases, I need to examine the determinants of rental expenses. The rental expense includes compensation for the cost of financing the asset (at the cost of debt) and the periodic depreciation of the asset (assuming straight line depreciation). Thus, the periodic rental expense equals 38 : Re ntal Expenset = AssetValuet 1 k d + 1 Asset Life Rearranging the equation, the asset s value can be estimated: AssetValue t 1 = Re ntal Expense 1 k d + Asset Life t 37 Koller et al., 2005, p Koller et al., 2005, p
40 In order to capitalise the operating leases, I have made the following assumptions: The asset life is assumed to be 10 years Cost of debt is the same as in the WACC estimation, 6,5% The marginal tax rate is the same as in the WACC estimation, 0% Since not specified in the financial information, I assume that leasing expenses are expensed under general and administrative expenses. Since there is no information regarding leasing expenses in 2005, I have assumed that the company did not have any operational leases during this year. Table Capitalisation of operating leases Correction 2 - Operating leases USDm Operating lease expense 0 0,5 1,6 5,2 Assets Other tangible assets - uncorrected 0,8 2,6 5 Capitalised operating lease assets 0,0 3,0 9,7 31,5 Other tangible assets - corrected 3,8 12,3 36,5 Liabilities Interest bearing short-term debt - uncorrected 0,3 0,6 49,5 Operating lease expense 0,5 1,6 5,2 Interest bearing short-term debt - corrected 0,8 2,2 54,7 Interest bearing long-term debt - uncorrected ,5 Financial leasing 2,5 8,1 26,3 Interest bearing long-term debt - corrected 2,5 8,1 96,8 Income statement General and administrative expenses - uncorrected 10,3 10,0 14,7 Operating lease expense 0 0,5 1,6 General and administrative expenses - corrected 10,3 9,5 13,1 Depreciation - uncorrected 16,4 15,7 33,6 Effect of financial leasing 0,0 0,3 1,0 Depreciation - corrected 16,4 16,0 34,6 Interest expenses - uncorrected 0 0,3 1,6 Effect of financial leasing 0,0 0,2 0,6 Interest expenses - corrected 0,0 0,5 2,2 Effects Depreciation - (0,3) (1,0) EBIT 0,0 0,2 0,6 Interest expense - (0,2) (0,6) Source: Own contribution Because of the capitalisation of the operational leases, we observe the following effects: 40
41 The operating lease expense is removed from other operating expenses, and depreciation has increased. This has affected the company s EBIT positive in 2006 and Interest expenses have increased due to increased liabilities in the balance sheet. However, this does not affect EBIT as it is a financial item. The asset side has increased with the lease asset, and liabilities have increased with the corresponding amount due to higher debt caused by the re-classification. These changes on the balance sheet will influence the invested capital calculated later. Adjusted EBIT The corrections in the income statement, has had the following effects on Prosafe Production s estimated EBIT: Table Adjusted EBIT Total EBIT effect USDm EBIT - uncorrected 37,9 37,8 59,2 43,1 Correction 1 5,0 Correction 2 0,0 0,2 0,6 EBIT - adjusted Source: Own contribution 37,9 38,0 59,8 48,1 4.3 Calculation of NOPLAT To determine the after-tax income generated by invested capital, I will calculate NOPLAT. NOPLAT aggregates the operating income generated by invested capital. Unlike net income, NOPLAT includes profits available to both debt holders and equity holders 39. For adjusting reported taxes, marginal taxes are those taxes the company would pay if the financing or non-operating item were eliminated 40. This means adding back tax shields from financing activities. 39 Koller et al., 2005, p Koller et al., 2005, p
42 If foreign taxes are based on income and debt is raised abroad, they are marginal. If, however, foreign taxes are based on revenues or debt is raised solely at home, they are not marginal; taxes would not increase as leverage decreased 41. Prosafe Production is located in Cyprus, but all their income is earned in other parts of the world. The corporate income tax rate in Cyprus is 10% 42. However, profits from a permanent establishment maintained abroad are generally exempt from tax in Cyprus 43. This means that Prosafe Production does not pay any taxes in Cyprus currently. However, the group's vessels are subject to taxation based on the special rules for taxation of shipping and offshore companies in a number of jurisdictions worldwide. The Group company s taxes relate mainly to withholding tax incurred in countries in which the company s vessels operate 44. As Prosafe Production may become subject to taxation in new jurisdictions in the future, it makes it impossible to foresee with certainty the future level of taxation. Furthermore, the company has raised all their debt in Norway. The company does not provide any information about how taxes are computed in their financial information released. I have therefore decided to set the marginal tax rate equal to 0, because of the uncertainty estimating this parameter. Tax shields will therefore not be computed. The reader should be aware that this assumption could underestimate the calculated NOPLAT below. Table Calculation of NOPLAT Calculation of NOPLAT USDm Adjusted EBIT 37,9 38,0 59,8 48,1 Taxes -3,5-4,5-8,8-9,5 NOPLAT Source: Own contribution 34,4 33,5 51,0 38,6 41 Koller et al., 2005, p Deloitte, Cyprus International Tax & Business Environment Deloitte, Cyprus International Tax & Business Environment Prosafe Production, Audited financial report as per 14 May
43 4.4 Calculation of invested capital Invested capital represents the total investor capital required to fund operations, without distinction to how the capital is financed. When calculating ROIC, I will use average numbers of invested capital. This method assumes that the development of invested capital is continuous over the year, which is seen as the appropriate assumption 45. In order to calculate invested capital I have to decide which items in the financial information that is associated with the company s core operations. The items that will be discussed are reported below. Operating assets Cash and deposits When analysing cash and deposits, one should divide the item into two parts, working cash and excess cash. Excess cash should not be included in invested capital, as it per definition is unnecessary for core operations 46. The company does not disclose how much cash they deem necessary for operations. Between 1993 and 2000, the cash holdings of non-financial companies on the S&P 500 index, held working cash just below 2 percent of sales 47. I have therefore assumed 2 percent to be a good proxy for working cash for Prosafe Production, and the remaining part of cash and deposits will be excess cash. Debtors The company does not specify where these outstanding accounts stem from. However, I assume that it is related to the company s core operations, and the item will therefore be included in invested capital. Financial assets Again, this is an item that is not specified in the financial information released. I have therefore assumed that this item is not a part of the company s core operations and it will be subtracted from invested capital. 45 Plenborg og Petersen, 2005, p Koller et al., 2005, p Koller et al., 2005, p
44 Other current assets Some of the amount in this item stems from transactions with related party (Prosafe SE). The remaining amount is not specified. This item will therefore be treated as a part of the company s core operations 48. Operating liabilities Other provisions The company does not specify this item, but I will treat them as a part of the company s core operations. Accounts payable This items contains payments to suppliers, customers etc., and will therefore be treated as a part of Prosafe Production s core operations. Other current liabilities Same as other current assets, most of the amount stems from transactions with related party. This item is therefore treated as a part of Prosafe Production s core operations. Based on the discussion above, invested capital has been estimated as following: 48 Plenborg og Petersen, 2005, p
45 Table Invested capital From asset side USDm Total assets 435,6 783,8 1204,9 2029,3 Excess cash 57,4 49,7 50,0 388,7 Financial assets 0,8 1,1 1,5 0,0 Operating assets 377,4 733,0 1153,4 1640,6 Other provisions 1,0 1,0 1,1 2,1 Taxes payable 0,9 1,3 1,6 0,0 Accounts payable 16,5 65,2 32,6 0,0 Other current liabilities 20,1 28,0 28,0 95,8 Operating liabilities 38,5 95,5 63,3 97,9 Invested capital 338,9 637,5 1090,1 1542,7 From equity and liability side USDm Total equity 393,7 678,0 990,1 1073,2 Interest bearing long term debt, corrected 2,5 8,1 96,8 833,2 Interest bearing short term debt, corrected 0,8 2,2 54,7 25,0 Interest bearing debt 3,3 10,3 151,5 858,2 Excess cash 57,4 49,7 50,0 388,7 Financial assets 0,8 1,1 1,5 0,0 Net interest bearing debt -54,9-40,5 100,0 469,5 Invested capital Source: Own contribution 338,9 637,5 1090,1 1542,7 4.5 Calculation of ROIC ROIC is a measure of how effectively the company allocates the capital invested in its operations. It is defined as the return the company earns on each dollar invested in the business 49. Since it focuses solely on the company s operations, ROIC is a better analytical tool for understanding the company s performance than return on equity (ROE) and return on assets (ROA). ROE mixes operating performance with capital structure, making peer group analysis and trend analysis less meaningful. ROA is inadequate because the ratio double counts any implicit financing charged by suppliers in the numerator as part of cost of goods sold and in the denominator as part of total assets 50. ROIC is calculated by the following formula 51 : ROIC = NOPLAT Invested Capital 49 Koller et al., 2005, p Koller et al., 2005, p Koller et al., 2005, p
46 Since NOPLAT and invested capital are independent of financial structure and nonoperating assets, so is ROIC. It is now possible to measure how the company s core operating performance has changed, without the effects of financial structure and other nonoperating items distorting the analysis. ROIC has been calculated to be the following for Prosafe Production: Table Calculation of ROIC Calculation of ROIC USDm E NOPLAT 34,4 33,5 51,0 77,2 Invested capital 338,9 637, , ,7 Average invested capital 488,2 863, ,4 ROIC Source: Own contribution 6,9 % 5,9 % 5,9 % As can be seen in table 4.6, Prosafe Production s ROIC has decreased from 2006 to 2007, and been stable from 2007 to These results are not particularly impressive, as they are lower than the WACC calculated under section However, as explained earlier, the estimated NOPLAT may be underestimated due to uncertainty concerning historical tax estimations. Also, it is important to stress that ROIC in 2008 is just an estimate and should be interpreted with care. I have assumed that the company will perform equal in the last 6 months as they did the first 6 months of the year. This assumption is bounded with a high level of uncertainty, but I have assumed it to be a reasonable proxy for the full year 2008 results for now. The reader should be aware that these calculations are based on financial information extracted from financial statements released by Prosafe SE. The floating production division in Prosafe SE may have added value to the company before the split. 46
47 5 Forecasting of future financial statements In this section I will forecast Prosafe Production s income statement and balance sheet. The forecast is based on information from the company itself, as well as the strategic analysis performed in chapter 3 and the financial statement analysis in chapter 4. I have divided the forecasting period into two periods. I have developed an explicit forecast for the first 10 years. I believe that the explicit forecast period is long enough for the company to reach a steady state. The second period from 2017 and onwards is the terminal period, where the company s growth is forecasted. 5.1 Income statement forecast The revenue forecast is maybe the most important item in the income statement forecast. Most of the other items in the income statement will be forecasted as a percent of operating revenues. It is therefore critical that the revenue forecast is as accurate as possible. I will estimate the forecast ratio for each item in the income statement, and thereafter multiply the forecast ratio by an estimate of its driver Operating revenues Charter revenues To forecast the charter revenues, I have calculated the value of Prosafe Production s existing contracts and expected dayrates for new contracts. The company currently has several long-term contracts 52, and a great portion of the charter revenue forecast stems from these contracts. Before conducting the charter revenue forecast, two important elements need to be explained: Dayrates - This is the daily revenue the different vessels achieve from their operations. To determine the dayrates, I have divided each vessel s estimated contract value by the number of days specified in the contract. 52 See Appendix 1 47
48 Utilization rate Each vessel s expected utilization rate. The vessels are not operational throughout the whole year. The vessels will most likely need to undertake maintenance and modifications during the operating period. Also, when the contract for a vessel expires, the vessel may need to undertake modifications in order to operate on a different oil field. The expected yearly charter revenue for the different vessels has been calculated by the following formula: Expected yearly charter revenues = dayrates * utilization rate * days in operation When forecasting expected charter revenues, I have assumed that the options attached to the contracts will be exercised, and that dayrates for the option period will be re-negotiated to reflect future oil prices. According to Prosafe Production, the FPSOs are often likely to remain in the field beyond the original contract 53. The reason is that the oil companies often have conservative estimates on expected lifetime for the different oil fields, and is therefore careful when agreeing upon new contracts. When forecasting expected dayrates for the options, I have considered the oil price and the state of the oil industry at the point of contract agreement. Some of the contracts, especially those that will start up in 2009, were agreed when the oil price was relatively high. I have assumed that the oil price will stabilize around a price of USD bbl, and adjusted the future dayrates accordingly. Only the two FSO vessels have contracts, including options, that expires before the end of the explicit period assumed. For one of them I have assumed that the vessel will continue to operate on the current field, as the oil field is expected to continue operations for several years ahead. For the other one, I have assumed a new contract agreement in 2011 with dayrates reflecting the oil price estimates mentioned above. Because of the uncertainty surrounding modifications and relocation of the vessel, I have decreased the expected utilization rate for this vessel. When forecasting expected utilization rate for the different vessels, I have estimated this to be 95% for most of the vessels during the period. The majority of the vessels have long-term 53 Prosafe SE, Annual report
49 contracts that eliminate the necessity of large modifications and relocation, thus the utilization rate will remain high. Also, the company has historically had an operational uptime for their vessels close to 100% 54. This may be a simplified assumption though. However, instead of forecasting the utilization rate for all the different vessels, I think 95% is a reasonable proxy as the over / underestimation is expected to somewhat offset each other. Individual forecasting of charter revenues for all the vessels have been made. The overview of the forecast can be viewed in the attached excel sheet or in the appendices. Other operating revenues The company does not specify what kind of revenues this item includes. However, I assume that they are related to their in-house developed technology. Historically, other operating revenues divided by operating revenues have been around 12%. I assume that this is a good proxy for the future. Thus, other operating revenues have been forecasted to be 12% of charter revenues in the future Operating expenses Ideally, operating expenses should be determined in the same way as charter revenues, by determining operational expenditures for each vessel and aggregate it for the whole company. However, since operational expenditures are not available to me, I have decided to forecast each items under operating expenses by dividing the item with operating revenues. The estimated forecast ratios are, as in the financial statement analysis, excluding non-operating items. Employee benefits Historically, employee benefits have constituted around 20% of operating revenues. I have decided to increase the ratio to 23% in 2008, and further to 25% from 2009 to The reason is that the vessels starting their operations in 2009 will require more qualified personnel. As discussed under the strategic analysis in chapter 3, the industry is currently lacking human capital, leading to higher expenses related to wages etc. From 2012 and 54 Prosafe Production, Condensed Interim Financial Statement, Quarter ended June 30,
50 onwards, I have decided to decrease this item back to 23% of operating revenues, as I assume that the strong cyclical of the industry will decrease. Repair and maintenance and other vessel operating expenses Since Prosafe Production has three new vessels that will start operating in early 2009, these items are likely to increase in the future as a consequence of higher operational activity. Historically, these items have constituted around 5% operating revenues. I have decided to increase the forecast ratio for repair and maintenance expenses and other vessel operating expenses to 7% from 2009 and onwards. General and administrative expenses General and administrative expenses are assumed to be 10% of operating revenues, based on historical ratios Other items on the income statement Depreciation To forecast depreciation, I mainly have two options. I can forecast depreciation as a percentage of operating revenues or as a percentage of tangible assets 55. I have decided to use tangible assets as the forecast driver. The company depreciates its vessels on a straight-line basis over 3-15 years, and their equipment over 3-5 years. This implies a depreciation rate between 6% and 33%, and 20% to 33% respectively. When the company determines the depreciation rate, an expected residual value at the end of the fixed contract period is taken into consideration 56. Historically, the depreciation rate has been close to 3%, except for one year when it was close to 8%. Even though it is lower then the depreciation implied, I have decided to use a depreciation rate equal to 4% over the entire period, as I assume that this will be closer to the actual depreciation in the future. 55 Koller et al., 2005, p Pareto Securities, Prospectus Prosafe Production, May
51 Interest income The usual driver for interest income is cash and deposits. Cash and deposits is a function of interest income, and in order to avoid circularity in the financial model, I will use beginning values of cash and deposits when forecasting this item 57. Although current short-term interest rates are higher, I believe the long-term risk-free interest rate (10-year U.S government bond) estimated to be 4,87% in section 6.2.2, to be a reasonable proxy. The reason is that the expected average interest rates for the next ten years are implied by government bonds. Interest expenses The appropriate driver for interest expenses is total interest bearing debt. To avoid circularity in the model, I will forecast interest expenses as a function of the previous year s interest bearing debt. I believe the best estimate for Prosafe Production s future borrowing costs to be 6,5%, see section for further details. Other financial items Historically, this item has been related to gains and losses from currency differences and loss on sales of shares. Other financial items are assumed to be zero in the future as this is an unpredictable item. Taxes As previously discussed under section 4.3, Prosafe Production s taxes relate mainly to withholding tax incurred in countries in which the company s vessels operate. The company has paid taxes in all previous years. However, I have estimated the tax rate to be zero, because of the uncertainty surrounding this item. 5.2 Balance sheet forecast In this section I will estimate each line item in the balance sheet for the explicit period Some of the items will be forecasted as a function of revenues, the other items will 57 Koller et al., 2005, p
52 be forecasted using the original amount multiplied by a growth rate. Some of the items will be used to balance the balance sheet, and these items will be commented upon in the end of this section Assets Goodwill A company records goodwill when the price it paid for an acquisition exceeds the target s book value 58. Prosafe Production has not given any indication of planned acquisitions in the future. I have therefore kept goodwill constant at its current level over the entire period. Ships In order to determine the future value of this item, I have taken the following approach: Asset value = Prior years closing balance + capital expenditure depreciation For 2008, I have estimated a capital expenditure of USD 400 million over the last six months, and USD 50 million in 2009 in order to complete the company s ongoing conversion projects. For the rest of the period I have assumed capital expenditures of USD 5 million. Further repair and maintenance costs are expensed in the income statement in the period they are incurred. The depreciation rate is estimated to be 4% over the entire period, the same as discussed under section Other tangible assets I assume that this item relates mainly to equipment and offices, and the item has been estimated to be 10% out of operating revenues in the future. Financial assets Financial assets is a non-operating item that will not affect free cash flow. The item will be added to enterprise value at its market value, and I have therefore assumed zero future growth in the balance sheet. 58 Koller et al., 2005, p
53 Cash and deposits, working cash As in the financial statement analysis in chapter 4, working cash is assumed to be 2% of operating revenues in the forecast period. Debtors As this item is closely related to operating revenues, I have decided to use operating revenues as the forecast driver. Historically, the item has varied from 10% to almost 25% of operating revenues, with an upward trend. I have assumed this ratio to be 15% in the future, as the bargaining power against their buyers has been increased. Other current assets As mentioned in section 4.4, some of the amount in this item relates to transactions with Prosafe SE, and the item is therefore forecasted as a percentage of operating revenues. Historically, this item has constituted from 16% up to almost 40% of operating revenues. Therefore, there is a lot of uncertainty related to forecasting this item. It is likely that this item will decrease in the future because of the split from Prosafe SE, and a forecast ratio equal to 25% for each year through the explicit period has been used Equity and liabilities Paid in capital As mentioned earlier in this thesis, Prosafe Production was spilt from Prosafe SE in May this year. In connection with the listing on Oslo Stock Exchange, a new holding company, Prosafe Production Public Ltd, was created with a share capital of USD 25,5 million 59. Paid in capital will be held constant, as I assume that no new shares will be issued. Other equity To determine this item, I have used the principle of clean surplus accounting 60 : Retained earnings t+1 = Retained earnings t + Net profit (loss) Dividends 59 Prosafe Production, Condensed Interim Financial Statement, Quarter ended June 30, Koller et al., 2005, p
54 This means that net profit (loss) - dividends will be added to prior years other equity. The company does not anticipate paying cash dividend on a regular basis in the foreseeable future, as all free cash flow will be deployed back to growth 61. I have therefore assumed that no dividends will be paid during the forecast period. Other provisions Operating revenues has been used as the forecast driver for this item. The ratio has been steady around 1% for all previous years, and I believe this to be a good proxy for the future. Taxes payable As discussed earlier, estimating future taxes for Prosafe Production is surrounded with a lot of uncertainty. As taxes payable is assumed to be paid in 2008, this item will be set equal to zero for the entire forecast period. Accounts payable This item is expected to follow operating revenues closely, and operating revenues is therefore chosen as the forecast driver. Accounts payable has been around 20% of operating revenues except for year 2006, and I assume that 20% is a good estimate for the future. Other current liabilities Other current liabilities relate mainly to operating revenues, and in previous years the majority of the amount in this item has been related to transactions with related party. I have therefore assumed that this ratio will decrease from around 20% a year to 10% a year for the future period. Balancing the balance sheet At this point the following items need to be determined in order to complete the balance sheet: 61 Pareto Securities, Prospectus Prosafe Production, May
55 Interest-bearing long-term debt and interest-bearing short-term debt Both these items will be held constant in the forecast period. The reason is that debt is not included as a part of free cash flow, and the items will therefore not affect the enterprise valuation 62. Newly issued debt and excess cash In order to make the balance sheet balance, a new item titled newly issued debt and excess cash will be used. These items are often referred to as the plug and to determine these items, I will test which is higher, assets excluding excess cash or liabilities and equity, excluding newly issued debt. If assets excluding cash are higher, excess cash will be set equal to zero and the difference will be plugged with newly issued debt. Otherwise, excess cash will be used as the plug 63. Comments regarding 2008 estimates In order to determine estimates for the income statement and balance sheet for the full year 2008, some assumptions had to be made. The company released a condensed interim financial statement for the first six months of 2008 in August. This financial information had to be taken into account as some of the items in the balance sheet have changed dramatically after the listing as a separate company on Oslo Stock Exchange, e.g. interestbearing long-term debt has increased from almost USD 100 million at the end of 2007, to USD 833 million at the end of June Therefore, some of the items in the income statement and balance sheet have been estimated without taken into consideration the numbers reported for the first six months, while other items have been estimated using values from plus an estimate for the remaining six months. Even though this method is not theoretically correct, I believe the estimates for the full year 2008 to be reasonable estimates based on the information available. The estimates can be viewed in full on the excel spreadsheet attached to this thesis. The income statement and balance sheet for the period 2008 to 2017 is now completed. This forecast is the basis for calculating the company s future free cash flows, which are the main elements of the enterprise DCF model used to value the company in chapter 6. The complete income statement and balance sheet can be viewed in Appendix Koller et al., 2005, p Koller et al., 2005, p
56 6 Valuation of Prosafe Production 6.1 Valuation theory There are several types of valuation models that can be employed to estimate a company s value, including discounted cash flow (DCF) models, multiple models and real option based models. Multiple models are valuation models where you compare a company s multiples against those of a comparable company. There exist many different multiples, but the most widely used is the price/earnings ratio (P/E ratio). Real option pricing models use a replicating portfolio to value the project. However, I will in this thesis concentrate on DCF models as this method is seen as the most reliable and intuitive method. There exist several DCF models. The most commonly used is the enterprise DCF model and the discounted economic profit model (also known as the EVA-model), and both valuation methods should yield the same results when applied correctly. The DCF model relies solely on the flow of cash in and out of the company, rather than on accounting-based earnings which can be misleading. Economic profit highlights whether a company is earning its cost of capital in a given year 64. Given the methods identical results and due to limited space and time, I will focus on the enterprise DCF model when valuating Prosafe Production. The enterprise DCF model To value a Prosafe Production s common stock using enterprise DCF, the following four steps needs to be completed 65 : 1. Value the company s operations by discounting free cash flow (FCF) from operations at the weighted average cost of capital (WACC). 2. Value non-operating assets and other equity investments. Combining the value of operating assets and non-operating assets leads to enterprise value. 3. Identify and value all non-equity financial claims against the company s assets. 64 Koller et al., 2005, p Koller et al., 2005, p
57 4. Subtract the value of non-equity financial claims from enterprise value to determine the value of common stock. Share price is then calculated by dividing equity value by the number of shares outstanding. Figure DCF model Present value of FCF in explicit period + Present value of continuing value, FCF = Present value of cash flows * Mid-year adjustment factor = Value of operations + Non-operating assets = Enterprise value - Non-equity claims = Value of equity Number of shares outstanding Price per share USD USD/NOK Price per share NOK Source: Own contribution, based on Koller et al. (2005) 6.2 Weighted average cost of capital In order to determine the value of operations, it is necessary to discount each year s forecast of free cash flow for time and risk. The weighted average cost of capital blends the required rates of return for debt and equity based on their market-based target values. Since free cash flow is available to all the investors, the discount factor for free cash flow must represent the risk faced by all investors, making WACC the appropriate discount factor. WACC is defined as follows 66 : D E WACC = k d ( 1 tm ) + k D + E D + E e where D = the company s market value of debt E = the company s market value of equity k d = cost of debt k e = cost of equity t m = company s marginal tax rate 66 Koller et al., 2005, p
58 Applying the weighted average cost of capital is intuitive and relatively straightforward. However, it comes with some drawbacks. Discounting all future cash flows with a constant cost of capital, implicitly assumes that the company manages its capital structure to a target rate. In theory, different WACC s should be used each year to account for the changes in capital structure each period. The WACC can be adjusted for a changing capital structure, however it is a complicated process and I will not focus on that in this thesis. In order to estimate the WACC, we need to determine the target capital structure, the cost of equity and the after-tax cost of debt. To reduce the uncertainty and complexity regarding the calculation of WACC, I have made the following assumptions: A constant capital structure throughout the period Constant cost of equity and cost of debt A constant marginal tax rate Capital structure In order to determine the capital structure, market values of debt and equity should be used. The market value of equity To estimate Prosafe Production s market value of equity I have multiplied the company s share price on August 22 nd 2008 with the number of shares outstanding. On this date Prosafe Production s share price was USD 4,55 and the company had 255,2 million shares outstanding. The market value of equity is therefore estimated to be USD millions. The market value of debt Ideally, one should use market values to estimate the debt. However, since market values are not available, the book value of Prosafe Production s debt is considered a reasonable approximation if the company s default risk has been fairly stable 67. I have estimated the market value of debt to be USD 469,5 millions Koller et al., 2005, p See table
59 6.2.2 Cost of equity To determine the cost of equity I will use the capital asset pricing model (CAPM). The model allows investors to determine the relevant measure of the risk and return for any asset when the markets are in equilibrium. For companies it can be used to determine a company s cost of equity 69. The capital asset pricing model has been criticised for its restrictive assumptions, such as a perfect capital market, all investors can lend and borrow unlimited at the risk free rate and unlimited short sale is allowed. However, there has not yet been introduced a better model. The CAPM can be defined as 70 : i f i [ E( R r ] E( R ) = r + β ) m f where E(R i ) = the expected return of stock i r f = risk-free rate β i = stock s sensitivity to the market E(R m ) = expected return of the market In the CAPM, the risk-free rate and market risk premium are common to all companies; only beta varies across companies 71. Beta Beta is the measure of how sensitive a company s stock is to market movements; it measures the company s market risk 72. It reflects the covariance with the market, and since the market portfolio is the portfolio of all stocks, the market portfolio will have a beta equal to 1. Stocks with betas greater than 1 tend to amplify the overall movements of the market. Stocks with betas between 0 and 1 tend to move in the same direction as the market, but not as far Elton et al, 2003, ch Koller et al., 2005, p Koller et al., 2005, p Brealy et al., 2006, p Brealy et al., 2006, p
60 Beta is defined as 74 : σ β i = σ im 2 m where, σ im = the covariance between stock i s return and the market return σ 2 m = the variance of the market return Ideally, five years of monthly returns should be used to determine beta in order to get a reliable estimate 75. Since Prosafe Production was listed on Oslo Stock Exchange in June 2008, there does not exist enough data to estimate a proper and reliable beta for the company. I have therefore decided to estimate the beta for a comparable company, BW Offshore, and thereafter determine Prosafe Production s beta. This will be done in a threestep process. First I will estimate BW Offshore s beta using the formula defined above. BW Offshore was listed on Oslo Stock Exchange May 31 st 2006, and I will therefore use weekly data in order to increase the preciseness of my beta estimate. Next, I will unlever the estimated beta for BW Offshore s calculated market debt-to-equity ratio. Finally, I will relever the unlevered beta using Prosafe Production s target debt-to-equity ratio, using current market values as proxies. Prosafe Production s beta is estimated as follows: β BW Offshore cov ar between market and BW = var iance of market return = 0,91 β U β L = = D 1 + E 0,91 ( 1+ 0,25) = 0,73 D β L = β U 1 + = 0,59 = E ( 1+ 0,4) 1, Brealy et al., 2006, p Koller et al., 2005, p
61 where β U = beta unlevered β L = beta levered D = market value of debt E = market value of equity The formula for estimating beta unlevered and beta levered has been simplified. The beta of debt tends to be low because debt claims have first priority if a default occurs. I have therefore assumed that the beta of debt is 0. Second, since I have assumed that the company maintains a constant capital structure, the value of tax shields will fluctuate with the value of operating assets and beta of the tax shields will equal the beta of the unlevered company 76. A beta of 1,03 will be used when estimating the company s cost of equity later. Risk-free rate To estimate the risk-free rate we use government default-free bonds. Ideally, each cash flow should be discounted using a government bond with a similar maturity. However, in practice most choose a single yield to maturity from one government bond that best matches the entire cash flow stream being valued. The most common proxy is the 10-year government bond 77. Longer-dated bonds might match the cash flow stream better, but their illiquidity can cause stale prices and yield premiums 78. I have used a 10-year U.S government bond estimated to be 4,87% 79 as a proxy for the risk-free return. This is applied in order to ensure that cash flows and the cost of capital are denominated in the same currency. Market risk premium The market risk premium is the difference between the market s expected return and the risk-free rate. The expected return on the market is unobservable, and no single model for estimating the market risk premium has gained universal acceptance 80. Historical estimates of the market risk premium, which often report numbers near 8%, are too high for valuation purposes, because they compare the market risk premium versus short-term bonds and use 76 Koller et al., 2005, p Koller et al., 2005, p Koller et al., 2005, p Koller et al., 2005, p
62 only 75 years of data 81. Koller et al. (2005) believe 4,5 to 5,5% to be an appropriate range. For simplicity, I have therefore decided to use 5% as the estimate for the market risk premium. I now have all the necessary information to calculate Prosafe Production s cost of equity. The calculation is shown in table 6.1 below: Table Cost of equity Cost of equity estimation Beta 1,03 Riskfree rate 4,87 % Market risk premium 5 % Cost of equity 10,0 % Source: Own contribution After-tax cost of debt The after-tax cost of debt depends on the value of the tax shield as well as the company s credit risk. Credit risk depends on how risky the company s business is and how likely it is that the company will be able to meet its obligations in the future. Ideally, one should use the most current market rate on debt of equivalent risk, as historical cost of debt does not give any indication of current cost of debt. Even so, Prosafe Production had an average cost of debt of circa 5,9% including credit margin in 2007, as against 5,5% in The development of the U.S Libor has been falling since the start of Prosafe Production entered into a new credit facility in May 2008 in connection with the listing on Oslo Stock Exchange on highly favourable terms, with a cost of debt of LIBOR plus a 0,95% margin 83. However, due to the current turbulence in the financial market, cost of debt is likely to increase, especially in the short-term as lenders are likely to charge a higher margin on the loans. Based on the discussion above, I have predicted the long-term cost of debt to be 6,5%. This is also consistent with a premium to the risk-free government bond. As previously discussed under section 4.3, Prosafe Production does not pay taxes in Cyprus. The marginal tax rate is therefore set equal to zero. However, the company pays taxes in a 81 Koller et al., 2005, p Prosafe Production, Audited financial report as per 14 May Prosafe Production, Audited financial report as per 14 May
63 number of jurisdictions worldwide, and this issue will be treated in the sensitivity analysis later. The after-tax cost of debt is therefore estimated to be 6,5% WACC estimation All the parameters in the WACC formula have now been estimated. Prosafe Production s estimated WACC is shown in table 6.2 Table WACC estimation WACC estimation Cost of equity 10,0 % Cost of debt 6,5 % Marginal tax rate 0 % Target D / D+E 0,29 Target E / D+E 0,71 WACC Source: Own contribution 9,0 % A WACC of 9,0% will be applied when determining present value of future free cash flow in the valuation section. 6.3 Free cash flow Free cash flow equals the cash flow generated by the company s operations, less any reinvestments back into the business, and provides the basis for the enterprise DCF valuation. Free cash flow is the cash flow available to all investors, and is independent of leverage. It can be thought of as the after tax cash flow as if the company held only core operating assets and financed the business entirely with equity. Free cash flow is calculated for the explicit period 2008 to 2017 and is calculated as 84 : 84 Koller et al., 2005, p
64 Figure Free cash flow EBIT - Operating cash taxes = NOPLAT + Depreciation = Gross cash flow Change in working capital Net capital expenditures Investments in intangible assets Change in other operating assets (net) = Gross investment = Free cash flow Source: Own contribution, based on Koller et al (2005) Gross cash flow represents the cash flow generated by the company s operations. It represents the cash available for investment and investor payout, without having to sell nonoperating assets or raise additional capital. Gross investment is the portion of gross cash flow the company has reinvested back into the business 85. Free cash flow is then calculated by subtracting gross investment from gross cash flow. A mid-year adjustment factor is used as I assume that cash flows occur continuously throughout the year rather than in a lump sum at the end of the year 86. For all free cash flow calculations, see Appendix Continuing value Continuing value is the value of the company s expected cash flow beyond the explicit forecast period. Making simplifying assumptions about the company s performance during this period, e.g. assuming a constant rate of growth and return on capital, we can estimate continuing value by using formulas instead of explicitly forecasting and discounting cash flows over an extended period. Continuing value can be calculated using the well-known cash flow perpetuity formula 87 : Continuing Value t FCFt +1 = WACC g 85 Koller et al., 2005, p Koller et al., 2005, p Koller et al., 2005, p
65 where FCF t+1 = normalised level of FCF in the first year after the explicit forecast period g = expected growth rate in FCF in perpetuity WACC = weighted average cost of capital The growth rate in the cash flow perpetuity formula is estimated to be 3%. It is difficult to estimate the company s future growth as the FPSO industry is highly cyclical. However, because the underestimation is likely to offset the overestimation, and considering the company s position in the high-end segment of the industry, I believe 3% to be a reasonable estimate for future growth. 6.5 Non operating assets Cash flows related to non-operating assets are not included in the free cash flow, and are therefore not accounted for in the value of operations. Although not included in operations, they still represent value to the shareholder 88. Thus, it is necessary to assess the present value of each non-operating asset, and add the resulting value to the value of operations. For Prosafe Production, excess cash and financial assets have been classified as non-operating assets. I assume that these assets are stated at market value in the balance sheet, as no information regarding these assets are available. Adding the market value of these nonoperating assets to the value of operations equals the enterprise value. 6.6 Non equity claims To calculate the value of common equity, I need to deduct the value of all non-equity claims from the enterprise value 89. For Prosafe Production, non-equity claims include short-term and long-term interest-bearing debt and capitalised operating leases. As under section 6.2.1, book values are used as market values. 88 Koller et al., 2005, p Koller et al., 2005, p
66 6.7 Valuation of Prosafe Production Now all the parameters necessary to estimate the value of Prosafe Production has been completed. The valuation of the company s equity and corresponding share price has been summarised in table 6.3: Table Valuation of Prosafe Production WACC 9,0% Growth 3% DCF model Present value of FCF in explicit period 722,3 Present value of continuing value, FCF 1 476,0 Present value of cash flow 2 198,3 Mid-year adjustment factor 1,0441 Value of operations 2 295,2 Non-operating assets 388,7 Enterprise value 2 683,9 Non-equity claims 858,2 Value of equity 1 825,7 Number of shares outstanding (million) 255,2 Price per share USD 7,2 USD/NOK 5,4 Price per share NOK Source: Own contribution 38,4 I have estimated Prosafe Production s fair value to be NOK 38,4 per share at August 22 nd The share price at Oslo Stock Exchange the same day was NOK 24,4. Based on the analysis conducted throughout this thesis, I consider the company to be undervalued by NOK 14. However, before I conclude on the company s fair value per share, I will threat the marginal tax issue in the sensitivity analysis in the next section. 6.8 Sensitivity analysis In my DCF valuation of Prosafe Production a lot of assumptions regarding important parameters have been made. In this section I will perform a sensitivity analysis based on the parameters I consider to be surrounded with the largest uncertainty. These parameters are marginal tax rate, estimated WACC and expected growth in the terminal period. 66
67 6.8.1 WACC and growth Changes in the estimated WACC and expected growth after explicit forecast period will most likely have a great impact on the estimated value of Prosafe Productions shares. Even though it is a well-known fact that a lower WACC and a higher growth rate will increase the estimated share price, I still find it interesting to examine how changes in these parameters will affect the estimated share price. The parameters estimated in the WACC formula are parameters that are associated with great uncertainty. Cost of equity includes systematic risk, risk-free rate and market risk premium and these parameters are all parameters that are out of Prosafe Productions control, and changes in these parameters will influence the company to a large degree. Furthermore, in the valuation performed under section 6.7, the continuing value constitutes of about 2/3 of the present value of cash flows, thus the valuation is highly sensible towards future growth rate. I have therefore decided to examine the effect of changes in the company s WACC and growth rate. The results are shown in the table below. Table Sensitivity analysis on WACC and growth NOK Growth WACC 7,0 % 8,0 % 9,0 % 10,0 % 11,0 % 1 % 45,9 37,0 30,3 25,2 21,1 2 % 53,5 42,0 33,8 27,7 22,9 3 % 64,9 49,1 38,4 30,9 25,2 4 % 83,9 59,6 44,9 35,2 28,2 5 % 121,9 77,2 54,6 41,2 32,2 Source: Own contribution As can be observed in table 6.4, small changes in estimated WACC and growth rate will have a relatively large influence on the company s estimated share price. The sensitivity analysis shows that the valuation performed is more sensitive to changes in WACC than changes in growth in the continuing period Marginal tax rate As mentioned earlier, there is a lot of uncertainty surrounding the tax estimation for Prosafe Production. The company does not pay any taxes to Cyprus, where the company is located, but they are taxed by the different jurisdictions in which the vessels operate. As a marginal 67
68 tax rate equal to zero is likely to overestimate the valuation performed in section 6.7, I will now examine how different marginal tax rates will affect the company s share price. Prosafe Production has reported the following taxes from previous years: Table Taxes Taxes USDm Profit (loss) before taxes 39,3 47,5 61,9 Taxes (3,5) (4,5) (8,8) Tax rate 8,9 % 9,5 % 14,2 % Source: Own contribution The table above shows that the company s tax rate has varied from almost 9% to just over 14%. I have therefore decided to perform an analysis based on future tax rates between 5-20%, to see how this affects the company s estimated share price. This will be done in the following. Table Sensitivity analysis on marginal tax rate NOK Marginal tax rate 0 % 5 % 10 % 15 % 20 % Implied WACC 9,00 % 8,92 % 8,82 % 8,73 % 8,63 % Price per share 38,4 37,3 36,4 35,4 34,4 Source: Own contribution As expected, a marginal tax rate larger than zero, will decrease Prosafe Production s estimated share price. As long as the company s vessels are under operational activity, the company is most likely to pay taxes in the future. Based on the sensitivity analysis above, I consider a marginal tax rate equal to 15% to be reasonable when estimating the company s fair value, and this implies a WACC equal to 8,73%. This marginal tax rate will reflect the higher operational activity that the company will experience from 2009 and onwards. I therefore conclude that the fair value of Prosafe Production s shares should be NOK 35,4. 68
69 7 Conclusion The main purpose of this thesis was to analyse Prosafe Production and the FPSO industry in order to determine the fair value of the company s equity on August 22 nd This analysis has been based on a fundamental analysis; where the valuation is build on a strategic analysis as well as financial statement analysis. Prosafe Production was split from Prosafe SE in May 2008, and was listed on Oslo Stock Exchange June 2 nd the same year. The company operates in the floating production industry, where the company s core business is the design, engineering, conversion and operation of FPSO/FSO vessels. The floating production industry has experienced significant growth in recent years. This is due to new oil fields moving into deeper waters and more distant locations. Furthermore, the current up-cycle of the industry has led to E&P investments in smaller oil fields with no infrastructure, creating high demand for floating production units. FPSOs has become the preferred solution of floaters as a result of the FPSOs being a relatively cheap and versatile production unit, well suited for the oil fields currently being explored. The PESTE analysis uncovered that economical and political factors are likely to influence the FPSO industry the most. The oil industry is highly affected by future oil prices, thus influencing the demand for FPSO units to a high degree. Increasing oil prices give incentives for oil companies to explore new oil fields as well as continuing operations on marginal fields. This in turn will drive demand for floating production units. Furthermore, political authorities have in recent years focused on environmental issues. The United Nations Framework Convention on Climate Changes and the Kyoto Protocol are two treaties established in order to reduce future CO 2 emissions Together with legal rules, this can influence the oil industry negatively in the future. Due to the current up-cycle in the oil industry, the FPSO industry has seen a large number of newcomers in recent years. High dayrates and large potential profit have increased the competiveness in the industry. However, this is likely to diminish in the future. The industry currently has several natural barriers of entry. The industry is experiencing lack of qualified and experienced personnel. The growth in the oil industry has led to capacity problems at 69
70 the yards making future conversion projects difficult. Furthermore, the current financial crisis will reduce available capital, thus limiting further investments. However, Prosafe Production is well positioned in the industry to grow further. The company is seen as an attractive player in the FPSO industry with its proven track record and strong relationship with customers and suppliers, along with the company s in-house developed technology. The company currently has a strong contract backlog, and is fully financed to take up new projects. The strategic analysis has together with the financial statement analysis been the basis for forecasting future financial statements. Historically, the company s performance has not been very impressive regarding ROIC, which has been lower than the estimated WACC. This is, however, expected to improve as ROIC is estimated to increase in the future. Since Prosafe Production has several long-term contracts, future operating revenues has mainly been forecasted using the company s existing average dayrates. Other items in the income statement are mainly forecasted using ratios out of operating revenues. As a result, the income statements in the explicit period will be relatively stable. Prosafe Production s fair value of equity was estimated to be USD 1825,7 millions on August 22 nd 2008 assuming a marginal tax rate equal to zero. This corresponds to a price per share of NOK 38,4. However, this share price is likely to have been overestimated as the company most certainly will pay taxes in the future. The adjusted fair value of equity was therefore estimated to be USD 1681,0 millions assuming a 15% tax level, which corresponds to a share price of NOK 35,4. The share price at Oslo Stock Exchange the same day was NOK 24,4. Based on my analysis I conclude that the company s share price is undervalued by NOK
71 8 Bibliography Literature Brealy, R.A. & Myers, S.C. & Allen, F. (2006), Corporate Finance, 8 th ed. New York: McGraw-Hill Copeland, T. & Koller, T. & Murrin, J. (2000), Valuation, Measuring and managing the value of companies, 3 rd ed. New York: John Wiley and Sons, Inc Elton, E. J. & Gruber, M. J. & Brown, S. J. & Goetzmann, W. N. (2003), Modern portfolio theory and investment analysis, 6 th ed. New York: John Wiley and Sons, Inc Koller, T. & Goedhart, M. & Wessels, D. (2005), Valuation, Measuring and managing the value of companies, 4 th ed. New Jersey: John Wiley and Sons, Inc Petersen, C. V. & Plenborg, T. (2007), Regnskabsanalyse for beslutningstagere, 2 nd ed. Copenhagen: Forlaget Thomson A/S Rådgivningsudvalget (2002), Fagligt notat om den statsautoriserede revisors arbejde i forbindelse med værdiansættelse af virksomheder og virksomhedsandele, Viborg: Nørhaven Book Articles China Daily (2008), High oil prices add uncertainty to future world economy Dagens Næringsliv (2007), Spår tre gullår for Prosafe Deloitte (2008), Cyprus International tax and Business Environment International Energy Agency (2004), Analysis of the impact of high oil prices on the global economy International Maritime Associates, Inc (2008), Growth of Floating Production Systems Accelerates Porter, M. (1980), Competitive Strategy, Free Press, New York Internet
72 Reports Energy Information Agency (2008), Short-term Energy Outlook July 2008 Energy Information Agency (2007), International Energy Outlook 2008 European Renewable Energy Council & Greenpeace (2007), Energy revolution Prosafe SE (2008), Annual report 2007 Prosafe Production (2008), Audited financial report as per 14 May 2008 Prosafe Production (2008), Condensed Interim Financial Statement, Quarter ended June 30, 2008 Presentations Pareto Securities (2008), Prospectus Prosafe Production Prosafe Production (2008) Q1 08 presentation Analysis Arctic Securities (2007), Initiating FPSO sector coverage Carnegie Securities (2008), Prosafe Production initiating coverage Pareto Securities (2008), Prosafe Production initiating coverage 72


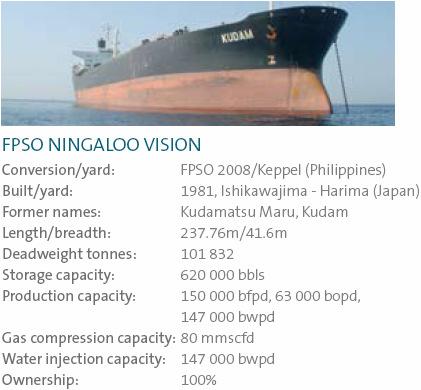

73 9 Appendices Appendix Fleet overview Source: Prosafe SE Annual report


74 1.2 Contract status Source: Prosafe Production, Q1 08 presentation. 1.3 Overview of current operations Source: Prosafe Production, Q1 08 presentation. 74
Oslo, 10 September Pareto Securities Oil and Offshore Conference Karl Ronny Klungtvedt, Exec. VP & CFO
 Oslo, 10 September 2008 Pareto Securities Oil and Offshore Conference Karl Ronny Klungtvedt, Exec. VP & CFO 2 Disclaimer All statements in this presentation other than statements of historical fact are
Prosafe Q results
 Prosafe Q1 2008 results 2 Disclaimer All statements in this presentation other than statements of historical fact are forward-looking statements, which are subject to a number of risks, uncertainties,
Oslo, 6th March DnB NOR Markets Offshore Management Access Conference Karl Ronny Klungtvedt, Exec. Vice President & CFO
 Oslo, 6th March 2008 DnB NOR Markets Offshore Management Access Conference Karl Ronny Klungtvedt, Exec. Vice President & CFO 2 Disclaimer All statements in this presentation other than statements of historical
Presentation of 2nd quarter 2005 Oslo, 5 August 2005
 Presentation of 2nd quarter 2005 Oslo, 5 August 2005 Agenda The quarter in brief Financial result for 2nd quarter 2005 Business divisions status, strategy and outlook Summary 2 Q2 2005 in brief - financial
FIRST QUARTER Financials. Outlook. Dividend and refinancing
 FIRST QUARTER 2011 Financials (Figures in brackets refer to the corresponding period of 2010) Operating profit for the first quarter came to USD 14.1 million (USD 40 million). Utilisation of the rigs declined
Teekay Offshore Partners Investor Day Presentation. June 18, 2012
 Teekay Offshore Partners Investor Day Presentation June 18, 2012 Forward Looking Statements This presentation contains forward-looking statements (as defined in Section 21E of the Securities Exchange Act
2 November Q results
 2 November 2011 Q3 2011 results 2 Disclaimer All statements in this presentation other than statements of historical fact are forward-looking statements, which are subject to a number of risks, uncertainties,
LAMPRELL Analyst Presentation Site Visit, 22 November 2006
 LAMPRELL Analyst Presentation Site Visit, 22 November 2006 I. OVERVIEW OF LAMPRELL 2 Overview of Lamprell A leading jackup rig refurbisher in the Arabian Gulf with a significant share of the market in
Oslo, 8 August Second quarter 2007 results
 Oslo, 8 August 2007 Second quarter 2007 results 2 Disclaimer All statements in this presentation other than statements of historical fact are forward-looking statements, which are subject to a number of
4 September Pareto Oil & Offshore Conference
 4 September 2013 Pareto Oil & Offshore Conference Disclaimer All statements in this presentation other than statements of historical fact are forward-looking statements, which are subject to a number of
FOURTH QUARTER Recent highlights
 FOURTH QUARTER 2018 (Figures in brackets refer to the corresponding period of 2017) In the fourth quarter, the fleet utilisation 1 reached its highest since Q3 2015 at 63 per cent. A further two contracts
5 March Company Presentation
 5 March 2013 Company Presentation Disclaimer All statements in this presentation other than statements of historical fact are forward-looking statements, which are subject to a number of risks, uncertainties,
Ship Finance International Limited (NYSE: SFL) - Earnings Release. Reports preliminary Q results and quarterly cash dividend of $0.
 - Earnings Release. Reports preliminary Q results and quarterly cash dividend of $0.") Ship Finance International Limited (NYSE: SFL) - Earnings Release Reports preliminary Q3 2018 results and quarterly cash dividend of $0.35 per share Hamilton, Bermuda, November 20, 2018. Ship Finance International
Ship Finance International Limited (NYSE: SFL) - Earnings Release Reports preliminary Q3 2018 results and quarterly cash dividend of $0.35 per share Hamilton, Bermuda, November 20, 2018. Ship Finance International
Agenda. Introduction. Operations. Outlook. Attachments
 May 2012 Disclaimer All statements in this presentation other than statements of historical fact are forward-looking statements, which are subject to a number of risks, uncertainties, and assumptions that
Pareto Securities Oil & Offshore Conference
 Pareto Securities Oil & Offshore Conference September 2-3, 2015 Oslo, Norway www.paragonoffshore.com Safe Harbor Statement This material contains statements that are forward looking statements about Paragon
Rogaland på Børs, Stavanger. CFO Esa Ikaheimonen September 7 th, 2011
 Rogaland på Børs, Stavanger CFO Esa Ikaheimonen September 7 th, 2011 Contents Seadrill Company update Market outlook Value creation North Atlantic Drilling Company update Market outlook Value creation
Sevan Marine ASA. Results. First Half Oslo, August 19, Carl Lieungh, CEO. Reese McNeel, CFO. Page 1
 Sevan Marine ASA Results First Half 2015 Oslo, August 19, 2015 Carl Lieungh, CEO Reese McNeel, CFO Page 1 Important information This presentation and its enclosures and appendices (hereinafter jointly
Oslo, 11 May First quarter 2007 results
 Oslo, 11 May 2007 First quarter 2007 results 2 Disclaimer All statements in this presentation other than statements of historical fact are forward-looking statements, which are subject to a number of risks,
SEACOR Marine Announces Second Quarter 2018 Results
 August 9, 2018 SEACOR Marine Announces Second Quarter 2018 Results Continued Improvement in Operating Performance Strengthened Balance Sheet HOUMA, La.--(BUSINESS WIRE)-- SEACOR Marine Holdings Inc. (NYSE:SMHI)
Øystein Olsen: The economic outlook
 Øystein Olsen: The economic outlook Address by Mr Øystein Olsen, Governor of Norges Bank (Central Bank of Norway), to invited foreign embassy representatives, Oslo, 29 March 2011. The address is based
CIF Stock Recommendation Report (Spring 2013)
") Date: February 6, 2013 Analyst Name: Matt Leid CIF Stock Recommendation Report (Spring 2013) Section (A) Summary Company Name and Ticker: Noble Corporation (NE) Recommendation Buy: Yes No Target Price:
Date: February 6, 2013 Analyst Name: Matt Leid CIF Stock Recommendation Report (Spring 2013) Section (A) Summary Company Name and Ticker: Noble Corporation (NE) Recommendation Buy: Yes No Target Price:
Agenda. Accommodation rig market. Operations. Financial position and dividend. Summary. Attachments. Supply/demand outlook.
 March 2011 2 Disclaimer All statements in this presentation other than statements of historical fact are forward-looking statements, which are subject to a number of risks, uncertainties, and assumptions
SEACOR MARINE ANNOUNCES RESULTS FOR ITS FOURTH QUARTER AND YEAR ENDED DECEMBER 31, 2017
 PRESS RELEASE SEACOR MARINE ANNOUNCES RESULTS FOR ITS FOURTH QUARTER AND YEAR ENDED DECEMBER 31, Houma, Louisiana March 22, 2018 FOR IMMEDIATE RELEASE - SEACOR Marine Holdings Inc. (NYSE:SMHI) (the Company
2nd quarter and 1st half
 Report for Global Rig Company ASA 2nd quarter and 1st half 2009 www.globalrig.no Highlights 2nd quarter and 1st half 2009 Rig count cautiously increasing after months of reduced activity Low utilization
17 February Q results
 17 February 2011 Q4 2010 results 2 Disclaimer All statements in this presentation other than statements of historical fact are forward-looking statements, which are subject to a number of risks, uncertainties,
ONEOK Partners, L.P. ONEOK Partners, L.P. (NYSE:OKS) Applied Portfolio Management. Investment Thesis. Segments Breakdown 5/5/2015
 Applied Portfolio Management. Investment Thesis. Segments Breakdown 5/5/2015") ONEOK Partners, L.P. (NYSE:OKS) ONEOK Partners, L.P. Applied Portfolio Management Publicly traded partnership formed in 1993 o Headquarters: Tulsa, Oklahoma A leading transporter of natural gas and natural
ONEOK Partners, L.P. (NYSE:OKS) ONEOK Partners, L.P. Applied Portfolio Management Publicly traded partnership formed in 1993 o Headquarters: Tulsa, Oklahoma A leading transporter of natural gas and natural
Pareto Securities 23rd Annual Oil & Offshore Conference
 Pareto Securities 23rd Annual Oil & Offshore Conference September 14-15, 2016 Oslo, Norway www.paragonoffshore.com Safe Harbor Statement This material contains statements that are forward looking statements
Contents. Company overview. Market outlook. Contract status. Operations. Summary. Attachments
 November 2009 2 Disclaimer All statements in this presentation other than statements of historical fact are forward-looking statements, which are subject to a number of risks, uncertainties, and assumptions
February Q results
 February 2010 Q4 2009 results 2 Disclaimer All statements in this presentation other than statements of historical fact are forward-looking statements, which are subject to a number of risks, uncertainties,
7 November Q results
 7 November 2013 Q3 2013 results Disclaimer All statements in this presentation other than statements of historical fact are forward-looking statements, which are subject to a number of risks, uncertainties,
LA Energy Conference. New Orleans, LA - June 11, Todd M. Hornbeck Chairman, President & CEO
 LA Energy Conference New Orleans, LA - June 11, 2014 Todd M. Hornbeck Chairman, President & CEO Forward-Looking Statements This Presentation contains forward-looking statements, as contemplated by the
UConn Student Managed Fund Team Gilson
 2017 2018 UConn Student Managed Fund Team Gilson Shawn McAuley & Ana Walas Table of Contents Table of Contents Investment Highlights. 3 Basis for Recommendation Business Description 3 Business Overview
The AIR U.S. Hurricane
 The AIR U.S. Hurricane Model for Offshore Assets The Gulf of Mexico contains thousands of platforms and rigs of various designs that produce 1.4 million barrels of oil and 8 billion cubic feet of gas per
SECOND QUARTER AND FIRST HALF REPORT Financials. New builds and projects
 SECOND QUARTER AND FIRST HALF REPORT 2014 Financials (Figures in brackets refer to the corresponding period of 2013) Second quarter Utilisation of the vessel fleet was 84 per cent (84 per cent) in the
Investor Presentation. March 2015
 Investor Presentation March 2015 1 Forward-Looking Statements Statements contained in this presentation that are not historical facts are forward-looking statements within the meaning of Section 27A of
Agenda. Prosafe introduction. Operations. Outlook
 12 September 2012 Disclaimer All statements in this presentation other than statements of historical fact are forward-looking statements, which are subject to a number of risks, uncertainties, and assumptions
March 22, ST ANNUAL MARINE/OFFSHORE INDUSTRY OUTLOOK CONFERENCE. John Gellert, President and CEO
 March 22, 2018 41 ST ANNUAL MARINE/OFFSHORE INDUSTRY OUTLOOK CONFERENCE John Gellert, President and CEO 1 Forward-Looking Statement Certain statements discussed in this presentation as well as in other
Conference Call 3Q 2013 results. November 25, 2013
 Conference Call 3Q 2013 results November 25, 2013 Forward Looking Statements The statements described in this presentation that are not historical facts are forward-looking statements within the meaning
EXMAR GENERAL ASSEMBLY 15 th May 2018
 EXMAR GENERAL ASSEMBLY 15 th May 2018 2 DISCLAIMER About this presentation This presentation (the Presentation ) has been produced by EXMAR NV ( EXMAR or the Company ). By attending a meeting where this
The lower rig building turnover was however partially offset by higher contributions from the ship. conversion/offshore and ship repair sectors which
 Company Registration Number: 19639Z PRESS RELEASE 1H 211 NET PROFIT AT $3.4 MILLION Singapore, August 2, 211: Sembcorp Marine achieved a net profit of $3.4 million for the half year ended 3 June 211. This
TEEKAY SHIPPING CORPORATION Bayside House, Bayside Executive Park, West Bay Street & Blake Road P.O. Box AP-59212, Nassau, Bahamas EARNINGS RELEASE
 Bayside House, Bayside Executive Park, West Bay Street & Blake Road P.O. Box AP-59212, Nassau, Bahamas EARNINGS RELEASE TEEKAY REPORTS FOURTH QUARTER AND ANNUAL RESULTS Highlights Reported fourth quarter
SECOND QUARTER AND FIRST HALF REPORT 2018
 SECOND QUARTER AND FIRST HALF REPORT 2018 EBITDA for the second quarter amounted to USD 57.1 million (USD 26.4 million). Higher EBITDA is mainly due to better utilisation, higher average day rates, cost
NOT FOR DISTRIBUTION IN THE US, CANADA OR JAPAN FOR IMMEDIATE RELEASE 3 FEBRUARY 1998
 NOT FOR DISTRIBUTION IN THE US, CANADA OR JAPAN FOR IMMEDIATE RELEASE 3 FEBRUARY 1998 SAIPEM ANNOUNCES 1997 RESULTS Today, the Board of Directors of Saipem S.p.A., the leading Italian oilfield services
NORTHERN DRILLING LTD.
 RESULTS FOR THE SECOND QUARTER AND SIX MONTHS ENDED JUNE 30, 2018 Highlights In May 2018, the Company acquired two 7th generation ultra deepwater capable drillships currently under construction at Daewoo
8 Economic considerations, deliveries and employment
 8 Economic considerations, deliveries and employment The following are the most important issues in the socio-economic impact assessment for the Ivar Aasen field project: What socio-economic profitability
Report Q Export Credit Norway
 Report Q1 218 Export Credit Norway Q1 218 High market activity increased application inflow In the first quarter of the year, Export Credit Norway received 99 financing representing a total application
THIRD QUARTER a one-month option, and is scheduled to commence mid-may 2019 following the completion of the Johan Sverdrup contract.
 THIRD QUARTER 2018 (Figures in brackets refer to the corresponding period of 2017) In the third quarter, Prosafe finalised the transforming agreements with COSCO and its lenders, secured several contracts
TEEKAY SHIPPING CORPORATION TK House, Bayside Executive Park, West Bay Street & Blake Road P.O. Box AP-59212, Nassau, Bahamas EARNINGS RELEASE
 TEEKAY SHIPPING CORPORATION TK House, Bayside Executive Park, West Bay Street & Blake Road P.O. Box AP-59212, Nassau, Bahamas EARNINGS RELEASE 2nd Quarter Highlights TEEKAY SHIPPING CORPORATION REPORTS
EARNINGS RELEASE TEEKAY OFFSHORE PARTNERS REPORTS SECOND QUARTER RESULTS
 4 th Floor, Belvedere Building, 69 Pitts Bay Road, Hamilton, HM 08, Bermuda EARNINGS RELEASE TEEKAY OFFSHORE PARTNERS REPORTS SECOND QUARTER RESULTS Highlights Generated distributable cash flow (1) of
CMD FINANCE NORWAY CMD
 Q4 CMD FINANCE NORWAY CMD LONDON, 10. MARCH 2016 CFO BJØRN ERIK NÆSS DNB has delivered strong profit growth Net interest income NOK million Pre-tax operating profit before impairment NOK million 25 252
25 May Q results
 25 May 2011 Q1 2011 results 2 Disclaimer All statements in this presentation other than statements of historical fact are forward-looking statements, which are subject to a number of risks, uncertainties,
Borr Drilling Limited (BDRILL) Announces First Quarter 2018 Results
 Announces First Quarter 2018 Results") Borr Drilling Limited (BDRILL) Announces First Quarter 2018 Results Hamilton, Bermuda, May 31, 2018: Borr Drilling Limited ( Borr, Borr Drilling or the Company ) announces results for the first quarter
Borr Drilling Limited (BDRILL) Announces First Quarter 2018 Results Hamilton, Bermuda, May 31, 2018: Borr Drilling Limited ( Borr, Borr Drilling or the Company ) announces results for the first quarter
Saipem PRESS RELEASE 30 TH JULY 2003 SECOND QUARTER REPORT AT 30 TH JUNE 2003
 PRESS RELEASE 30 TH JULY 2003 SECOND QUARTER REPORT AT 30 TH JUNE 2003 Today, the Board of Directors of S.p.A. has reviewed the Group consolidated financial statements at 30 th June 2003 (not subject to
Svein Gjedrem: The outlook for the Norwegian economy
 Svein Gjedrem: The outlook for the Norwegian economy Address by Mr Svein Gjedrem, Governor of Norges Bank (Central Bank of Norway), at the Bergen Chamber of Commerce and Industry, Bergen, 11 April 2007.
Industry Consolidations Financing Alternatives for Acquisition-Driven Companies
 Financing Alternatives for Acquisition-Driven Companies Charles A Sheffield President, Sheffield Capital Advisors This article focuses on the trends and financing opportunities for clients who are pursuing
29 th WLPGA Forum : Future Market Outlook. Florence, Italy 16 November 2016
 29 th WLPGA Forum : Future Market Outlook Florence, Italy 16 November 2016 Forwardlooking Statements This presentation has been produced by BW LPG Limited ( BW LPG ) exclusively for information purposes.
Bond Investor Presentation
 Bond Investor Presentation Oslo 10 th March 2014 Strategic background Market development Financial status 2 Viking Supply Ships in short Kistefos Christen Sveaas has through his fully owned investment
Nordic Energy Summit. Oslo, 18 March August 2013
 Nordic Energy Summit Oslo, 18 March 2014 26 August 2013 Disclaimer This presentation (the Presentation ) has been produced by Songa Offshore SE ("Songa" or the "Company") exclusively for information purposes.
Industry Consolidations Recognizing Banking Opportunities in Acquisition- Driven Companies
 Industry Consolidations Recognizing Banking Opportunities in Acquisition- Driven Companies Business strategy is a key driver of client needs and customized banking solutions. There are many tools and techniques
Saipem: Board of Directors approves Interim Report as at March 31, 2011 IMPROVED RESULTS VERSUS Q1 2010
 Interim Report at March 31, 2011 Saipem: Board of Directors approves Interim Report as at March 31, 2011 IMPROVED RESULTS VERSUS Revenues amounted to Euro 2,954 million: +11.9% compared to the first quarter.
The Great Eastern Shipping Company Ltd. A Review of Financial Year
 The Great Eastern Shipping Company Ltd. A Review of Financial Year 04 April 30, 2004 Forward Looking Statement This presentation contains certain forward looking information through statements, which are
TGS - Nordic IR Conference
 TGS - Nordic IR Conference Consistent approach - in a favorable environment Copenhagen 20 September 2012 Content Introduction to the oil services industry and TGS Our approach to investor relations Challenges
Global Resources Fund (PSPFX)
") Global Resources Fund (PSPFX) Global Resources are the building blocks of the world we live in. As the world s population grows and emerging regions develop a more vibrant infrastructure for commerce,
Global Resources Fund (PSPFX) Global Resources are the building blocks of the world we live in. As the world s population grows and emerging regions develop a more vibrant infrastructure for commerce,
First-quarter results 2014
 1Q First-quarter results 2014 April 30, 2014 2014 Aker Solutions www.akersolutions.com Financial highlights First-quarter Revenue (NOK million) 10,312 11,229 results 2014 1Q 2013 2Q 2013 3Q 2013 4Q 2013
OFFSHORE PARTNERS FOURTH QUARTER 2014 EARNINGS PRESENTATION
 TEEKAY Photo Credit: John Mikal Torgersen TEEKAY OFFSHORE PARTNERS FOURTH QUARTER 2014 EARNINGS PRESENTATION February 20, 2015 Forward Looking Statements This presentation contains forward-looking statements
Investor Presentation. April 2015
 Investor Presentation April 2015 1 Forward-Looking Statements Statements contained in this presentation that are not historical facts are forward-looking statements within the meaning of Section 27A of
SONGA OFFSHORE ASA - REPORT FOR THE FOURTH QUARTER 2006
 SONGA OFFSHORE ASA - REPORT FOR THE FOURTH QUARTER 2006 Songa Offshore ASA consolidated after tax profit for the fourth quarter 2006 was USD 3.7 million. Accumulated loss for 2006 was USD 20.7 million.
Howard Weil Conference Presentation. March 2015
 Howard Weil Conference Presentation March 2015 1 Forward-Looking Statements Statements contained in this presentation that are not historical facts are forward-looking statements within the meaning of
SBM OFFSHORE N.V. KEMPEN BENELUX CONFERENCE - LONDON
 SBM OFFSHORE N.V. KEMPEN BENELUX CONFERENCE - LONDON 24 November 2010 Disclaimer Some of the statements contained in this presentation that are not historical facts are statements of future expectations
Sevan Marine ASA. Results. Second Quarter Oslo, August 25, Carl Lieungh, CEO. Reese McNeel, CFO. Page 1
 Sevan Marine ASA Results Second Quarter 2016 Oslo, August 25, 2016 Carl Lieungh, CEO Reese McNeel, CFO Page 1 Important information This presentation and its enclosures and appendices (hereinafter jointly
NORTH ATLANTIC DRILLING LTD. Pareto Oil & Offshore Service Conference, Oslo CFO Esa Ikaheimonen August 31, 2011
 NORTH ATLANTIC DRILLING LTD Pareto Oil & Offshore Service Conference, Oslo CFO Esa Ikaheimonen August 31, 2011 Forward-looking statements The statements described in this presentation that are not historical
ANALYSTS PRESENTATION March 11, T. Mace, CEO and M. Miles, CFO
 ANALYSTS PRESENTATION March 11, 2009 T. Mace, CEO and M. Miles, CFO DISCLAIMER Some of the statements contained in this presentation that are not historical facts are statements of future expectations
POST-CRISIS GLOBAL REBALANCING CONFERENCE ON GLOBALIZATION AND THE LAW OF THE SEA WASHINGTON DC, DEC 1-3, Barry Bosworth
 POST-CRISIS GLOBAL REBALANCING CONFERENCE ON GLOBALIZATION AND THE LAW OF THE SEA WASHINGTON DC, DEC 1-3, 2010 Barry Bosworth I. Economic Rise of Asia Emerging economies of Asia have performed extremely
NOTICE OF EXTRAORDINARY SHAREHOLDERS MEETING OF PROSAFE ASA
 NOTICE OF EXTRAORDINARY SHAREHOLDERS MEETING OF PROSAFE ASA NOTICE IS HEREBY GIVEN that an extraordinary shareholders' meeting of Prosafe ASA will be held on 31 May 2006 at 2:00 p.m. at the company's premises
SBM OFFSHORE Q TRADING UPDATE FULL YEAR OUTLOOK CONFIRMED
 Press release - SBM Offshore N.V. 10 November 2010 Highlights SBM OFFSHORE Q3 2010 TRADING UPDATE FULL YEAR OUTLOOK CONFIRMED Turnover for the first nine months of 2010 at US$ 2,180 million, 2.5% above
SEB Nordic Seminar CFO - Rune Magnus Lundetrae Copenhagen, January 2014
 SEB Nordic Seminar CFO - Rune Magnus Lundetrae Copenhagen, January 2014 Forward Looking Statements The statements described in this presentation that are not historical facts are forward-looking statements
Swiber Holdings Limited
 Swiber Holdings Limited Corporate Presentation 23 November 2006 A niche service provider to the offshore oil and gas industry Forward Looking Statements Important Note The following presentation contain
19.2 Exchange Rates in the Long Run Introduction 1/24/2013. Exchange Rates and International Finance. The Nominal Exchange Rate
 Chapter 19 Exchange Rates and International Finance By Charles I. Jones International trade of goods and services exceeds 20 percent of GDP in most countries. Media Slides Created By Dave Brown Penn State
projects, the number of projects that achieved initial recognition, the design of the rig building projects.
 Company Registration Number: 196398Z PRESS RELEASE 2 NET PROFIT AT $143 MILLION Singapore, August 2, 2: Sembcorp Marine achieved a net profit of $143 million for 2. This was 5% lower as compared with $15
Investor Presentation June 24, 2016
 Investor Presentation June 24, 2016 1 Forward-Looking Statements Statements herein that are not historical facts are forward looking statements within the meaning of the Private Securities Litigation Reform
Investor Presentation December 2015
 Investor Presentation December 2015 1 Forward-Looking Statements Statements herein that are not historical facts are forward looking statements within the meaning of the Private Securities Litigation Reform
Highlights. from the same. period of the prior year. respectively. newbuildings. On October 18, costs and. Petrobras.
 TEEKAY OFFSHORE PARTNERS L.P. 4 th Floor, Belvederee Building, 69 Pitts Bayy Road, Hamilton, HM 08, Bermuda EARNINGS RELEASE TEEKAY OFFSHORE PARTNERS REPORTS THIRD QUARTER RESULTS Highlights Generated
TEEKAY SHIPPING CORPORATION TK House, Bayside Executive Park, West Bay Street & Blake Road P.O. Box AP-59212, Nassau, Bahamas EARNINGS RELEASE
 TK House, Bayside Executive Park, West Bay Street & Blake Road P.O. Box AP-59212, Nassau, Bahamas EARNINGS RELEASE TEEKAY REPORTS RECORD FOURTH QUARTER AND ANNUAL EARNINGS Highlights Highest ever fourth
Pareto Oil and Offshore Conference CEO Ivar Brandvold
 Pareto Oil and Offshore Conference 2017 CEO Ivar Brandvold Disclaimer This presentation has been produced by Fred. Olsen Energy ASA (the "Company") based on information which is publicly available. This
Havila Shipping ASA Presentation 4th Quarter 2006 Preliminary results 2006 »news»results»company»fleet»market
 Havila Shipping ASA Presentation 4th Quarter 2006 Preliminary results 2006»news»results»company»fleet»market Latest news 23/2-06: Purchase of parts in Havila Saturn Havila Shipping ASA has purchased a
PROPOSED RENOUNCEABLE NON-UNDERWRITTEN RIGHTS ISSUE TO RAISE GROSS PROCEEDS OF US$100.5 MILLION
 NOT FOR RELEASE, PUBLICATION OR DISTRIBUTION, DIRECTLY OR INDIRECTLY, IN OR INTO THE UNITED STATES. THE MATERIAL SET OUT HEREIN IS NOT INTENDED, AND SHOULD NOT BE CONSTRUED, AS AN OFFER FOR SALE OF THE
Acquisition of Ferguson Group. 9 September 2014
 Acquisition of Ferguson Group 9 September 2014 Strategic highlights Continuing our expansion in specialist containers Ferguson Group is a leading provider of container solutions (mostly cargocarrying units)
PART C STATUS OF DEVELOPMENT AND EXPLORATION ACTIVITIES
 PART C STATUS OF DEVELOPMENT AND EXPLORATION ACTIVITIES 1. EXPLORATION ACTIVITIES UNDER THE LIME GROUP 1.1 Lime Group Structure Hibiscus Petroleum Berhad RAK Offshore Dahan Petroleum Ltd 59 % Schroder
Chris Beckett CEO, Pacific Drilling 40 th Annual Marine/Offshore Industry Outlook Conference. March 30, 2017
 Chris Beckett CEO, Pacific Drilling 4 th Annual Marine/Offshore Industry Outlook Conference March 3, 217 Forward Looking Statements Certain statements and information contained in this presentation constitute
Exmar CPS Conference January 2019 London
 Exmar CPS Conference January 2019 London 2 DISCLAIMER About this presentation This presentation (the Presentation ) has been produced by EXMAR NV ( EXMAR or the Company ). By attending a meeting where
INVESTMENT APPROACH & PHILOSOPHY
 INVESTMENT APPROACH & PHILOSOPHY INVESTMENT APPROACH & PHILOSOPHY - Equities 2. Invest regularly 1. Invest early 3. Stay Invested Research: We receive in-depth research on companies and the macro environment
29 November Copenhagen Winter Seminar, Danske Bank Markets
 29 November 2012 Copenhagen Winter Seminar, Danske Bank Markets Disclaimer All statements in this presentation other than statements of historical fact are forward-looking statements, which are subject
lower margin from new rig building projects of repeated designs in 1Q 2011.
 Company Registration Number: 196398Z PRESS RELEASE 212 NET PROFIT AT $3 MILLION Singapore, May 9, 212: Sembcorp Marine recorded a net profit of $3 million in 212. This was lower than the $151 million achieved
NORTHERN DRILLING LTD
 NORTHERN DRILLING LTD INTERIM FINANCIAL INFORMATION AS OF SEPTEMBER 30, Highlights from Incorporation to September 30 Acquired one high specification semi-submersible harsh environment rig currently under
Rig Market Regional Challenges from a Risk Managers perspective. Svein Bergstad Director of Risk & Insurance 24 October 2013
 Rig Market Regional Challenges from a Risk Managers perspective Svein Bergstad Director of Risk & Insurance 24 October 2013 Content Who is Seadrill? Rig market Insurance challenges and compliance 2 Seadrill
Songa Offshore SE ( Songa ) total comprehensive income for the fourth quarter 2009 was USD 54.7 million.
 total comprehensive income for the fourth quarter 2009 was USD 54.7 million.") REPORT FOR THE FOURTH QUARTER 2009 Songa Offshore SE ( Songa ) total comprehensive income for the fourth quarter 2009 was USD 54.7 million. Revenue for the fourth quarter was USD 186.8 million. This includes
REPORT FOR THE FOURTH QUARTER 2009 Songa Offshore SE ( Songa ) total comprehensive income for the fourth quarter 2009 was USD 54.7 million. Revenue for the fourth quarter was USD 186.8 million. This includes
Svein Gjedrem: The outlook for the Norwegian economy and monetary policy assessments
 Svein Gjedrem: The outlook for the Norwegian economy and monetary policy assessments Speech by Mr Svein Gjedrem, Governor of Norges Bank (Central Bank of Norway), at a presentation of the Monetary Policy
Agenda. Introduction. Outlook. Debt and dividend. Operations in Brazil. Upgrades and capex
 June 2011 2 Disclaimer All statements in this presentation other than statements of historical fact are forward-looking statements, which are subject to a number of risks, uncertainties, and assumptions
Helmerich & Payne, Inc.
 Helmerich & Payne, Inc. Lehman Brothers CEO Energy/Power Conference September 7, 2006 Investor Relations Contacts: Doug Fears CFO, 918.588.5208, doug.fears@hpinc.com Juan Pablo Tardio Manager, Investor
HSC Economics. Year 2014 Mark Pages 13 Published Feb 9, 2017 HSC ECONOMICS: THE GLOBAL ECONOMY. By Sahar (99.1 ATAR)
") HSC Economics Year 2014 Mark 95.00 Pages 13 Published Feb 9, 2017 HSC ECONOMICS: THE GLOBAL ECONOMY By Sahar (99.1 ATAR) Powered by TCPDF (www.tcpdf.org) Your notes author, Sahar. Sahar achieved an ATAR
HSC Economics Year 2014 Mark 95.00 Pages 13 Published Feb 9, 2017 HSC ECONOMICS: THE GLOBAL ECONOMY By Sahar (99.1 ATAR) Powered by TCPDF (www.tcpdf.org) Your notes author, Sahar. Sahar achieved an ATAR