On the growth path 7-8th August 2006
|
|
|
- William Joseph
- 6 years ago
- Views:
Transcription


1 On the growth path 7-8 th August
2 Table of contents India - Economic overview The Tata Group - overview Tata Chemicals - Business overview Segment overview Chemicals, including overview of Brunner Mond Fertilisers Financial overview 2
3 India - Economic overview 3
4 India poised for strong economic growth... World s 4 th largest economy (PPP), GDP FY07 : 7.6% (Est.) Net FII investment in FY06 crossed US$9.9 bn (14% up PY) Consumptions accounts for 64% of GDP Rapidly growing middle class of about 200mn people with significant spending power Infrastructure investments to grow at 15% CAGR Favourable demographics 4
5 The Tata group - overview 5
6 Tata Group India s largest and the most respected business group Market cap 1 : US$49bn Revenues 2 : US$22bn Materials Sales:21% IT and Communications Sales:19% Engineering Sales:31% Services Sales:10% PAT 2 : US$2 billion Consumer Products Sales:6% Energy Sales:8% Chemicals and Fertilisers Sales:5% Notes 1 Market cap (approx.) as on March 31, F.Y data 6


7 Tata Chemicals - Business overview 7
8 Tata Chemicals is The 3rd largest soda ash manufacturer in the world The #1 soda ash player in India A market leader in edible salt market, largest STPP player in the country The most energy efficient urea fertiliser manufacturer in India and amongst the most efficient globally 1/3 rd stake holder in IMACID, Morroco assured supply of key inputs A true partner of the farmer with a presence in all 3 agri inputs categories as well as an expanding number of Tata Kisan Sansars 8
9 FY Global Footprints UK Netherlands Morocco Kenya India South Africa Manufacturing locations Markets 9
10 At a glance Listing: and Stock Exchange, Mumbai (BSE) National Stock Exchange (NSE) Sales break-up FY2006 Ticker: TTCH IN Founded: 1939 Market Capitalization Revenue 3 (US$mm): 795 EBITDA 3 (US$mm): 131 EBITDA Margin 3 : 17% Employees: 3,500 US$ 915mm Ownership: Sponsor Group 28.6 % Institutional Investors 42.4 % Indian Public 29.0 % Urea 20% Soda Ash 20% Phosphatic Fertilisers 39% Salt 9% Cement 4% STPP 2% Others 6% Note: 1: Market data per Telerate as on July 28, 2006, 2: INR/USD Conversion rate of : F.Y 2006 data, INR/USD Conversion rate of
11 Tata Chemicals, yesterday Localised operations, No 13 in Soda Ash capacity Asset heavy High exposure to single customer segment detergents Integrated domestic facilities & access to raw materials Two main revenue streams Products Commodities, useful but uninteresting Fertilisers few variants 11
12 Today.. Significant player Soda Ash - 3rd globally Turned threat to opportunity Natural Soda Ash at Kenya lowest cost producer Diversified customer base glass, specialty chemicals Facilities strategically located high growth regions Future business platforms knowledge based, nucleus of scientific talent Branded products, international businesses Wider portfolio in fertilisers, agricultural / food processing sectors at inflection point 12


13 Facilities in India Mithapur Soda Ash, Cement, Salt Haldia DAP, NPK Babrala - Urea TBEM


14 Beyond Boundaries, Brunner Mond Bruner Mond, UK Soda Ash Morocco Africa Haldia India Bruner Mond, Netherlands Soda Ash, Bicarb Babrala India TBEM 2006 Mithapur India 14


15 Beyond Boundaries, Brunner Mond Bruner Mond, Kenya, Lake Magadi - Soda Ash Dredge on lake Magadi, Kenya Morocco Africa Haldia India Babrala India TBEM 2006Durban SA Mithapur India 15

16 Beyond Boundaries, IMACID, Morocco Morocco Africa Haldia India Babrala India TBEM 2006Durban SA Mithapur India 16

 Regional Corridor: 17")
17 Geographic diversification of revenue and capacity Before Brunner Mond, soda ash capacity 0.87mn tons in India Facilities now in Asia, Europe & Africa, close to high-growth markets BMGL: Soda Ash Capacity: 2mn tons Eastern Europe India: Soda Ash Capacity: 0.87mn tons Africa Middl e East India China World Market: 38 MT (+3%) Regional Corridor: 17 MT (+7%) 17


18 Diversified business portfolio Revenues: US$794mm EBIT : US$117mm EBIT margins : 14.8% Chemicals & Food Additives Fertilisers Revenues EBIT EBIT margins US$299.7mm US$ 72.6mm 24% US$494.9mm US$ 45.3mm 9.2% Key products Soda Ash Mkt share 33% Salt Mkt share 40% Sodium Bi-carbonate Urea Market share 4% Diammonium Phosphate NPK End markets Glass, detergents Agriculture Note 1 : Indicates share of revenues. All revenue and EBIT numbers for the year ended FY

19 Strategic Direction - a balanced approach to growth. Horizon 3 Horizon 1 Grow current core where raw materials / resource advantage can be strengthened Horizon 2 Build new business to accelerate transformation to new capabilities Adjacent businesses in agriculture and chemistry Seed options consistent with desired business profile, intersection of chemicals, agri and food sustainability screen Technology drivers Capability platforms under construction Chemical engineering Raw material knowledge Plant operations Chemistry capabilities Platform that allow innovation Global sourcing & marketing capabilities Process and products innovation 19
20 Road Ahead. Chemicals Doubling Magadi Building Global Bicarb business Modernisation of Mithapur Increase Soda ash, cement & Salt capacities Fertilisers Debottlenecking Barbala Explore cheaper locations for gas Innovation new crop specific higher value fertilisers Securitising Inputs Acquisition Thrust 2 nd round of cost optimisation - with Mckinsey Develop R&D facility (Innovation Centre) Company Wide Turnover - USD 2 billion by FY09, 1/3 rd from International Businesses 20
21 Business segments 21

22 Revenue Mix Chemicals - soda ash Chemicals & Food Additives 40% 22
23 Global soda ash industry The global demand supply situation favours producers with capacity utilisation of over 90% Global demand at 47 million mt, China - 21% of demand To grow at 4%pa led by glass Synthetic production dominates 73% Cost structure increasing High natural gas, coal, coke prices & freight rates Prices increasing after seven years of weak prices Source: British Sulphur Consultants 23
24 India- sector dynamics Tata Chemicals is a dominant player with 32.8% market share Domestic demand 2.2 million mt growing at 4-5% Demand driven primarily by the float glass segment million mt Demand Supply Position FY '02 FY '03 FY '04 FY '05 FY '06 Demand Domestic production Synthetic soda ash accounts for 100% of production in the country GHCL 22% Sauchem 11% Nirma 15% TAC 5% DCW 4% Others 11% Capacity utilisation at all-time high TCL 32% 24
25 Overview of Brunner Mond Group 25
26 Brunner Mond a transformational acquisition Major step towards becoming a truly globally competitive company BMGL 2 nd largest producer in Europe ~1500 customers Gives access to larger Asian and European markets Total Soda Ash production capacity ~2.0 million tons with three plants Capacity expansion to increase supply of dense ash to 1.5 million tons, TCL combined turnover to go up ~40% Resultant synergies will enhance Tata Chemicals profitability 26


27 Facilities within reach of major markets Facilities and transportation terminal strategically located to give access to major markets in Europe, Middle East, and South East Asia Europe 1.3mn tons Soda ash capacity 2.0 mn tons Africa 0.685mn tons UK Netherlands Magadi, Kenya Terminal at South Africa 27
28 Competitive advantages of Magadi Soda Ash Magadi has unique competitive advantages Close to key growth markets e.g. Middle East and Asia Self-replenishing proven trona reserve - life of 100 years Lower royalty fee Duration - Lease extended for 30 years upto 2053 Area 227,000 acres Significant cost savings for producing natural soda ash The use of trona makes Magadi Soda Ash lowest cost producer in the world Cost of natural soda ash ~ 50% of synthetic soda ash 28
29 Significant value accompanied with Magadi Soda Ash Before acquisition TCL uses Solvay process - synthetic soda ash Sources key raw materials from nearby quarries and captive salt works Production cost affected by the market price of inputs & availibility Limited scope of vertical integration Capex requirement USD 750 per ton After acquisition Access to natural soda ash & synthetic Diversification includes captive trona reserve at Magadi - assured supply until 2053 Trona reserve captive, proven reserves of 184 mn tons self replenishing Vertical integration possible along value chain Minimal capex USD per ton 29
30 The third largest global producer of soda ash TCL moves from number 13 globally to 3 rd position, maintains cost leadership, capacity from 0.87 mn tons to 3 mn tons Better pricing power FY2006 Soda ash production capacity (mn ton) 2 0 Solvay FMC TCL OCI GCC Sterlite Weifang Tangshan SVM Ciech Sisecam Lianyung Solvay Process Trona 30
31 TCL Standalone Markets ASIA EUROPE MIDDLE EAST & AFRICA India Bangladesh Sri Lanka Indonesia Thailand Oman UAE 31
32 TCL-BMGL Combined Markets ASIA EUROPE MIDDLE EAST & AFRICA India Bangladesh Sri Lanka Indonesia Thailand Pakistan Philippines Vietnam Malaysia UK Netherlands Germany France Belgium Sweden Ireland Norway Denmark Oman UAE Kenya South Africa Nigeria Saudi Arabia Morocco 32


33 Working with leading brands Gujarat Glass 33
34 Building a Global Sodium Bicarbonate Business TCL Business Strong domestic focus Simple grade portfolio Very low fixed costs Pricing comparable with Soda Ash Sales predominantly via distributors Sales to consumer sector BM Business Global sales reach Complex & extensive grade portfolio Low variable, high fixed costs Pricing to add value to Soda Ash Sales balanced direct & via agents / distributors Existing businesses not competing, market and pricing approaches different 34


35 Inorganic Chemicals Food additives Revenue Mix Chemicals & Food Additives 40% 35


36 Food additives Market leader - 40% share in India Increased thrust on salt exports Middle East 22% 50% 5% 4% 15% Most Trusted Food brand in India, 3rd year in a row Tata Salt Annapurna Captain Cook Aashirwad Nirma 36
37 Tata s positioning in the domestic salt industry Tata Salt - largest salt brand in India, 40% market share Tata Salt - pioneer in branded salt market High brand equity and premium perception Superbrand ranked # 1 food brand by Economic Times 1 Nationwide distribution - over 40 million consumers Integrated operations at Chemical site - Embedded competitive advantage Business with social objective first Iodised Salt (goitre), now Fortified (iron deficiency) Note 1 : Indiia s largest selling busines daily Source: Industry, ORG MARG 37


38 Fertiliser segment Revenue Mix Fertilisers 60% 38
39 Global Fertiliser industry A large and mature market, growing fastest in developing countries 2005 sales ~ US$70 billion Consumption ~ 144mm tonnes (2002/2003) Consumption growth 3-4% pa, Expected growth 2% over next 5 years Leading markets - China (26%), US (15%) and India (13%), Fertiliser Consumption Forecast Latin Am erica 9% Eu r op e 14% No rt h America 16% Africa 3% Oceania 2% As ia 56%..Nitrogenous fertiliser dominates consumption Source: British Sulphur Consultants 39
40 Natural gas is the major cost driver for nitrogen Cost structure for urea Alaska 1.5 U.S. Henry Club 5.4 Trinidad 1.6 Netherlands Ukraine Middle East Algeria Indonesia 1.7 $ / MT Urea price $ / MMBtu Other cash prod. cost Process gas costs Ammonia cost Note: 1 Urea price: NOLA granular fob. Cost structure: Production cash cost FOB NOLA barge Source: Blue Johnson & Associates. Natural Gas (NG) - key factor determining Urea prices Ammonia prices create a floor for Urea 40
41 The Indian Fertiliser sector Third largest producer and consumer of Fertilisers Agriculture main driver, Installed capacity 20 million MT Plants use variety of feedstock, varying capacity, technology and vintage Consumption skewed towards nitrogenous fertiliser Urea constitutes 85% of nitrogenous fertiliser consumption and 58% of total consumption Fertiliser production Phosphorus (P) 25% 14.2 million tonnes Nitrogen (N) 75% Sector emerging from highly protected to more liberalized and efficiency encouraging 41
42 Domestic policy Urea policy perspective Prices determined by Government Feed stock price a pass through Equal playing field for efficient and non efficient manufacturers 50/75% distribution restricted to core command areas Constraints Disallowed from manufacturing over installed capacity De-bottlenecking of Babrala pending Government approval Phosphatic Policy perspective Feedstock prices based on average international prices Price announcements often delayed by Government Constraints Delays in settlement of raw material prices Sourcing agreement with IMACID, ensure undisturbed operations; pricing continues to pose challenges 42
43 Tata Chemicals Fertiliser business Source of stable revenues in a pre-dominantly government-controlled environment Leading player in urea and phosphatic fertiliser segments Dual feedstock Babrala facility - most efficient in India Strategic stake in IMACID, Morocco ensures continuous availability of phosphoric acid Presence in high consumption north and east regions Expanding retails network also offer one-stop resource shop to farmers for agricultural solutions Punjab Haryana Uttar Pradesh Bihar INDIA Baroda (Nikohead office) W. Bengal Jharkhand 43
44 Financial overview 44
45 Growing revenue & operating profit Revenue Growth Operating Profit Growth & Margin CAGR: 32% Merger of HLCL* Merger of HLCL* US$ million % 0 FY '03 FY '04 FY '05 FY '06 0 FY '03 FY '04 FY '05 FY '06 0 * Hind Lever Chemicals Ltd Chemicals Fertilisers Op profit Operating Profit Margin Note 1: Decline in operating margins post FY04 due to high input costs incurred by erstwhile HLCL s phosphate business and higher trading activity Decline in operating margins due to increased prices of raw materials and higher trading activity 45
46 Distribution of Earnings FY 2006 Cement 4% STPP 3% Others 5% Other Income 3% Soda Ash 19% Financial 4% Taxes 8% Dividend 4% Retention 5% Urea 19% Complex Fertilizers 39% Vacuum Salt 8% Overheads 5% Distribution 9% Materials 62% Employee 3% Rupee earned Rupee deployed 46
47 Debt-Equity Perspective 2% FY 2006 Debt Split 45% 9% 44% FCCB Short Term Loans Term Loans Cash/ Packing Credit Reducing interest cost (%) Total Debt Shareholder's Equity (%) USD million FY 2005 FY FY 02 FY 03 FY 04 FY 05 FY 06 47
48 Financial ratios ROACE ROE (%) (%) FY03 FY04 FY05 FY FY03 FY04 FY05 FY06 48
49 Credit Ratios Interest Coverage ratio Net Debt/Equity (0.02) FY03 FY04 FY05 FY06 49
50 Financials Revenue growth in USD million CAGR 37.94% * Consolidated financials include BMGL s Q4 results and IMACID s performance over 11 months * Post consolidation 50
51 Financials EBIDTA * in USD million * Post consolidation 51
52 Profit After Tax * in USD million BMGL staff costs are net of write back of USD 7 million crore of pension liabilities in an overseas subsidiary, consequent to actuarial valuation. According to Indian GAAP this amount has to be included in the P&L. Profits are hence higher by same amount. * Post consolidation 52
53 FY2006 consolidated financials TCL consolidated income statement (USD mn) TCL IMACID BMGL (Jan to Mar 06) Consolidated Sales Operating expenses EBITDA Depreciation & amortization EBIT Net interest expense Other income/expense Exceptional items Income before inc. taxes Income tax expense Net Income Net Worth Debt 410 Cash & cash equivalent After reducing provision of USD 58.7 mn for the deficit in BMG s pension liability) 53
54 Financial ratios FY05 Category Unit FY06 * 17% EBITDA Margin % 18% Profitability 11% Net Profit Margin % 11% 15.8 Earnings per share Rupees Networth per Share Rupees % Shareholder Returns Return on Equity % 19% 5% Dividend Yield % 3% 1.5 Market to Book Value Times Cash Generation EBITDA USD Million Debt : Equity Times 0.8 Stability 19.4 Interest Coverage Times Fixed Asset Turnover Times Avg Debtors Velocity No of Days 60 Activity 64 Avg Inventory Turnover No of Days Cash cycle No of Days 72 * Post consolidation 54
55 Shareholder Returns Rs. per share * Rs FY '02 FY '03 FY '04 FY '05 FY '06 EPS Dividend Average Market Price * Post consolidation (Standalone EPS : Rs ) Consistent and healthy dividend payout 55
56 Share price performance Tata Chemicals stock has outperformed the BSE SENSEX Brunner Mond Acquisition Equity market fall in May (INR) Acquisition of one-third stake in IMACID - Feb-03 Jul-03 Dec-03 May-04 Oct-04 Mar-05 Aug-05 Jan-06 Jun-06 Tata Chemical SENSEX 56
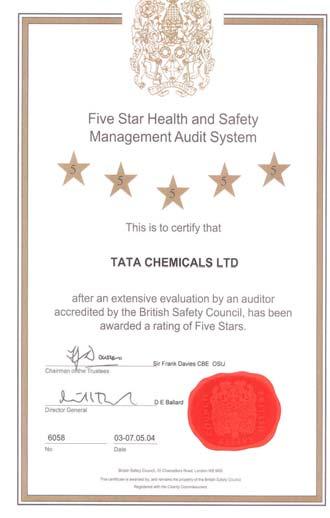

57 Recent Recognition & Awards 57
58 Thank you 58
Sustained growth. Global scale.
 Sustained growth. Global scale. March 2007 1 Table of contents The Tata Group - overview Tata Chemicals - Business overview Segment overview Chemicals, including overview of Brunner Mond Fertilisers Financial
Sowing the seeds of tomorrow.
 Sowing the seeds of tomorrow. July 2007 1 Outline of Presentation Financial overview The Emerging Tata Chemicals 2 FINANCIAL OVERVIEW 3 Financials Revenue growth 5810* 6,000 in Rs. crore 5,000 0% 4 GR
TATA CHEMICAL DATED CMP Rs 265
 DATED 23 09 2008 CMP Rs 265 FACE VALUE Rs10 52 WEEK HIGH/ LOW Rs 440/ Rs227.2 AVG VOL 482330 PE RATIO 6.8 COMPANY OVERVIEW: T ATA CHEMICAL is India`s leading manufacturer of inorganic chemical. It also
TATA Chemicals. Praveen R V U108040
 TATA Chemicals Praveen R V U108040 Industry Overview Classification of the industry Segment Characteristics High volume, low-added Constituent Petrochemicals Industries Fertilizers Basic Limited product
Yara International ASA First Quarter results 2013
 Yara International ASA First Quarter results 213 22 April 213 1 Summary first quarter Strong results with stable margins Strong cash flow Fertilizer deliveries close to last year despite late spring Record
Phillips Carbon Black Limited January 2016
 Phillips Carbon Black Limited www.pcblltd.com January 2016 1 The Group Companies RP- Sanjiv Goenka Group Power & Natural Resources Carbon Black Retail Media & Entertainment Infrastructur e IT & Education
TATA Chemicals Limited Investors Communication H1 & Q2 September 2016 results Date: 10 th November 2016
 TATA Chemicals Limited Investors Communication H1 & September 2016 results Date: 10 th November 2016 1 Safe Harbour Statement This Presentation, except for the historical information, may contain statements,
Tata Chemicals Ltd. A steady, reliable bet for the long term February 21, 2013
 Initiating Coverage CMP (`) Equity India Chemicals & Fertilizers Tata Chemicals Ltd. A steady, reliable bet for the long term February 21, 2013 Target (`) 332 421 Potential Upside Absolute Rating 27% BUY
PEER GROUPS CMP MARKET CAP EPS P/E (X) P/BV(X) DIVIDEND Company Name (Rs.) Rs. in mn. (Rs.) Ratio Ratio (%)
 P/BV(X) DIVIDEND Company Name (Rs.) Rs. in mn. (Rs.) Ratio Ratio (%)") BUY CMP 59.60 Target Price 75.00 RASHTRIYA CHEMICALS & FERTILIZERS LTD Result Update (PARENT BASIS): Q3 FY15 APRIL 6 th 2015 ISIN: INE027A01015 Index Details Stock Data Sector Fertilizers BSE Code 524230
BUY CMP 59.60 Target Price 75.00 RASHTRIYA CHEMICALS & FERTILIZERS LTD Result Update (PARENT BASIS): Q3 FY15 APRIL 6 th 2015 ISIN: INE027A01015 Index Details Stock Data Sector Fertilizers BSE Code 524230
Yara International ASA Third Quarter results 2013
 Yara International ASA Third Quarter results 213 18 October 213 IR-Date: 213-1-18 1 Summary third quarter Strong results despite weaker commodity fertilizer markets 17% increase in deliveries including
Yara International ASA. 21 October 2011
 Yara International ASA Third quarter results 211 21 October 211 1 Summary third quarter Strong results driven by improved margins Strong demand outside Europe, satisfactory sales in Europe Sluiskil urea
Phillips Carbon Black Limited. Efficient Growth November 2015
 Phillips Carbon Black Limited Efficient Growth www.pcblltd.com November 2015 1 The Group Companies RP- Sanjiv Goenka Group Power & Natural Resources Carbon Black Retail Media & Entertainment Infrastructure
LIBERTY PHOSPHATES LTD.(LPL)
") LIBERTY PHOSPHATES LTD.(LPL) Date : 26 th September, 212 Stock Performance Details Background Current Price : Rs. 92.6** Face Value : Rs. 1 per share 52 wk High / Low : Rs. 99.55 / Rs. 45.2 Total Traded
LIBERTY PHOSPHATES LTD.(LPL) Date : 26 th September, 212 Stock Performance Details Background Current Price : Rs. 92.6** Face Value : Rs. 1 per share 52 wk High / Low : Rs. 99.55 / Rs. 45.2 Total Traded
Phillips Carbon Black Limited
 Phillips Carbon Black Limited We Touch Lives Every Moment Investor Presentation February- 218 1 Part of a Dynamic Conglomerate. Carbon Black Industry Global Overview What is Carbon Black? Global CB demand
GHCL Ltd. 19 th September, 2016 BUY
 Company Report BROKING DEPOSITORY DISTRIBUTION FINANCIAL ADVISORY GHCL Ltd. 19 th September, 2016 BUY CMP (BSE) Rs.253.00 Target Price Rs.310.00 BSE Code 500171 Market Cap (Rs Cr.) 2530.49 52 Week High/Low
Yara International ASA 2017 third quarter results. 19 October 2017
 Yara International ASA 217 third quarter results 19 October 217 Safe operations is our first priority 4.5 4. TRI (Total recordable injuries 12-month rolling) 1 3.5 3. 2.5 2. 1.5 Jan '16 Feb Mar Apr May
Yara International ASA 2017 fourth quarter results. 8 February 2018
 Yara International ASA 217 fourth quarter results 8 February 218 Safe operations is our first priority 4.5 4. TRI (Total recordable injuries 12-month rolling) 1 3.5 3. 2.5 2. 1.5 Jan Feb Mar Apr May Jun
Investor Presentation 27 th march 2006
 Investor Presentation 27 th march 2006 1 MIL key highlights Industry overview Industry overview Investor presentation Strategic partnership Huber Micro inks Overview of Hubergroup Global strengths Global
Phillips Carbon Black Limited
 Phillips Carbon Black Limited We Touch Lives Every Moment Investor Presentation October - 217 1 Part of a Dynamic Conglomerate. A Leader in the Industry Company Overview Largest in India and 7 th largest
Yara International ASA Fourth quarter results 2014
 1 Yara International ASA Fourth quarter results 2014 11 February 2015 2 Summary fourth quarter Strong result driven by higher margins Margins benefit from lower European gas prices and stronger US dollar
PEER GROUPS CMP MARKET CAP EPS P/E (X) P/BV(X) DIVIDEND Company Name (Rs.) Rs. in mn. (Rs.) Ratio Ratio (%)
 P/BV(X) DIVIDEND Company Name (Rs.) Rs. in mn. (Rs.) Ratio Ratio (%)") BUY CMP 58.35 Target Price 67.00 RASHTRIYA CHEMICALS & FERTILIZERS LTD Result Update (PARENT BASIS): Q4 FY15 JULY 6 th 2015 ISIN: INE027A01015 Index Details Stock Data Sector Fertilizers BSE Code 524230
BUY CMP 58.35 Target Price 67.00 RASHTRIYA CHEMICALS & FERTILIZERS LTD Result Update (PARENT BASIS): Q4 FY15 JULY 6 th 2015 ISIN: INE027A01015 Index Details Stock Data Sector Fertilizers BSE Code 524230
Ciner Resources LP Investor Presentation August 2017
 Ciner Resources LP Investor Presentation August 2017 Safe Harbor Statement This presentation may contain forward-looking statements. All statements that address operating performance, events or developments
KHAITAN CHEMICALS AND FERTILIZERS LTD.(KCFL)
") Date : 26 th September, 212 KHAITAN CHEMICALS AND FERTILIZERS LTD.(KCFL) Stock Performance Details Background Current Price : Rs. 13.67** Face Value : Rs. 1 per share 52 wk High / Low : Rs. 19.9 / Rs.
Date : 26 th September, 212 KHAITAN CHEMICALS AND FERTILIZERS LTD.(KCFL) Stock Performance Details Background Current Price : Rs. 13.67** Face Value : Rs. 1 per share 52 wk High / Low : Rs. 19.9 / Rs.
Yara International ASA. Torgeir Kvidal, Head of Supply & Trade BofA-Merrill Lynch conference London, 7 December 2011
 Yara International ASA Torgeir Kvidal, Head of Supply & Trade BofA-Merrill Lynch conference London, 7 December 211 A business strategy geared for global optimization Downstream Upstream Industrial Supply
9M 2016 IFRS Results
 9M 216 IFRS Results 1. Market context Market context The average price of DAP (FOB Tampa) in 3Q 216 was USD 339 per tonne, representing a 27% decrease year-on-year. For 9M 216 the average DAP price (FOB
EXPORT PERFORMANCE MONITOR
 Export Performance Monitor Statistics department, EEPC Head Office Exports growing steadily According to the provisional data available from DGCI&S up to September 2007, Exports during September, 2007
PEER GROUPS CMP MARKET CAP EPS P/E (X) P/BV(X) DIVIDEND Company Name (Rs.) Rs. in mn. (Rs.) Ratio Ratio (%)
 P/BV(X) DIVIDEND Company Name (Rs.) Rs. in mn. (Rs.) Ratio Ratio (%)") BUY CMP 244.05 Target Price 280.00 KALPATARU POWER TRANSMISSION LTD. Result Update (PARENT BASIS): Q3 FY15 March 2 nd 2015 ISIN: INE220B01022 Index Details Stock Data Sector Heavy Electrical Equipment
BUY CMP 244.05 Target Price 280.00 KALPATARU POWER TRANSMISSION LTD. Result Update (PARENT BASIS): Q3 FY15 March 2 nd 2015 ISIN: INE220B01022 Index Details Stock Data Sector Heavy Electrical Equipment
Acquisition of Crown Flour Mills Limited 12 January 2010 Singapore
 Acquisition of Crown Flour Mills Limited 12 January 2010 Singapore 1 1 Cautionary note on forward-looking statements This presentation may contain statements regarding the business of Olam International
Yara International ASA Annual General Meeting. 8 May 2018
 Yara International ASA Annual General Meeting 8 May 218 Safe operations is our first priority 5 TRI (Total recordable injuries 12-month rolling) 1 Jan'16 Mar May Jul Sep Nov Jan '17 Mar May July Sep Nov
2016 Annual Integrated Report GRAPHS
 Annual Integrated Report GRAPHS PotashCorp AIR Graphs Page WHY POTASHCORP? GLOBAL POPULATION (billions) FERTILIZER CONSUMPTION GROWTH RATE FORECAST (percentage annual long-term global growth rate) GLOBAL
The Fertilizer Market - A View from Wall Street Fertilizer Outlook & Technology Conference
 EQUITY I RESEARCH The Fertilizer Market - A View from Wall Street Fertilizer Outlook & Technology Conference RBC Dominion Securities Inc. Fai Lee, CGA, CFA (Analyst) (604) 257-7662 fai.lee@rbccm.com November
Gujarat Heavy Chemicals Ltd.
 Company Update Chemicals & Textiles India Research NVS Wealth Managers Gujarat Heavy Chemicals Ltd. CMP: 99 Nifty 8585 Sensex 28286 Nifty PE 23.7 Sensex PE 22.7 Stock Data Sector Chemicals & Textiles BSE
ASIA s CENTURY, INDIA s DECADE. Value Investing Conference, Toronto Puneet Dalmia
 ASIA s CENTURY, INDIA s DECADE Value Investing Conference, Toronto Puneet Dalmia 25 th April 2018 1 Indian Politics Strong government in centre after 30 years Ruling Party 1984 1991 1996 1999 2004 2009
Meghmani Organics Limited (MOL) Q4 & FY17 Investor Presentation (May 2017)
 Q4 & FY17 Investor Presentation (May 2017)") 1 Meghmani Organics Limited (MOL) Q4 & Investor Presentation (May 2017) : Continued profitable growth... Revenue 13.1 (In Rs bn) 13.9 UP 7% EBITDA 19.9% 20.6% Margin PAT Margin 6.3% 6.3% Impacted by exceptional
1 Meghmani Organics Limited (MOL) Q4 & Investor Presentation (May 2017) : Continued profitable growth... Revenue 13.1 (In Rs bn) 13.9 UP 7% EBITDA 19.9% 20.6% Margin PAT Margin 6.3% 6.3% Impacted by exceptional
Yara International ASA 3Q17 results roadshow. Svein Tore Holsether, CEO Thor Giæver, SVP Investor Relations
 Yara International ASA 3Q17 results roadshow Svein Tore Holsether, CEO Thor Giæver, SVP Investor Relations Safe operations is our first priority 4.5 4. TRI (Total recordable injuries 12-month rolling)
Financial results for Q2 2018
 Financial results for Q2 2018 Warsaw, 6th September 2018 Financial results for Q2 2018 Q2 2018 - executive summary 2 PLN 934 m revenues (H1: PLN 1 819 m) PLN 172 m Adj. EBITDA (H1: PLN 340 m) 18.4% Adj.
Citigroup 14 th Annual High Yield / Leveraged Finance Conference
 FMC Corporation Citigroup 14 th Annual High Yield / Leveraged Finance Conference March 7, 2005 Thomas C. Deas, Jr. Vice President & Treasurer Disclaimer Safe Harbor Statement under the Private Securities
1. Executive Summary Chairman s Message Steel Industry Overview Steel Industry Outlook Standalone Financial Performance 7
 Table of Contents 1. Executive Summary 3 2. Chairman s Message 4 3. Steel Industry Overview 5 4. Steel Industry Outlook 6 5. Standalone Financial Performance 7 6. Quarterly Performance Trends 12 7. Graphite
A LEADING PRODUCER OF NATURAL SODA ASH
 A LEADING PRODUCER OF NATURAL SODA ASH OCI RESOURCES LP INVESTOR PRESENTATION AUGUST 2014 OCI Resources LP 1 ORGANIZATIONAL OVERVIEW Organizational Structure OCI Enterprises Inc. 100% OCI Chemical Corporation
Capital Markets Day Developing Regions
 Capital Markets Day Developing Regions Agenda CRH Development Strategy CEE and Russia Asia Key Takeaways CRH plc, Capital Markets Day, November 2012 Page 2 CRH Development Strategy Investing in Developing
NSE: GRAPHITE, BSE: Q1 FY2019 Earnings Presentation August 6 th, 2018
 NSE: GRAPHITE, BSE: 509488 Q1 FY2019 Earnings Presentation August 6 th, 2018 Discussion Agenda Executive Summary 3 Chairman s Message 4 Steel Industry Overview 5-6 Graphite Electrode Industry Overview
Margins(%) EBITDA 30.0% 26.3% 25.4% NPM 26.5% 12.5% 18.1%
 EBITDA 30.0% 26.3% 25.4% NPM 26.5% 12.5% 18.1%") RESULTS REVIEW Share Data Market Cap Rs. 1,460.7 bn Price Rs. 177.2 BSE Sensex 15,049.86 Reuters NTPC.BO Bloomberg NATP IN Avg. Volume (52 Week) 2.6 mn 52-Week High/Low Rs. 291 / 148.75 Shares Outstanding
RESULTS REVIEW Share Data Market Cap Rs. 1,460.7 bn Price Rs. 177.2 BSE Sensex 15,049.86 Reuters NTPC.BO Bloomberg NATP IN Avg. Volume (52 Week) 2.6 mn 52-Week High/Low Rs. 291 / 148.75 Shares Outstanding
Market Context. Corn to DAP prices ratio Global fertiliser demand HIGH DAP PRICES Calendar Year vs
 PhosAgro 2011 IFRS Results 1 1. Market Context Market Context Fundamentals driving i the fertiliser market remain strong Corn and soybean prices at end-2011 63% and 22% higher than 2006-2010 average USDA
Fertiliser Policy Update
 November 23, 2010 FY12E EPS (Rs) Target Price (Rs) Company Reco Chambal Accu 8.6 77 Coromandel Buy 57.9 870 Deepak Buy 25.2 250 GNFC Buy 22.4 157 GSFC Buy 66.3 530 Tata Chemicals Accu 35.7 393 Possible
Roadshow presentation 9 months Key Sales Figures 2016/17. July 2017
 Roadshow presentation 9 months Key Sales Figures 2016/17 Agenda BC at a glance Highlights Q3 2016/17 Strategy & Outlook Page 2 BC at a glance Who are we? The heart and engine of the chocolate industry
AXA. Henri de Castries. Chairman & CEO. London - October 2, Sanford C. Bernstein Strategic Decisions Conference
 AXA Henri de Castries Chairman & CEO London - October 2, 2013 Sanford C. Bernstein Strategic Decisions Conference Cautionary note concerning forward-looking statements Certain statements contained herein
Gujarat State Fertilizers & Chemicals Ltd (GSFC)
") Nov-10 Dec-10 Jan-11 Feb-11 Mar-11 Apr-11 May-11 Jun-11 Jul-11 Aug-11 Sep-11 Oct-11 Visit Note Gujarat State Fertilizers & Chemicals Ltd (GSFC) Several structural advantages, upgrade estimates 14.0% 12.0%
Nov-10 Dec-10 Jan-11 Feb-11 Mar-11 Apr-11 May-11 Jun-11 Jul-11 Aug-11 Sep-11 Oct-11 Visit Note Gujarat State Fertilizers & Chemicals Ltd (GSFC) Several structural advantages, upgrade estimates 14.0% 12.0%
Q3 FY2012 Market Update
 Q3 FY2012 Market Update 2 Table of Contents 1. Third Quarter FY2012 Financial Results 3 2. Strategic Initiatives 5 3. Company Background 6 4. Management and Board of Directors 7 5. Industry Overview 8
Investor Relations Presentation December 2012
 Investor Relations Presentation December 2012 Contents 1. QNB at a Glance 2. QNB Comparative Positioning Qatar and MENA 3. Financial Highlights December 2012 4. Economic Overview 2 QNB at a Glance QNB
BUY. IFB AGRO INDUSTRIES LTD Result Update (PARENT BASIS): Q1 FY16. CMP Target Price SEPTEMBER 30 th 2015 SYNOPSIS
: Q1 FY16. CMP Target Price SEPTEMBER 30 th 2015 SYNOPSIS") BUY CMP 382.00 Target Price 440.00 IFB AGRO INDUSTRIES LTD Result Update (PARENT BASIS): Q1 FY16 SEPTEMBER 30 th 2015 ISIN: INE076C01018 Index Details Stock Data Sector Breweries & Distilleries BSE Code
BUY CMP 382.00 Target Price 440.00 IFB AGRO INDUSTRIES LTD Result Update (PARENT BASIS): Q1 FY16 SEPTEMBER 30 th 2015 ISIN: INE076C01018 Index Details Stock Data Sector Breweries & Distilleries BSE Code
Basant Agro-Tech India Ltd Sector Industry
 Page 1 of 5 Basant gro-tech India Ltd Sector Industry Basic Materials gricultural Inputs Company Profile Incorporated as M/s Shisherkumar Basantkumar Fertilizers Private Limited on 16th October, 1990 and
INVESTOR PRESENTATION Q3, 2018
 INVESTOR PRESENTATION Q3, 2018 SABIC AT A GLANCE Top 3 Largest global chemical companies 1 Top 3 Chemical Brand Value 2 Global Headquarters 100+ Countries of sales Production, Distribution, Storage Facilities
Religare Investment Call
 Q3FY18 Result Update Consumer Durables Symphony Ltd. BUY CMP (Rs) Target Price (Rs) Potential Upside Sensex Nifty Key Stock data BSE Code NSE Code Bloomberg Shares o/s, Cr (FV 2) Market Cap (Rs Cr) 3M
AXA. Jean-Laurent Granier. Chairman & CEO of AXA Global P&C CEO of the Mediterranean and Latin American Region Member of the Management Committee
 AXA Jean-Laurent Granier Chairman & CEO of AXA Global P&C CEO of the Mediterranean and Latin American Region Member of the Management Committee March 27, 2014 Morgan Stanley European Financials Conference
ICICI Group: Performance & Strategy. February 2017
 ICICI Group: Performance & Strategy February 2017 Agenda Indian economy and banking sector ICICI Group Key International regulatory business developments 2 India: strong long term fundamentals Key drivers
Meghmani Organics Limited (MOL) Q2 & H1FY18 Investor Presentation (November 2017)
 Q2 & H1FY18 Investor Presentation (November 2017)") 1 Meghmani Organics Limited (MOL) Q2 & H1FY18 Investor Presentation (November 2017) Robust performance in Q2, PAT up 78% Net Sales (In Rs mn) EBITDA (In Rs mn) 4,536 up 19% YoY 1,028 Up 29% YoY EBITDA
1 Meghmani Organics Limited (MOL) Q2 & H1FY18 Investor Presentation (November 2017) Robust performance in Q2, PAT up 78% Net Sales (In Rs mn) EBITDA (In Rs mn) 4,536 up 19% YoY 1,028 Up 29% YoY EBITDA
4Q 06. Yara International. Earnings per share
 4Q 2006 quarterly report FOURTH quarter And Preliminary results 2006 Yara International Strong financial results Increased sales in Latin America and Asia, delayed season in Europe and North America Strong
Demand, supply, prices and geography
 Deutsche Bank Markets Research Asia China Energy Industry Date 6 August 2014 Industry Update Demand, supply, prices and geography Getting our head around China's market for fertilizers We source this data
PEER GROUPS CMP MARKET CAP EPS P/E (X) P/BV(X) DIVIDEND Company Name (Rs.) Rs. in mn. (Rs.) Ratio Ratio (%)
 P/BV(X) DIVIDEND Company Name (Rs.) Rs. in mn. (Rs.) Ratio Ratio (%)") BUY CMP 469.40 Target Price 540.00 AVANTI FEEDS LIMITED Result Update (PARENT BASIS): Q2 FY16 DECEMBER 12 th 2015 ISIN: INE871C01012 Index Details Stock Data Sector Food products BSE Code 512573 Face Value
BUY CMP 469.40 Target Price 540.00 AVANTI FEEDS LIMITED Result Update (PARENT BASIS): Q2 FY16 DECEMBER 12 th 2015 ISIN: INE871C01012 Index Details Stock Data Sector Food products BSE Code 512573 Face Value
ORIENTAL CARBON & CHEMICALS LTD. Providing Solutions Creating Innovations
 ORIENTAL CARBON & CHEMICALS LTD Providing Solutions Creating Innovations Investor Presentation May 2018 Safe Harbor This presentation and the accompanying slides (the Presentation ), which have been prepared
Unilever - CAGE Conference. Paul Polman CEO Roger Seabrook VP Investor Relations London - 19 th March 2012
 Unilever - CAGE Conference Paul Polman CEO Roger Seabrook VP Investor Relations London - 19 th March 2012 Contents 1 2011 key takeaways 2 Our progress over the last 3 years 3 Your questions addressed 2011
Grindwell Norton Ltd
 Grindwell Norton Ltd 4 Recommendation BUY Company Overview Grindwell Norton Ltd (GNO) is India s leading manufacturer of Abrasives (Bonded, CMP (11/07/2012) Rs. 258 Coated, Non-Woven, Superabrasives and
Pidilite Industries Ltd
 Company Update De-stocking as an initial response to GST implementation caused subdued performance; Brighter long term business prospects ahead The company has recorded sales of Rs. 16693 Mn in as against
Mysore Paper Mills Limited
 12 December 2012 CMP: Rs.5.47 Industry: Paper BSE Group/Index: Group B Promoters Governor of Karnataka (GOK) Year of incorporation 1936 Registered office No. 16/4, Ali Asker Road Bangalore 560052 Karnataka
GSFC Fertilizers and chemicals giant on a roll
 GSFC Fertilizers and chemicals giant on a roll Sector Fertilizers CMP - 69 Target 130 Reco - BUY Basic Details Sensex 27,123 Sensex P/E 18.74 Nifty 8,110 Nifty P/E 21.68 Stock P/E 5x Industry P/E 10.95
Q2 FY2014 Earnings Presentation November 8, 2013
 Q2 FY2014 Earnings Presentation November 8, 2013 Important Notice Forward Looking Statements This presentation contains statements that contain forward looking statements including, but without limitation,
EARNINGS & PERFORMANCE OVERVIEW
 OCP Reports Earnings for Fourth Quarter and Full Year 2016 CASABLANCA - Morocco, 23 rd March, 2017 OCP S.A. ( OCP or the Group ), a global leader in the fertilizer industry, today reported results for
Devine Impex Limited. Key Data (as on 23 December 2015) 23 December 2015
 23 December 2015") 23 December 2015 CMP: Rs.7.4 Industry: Trading BSE Group/Index: Group XT Promoters Rohit Jain and family Year of incorporation 1995 Registered office SCF 103, Chamber No. 7, I Floor, Phase XI, Mohali (S
23 December 2015 CMP: Rs.7.4 Industry: Trading BSE Group/Index: Group XT Promoters Rohit Jain and family Year of incorporation 1995 Registered office SCF 103, Chamber No. 7, I Floor, Phase XI, Mohali (S
ANALYSTS BRIEFING YEAR Syed Aamir Ahsan - CFO FFBL (02 Feb 2012)
") ANALYSTS BRIEFING YEAR 2011 Syed Aamir Ahsan - CFO FFBL (02 Feb 2012) SEQUENCE Global Trends Industry and FFBL Performance in 2011 Gas Curtailment PMP Operations Wind-Power Projects Update Outlook (Global
ANALYSTS BRIEFING YEAR 2011 Syed Aamir Ahsan - CFO FFBL (02 Feb 2012) SEQUENCE Global Trends Industry and FFBL Performance in 2011 Gas Curtailment PMP Operations Wind-Power Projects Update Outlook (Global
BUY. Efforts on cost cutting paying off RAMCO CEMENTS. Target Price: Rs 435. Key highlights. Key drivers FY15 FY16E FY17E
 RAMCO S BUY Target Price: Rs 435 Efforts on cost cutting paying off Q2 EBITDA at Rs 2.8 bn (up 30% YoY) was ahead of our estimates due to lower-than-expected costs. Average costs (excluding freight) declined
Travel Insurance and Assistance
 Travel Insurance and Assistance Worldwide research covering over 40 countries Series Prospectus Finaccord Web: www.finaccord.com. E-mail: info@finaccord.com 1 Prospectus contents Page What is the research?
Presentation at Citigroup Smith Barney India Corporate Day. London, June 2003
 Presentation at Citigroup Smith Barney India Corporate Day London, June 2003 HINDUSTAN LEVER LIMITED Contents Economy Overview Strategy FY 2002 MQ 2003 2003 & Beyond.. HINDUSTAN LEVER LIMITED Contents
GHCL Limited Q3FY16 Business Update
 GHCL Limited Q3FY16 Business Update 1 Safe Harbor This presentation and the accompanying slides (the Presentation ), which have been prepared by GHCL Limited (the Company ), have been prepared solely for
Kiri Industries Limited H1/Q2-FY19 EARNINGS PRESENTATION
 Kiri Industries Limited H1/Q2-FY19 EARNINGS PRESENTATION 2 Company Overview Established in 1998, Kiri Industries Limited (KIL), is based out of Gujarat and has emerged as one of the largest manufacturers
Year-end results. 18 May
 Year-end results 18 May Highlights for the year Strong operational performance Good performance across all areas of activity Deepened our core franchise Sound levels of corporate client and private client
BUY. CAMLIN FINE SCIENCES LTD Result Update (PARENT BASIS): Q1 FY15. CMP Target Price AUGUST 28 th 2014 SYNOPSIS
: Q1 FY15. CMP Target Price AUGUST 28 th 2014 SYNOPSIS") BUY CMP 117.00 Target Price 135.00 CAMLIN FINE SCIENCES LTD Result Update (PARENT BASIS): Q1 FY15 AUGUST 28 th 2014 ISIN: INE052I01024 Index Details Stock Data Sector Specialty Chemicals BSE Code 532834
BUY CMP 117.00 Target Price 135.00 CAMLIN FINE SCIENCES LTD Result Update (PARENT BASIS): Q1 FY15 AUGUST 28 th 2014 ISIN: INE052I01024 Index Details Stock Data Sector Specialty Chemicals BSE Code 532834
BUY. MENON PISTONS LTD Result Update (PARENT BASIS): Q1 FY16 SYNOPSIS. CMP Target Price SEPTEMBER 3 rd, 2015
: Q1 FY16 SYNOPSIS. CMP Target Price SEPTEMBER 3 rd, 2015") BUY CMP 151.00 Target Price 174.00 MENON PISTONS LTD Result Update (PARENT BASIS): Q1 FY16 SEPTEMBER 3 rd, 2015 ISIN: INE650G01011 Stock Details Stock Data Sector Auto Parts & Equipment BSE Code 531727
BUY CMP 151.00 Target Price 174.00 MENON PISTONS LTD Result Update (PARENT BASIS): Q1 FY16 SEPTEMBER 3 rd, 2015 ISIN: INE650G01011 Stock Details Stock Data Sector Auto Parts & Equipment BSE Code 531727
Travel Insurance and Assistance
 Travel Insurance and Assistance Worldwide research covering over 40 countries Series Prospectus Finaccord 1 Prospectus contents Page What is the research? Which countries are covered What methodology has
Cravatex Limited. Stock Performance Details Shareholding Details September 2015
 Cravatex Limited Date: 20 th January, 2016 Stock Performance Details Shareholding Details September 2015 Current Price : ` 247.8^ Face Value : ` 10 per share 52 wk High / Low : ` 550.0 / 215.0 Total Traded
Investor Day 2006 Wholesale Banking 22 November Road to sustainable growth
 Investor Day 2006 Wholesale Banking 22 November 2006 Road to sustainable growth 2 Forward looking statements It is possible that this presentation could or may contain forward-looking statements that are
SIEMENS INDIA LIMITED RESEARCH
 RESULTS REVIEW Siemens India Limited Hold Share Data Market Cap Rs. 196.1 bn Price Rs. 581.6 BSE Sensex 14,961.07 Reuters Bloomberg Avg. Volume (52 Week) SIEM.BO SIEM IN 0.2 mn 52-Week High/Low Rs. 1,142.5
Nutrien Q4 Results Presentation. February 5, 2018
 Nutrien Q4 Results Presentation Forward Looking Statements 2 Certain statements and other information included in this presentation constitute "forward-looking information" or "forward-looking statements"
1QFY14 Results Presentation
 1QFY14 Results Presentation 1 Key highlights 1QFY14 Standalone performance Consolidated performance JSW Steel JSW Ispat merger update Highest ever Crude Steel production: 2.86 million tonnes Saleable Steel
Travel Insurance and Assistance
 Travel Insurance and Assistance Worldwide research covering over 40 countries Series Prospectus Finaccord Ltd., 2016 Web: www.finaccord.com. E-mail: info@finaccord.com 1 Prospectus contents Page What is
Agenda. 1. Highlights FY 2012 Results. 2. Operational Performance Priorities for Financials. 5. Conclusion
 1MARCH 2013 Legal Disclaimer Information in this presentation may involve guidance, expectations, beliefs, plans, intentions or strategies regarding the future. These forward-looking statements involve
Cement Sector ARM and Bamburi Valuation Summary 31 st July, 2016
 Cement Sector ARM and Bamburi Valuation Summary 31 st July, 2016 Table of Contents I. ARM Cement Limited II. Bamburi Cement Limited III. Comparison 2 3 I. ARM Cement Limited Athi River Mining Company Limited
Asian Oilfield Services Limited
 23 December 2015 CMP: Rs.63.2 Industry: Oil and Gas BSE Group/Index: XD Promoters Samara Capital Partners Fund Year of incorporation 1992 Registered office 703, IRIS Tech Park, Tower-A, 7th Floor, Sector
Roadshow presentation - Half-Year Results 2015/16. April 2016
 Roadshow presentation - Half-Year Results 2015/16 April 2016 Agenda BC at a glance Highlights HY 2015/16 Financial Review Strategy & Outlook Page 2 BC at a glance We are present in the key parts of the
Presentation 22 August 2018
 Presentation 22 August 2018 Exceeded 3YP targets in 2017, but 2018 is challenging due to continued destocking, store closures and bankruptcies Profit attributable to shareholders (like-for-like) down 19%
HSBC Trade Connections: Trade Forecast Quarterly Update October 2011
 HSBC Trade Connections: Trade Forecast Quarterly Update October 2011 New quarterly forecast exploring the future of world trade and the opportunities for international businesses World trade will grow
Indian Oil Corporation Ltd.
 Sep-16 Oct-16 Nov-16 Dec-16 Jan-17 Feb-17 Mar-17 Apr-17 May-17 Jun-17 Jul-17 Aug-17 Sep-17 s. Indian Oil Corporation Ltd.. October 25, 217 BSE Code: 53965 NSE Code: IOC Reuters Code: IOC.NS Bloomberg Code:
FY14E FY15E FY14E FY15E
 Sep 13 Complex fertiliser sales down 13%; urea up by 2.6% YoY October 14, 2013 Balwindar Singh balwindarsingh@plindia.com +91-22-66322239 Sensex v/s PL Agri Products & Chemical Index PL Agri Products &
SCALING GREATER HEIGHTS. 72 Annual Report GOING BEYOND BOUNDARIES INNOVATING FOR A BETTER TOMORROW DELIVERING CUSTOMER DELIGHT
 DELIVERING CUSTOMER DELIGHT INNOVATING FOR A BETTER TOMORROW CREATING HAPPY COMMUNITIES CREATING A SUSTAINABLE BUSINESS GOING BEYOND BOUNDARIES SCALING GREATER HEIGHTS REDEFINING EXCELLENCE nd 72 Annual
BUY APOLLO TYRES LTD. CMP Target Price AUGUST 12 th, Highlights. Result Update (CONSOLIDATED BASIS): Q1 FY16
: Q1 FY16") BUY CMP 187.50 Target Price 215.00 APOLLO TYRES LIMITED Result Update (CONSOLIDATED BASIS): Q1 FY16 AUGUST 12 th, 2015 ISIN: INE438A01022 Stock Data Sector Tyres & Tubes BSE Code 500877 Face Value 1.00
BUY CMP 187.50 Target Price 215.00 APOLLO TYRES LIMITED Result Update (CONSOLIDATED BASIS): Q1 FY16 AUGUST 12 th, 2015 ISIN: INE438A01022 Stock Data Sector Tyres & Tubes BSE Code 500877 Face Value 1.00
Roadshow presentation 3-Month Key Sales Figures 2016/17. January 2017
 Roadshow presentation 3-Month Key Sales Figures 2016/17 Agenda BC at a glance Highlights 3 months 2016/17 Strategy & Outlook Page 2 BC at a glance Who we are? The heart and engine of the chocolate industry
2018 Half Year Results
 A GLOBAL LEADER IN METAL FLOW ENGINEERING 2018 Half Year Results 26 July 2018 Patrick André Chief Executive 1 Disclaimer This presentation, which has been prepared by Vesuvius plc (the Company ), includes
FONTERRA INTERIM RESULTS 2014
 FONTERRA INTERIM RESULTS 2014 Market Briefing FONTERRA CO-OPERATIVE GROUP LIMITED Overview John Wilson Chairman 2 Working Area Safee Copy Frame. This denotes working area and must be deleted before final
PEER GROUPS CMP MARKET CAP EPS P/E (X) P/BV(X) DIVIDEND Company Name (Rs.) Rs. in mn. (Rs.) Ratio Ratio (%)
 P/BV(X) DIVIDEND Company Name (Rs.) Rs. in mn. (Rs.) Ratio Ratio (%)") BUY CMP 100.35 Target Price 115.00 GUJARAT STATE FERTILIZERS & CHEMICALS LTD Result Update (PARENT BASIS): Q2 FY15 DECEMBER 11 th 2014 ISIN: INE026A01025 Index Details Stock Data Sector Fertilizers BSE
BUY CMP 100.35 Target Price 115.00 GUJARAT STATE FERTILIZERS & CHEMICALS LTD Result Update (PARENT BASIS): Q2 FY15 DECEMBER 11 th 2014 ISIN: INE026A01025 Index Details Stock Data Sector Fertilizers BSE
1. Executive Summary Chairman s Message Steel Industry Overview Steel Industry Outlook Standalone Financial Performance 7
 Table of Contents 1. Executive Summary 3 2. Chairman s Message 4 3. Steel Industry Overview 5 4. Steel Industry Outlook 6 5. Standalone Financial Performance 7 6. Quarterly Performance Trends 12 7. Graphite
Financial & Business Highlights For the Year Ended June 30, 2017
 Financial & Business Highlights For the Year Ended June, 17 17 16 15 14 13 12 Profit and Loss Account Operating Revenue 858 590 648 415 172 174 Investment gains net 5 162 909 825 322 516 Other 262 146