Conduent Announces Fourth Quarter and Full-Year 2016 Results; Reaffirms Long-Term Outlook
|
|
|
- Shavonne Atkinson
- 6 years ago
- Views:
Transcription
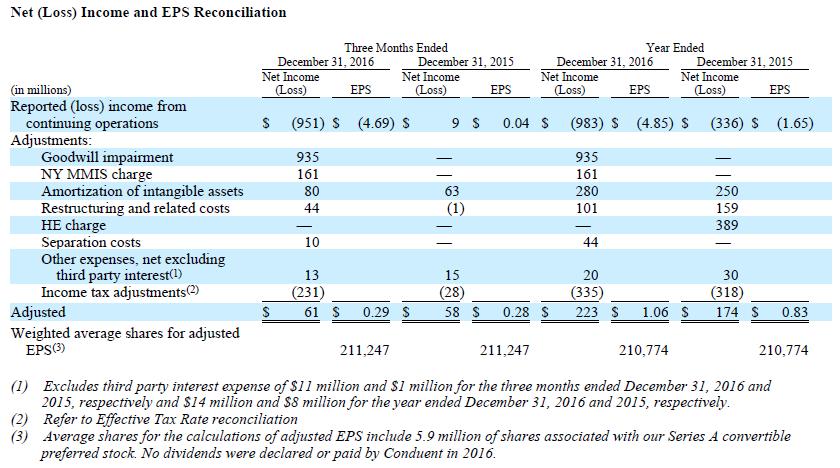
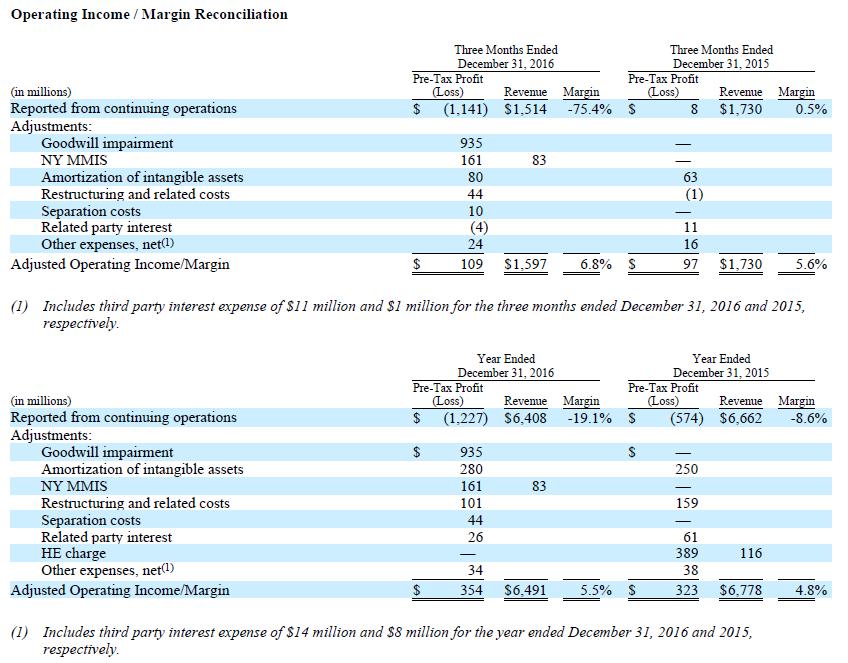
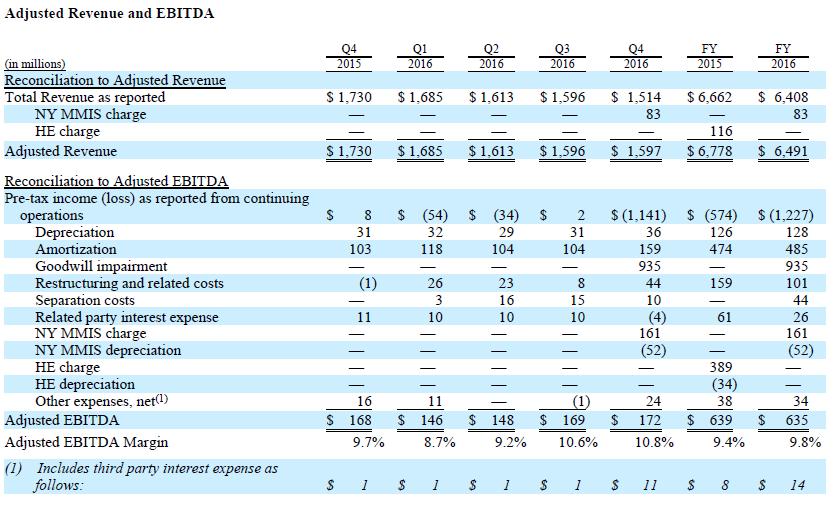
1 News from Conduent For Immediate Release Conduent Incorporated 100 Campus Drive Florham Park, NJ Conduent Announces Fourth Quarter and Full-Year 2016 Results; Reaffirms Long-Term Outlook Successfully Completed Spin-Off from Xerox; Listed as Independent Company on NYSE Fourth quarter and full-year financial results represent operations while still part of Xerox Corporation FY 2016 revenues of $6.408 billion, adjusted revenues of $6.491 billion; Q revenues of $1.514 billion, adjusted revenues of $1.597 billion FY 2016 Profit (Loss) Before Income Tax of ($1.227 billion), which includes $935 million goodwill impairment charge and $161 million NY MMIS charge. FY 2016 adjusted EBITDA of $635 million, adjusted EBITDA margin of 9.8%; Q adjusted EBITDA of $172 million, adjusted EBITDA margin of 10.8% FY 2016 GAAP EPS (Loss) of ($4.85), adjusted EPS of $1.06; Q GAAP EPS (Loss) of ($4.69), adjusted EPS of $0.29 Long-term financial outlook remains unchanged from December 5, 2016 Investor Event FLORHAM PARK, N.J., Feb. 22, 2017 Conduent (NYSE: CNDT), a leading provider of diversified business process services, today announced fourth quarter and full-year 2016 financial results reflecting its last period as part of Xerox Corporation. In 2016, we were focused on executing a successful separation from Xerox to become a standalone public company, said Ashok Vemuri, CEO of Conduent. As we move into 2017, we are aligning our go-to-market and capital allocation strategies with the competitive requirements of our industry. Our near-term focus is on strengthening client relationships, completing the buildout of our management structure, and continuing the success of our strategic transformation program critical in reaching our margin expansion goals. Fourth Quarter 2016 Results Fourth quarter 2016 GAAP revenues were $1.514 billion. Operating margin was (3.4) percent. The company reported a GAAP EPS (Loss) of ($4.69) which includes the impact from the goodwill impairment charge of $935 million, $828 million net of income tax ($4.08 per share), and the NY MMIS charge of $161 million, $98 million net of income tax ($0.48 per share). Fourth quarter adjusted revenues were $1.597 billion. Adjusted operating margin was 6.8 percent. Adjusted EBITDA was $172 million, with an adjusted EBITDA margin of 10.8 percent. The company reported adjusted earnings per share of $0.29.
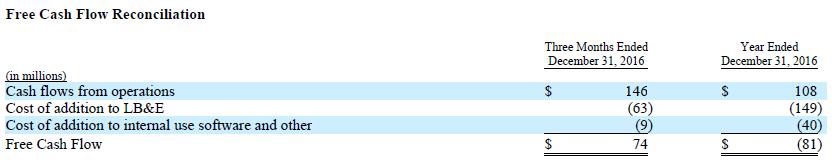
2 Conduent generated $146 million in cash flow from operations during the fourth quarter and ended 2016 with a cash balance of $390 million. Total debt was approximately $2.0 billion as of December 31. In early January, the company borrowed an additional $100 million on its Term Loan B. Full-Year 2016 Results Full-year 2016 GAAP revenues were $6.408 billion. Operating margin was 3.0 percent. The company reported a GAAP EPS (Loss) of ($4.85), which includes the impact from the goodwill impairment charge of $935 million, $828 million net of income tax ($4.08 per share), and the NY MMIS charge of $161 million, $98 million net of income tax ($0.48 per share). Full-year adjusted revenues were $6.491 billion. Adjusted operating margin was 5.5 percent. Adjusted EBITDA was $635 million, with adjusted EBITDA margin of 9.8 percent. The company reported adjusted earnings per share of $1.06. Conduent generated $108 million in cash flow from operations for the full-year Financial and Strategic Outlook Conduent s long-term financial outlook remains unchanged from what was outlined at the December 2016 Investor Event, and the company is continuing to execute against its strategic transformation program. The strategic transformation continues to progress as expected. Our efforts extend throughout the organization and are focused on multiple aspects of the business, including modernizing platforms, refocusing our innovation group, and expanding verticalization in our core markets, said Brian Webb Walsh, Conduent CFO. These initiatives will strengthen our foundation for the future. Conference Call Management will present the results during a conference call and webcast at 10 a.m. Eastern. The call will be available by live audio webcast along with the news release and online presentation slides at The conference call will also be available by calling (international dial-in ) at approximately 9:45 a.m. ET. The conference ID for this call is A recording of the conference call will be available by calling , or after 1:30 p.m. ET on February 22, The replay ID is For international calls, please select a dial-in number from: The telephone recording will be available until 7:00 p.m. ET on March 15, 2017.
3 About Conduent Conduent is a leading provider of diversified business process services with leading capabilities in transaction processing, automation, analytics and constituent experience. We work with both government and commercial customers in assisting them to deliver quality services to the people they serve. We manage interactions with patients and the insured for a significant portion of the U.S. healthcare industry. We are the customer interface for large segments of the technology industry and the operational and processing partner of choice for public transportation systems around the world. Whether it s digital payments, claims processing, benefit administration, automated tolling, customer care or distributed learning Conduent manages and modernizes these interactions to create value for both our clients and their constituents. Learn more at Forward Looking Statements This news release contains forward-looking statements that involve risks and uncertainties. These statements can be identified by the fact that they do not relate strictly to historical or current facts, but rather are based on current expectations, estimates, assumptions and projections about the business process outsourcing industry and our business and financial results. Forward-looking statements often include words such as anticipates, estimates, expects, projects, intends, plans, believes and words and terms of similar substance in connection with discussions of future operating or financial performance. As with any projection or forecast, forward-looking statements are inherently susceptible to uncertainty and changes in circumstances. Our actual results may vary materially from those expressed or implied in our forward-looking statements. Accordingly, undue reliance should not be placed on any forward-looking statement made by us or on our behalf. Important factors that could cause our actual results to differ materially from those in our forward-looking statements include: government regulation, economic, strategic, political and social conditions and the following factors; competitive pressures; changes in interest in outsourced business process services; our ability to obtain adequate pricing for our services and to improve our cost structure; the effects of any acquisitions, joint ventures and divestitures by us; our ability to attract and retain key employees; our ability to attract and retain necessary technical personnel and qualified subcontractors and their ability to deliver or perform as expected; termination right, audits and investigations associated with government contracts; a decline in revenues from or a loss or failure of significant clients; our ability to estimate the scope of work or the costs of performance in our contracts; the failure to comply with laws relating to individually identifiable information and personal health information and laws relating to processing certain financial transactions, including payment card transactions and debit or credit card transactions; our ability to deliver on our contractual obligations properly and on time; our ability to renew commercial and government contracts awarded through competitive bidding processes; increases in the cost of telephone and data services or significant interruptions in such services; changes in tax and other laws and regulations; changes in U.S. GAAP or other applicable accounting policies; and other factors that are set forth in the Risk Factors section; the Legal Proceedings section, The Management Discussion and Analysis of Financial Condition and Results of Operations section
4 and other sections of the Conduent Incorporated Form 10 Registration Statement, as well as in our Quarterly Reports on Form 10-Q and Current Reports on Form 8-K. This list of important risk factors is not intended to be exhaustive. Conduent is under no obligation to, and expressly disclaims any obligation to, update any forward-looking statements as a result of new information or future events or developments, except as required by law. We caution you that the foregoing list of important factors may not contain all of the material factors that are important to you. Any forward-looking statements made by us in this current report speak only as of the date on which they are made. We are under no obligation to, and expressly disclaim any obligation to, update or alter our forward-looking statements, whether as a result of new information, subsequent events or otherwise. Non-GAAP Financial Measures We have reported our financial results in accordance with U.S. generally accepted accounting principles (GAAP). In addition, we have discussed our financial results using the non-gaap measures described below. We believe these non-gaap measures allow investors to better understand the trends in our business and to better understand and compare our results. Accordingly, we believe it is necessary to adjust several reported amounts, determined in accordance with GAAP, to exclude the effects of certain items as well as their related tax effects. Management believes that these non-gaap financial measures provide an additional means of analyzing the current periods results against the corresponding prior periods results. However, these non-gaap financial measures should be viewed in addition to, and not as a substitute for, the Company s reported results prepared in accordance with U.S. GAAP. Our non- GAAP financial measures are not meant to be considered in isolation or as a substitute for comparable U.S. GAAP measures and should be read only in conjunction with our Consolidated Financial Statements prepared in accordance with U.S. GAAP. Our management regularly uses our supplemental non-gaap financial measures internally to understand, manage and evaluate our business and make operating decisions. These non-gaap measures are among the primary factors management uses in planning for and forecasting future periods. Compensation of our executives is based in part on the performance of our business based on these non-gaap measures. Refer to the Non-GAAP Financial Measures section attached to this release for a discussion of these non-gaap measures and their reconciliation to the reported GAAP measure. # # # Media Contacts: Karen Cleeve, Conduent, , karen.cleeve@conduent.com Sean Collins, Conduent, , sean.collins2@conduent.com Investor Contact: Alan Katz, Conduent, , alan.katz@conduent.com Xerox and Xerox and Design are trademarks of Xerox in the United States and/or other countries. Conduent is a trademark of Conduent Incorporated in the United States and/or other countries.
5 Conduent Incorporated Condensed Consolidated Statements of Income (Unaudited) Three Months Ended December 31, Year Ended December 31, (in millions, except per-share data) % Change % Change Revenues Outsourcing $ 1,502 $ 1,717 (13)% $ 6,358 $ 6,609 (4)% Related party (8 )% (6)% Total Revenues 1,514 1,730 (12 )% 6,408 6,662 (4)% Costs and Expenses Cost of outsourcing 1,383 1,432 (3)% 5,462 5,937 (8)% Related party cost of services 8 11 (27 )% (10)% Research and development 6 13 (54 )% (40)% Selling, administrative and general (5 )% (2)% Restructuring and related costs 44 (1) * (36)% Amortization of intangible assets % % Goodwill impairment 935 * 935 * Separation costs 10 * 44 * Related party interest (4 ) 11 (136 )% (57)% Other expenses, net % (11)% Total Costs and Expenses 2,655 1, % 7,635 7,236 6 % (Loss) Income Before Income Taxes (1) (1,141) 8 * (1,227) (574) 114 % Income tax benefit (190) (1) * (244) (238) * (Loss) Income from Continuing Operations (951) 9 * (983) (336) 193 % Loss from discontinued operations, net of tax (14) (100)% (78) (100)% Net Loss $ (951 ) $ (5 ) * $ (983 ) $ (414 ) 137 % Basic (Loss) Earnings per Share: Continuing operations $ (4.69 ) $ 0.04 * $ (4.85 ) $ (1.65 ) * Discontinued operations (0.07 ) * (0.39 ) * Total Basic Loss per Share $ (4.69 ) $ (0.03 ) * $ (4.85 ) $ (2.04 ) * Diluted (Loss) Earnings per Share: Continuing operations $ (4.69) $ 0.04 * $ (4.85) $ (1.65) * Discontinued operations (0.07 ) * (0.39 ) * Total Diluted (Loss) per Share $ (4.69 ) $ (0.03 ) * $ (4.85 ) $ (2.04 ) * * Percent change not meaningful. (1) Referred to as Pre-Tax (Loss) Income throughout the remainder of this document.
6 (in millions, except share data in thousands) Assets Conduent Incorporated Condensed Consolidated Balance Sheets (Unaudited) December 31, 2016 December 31, 2015 Cash and cash equivalents $ 390 $ 140 Accounts receivable, net 1,286 1,246 Related party notes receivable 248 Other current assets Total current assets 1,917 1,874 Land, buildings and equipment, net Intangible assets, net 1,144 1,425 Goodwill 3,889 4,872 Other long-term assets Total Assets $ 7,709 $ 9,058 Liabilities and Equity Short-term debt and current portion of long-term debt $ 28 $ 24 Related party notes payable 1,132 Accounts payable Accrued compensation and benefits costs Unearned income Net payable to former parent company 124 Other current liabilities Total current liabilities 1,402 2,741 Long-term debt 1, Pension and other benefit liabilities Deferred taxes Other long-term liabilities Total Liabilities 4,279 3,896 Series A Convertible Preferred Stock 142 Common stock 2 Additional paid-in capital 3,812 Former parent company investment 5,343 Accumulated other comprehensive loss (526) (181) Total Equity 3,288 5,162 Total Liabilities and Equity $ 7,709 $ 9,058 Shares of common stock issued and outstanding 202,875
7 Conduent Incorporated Condensed Consolidated Statements of Cash Flows (Unaudited) Three Months Ended December 31, Year Ended December 31, (in millions) Cash Flows from Operating Activities: Net loss $ (951) $ (5) $ (983 ) $ (414) Adjustments required to reconcile net income to cash flows from operating activities: Depreciation and amortization Goodwill impairment Provision for receivables Deferred tax expense (4) (115 ) (4 ) (115) Net loss on sales of businesses and assets Stock-based compensation 6 (14 ) Restructuring and asset impairment charges 28 (1 ) Payments for restructurings (9) (6 ) (46 ) (19) Contributions to defined benefit pension plans (2) (2 ) (6 ) (8) Decrease (increase) in accounts receivable (27 ) 239 Increase in other current and long-term assets (20) (13 ) (90 ) (86) Increase (decrease) in accounts payable and accrued compensation (60 ) 22 (Decrease) increase in other current and long-term liabilities (46) 37 (210 ) 228 Net change in income tax assets and liabilities (197) 172 (117 ) (236) Other operating, net 1 (1 ) Net cash provided by operating activities Cash Flows from Investing Activities: Cost of additions to land, buildings and equipment (63) (35 ) (149 ) (158) Cost of additions to internal use software (8) (7 ) (39 ) (27) Proceeds from sale of businesses (53 ) 939 Acquisitions, net of cash acquired (2 ) (1 ) (197) Proceeds from investments Net proceeds (payments) on related party notes receivable 205 (13 ) 248 (37) Other investing, net 2 (1 ) 2 Net cash provided by (used in) investing activities 145 (55 ) Cash Flows from Financing Activities: Net proceeds on debt 1, , Net payments on debt (14 ) (6 ) (32 ) (293 ) Net payments on related party notes payable (1,106 ) (107 ) (1,132 ) (91 ) Net transfers to former parent (804 ) (348 ) (588 ) (672 ) Excess tax benefits from stock-based compensation 3 6 Restricted cash - related party (18 ) (18 ) Other financing 1 (1 ) Net cash (used in) provided by financing activities (45 ) (453 ) 132 (1,023 ) Effect of exchange rate changes on cash and cash equivalents (4 ) (3 ) (6 ) (11 ) Increase (decrease) increase in cash and cash equivalents 242 (23 ) 250 (19 ) Cash and cash equivalents at beginning of period Cash and Cash Equivalents at End of Period $ 390 $ 140 $ 390 $ 140
8 Non-GAAP Financial Measures We have reported our financial results in accordance with U.S. generally accepted accounting principles (GAAP). In addition, we have discussed our financial results using the non-gaap measures described below, consistent with Xerox s historical presentation. We believe these non-gaap measures allow investors to better understand the trends in our business and to better understand and compare our results. Accordingly, we believe it is necessary to adjust several reported amounts, determined in accordance with GAAP, to exclude the effects of certain items as well as their related tax effects. Management believes that these non-gaap financial measures provide an additional means of analyzing the current periods results against the corresponding prior periods results. However, these non-gaap financial measures should be viewed in addition to, and not as a substitute for, the Company s reported results prepared in accordance with U.S. GAAP. Our non-gaap financial measures are not meant to be considered in isolation or as a substitute for comparable U.S. GAAP measures and should be read only in conjunction with our Consolidated Financial Statements prepared in accordance with U.S. GAAP. Our management regularly uses our supplemental non-gaap financial measures internally to understand, manage and evaluate our business and make operating decisions. These non-gaap measures are among the primary factors management uses in planning for and forecasting future periods. Compensation of our executives is based in part on the performance of our business based on these non-gaap measures. Also, non-gaap measures are footnoted, where applicable in each slide herein. These Non-GAAP financial measures should be viewed in addition to, and not as a substitute for, the Company s reported results prepared in accordance with GAAP. A reconciliation of the following Non- GAAP financial measures to the most directly comparable financial measures calculated and presented in accordance with GAAP are set forth as part of the Appendix to this presentation. In connection with the preparation of our financial statements for the fiscal year ended December 31, 2016, during the fourth quarter, we performed our annual goodwill impairment test. Following the completion of the impairment test, we determined that we will record a non-cash goodwill impairment charge of $935 million (approximately $828 million after-tax or ($4.08) per share) in our Commercial Sector reporting unit. Subsequent to the goodwill impairment charge, the Commercial Sector reporting unit s goodwill balance is approximately $908 million. This non-cash charge is attributable primarily to weaker than expected Commercial Sector revenues and operating profits, including in the fourth quarter of We do not expect to make any current or future cash expenditures as a result of this impairment. We are in discussions with the State of New York regarding the status and scope of the Health Enterprise platform project, which evolved to include options to not fully complete the project. Based on those discussions, we believe it is probable that we will not fully complete the implementation of the platform in New York. As a result of these developments, we will record a pre-tax charge of approximately $161 million (approximately $98 million after-tax or ($0.48) per share) in our fourth-quarter 2016 results reflecting estimated asset impairments, wind down costs and other impacts from this project. The charge includes approximately $115 million for the write-off of receivables and other related assets and non-cash impairment charges, with the remainder of the charge expected to be cash outflows in future quarters for wind down and related costs. Late in the third quarter of 2015, we determined that we would not fully complete Health Enterprise Medicaid platform implementation projects in California and Montana and recorded a charge of $389 million. The charge included a $116 million reduction to revenues with the remaining $273 million recorded to cost of outsourcing. As a result of the significant impact of the Goodwill Impairment, NY MMIS Charge and HE Charge on our reported revenues, costs and expenses as well as key metrics for the period, we discuss our 2016 and
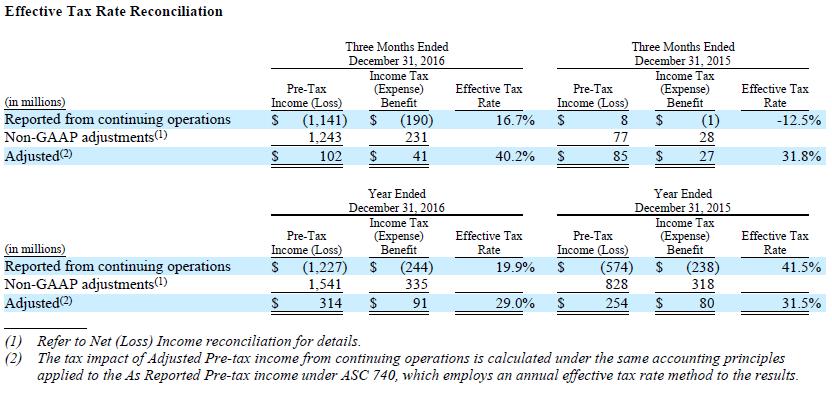
9 2015 results using non-gaap financial measures that exclude the impact of these items, as discussed below. Adjusted Net Income (Loss), Adjusted Earnings per Share, and Adjusted Effective Tax Rate. We make adjustments to Income (Loss) before Income Taxes for the following items, for the purpose of calculating Adjusted Net Income (Loss), Adjusted Earnings per Share, and Adjusted Effective Tax Rate. In 2016, we adjusted Income (Loss) before Income Taxes for the Goodwill Impairment charge of $935 million recorded during the fourth quarter Also in 2016, we adjusted Income (Loss) before Income Taxes for the New York Health Enterprise (NY MMIS) charge of $161 million recorded during the fourth quarter In 2015, we adjusted Income (Loss) before Income Taxes for the Health Enterprise (HE) charge of $389 million recorded during the third quarter In addition to the items discussed above, for the quarter and full year ended December 31, 2016 and 2015 we Adjusted Net Income (Loss), Earnings per Share and Effective Tax Rate for the following items: Amortization of intangible assets. The amortization of intangible assets is driven by acquisition activity, which can vary in size, nature and timing as compared to other companies within our industry and from period to period. Restructuring and related costs. Restructuring and related costs include restructuring and asset impairment charges as well as costs associated with our Strategic Transformation program. Separation costs. Separation costs are expenses incurred in connection with separation from Xerox Corporation into a separate, independent, publicly traded company. Separation costs primarily relate to third-party investment banking, accounting, legal, consulting and other similar types of services related to the separation transaction as well as costs associated with the operational separation of the two companies. Other expenses, net, excluding third party interest expense. Other expenses, net includes losses (gains) on sales of businesses and assets, currency (gains) losses, net, litigation matters and all other expenses, net. Adjusted Revenue, Costs and Expenses and Margin Adjusted Operating Income. We make adjustments to Revenue, Costs and Expenses and Margin for the following items, for the purpose of calculating Adjusted Operating Income. In 2016, we adjusted Income (Loss) before Income Taxes for the Goodwill Impairment charge of $935 million recorded during the fourth quarter As a result of the nature and the significant impact of the NY MMIS and HE charges on our reported revenues, costs and expenses, as well as key metrics for the period, we discussed our 2016 and 2015 Adjusted Operating Income after excluding the impact of the NY MMIS and HE charges. In 2016, we Adjusted Operating Income by adjusting Income (Loss) before Income Taxes for the fourth quarter NY MMIS charge of $161 million, which included an $83 million reduction in revenues. In 2015, we Adjusted Operating Income by adjusting Income (Loss) before Income Taxes for the third quarter HE charge of $389 million, which included a $116 million reduction in revenues. In addition to the items discussed above, for the three months and year ended December 31, 2016 and 2015 we Adjusted Operating Income for the following items: As defined above in Adjusted Net Income (Loss), Adjusted Earnings per Share, and Adjusted Effective Tax Rate:
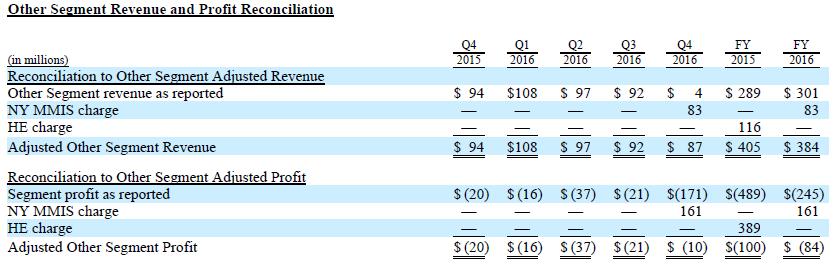
10 o Amortization of intangible assets. o Restructuring and related costs. o Separation costs. We also adjust Operating Income for: o Related Party Interest. Includes interest payments to former parent. o Other expenses, net. Including third party interest, losses (gains) on sales of businesses and assets, currency (gains) losses, net, litigation matters and all other expenses, net. Adjusted Revenues As a result of the nature and the significant impact of the NY MMIS and HE charges on our reported revenues, we discussed our 2016 and 2015 revenues excluding the impact of the NY MMIS and HE charges. For the fourth quarter and full year 2016, we reduced revenues by $83 million for NY MMIS. For the third quarter and full year 2015, we reduced revenues by $116 million to reflect the reduction in HE revenues. Adjusted EBITDA We use Adjusted EBITDA to provide additional information that is useful to understand the financial covenants contained in the Company s credit facility and indenture. We also use Adjusted EBITDA as an additional way of assessing certain aspects of our operations that, when viewed with the GAAP results and the accompanying reconciliations to corresponding GAAP financial measures, provide a more complete understanding of our core business. Adjusted EBITDA represents Income (loss) before Income Taxes adjusted for the following items: As defined above in Adjusted Net Income (Loss), Adjusted Earnings per Share, and Adjusted Effective Tax Rate section or Adjusted Revenue, Costs and Expenses and Margin Adjusted Operating Income section: o The fourth quarter of 2016 Goodwill Impairment Charge and NY MMIS charge. o The third quarter 2015 HE charge. o Amortization of intangible assets. o Restructuring and related costs. o Separation costs. o Related Party Interest. Includes interest payments to former parent. o Other expenses, net. Including third party interest, losses (gains) on sales of businesses and assets, currency (gains) losses, net, litigation matters and all other expenses, net. We also adjust EBITDA for: o Depreciation o NY MMIS depreciation o HE amortization Adjusted EBITDA is not intended to represent cash flows from operations, operating income (loss) or net income (loss) as defined by U.S. GAAP as indicators of operating performance and are not necessarily comparable to similarly-titled measures reported by other companies. Management cautions that amounts presented in accordance with Conduent s definition Adjusted EBITDA may not be comparable to similar measures disclosed by other companies because not all companies calculate Adjusted EBITDA in the same manner. Adjusted Other Segment Revenue and Profit As a result of the nature and the significant impact of the NY MMIS and HE charges on our Other Segment Revenue and Profit, we discuss Other Segment Revenue and Profit excluding the impact of the
11 NY MMIS and HE charges. In 2016, we adjusted Other Segment by adjusting for the fourth quarter NY MMIS charge of $161 million, which included an $83 million reduction in revenues. In 2015, we Adjusted Other Segment by adjusting for the third quarter HE charge of $389 million, which included a $116 million reduction in revenues. Free Cash Flow Free Cash Flow is defined as cash flows from operating activities as reported on the consolidated statement of cash flows, less cost of additions to land, buildings and equipment, cost of additions to internal use software and capital lease additions, plus proceed from sales of land, building and equipment. We use the non-gaap measure of Free Cash Flow as a criterion of liquidity and performance-based components of employee compensation. We use Free Cash Flow as a measure of liquidity to determine amounts we can reinvest in our core businesses, such as amounts available to make acquisitions, invest in land, buildings and equipment and internal use software, make principal payments on debt, or amounts we can return to our stockholders through dividends and/or stock repurchases. In order to provide a meaningful basis for comparison, we are providing information with respect to our Free Cash Flow for the three months and year ended December 31, 2016, reconciled for each such period to cash flow provided by operating activities, which we believe to be the most directly comparable measure under GAAP. Constant Currency To better understand trends in our business, we believe that it is helpful to adjust revenue to exclude the impact of changes in the translation of foreign currencies into U.S. Dollars. We refer to this adjusted revenue as constant currency. Currency impact can be determined as the difference between actual growth rates and constant currency growth rates.
12
13
14
Conduent Reports Third Quarter 2017 Results; Operating Income and Adjusted EBITDA Rise; Strong Cash Flow and Adjusted EPS; Healthy Renewal Rate
 News from Conduent Conduent Incorporated 100 Campus Drive, Suite 200 Florham Park, NJ 07932 www.conduent.com Conduent Reports Third Quarter 2017 Results; Operating Income and Adjusted EBITDA Rise; Strong
News from Conduent EXHIBIT Conduent Incorporated 100 Campus Drive, Suite 200 Florham Park, NJ
 News from Conduent Conduent Incorporated 100 Campus Drive, Suite 200 Florham Park, NJ 07932 www.conduent.com Conduent Reports First Quarter 2018 Results; Strong Operational and Financial Performance Led
February 21, Conduent Q4 & FY 2017 Earnings Results
 February 21, 2018 Conduent Q4 & FY 2017 Earnings Results Cautionary Statements Forward-Looking Statements This report contains forward-looking statements that involve risks and uncertainties. These statements
August 8, Conduent Q Earnings Results
 August 8, 2018 Conduent Q2 2018 Earnings Results Cautionary Statements Forward-Looking Statements This report contains forward-looking statements, as defined in the Private Securities Litigation Reform
December 5, Conduent Investor Presentation
 December 5, 2016 Conduent Investor Presentation Cautionary Statements Forward-Looking Statements This presentation contains forward-looking statements that involve risks and uncertainties. These statements
TransUnion Reports Third Quarter 2011 Results
 gb0 Contact E-mail David McCrary TransUnion investor.relations@transunion.com Telephone 312 985 2860 CHICAGO, November 7, 2011 TransUnion Reports Third Quarter 2011 Results TransUnion Corp. ( TransUnion
Web.com Reports Fourth Quarter and Full Year 2009 Financial Results
 Web.com Reports Fourth Quarter and Full Year 2009 Financial Results JACKSONVILLE, Fla., Feb. 9, 2010 (GLOBE NEWSWIRE) -- Web.com Group, Inc. (Nasdaq:WWWW), a leading provider of online marketing for small
FAIR ISAAC CORPORATION CONDENSED CONSOLIDATED BALANCE SHEETS (In thousands) (Unaudited)
 (Unaudited)") CONDENSED CONSOLIDATED BALANCE SHEETS (In thousands) June 30, September 30, 2018 2017 ASSETS: Current assets: Cash and cash equivalents $ 119,929 $ 105,618 Accounts receivable, net 182,419 168,586 Prepaid
CONDENSED CONSOLIDATED BALANCE SHEETS (In thousands) June 30, September 30, 2018 2017 ASSETS: Current assets: Cash and cash equivalents $ 119,929 $ 105,618 Accounts receivable, net 182,419 168,586 Prepaid
FAIR ISAAC CORPORATION CONDENSED CONSOLIDATED BALANCE SHEETS (In thousands) (Unaudited)
 (Unaudited)") CONDENSED CONSOLIDATED BALANCE SHEETS (In thousands) 2018 2017 ASSETS: Current assets: Cash and cash equivalents $ 90,023 $ 105,618 Accounts receivable, net 208,865 168,586 Prepaid expenses and other current
CONDENSED CONSOLIDATED BALANCE SHEETS (In thousands) 2018 2017 ASSETS: Current assets: Cash and cash equivalents $ 90,023 $ 105,618 Accounts receivable, net 208,865 168,586 Prepaid expenses and other current
First Quarter Results From Continuing Operations. Fiscal Year 2014
 News Release For Immediate Release: September 3, 2014 H&R Block Announces Fiscal 2015 First Quarter Results KANSAS CITY, Mo. - H&R Block, Inc. (NYSE: HRB), the world s largest consumer tax services provider,
Jabil Posts Third Quarter Results
 Jabil Posts Third Quarter Results Reaffirms EPS Targets for FY18 and FY19; Extends Capital Return Framework St. Petersburg, FL June 14, 2018. Today, Jabil Inc. (NYSE: JBL), reported preliminary, unaudited
Reconciliation of Non-GAAP Financial Measures. Adjusted Operating Income Reconciliation
 Reconciliation of Non-GAAP Financial Measures Adjusted Operating Income Reconciliation Adjusted operating income is not a measure of financial performance under generally accepted accounting principles
IQVIA Reports First-Quarter 2018 Results and Raises Full-Year 2018 Revenue Guidance
 News Release Contacts: Andrew Markwick, IQVIA Investor Relations (andrew.markwick@iqvia.com) +1.973.257.7144 Tor Constantino, IQVIA Media Relations (tor.constantino@iqvia.com) +1.484.567.6732 IQVIA Reports
Woodward Reports Fiscal Year 2016 Results and Fiscal Year 2017 Outlook. Fiscal 2016 Highlights
 FOR IMMEDIATE RELEASE CONTACT: Don Guzzardo Director, Investor Relations & Treasury 970-498-3580 Don.Guzzardo@woodward.com Woodward Reports Fiscal Year 2016 Results and Fiscal Year 2017 Outlook Fort Collins,
Weakening foreign currencies accounted for a reduction in emerging markets revenue of 4.9%.
 , Exhibit 99.1 Contact Evan Goad TransUnion E-mail investor.relations@transunion.com Telephone 312 985 2860 TransUnion Reports Fourth Quarter & Full Year 2012 Results CHICAGO, Feb. 25, 2013 TransUnion
CPI Card Group Inc. Reports Fourth Quarter and Full Year 2016 Results
 NEWS RELEASE CPI Card Group Inc. Reports Fourth Quarter and Full Year 2016 Results 3/1/2017 Q4 Net Sales of $67.4 million, Full Year 2016 Net Sales of $308.7 million Full Year Net Income from Continuing
Web.com Reports Record Fourth Quarter and Full Year 2012 Financial Results
 February 7, 2013 Web.com Reports Record Fourth Quarter and Full Year 2012 Financial Results Fourth quarter revenue and profitability exceed high end of Web.com's guidance Successful integration of Network
Science Applications International Corporation (SAIC) Third Quarter Fiscal Year 2018 Earnings Call. December 7, 2017
 Third Quarter Fiscal Year 2018 Earnings Call. December 7, 2017") Science Applications International Corporation (SAIC) Third Quarter Fiscal Year 2018 Earnings Call December 7, 2017 Supplemental Financial Information Conference Call Information Date: December 7, 2017
Science Applications International Corporation (SAIC) Third Quarter Fiscal Year 2018 Earnings Call December 7, 2017 Supplemental Financial Information Conference Call Information Date: December 7, 2017
Web.com Reports Fourth Quarter and Full Year 2017 Financial Results
 Web.com Reports Fourth Quarter and Full Year 2017 Financial Results Strong financial and operating performance in the fourth quarter Significant progress on strategic priorities for the year Generated
News Release H&R Block Announces Fiscal 2014 Results CEO Perspective
 News Release For Immediate Release: June 11, 2014 H&R Block Announces Fiscal 2014 Results Total revenues increased $118 million, or 4%, to $3.024 billion 1 EBITDA increased 8% to $940 million, or 31% of
Wind River Reports Fourth Quarter and Fiscal Year 2009 Results
 CONTACT: Ian Halifax Anne Marie McCauley Wind River Wind River Chief Financial Officer Vice President, Investor Relations +1.510.749.2155 +1.510.749.2551 ian.halifax@windriver.com annemarie.mccauley@windriver.com
Second Quarter Non-GAAP Financial Measures. Ursula Burns Chairman & CEO. Leslie Varon Chief Financial Officer (Interim) July 29, 2016
 July 29, 2016") Second Quarter 2016 Non-GAAP Financial Measures Ursula Burns Chairman & CEO Leslie Varon Chief Financial Officer (Interim) July 29, 2016 Non-GAAP Financial Measures NOTE: In 2016 we revised our calculation
Second Quarter 2016 Non-GAAP Financial Measures Ursula Burns Chairman & CEO Leslie Varon Chief Financial Officer (Interim) July 29, 2016 Non-GAAP Financial Measures NOTE: In 2016 we revised our calculation
FAIR ISAAC CORPORATION CONDENSED CONSOLIDATED BALANCE SHEETS (In thousands) (Unaudited)
 (Unaudited)") CONDENSED CONSOLIDATED BALANCE SHEETS (In thousands) June 30, September 30, 2016 2015 ASSETS: Current assets: Cash and cash equivalents $ 118,155 $ 86,120 Accounts receivable, net 155,196 158,773 Prepaid
CONDENSED CONSOLIDATED BALANCE SHEETS (In thousands) June 30, September 30, 2016 2015 ASSETS: Current assets: Cash and cash equivalents $ 118,155 $ 86,120 Accounts receivable, net 155,196 158,773 Prepaid
FAIR ISAAC CORPORATION CONDENSED CONSOLIDATED BALANCE SHEETS (In thousands) (Unaudited)
 (Unaudited)") CONDENSED CONSOLIDATED BALANCE SHEETS (In thousands) March 31, September 30, 2016 2015 ASSETS: Current assets: Cash and cash equivalents $ 85,374 $ 86,120 Accounts receivable, net 155,207 158,773 Prepaid
CONDENSED CONSOLIDATED BALANCE SHEETS (In thousands) March 31, September 30, 2016 2015 ASSETS: Current assets: Cash and cash equivalents $ 85,374 $ 86,120 Accounts receivable, net 155,207 158,773 Prepaid
IQVIA Reports Second-Quarter 2018 Results and Raises Full-Year 2018 Revenue and Profit Guidance
 News Release Contacts: Andrew Markwick, IQVIA Investor Relations (andrew.markwick@iqvia.com) +1.973.257.7144 Tor Constantino, IQVIA Media Relations (tor.constantino@iqvia.com) +1.484.567.6732 IQVIA Reports
Digital River, Inc. Second Quarter Results (Unaudited, in thousands) Subject to reclassification
 Subject to reclassification") (Unaudited, in thousands) Condensed Consolidated Balance Sheets As of December 31, 2008 2007 Assets: Current assets Cash and cash equivalents $ 276,927 $ 381,788 Short-term investments 201,297 315,636
(Unaudited, in thousands) Condensed Consolidated Balance Sheets As of December 31, 2008 2007 Assets: Current assets Cash and cash equivalents $ 276,927 $ 381,788 Short-term investments 201,297 315,636
VISTEON CORPORATION AND SUBSIDIARIES CONSOLIDATED STATEMENTS OF OPERATIONS (Dollars in Millions, Except Per Share Data) (Unaudited)
 (Unaudited)") CONSOLIDATED STATEMENTS OF OPERATIONS (Dollars in Millions, Except Per Share Data) (Unaudited) Three Months Ended Six Months Ended June 30 June 30 2018 2017 2018 2017 Sales $ 758 $ 774 $ 1,572 $ 1,584
CONSOLIDATED STATEMENTS OF OPERATIONS (Dollars in Millions, Except Per Share Data) (Unaudited) Three Months Ended Six Months Ended June 30 June 30 2018 2017 2018 2017 Sales $ 758 $ 774 $ 1,572 $ 1,584
FOR IMMEDIATE RELEASE
 FOR IMMEDIATE RELEASE For media inquiries, contact: Eric Armstrong, Citrix Systems, Inc. (954) 267-2977 or eric.armstrong@citrix.com For investor inquiries, contact: Eduardo Fleites, Citrix Systems, Inc.
TransUnion Announces Strong First Quarter 2018 Results and Agreement to Acquire Callcredit
 News Release TransUnion Announces Strong First Quarter 2018 Results and Agreement to Acquire Callcredit CHICAGO, April 20, 2018 - TransUnion (NYSE: TRU) (the Company ) today announced financial results
Aptiv Reports Record Second Quarter 2018 Financial Results; Raises Full Year Outlook
 Aptiv Reports Record Second Quarter 2018 Financial Results; Raises Full Year Outlook DUBLIN - Aptiv PLC (NYSE: APTV), a global technology company enabling the future of mobility, today reported second
HealthEquity Reports Fourth Quarter and Fiscal Year Ended January 31, 2018 Financial Results
 HealthEquity Reports Fourth Quarter and Fiscal Year Ended January 31, 2018 Financial Results Highlights of the fiscal year include: Revenue of $229.5 million, an increase of 29% compared to FY17. Net income
Trimble Reports Second Quarter 2018 Results
 Trimble Reports Second Quarter 2018 Results August 1, 2018 - Second Quarter 2018 Revenue $785.5 million - GAAP Diluted Earnings Per Share $0.25; Diluted Earnings Per Share $0.50 SUNNYVALE, Calif., Aug.
FOR IMMEDIATE RELEASE
 FOR IMMEDIATE RELEASE For media inquiries, contact: Eric Armstrong, Citrix Systems, Inc. (954) 267-2977 or eric.armstrong@citrix.com For investor inquiries, contact: Eduardo Fleites, Citrix Systems, Inc.
Cantel Medical Reports Financial Results for its First Quarter Fiscal Year 2019
 Cantel Medical Reports Financial Results for its First Quarter Fiscal Year 2019 November 29, 2018 Medical segment leads with strong double-digit growth - Net sales of $225.6M, up 6.0%, with organic sales
Intermolecular Announces Third Quarter 2017 Financial Results
 Intermolecular Announces Third Quarter 2017 Financial Results SAN JOSE, Calif., November 2, 2017 -- Intermolecular, Inc. (NASDAQ: IMI) today reported results for its Third Quarter ended September 30, 2017.
Verisk Reports First-Quarter 2018 Financial Results
 Verisk Reports First-Quarter 2018 Financial Results Revenue grew 15.6% to $581 million; organic constant currency revenue growth was 7.0%. Net income was $133 million; EBITDA, a non-gaap measure, was $269
CSG SYSTEMS INTERNATIONAL, INC. DISCLOSURES FOR NON-GAAP FINANCIAL MEASURES
 CSG SYSTEMS INTERNATIONAL, INC. DISCLOSURES FOR NON-GAAP FINANCIAL MEASURES Use of Non-GAAP Financial Measures and Limitations To supplement its condensed consolidated financial statements presented in
HealthEquity Reports Third Quarter Ended October 31, 2017 Financial Results
 HealthEquity Reports Third Quarter Ended 2017 Financial Results Highlights of the third quarter include: Revenue of $56.8 million, an increase of 31% compared to Q3 FY17. Net income of $10.5 million, an
Tableau Reports Second Quarter 2018 Financial Results
 Tableau Reports Second Quarter 2018 Financial Results SEATTLE, Wash. - August 2, 2018 - Tableau Software, Inc. (NYSE: DATA) today reported results for its second quarter ended June 30, 2018. "We saw strong
IQVIA Reports Third-Quarter 2018 Results and Updates Full-Year 2018 Guidance
 News Release Contacts: Andrew Markwick, IQVIA Investor Relations (andrew.markwick@iqvia.com) +1.973.257.7144 Tor Constantino, IQVIA Media Relations (tor.constantino@iqvia.com) +1.484.567.6732 IQVIA Reports
EVERETT, WA, October 26, Fortive Corporation ( Fortive ) (NYSE: FTV) today announced results for the third quarter 2017.
 (NYSE: FTV) today announced results for the third quarter 2017.") Fortive Reports Third Quarter Results EVERETT, WA, October 26, - Fortive Corporation ( Fortive ) (NYSE: FTV) today announced results for the third quarter. For the third quarter ended, net earnings were
Fortive Reports Third Quarter Results EVERETT, WA, October 26, - Fortive Corporation ( Fortive ) (NYSE: FTV) today announced results for the third quarter. For the third quarter ended, net earnings were
VISTEON CORPORATION AND SUBSIDIARIES CONSOLIDATED STATEMENTS OF OPERATIONS (Dollars in Millions, Except Per Share Data) (Unaudited)
 (Unaudited)") VISTEON CORPORATION AND SUBSIDIARIES CONSOLIDATED STATEMENTS OF OPERATIONS (Dollars in Millions, Except Per Share Data) (Unaudited) 2018 2017 Sales $ 814 $ 810 Cost of sales (685) (681) Gross margin 129
VISTEON CORPORATION AND SUBSIDIARIES CONSOLIDATED STATEMENTS OF OPERATIONS (Dollars in Millions, Except Per Share Data) (Unaudited) 2018 2017 Sales $ 814 $ 810 Cost of sales (685) (681) Gross margin 129
Digital River, Inc. Fourth Quarter Results (In thousands, except share data) Subject to reclassification
 Subject to reclassification") (In thousands, except share data) Consolidated Balance Sheets (Unaudited) 2012 2011 Assets Current assets Cash and cash equivalents $ 542,851 $ 497,193 Short-term investments 162,794 223,349 Accounts receivable,
(In thousands, except share data) Consolidated Balance Sheets (Unaudited) 2012 2011 Assets Current assets Cash and cash equivalents $ 542,851 $ 497,193 Short-term investments 162,794 223,349 Accounts receivable,
NetApp Reports Fourth Quarter and Fiscal Year 2018 Results
 May 23, 2018 NetApp Reports Fourth Quarter and Fiscal Year 2018 Results Net Revenues of $1.64 Billion for the Fourth Quarter and $5.91 Billion for Fiscal Year 2018 Net revenue for fiscal year 2018 increased
Web.com Reports Fourth Quarter and Full Year 2016 Financial Results
 Web.com Group, Inc. 12808 Gran Bay Parkway West Jacksonville, FL 32258 T: (904) 680-6600 F: (904) 880-0350 NASDAQ: WEB Web.com Reports Fourth Quarter and Full Year 2016 Financial Results Solid progress
Fourth-Quarter 2009 Earnings Presentation
 Fourth-Quarter 2009 Earnings Presentation Non-GAAP Financial Measures January 21, 2010 Non-GAAP Financial Measures Constant Currency : To better understand trends in our business, we believe that it is
Fourth Quarter 2018 Earnings Non-GAAP Financial Measures. January 29,
 Fourth Quarter 2018 Earnings Non-GAAP Financial Measures January 29, 2019 http://www.xerox.com/investor Non-GAAP Financial Measures We have reported our financial results in accordance with generally accepted
Beacon Roofing Supply Reports Fourth Quarter and Fiscal Year 2017 Results
 November 20, 2017 Beacon Roofing Supply Reports Fourth Quarter and Fiscal Year 2017 Results Record fourth quarter net sales of $1.3 billion (9.8% growth year-over-year) Fourth quarter EPS of $0.73 ($0.93
FOR IMMEDIATE RELEASE
 FOR IMMEDIATE RELEASE For media inquiries, contact: Eric Armstrong, Citrix Systems, Inc. (954) 267-2977 or eric.armstrong@citrix.com For investor inquiries, contact: Eduardo Fleites, Citrix Systems, Inc.
First Quarter 2017 Earnings
 First Quarter 2017 Earnings Jeff Jacobson, CEO Bill Osbourn, CFO April 25, 2017 http://www.xerox.com/investor Forward Looking Statements This presentation contains forward-looking statements as defined
PEGASYSTEMS ANNOUNCES THIRD QUARTER 2017 FINANCIAL RESULTS
 EXHIBIT 99.1 PEGASYSTEMS ANNOUNCES THIRD QUARTER 2017 FINANCIAL RESULTS Term License and Cloud ACV grew by 23% year over year Term License, Cloud, and Maintenance ACV grew by 17% year over year to $449
VISTEON CORPORATION AND SUBSIDIARIES CONSOLIDATED STATEMENTS OF OPERATIONS (Dollars in Millions, Except Per Share Data) (Unaudited)
 (Unaudited)") CONSOLIDATED STATEMENTS OF OPERATIONS (Dollars in Millions, Except Per Share Data) (Unaudited) 2016 2015 2016 2015 Sales $ 773 $ 812 $ 1,575 $ 1,628 Cost of sales 664 713 1,345 1,417 Gross margin 109 99
CONSOLIDATED STATEMENTS OF OPERATIONS (Dollars in Millions, Except Per Share Data) (Unaudited) 2016 2015 2016 2015 Sales $ 773 $ 812 $ 1,575 $ 1,628 Cost of sales 664 713 1,345 1,417 Gross margin 109 99
news FOR IMMEDIATE RELEASE
 news FOR IMMEDIATE RELEASE INVESTOR CONTACT: MEDIA CONTACT: Mark Kimbrough Ed Fishbough 615-344-2688 615-344-2810 HCA Reports First Quarter 2018 Results Nashville, Tenn., May 1, 2018 HCA Healthcare, Inc.
Sapiens Reports Second Quarter 2018 Financial Results
 Sapiens Reports Second Quarter 2018 Financial Results Ongoing Operational Improvements Deliver Margin Expansion Holon, Israel, August 7, 2018 Sapiens International Corporation, (NASDAQ and TASE: SPNS),
CPI Card Group Inc. Reports Fourth Quarter and Full Year 2015 Results
 CPI Card Group Inc. Reports Fourth Quarter and Full Year 2015 Results Fourth Quarter Net Sales of $93.6 million and Pro Forma Adjusted Diluted EPS of $0.16 Initiates Quarterly Dividend Announces 2016 Financial
McKESSON REPORTS FISCAL 2017 FOURTH-QUARTER AND FULL-YEAR RESULTS
 McKESSON REPORTS FISCAL 2017 FOURTH-QUARTER AND FULL-YEAR RESULTS Revenues of $48.7 billion for the fourth quarter and $198.5 billion for the full year, up 4% year-over-year. Fourth-quarter GAAP earnings
SailPoint Announces Second Quarter 2018 Financial Results
 Exhibit 99.1 SailPoint Announces Second Quarter 2018 Financial Results Q2 total revenue of $54.6 million, up 39% year-over-year Subscription revenue up by 53% year-over-year AUSTIN, August 8, 2018 SailPoint
NXP Semiconductors Reports Second Quarter 2015 Results
 Q2 2015 Revenue $1,506 million GAAP Gross margin 48.1% GAAP Operating margin 22.0% GAAP Diluted earnings per share $1.23 Non-GAAP Gross margin 48.7% Non-GAAP Operating margin 27.8% Non-GAAP Diluted earnings
Digital River, Inc. First Quarter Results (In thousands, except share data) Subject to reclassification
 Subject to reclassification") (In thousands, except share data) Consolidated Balance Sheets (Unaudited) December 31, Assets Current assets Cash and cash equivalents $ 500,742 $ 542,851 Short-term investments 144,615 162,794 Accounts
(In thousands, except share data) Consolidated Balance Sheets (Unaudited) December 31, Assets Current assets Cash and cash equivalents $ 500,742 $ 542,851 Short-term investments 144,615 162,794 Accounts
FOR IMMEDIATE RELEASE:
 Investor Relations Contacts: Antonella Franzen +1-609-720-4665 afranzen@tyco.com Media Contact: Stephen Wasdick +1-609-806-2262 swasdick@tyco.com Leila Peters +1-609-720-4545 lpeters@tyco.com FOR IMMEDIATE
Earnings Presentation 3rd Quarter, 2018
 Earnings Presentation 3rd Quarter, 2018 Forward-Looking Statements This presentation contains forward-looking statements within the meaning of Section 27A of the Securities Act of 1933, as amended, Section
CTS Announces First Quarter 2018 Results. Strong sales and earnings growth
 Press Release April 26, 2018 FOR IMMEDIATE RELEASE CTS Announces First Quarter 2018 Results Strong sales and earnings growth Lisle, Ill. - CTS Corporation (NYSE: CTS) today announced first quarter 2018
Corporate Director, Investor Relations & Treasury Woodward Reports First Quarter Fiscal Year 2018 Results
 FOR IMMEDIATE RELEASE News Release Woodward, Inc. 1081 Woodward Way Fort Collins, Colorado 80524, USA Tel: 970-482-5811 CONTACT: Don Guzzardo Corporate Director, Investor Relations & Treasury 970-498-3580
GP Strategies Reports Fourth Quarter 2015 Earnings of $0.37 Per Share
 NEWS RELEASE GP Strategies Reports Fourth Quarter 2015 Earnings of $0.37 Per Share Columbia, MD. February 25, 2016. Global performance improvement solutions provider GP Strategies Corporation (NYSE: GPX)
Second Quarter 2017 Reconciliation of Non-GAAP Financial Measures
 Second Quarter 2017 Reconciliation of Non-GAAP Financial Measures Adjusted Operating Income Reconciliation Adjusted operating income is not a measure of financial performance under generally accepted accounting
H&R Block Announces Fiscal 2013 Results. June 12, :05 PM ET. KANSAS CITY, MO -- (Marketwired) -- 06/12/13 -- H&R Block, Inc.
 -- 06/12/13 -- H&R Block, Inc.") H&R Block Announces Fiscal 2013 Results June 12, 2013 4:05 PM ET KANSAS CITY, MO -- (Marketwired) -- 06/12/13 -- H&R Block, Inc. (NYSE: HRB) Earnings per share(1) from continuing operations of $1.69, up
H&R Block Announces Fiscal 2013 Results June 12, 2013 4:05 PM ET KANSAS CITY, MO -- (Marketwired) -- 06/12/13 -- H&R Block, Inc. (NYSE: HRB) Earnings per share(1) from continuing operations of $1.69, up
Kratos' Fourth Quarter and Fiscal 2017 Financial Results Exceed Company's Estimates
 February 28, 2018 Kratos' Fourth Quarter and Fiscal 2017 Financial Results Exceed Company's Estimates Fourth Quarter 2017 Revenues of $202.2 Million Increase 11.0 Percent over Fourth Quarter of 2016 Fiscal
Science Applications International Corporation (SAIC) FY16 Second Quarter Earnings Call September 1, 2015
 FY16 Second Quarter Earnings Call September 1, 2015") Science Applications International Corporation (SAIC) FY16 Second Quarter Earnings Call September 1, 2015 Supplemental Financial Information SAIC. All rights reserved. Conference Call Information Date:
Science Applications International Corporation (SAIC) FY16 Second Quarter Earnings Call September 1, 2015 Supplemental Financial Information SAIC. All rights reserved. Conference Call Information Date:
MYR Group Inc. Announces First-Quarter 2018 Results
 MYR Group Inc. Announces First-Quarter 2018 Results May 2, 2018 ROLLING MEADOWS, Ill., May 02, 2018 (GLOBE NEWSWIRE) -- MYR Group Inc. ( MYR ) (NASDAQ:MYRG), a holding company of leading specialty contractors
Sealed Air Reports Fourth Quarter and Full Year 2018 Results
 Exhibit 99.1 Sealed Air Corporation 2415 Cascade Pointe Blvd. Charlotte, NC 28208 For release: February 7, 2019 Sealed Air Reports Fourth Quarter and Full Year 2018 Results Solid year-over-year sales and
QuinStreet Reports Q1 Financial Results and Corporate Restructuring
 November 9, 2016 QuinStreet Reports Q1 Financial Results and Corporate Restructuring Company Announces Stock Repurchase Program FOSTER CITY, Calif., Nov. 09, 2016 (GLOBE NEWSWIRE) -- QuinStreet, Inc. (Nasdaq:QNST),
Verisk Reports Third-Quarter 2018 Financial Results
 Verisk Reports Third-Quarter 2018 Financial Results Revenue grew 9.0% to $599 million; organic constant currency revenue growth was 4.7%. Normalizing for the revenue associated with exceptional storm activity
FOR IMMEDIATE RELEASE
 FOR IMMEDIATE RELEASE For media inquiries, contact: Eric Armstrong, Citrix Systems, Inc. (954) 267-2977 or eric.armstrong@citrix.com For investor inquiries, contact: Eduardo Fleites, Citrix Systems, Inc.
Cenveo Reports Third Quarter 2016 Results
 News Release Cenveo Reports Third Quarter Results - Redeeming 50% of Remaining 11.5% Notes, Repurchased Most of 7% Convertible Notes - STAMFORD, CT (November 2, ) - Cenveo, Inc. (NYSE: CVO) reported financial
LogMeIn Announces Fourth Quarter and Fiscal Year 2017 Results
 NEWS RELEASE LogMeIn Announces Fourth Quarter and Fiscal Year 2017 Results 2/15/2018 BOSTON, Feb. 15, 2018 (GLOBE NEWSWIRE) -- LogMeIn, Inc. (NASDAQ:LOGM), a leading provider of cloud-based connectivity,
Ceridian Reports Second Quarter 2018 Results
 Ceridian Reports Second Quarter 2018 Results Cloud revenue of $127.8 million, up 35.5% year-over-year Total revenue of $179.3 million, up 13.8% year-over-year Operating loss of $11.3 million, which includes
Science Applications International Corporation (SAIC) Second Quarter Fiscal Year 2019 Earnings Call. September 10, 2018
 Second Quarter Fiscal Year 2019 Earnings Call. September 10, 2018") Science Applications International Corporation (SAIC) Second Quarter Fiscal Year 2019 Earnings Call September 10, 2018 Supplemental Financial Information Conference Call Information Date: September 10,
Science Applications International Corporation (SAIC) Second Quarter Fiscal Year 2019 Earnings Call September 10, 2018 Supplemental Financial Information Conference Call Information Date: September 10,
VISTEON CORPORATION AND SUBSIDIARIES CONSOLIDATED STATEMENTS OF OPERATIONS (Unaudited, Dollars in Millions, Except Per Share Data)
") VISTEON CORPORATION AND SUBSIDIARIES CONSOLIDATED STATEMENTS OF OPERATIONS (Unaudited, Dollars in Millions, Except Per Share Data) Three Months Ended 2017 2016 2017 2016 Sales $ 797 $ 816 $ 3,146 $ 3,161
VISTEON CORPORATION AND SUBSIDIARIES CONSOLIDATED STATEMENTS OF OPERATIONS (Unaudited, Dollars in Millions, Except Per Share Data) Three Months Ended 2017 2016 2017 2016 Sales $ 797 $ 816 $ 3,146 $ 3,161
FIS Reports Fourth Quarter and Full-Year 2017 Results and 2018 Guidance
 News Release FIS Reports Fourth Quarter and Full-Year 2017 Results and 2018 Guidance Fourth Quarter 2017 GAAP revenue of $2,329 million Diluted EPS from continuing operations of $2.93, and Adjusted EPS
Non-GAAP Financial Measures
 Non-GAAP Financial Measures Non-GAAP Financial Measures Constant Currency : To better understand trends in our business, we believe that it is helpful to adjust revenue to exclude the impact of changes
GP Strategies Reports Second Quarter 2018 Financial Results
 NEWS RELEASE GP Strategies Reports Second Quarter 2018 Financial Results Columbia, MD. July 31, 2018. Global performance improvement solutions provider GP Strategies Corporation (NYSE: GPX) today reported
Globus Medical Reports Second Quarter 2016 Results
 Globus Medical Reports Second Quarter Results AUDUBON, Pa., July 26, (GLOBE NEWSWIRE) -- Globus Medical, Inc. (NYSE:GMED), a leading musculoskeletal implant manufacturer, today announced its financial
Third Quarter 2017 Earnings Non-GAAP Financial Measures
 Third Quarter 2017 Earnings Non-GAAP Financial Measures Jeff Jacobson, CEO Bill Osbourn, CFO October 26, 2017 http://www.xerox.com/investor Non-GAAP Financial Measures We have reported our financial results
Globus Medical Reports 2014 First Quarter Results
 Globus Medical Reports First Quarter Results AUDUBON, PA, April 29, : Globus Medical, Inc. (NYSE:GMED), a leading musculoskeletal implant manufacturer, today announced its financial results for the first
Ceridian Reports First Quarter 2018 Results
 Ceridian Reports First Quarter 2018 Results Cloud revenue of $125.2 million, up 38.0% year-over-year Total revenue of $208.9 million, up 11.7% year-over-year HCM operating profit of $27.3 million, up 150.5%
Kennametal Announces Fiscal 2019 Second Quarter Results
 Kennametal Announces Fiscal 2019 Second Quarter Results February 4, 2019 Company posts strong earnings per share and margin expansion on eighth consecutive quarter of growth Q2 FY19 Highlights - Earnings
McKESSON REPORTS FISCAL 2017 FIRST-QUARTER RESULTS
 McKESSON REPORTS FISCAL 2017 FIRST-QUARTER RESULTS Revenues of $49.7 billion for the first quarter, up 5% year-over-year. First-quarter GAAP earnings per diluted share from continuing operations of $2.88,
Symantec Reports Fourth Quarter and Fiscal Year 2017 Results
 Logo Financial Highlights Symantec Reports Fourth Quarter and Fiscal Year 2017 Results Q4 GAAP revenue $1.115 billion, up 28% year over year; non-gaap revenue $1.176 billion, up 35% year over year Fiscal
Second Quarter Non-GAAP Financial Measures. Jeff Jacobson, CEO Bill Osbourn, CFO. August 1, 2017
 Second Quarter 2017 Non-GAAP Financial Measures Jeff Jacobson, CEO Bill Osbourn, CFO August 1, 2017 http://www.xerox.com/investor Non-GAAP Financial Measures We have reported our financial results in accordance
CORELOGIC REPORTS FOURTH QUARTER AND FULL-YEAR 2016 FINANCIAL RESULTS
 NEWS FOR IMMEDIATE RELEASE CORELOGIC REPORTS FOURTH QUARTER AND FULL-YEAR 2016 FINANCIAL RESULTS Full-Year 2016 Revenues, Operating Income, Operating Cash Flow, and Free Cash Flow Up Double-Digits From
First Quarter and Recent Business Highlights
 Allscripts announces first quarter 2017 results Bookings total $286 million, 13 percent growth year-over-year Revenue grows 20 percent year-over-year; GAAP revenue $413 million, $415 million non-gaap GAAP
NCR Announces Fourth Quarter and Full Year 2018 Results
 NCR Corporation Logo NCR Announces Fourth Quarter and Full Year 2018 Results February 7, 2019 ATLANTA--(BUSINESS WIRE)--Feb. 7, 2019-- NCR Corporation (NYSE: NCR) reported financial results today for the
Kratos Reports Fourth Quarter and Fiscal Year 2018 Financial Results
 Kratos Reports Fourth Quarter and Fiscal Year 2018 Financial Results February 28, 2019 Provides Initial Full Year and First Quarter Fiscal 2019 Financial Guidance SAN DIEGO, Feb. 28, 2019 (GLOBE NEWSWIRE)
HPE Reports Fiscal 2016 Third Quarter Results
 Hewlett Packard Enterprise 3000 Hanover Street Palo Alto, CA 94304 hpe.com News Release HPE Reports Fiscal 2016 Third Quarter Results Editorial contact Kate Holderness, Hewlett Packard Enterprise corpmediarelations@hpe.com
IQVIA Reports Fourth-Quarter and Full-Year 2017 Results, Issues First-Quarter and Full-Year 2018 Guidance
 News Release Contacts: Andrew Markwick, IQVIA Investor Relations (andrew.markwick@iqvia.com) +1.973.257.7144 Tor Constantino, IQVIA Media Relations (tor.constantino@iqvia.com) +1.484.567.6732 IQVIA Reports
Trimble Reports First Quarter Revenue of $289.0 Million and Non-GAAP Earnings Per Share of $0.28
 Trimble Reports First Quarter Revenue of $289.0 Million and Non-GAAP Earnings Per Share of $0.28 SUNNYVALE, Calif., April 28, 2009 /PRNewswire-FirstCall via COMTEX News Network/ -- Trimble (Nasdaq: TRMB)
Contact Information: Investor Relations Roper Industries, Inc.
 Contact Information: Investor Relations 941-556-2601 investor-relations@roperind.com Roper Industries, Inc. Roper Industries Announces Record Third Quarter Results GAAP Diluted Earnings Per Share (DEPS)
Investor Contact: Aida Orphan Media Contact: Amber McCasland (415) (415)
 (415)") FOR IMMEDIATE RELEASE Investor Contact: Aida Orphan Media Contact: Amber McCasland Levi Strauss & Co. Levi Strauss & Co. (415) 501-6194 (415) 501-7777 Investor-relations@levi.com newsmediarequests@levi.com
FOR IMMEDIATE RELEASE Investor Contact: Aida Orphan Media Contact: Amber McCasland Levi Strauss & Co. Levi Strauss & Co. (415) 501-6194 (415) 501-7777 Investor-relations@levi.com newsmediarequests@levi.com
Verisk Reports Second-Quarter 2018 Financial Results
 Verisk Reports Second-Quarter 2018 Financial Results Revenue grew 14.9% to $601 million; organic constant currency revenue growth was 7.4%. Net income was $154 million; adjusted EBITDA, a non-gaap measure,
ACXIOM ANNOUNCES FIRST QUARTER RESULTS. Total Revenue Grows 9% Year-over-Year. Enters Into Definitive Agreement to Sell Impact Business
 For more information, contact: Lauren Dillard Investor Relations (650) 372-2242 investor.relations@acxiom.com EACXM ACXIOM ANNOUNCES FIRST QUARTER RESULTS Total Revenue Grows 9% Year-over-Year Enters Into