INTERIM FINANCIAL STATEMENTS 1 st HY 2012
|
|
|
- Logan Craig
- 6 years ago
- Views:
Transcription


1 INTERIM FINANCIAL STATEMENTS 1 st HY 2012
2 CONTENT Condensed Group Management Report 1 st HY KTM Share...5 Condensed Consolidated Interim Financial Statements 1 st HY Condensed Notes to the Interim Financial Statements 1 st HY Statement by the Authorized Representatives...14
3 CONDENSED GROUP MANAGEMENT REPORT 1 st HY 2012 Business development In the first half of 2012 KTM managed to increase turnover by EUR 32.3 million to EUR million compared to previous year and sales to 45,400 vehicles (+23.2 % compared to previous year). Including the Duke 200 units sold by our partner Bajaj in India for the first time, KTM achieved record sales of 50,233 motorcycles (+36.5 % compared to previous year) sold worldwide in the first half of With the sales agreement of December 22 nd, 2011 effective January 1 st, 2012 KTM-Sportmotorcycle AG sold the branch companies for exhaust pipe manufacturing and frame production to WP Components GmbH (former: WP Radiator GmbH) and WP Performance Systems GmbH (former: WP Suspension Austria GmbH). Consequently the KTM staff was reduced by 186 employees. The 24 th Ordinary General Meeting on April 20 th, 2012 passed among others the resolution to change the company name of KTM Power Sports AG to. With the short and concise company name the focus on the brand KTM is increased. The new company name was registered in the commercial register on May 4th, Market trend Compared to previous year, the overall European market 1 dropped by 12.8 % to 276,478 vehicles registered in the first half of The decrease is primarily related to the downward trend in the largest European markets such as Italy (-30.3 %), Spain (-29.9 %), and France (-8.7 %). For the first time KTM s European market share increased to 7.0 % which is a 40.9 % increase compared to previous year. In the overall US market 2, registrations in the first half year 2012 slightly increased by 1.2 % compared to previous year to 224,167 vehicles. KTM succeeded in increasing its share in the overall US market by 0.6 percentage points to 3.1 %. Sales per unit trend In the first half of 2012 we sold 43,158 Fullsize 3 motorcycles (+9,114 motorcycles compared to previous year) out of which 21,563 motorcycles (+1,919 motorcycles compared to previous year) were sold in the offroad segment and 21,595 motorcycles (+7,195 motorcycles compared to previous year) in the street segment. Sales in the sportminicycle segment decreased to motorcycles (-507 units compared to last year). In the first half of 2012 we sold 303 ATVs (-72 ATVs compared to last year) and 54 X-Bows (+25 X- Bows compared to previous year). By region, sales in North America (USA and Canada) our largest single market increased to 8,535 vehicles (+3,263 vehicles compared to prior year). 1 Motorcycles >120 ccm, excluding Motocross, Scooters and ATVs 2 Motorcycles >120 ccm, including Motocross, excluding Scooters and ATVs 3 Motorcycles >120 ccm
. Sales of sportminicycles decreased to EUR 4.9 million (-24.1 % compared to previous year). Sales in the street segment increased to EUR 119.2 million (+20.")
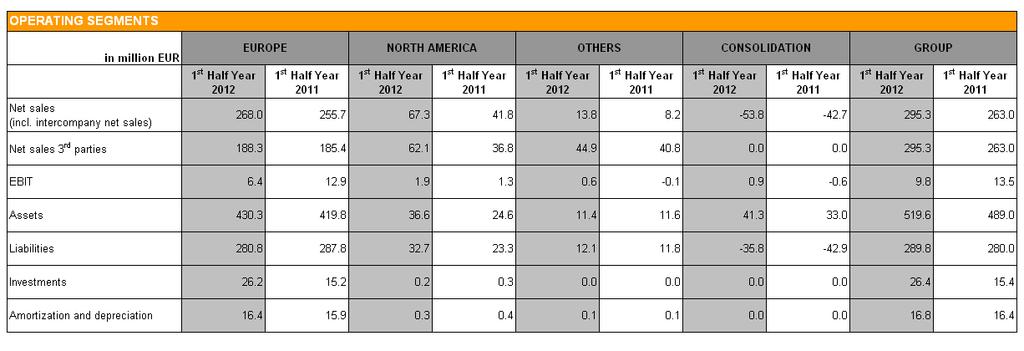
4 Revenue trend Due to a higher demand for Enduro 2-stroke models (+2,088 motorcycles compared to previous year) sales in the offroad segment increased to EUR million (+13.5 % compared to previous year). Sales of sportminicycles decreased to EUR 4.9 million (-24.1 % compared to previous year). Sales in the street segment increased to EUR million (+20.9 % compared to previous year) especially due to the successful sale of the Duke 125 and Duke 200 developed in cooperation with Bajaj (+4,099 motorcycles in the first half of 2012) and the successful launch of the Duke 690 (+3,366 motorcycles in the first half of 2012). Sales of ATVs dropped to EUR 1.7 million (-19.1 % compared to previous year) and sales in the segment Related Products remained stable by EUR 51.6 million (-1.7 % compared to previous year). By region, sales in Europe increased slightly to EUR million (+1.6 % compared to previous year). In the US sales increased to EUR 62.1 million (+68.9 % compared to previous year). In the rest of the world sales increased by 9.3 % to EUR 45.0 million due to higher sales in Asia, Australia and Africa. Outlook Due to the Euro crisis the declining development on the European market is expected to continue. In contrast, the US market shows a stable respectively slightly positive development. By launching new models KTM consequently follows a global product strategy and expansion into Asian markets. Under these circumstances KTM expects further increases in sales and turnover for 2012.
 by 4.26 %. The highest closing price in a period of twelve months was EUR 44.00; the lowest closing price was EUR 37.20. As of June 30 th, 2012 the market capitalization for 10,845,000 shares admitted for trading amounted to EUR 475.")
5 KTM SHARE The KTM share developed positive in the first half year 2012 closing at EUR on the last trading day (June 29 th, 2012). Compared to previous year the market price rose from EUR (June 29 th, 2011) by 4.26 %. The highest closing price in a period of twelve months was EUR 44.00; the lowest closing price was EUR As of June 30 th, 2012 the market capitalization for 10,845,000 shares admitted for trading amounted to EUR million. Shareholder structure by shareholder rights (by share capital) Number of shares: 10,845,000 Freefloat and others < 2 % Bajaj Auto Ltd % CROSS Industries AG 51.6%

6 Contact Viktor Sigl, MBA Betriebsgebiet Süd Stallhofnerstraße Mattighofen Tel.: ir@ktm.com Website:

7 CONDENSED CONSOLIDATED INTERIM FINANCIAL STATEMENTS 1 st HY 2012

8 CONDENSED CONSOLIDATED INTERIM FINANCIAL STATEMENTS 1 st HY 2012

9 CONDENSED CONSOLIDATED INTERIM FINANCIAL STATEMENTS 1 st HY 2012


10
11 CONDENSED NOTES TO THE INTERIM FINANCIAL STATEMENTS 1 st HY 2012 Accounting Principles The Interim Financial Statements of (former: KTM Power Sports AG) as of June 30 th, 2012 were prepared in accordance with the International Financial Reporting Standards (IFRS) as adopted by the EU considering IAS 34 Interim Financial Reporting. The Interim Financial Statements were neither audited nor reviewed by a certified public accountant. The accounting and valuation methods used for the Consolidated Financial Statements as of December 31 st, 2011 were applied unchanged. For further information regarding the accounting and valuation methods please see the Notes to the Consolidated Financial Statements for the reporting period ended December 31 st, The accounting and valuation methods applied therein constitute the basis for the present Interim Financial Statements. The accounting principles of the companies included in the condensed Consolidated Financial Statements are based on standard accounting principles. These principles were fully applied by all consolidated companies. Consolidation Scope All key subsidiaries that are under the legal or constructive control of are included in the present Interim Financial Statements. In addition to the parent company, 14 companies, of which nine are foreign and five Austrian, have been fully consolidated as of June 30 th, In June 2012 the newly founded company KTM-Sportmotorcycle India Private Limited, Pune, India, was consolidated for the first time. The company s main business is quality control of motorcycles produced in India. The negative goodwill in the amount of TEUR 13 is reported as other operating income in the Consolidated Income Statement. Estimates To a certain extent, estimates and assumptions have to be made in the Consolidated Financial Statements. These estimates have an impact on assets and liabilities, the disclosure of contingent liabilities at the balance sheet date and the expenses and income in the reporting period. The subsequent actual amounts may then differ from such estimates. Seasonality The KTM group s sales are subject to seasonality and thus sales are more likely to be lower in the first and last quarter than in the middle of the business year.
12 Notes to the Consolidated Income Statement In the first half of 2012 the gross operating profit rose by 6.0 % to EUR 77.5 million compared to previous year due to an increased business volume resulting in a gross margin ratio of 26.2 %. Overhead costs increased from EUR million in the previous year to EUR million (+13.6 % compared to previous year). Earnings before interest and taxes (EBIT) decreased from EUR 13.5 million to EUR 9.8 million. The financial result improved slightly by EUR 0.1 million to EUR -5.3 million. Net income decreased from EUR 7.9 million in the previous year to EUR 3.8 million. Notes to the Consolidated Statement of Comprehensive Income The cash flow hedge reserve reduced the group s equity by EUR 0.4 million net. Net income increased the group s equity in the first six months by EUR 3.8 million. The comprehensive income after taxes resulted in an increase of the group s equity by EUR 2.5 million. Notes to the Condensed Consolidated Balance Sheet Compared to December 31 st, 2011 total assets increased by 7.0 % from EUR million to EUR million. Trade accounts receivable increased by EUR 29.6 million to EUR 79.5 million; taking into account the receivables sold by the end of the first half year 2012 in the framework of the ABS transaction, the increase amounts to EUR 29.5 million. Inventories decreased by EUR 15.9 million to EUR 98.1 million compared to December 31 st, Other current assets increased by EUR 4.7 million to EUR 14.5 million, due to higher accounts receivables from taxes. Funding The net debt decreased by EUR 0.3 million to EUR million in the first half of The gearing ratio is 54.2 % (56.9 % as of December 31 st, 2011). By the end of April 2012 a EUR 85.0 million bond with a 5 year term was issued successfully. Due to the high demand the originally planned volume of EUR 75.0 million was increased by EUR 10.0 million to EUR 85.0 million. The bond is listed for trading on the Regulated Market of the Vienna Stock Exchange in a denomination of EUR and an interest rate of %. The proceeds were used exclusively for the partial early repayment of bank loans granted to group companies in In combination with the capital increase in the amount of EUR 8.4 million a solid long-term recapitalization could be assured for the next five years. Notes to the Consolidated Cash Flow Statement Compared to the previous year the free cash flow decreased from EUR 14.0 million to EUR -7.9 million. This development can be primarily attributed to higher investments and lower payables.
13 Notes to the Condensed Consolidated Statement of Changes in Equity Equity increased from EUR million to EUR million. In accordance with the Management Board resolution of May 11 th, 2012 under partial utilization of the authorization according to article 4.4. of the Articles of Association the share capital was increased against contribution in kind by TEUR 336 to TEUR according to article 150 para 1 of the Austrian Public Companies Act (AktG) by issuing 336,000 new bearer shares at a nominal value of EUR 1.00 each and an issuing price of EUR per share. The shares issued are qualifying shares from January 1 st, The shareholders legal subscription rights were eliminated according to article 170 para 2 of the Austrian Public Companies Act (AktG). CROSS Industries AG took over all new shares contributing its claim to at a nominal value of EUR 8.4 million. The capital increase was registered on June 6 th, Related Parties Transactions All products and services rendered and received from related companies and individuals as stated in the Consolidated Financial Statements as of December 31 st, 2011 are carried out at arm s lengths. In the first half of 2012 there have been no material changes. Events after June 30 th, 2012 There have been no reportable events after June 30 th, 2012.
14 Statement by the Authorized Representatives We, the management board of, confirm to the best of our knowledge that the condensed interim financial statements for the first six months of 2012 give a true and fair view of the assets, liabilities, financial position and profit or loss of the group as required by the applicable accounting standards and that the group management report gives a true and fair view of important events that have occurred during the first six months of the financial year and their impact on the condensed interim financial statements, of the principal risks and uncertainties for the remaining six months of the financial year and of the major related party transactions to be disclosed. The Management Board of August 2012 Stefan Pierer, CEO Harald Plöckinger, Board Member Friedrich Roithner, Board Member Viktor Sigl, MBA, Board Member Hubert Trunkenpolz, Board Member Press date: August 28 th, 2012 While every care was taken in compiling this report and checking that the data it contains is correct, slight differences in totals from adding up rounded amounts and percentages, typographical errors and misprints cannot be excluded. This report and the forward-looking statements it contains were prepared on the basis of all data and information available at the time of going to press. We wish to point out, however, that various factors may cause the actual results to deviate from the forward-looking statements given in the report.
INTERIM FINANCIAL 1. HY 2017
 INTERIM FINANCIAL S TAT E M E N T S 1. HY 2017 FOR THE FIRST HALF YEAR FROM JANUARY 1 TO JUNE 30, 2017 O F K T M A G, M AT T I G H O F E N 1 KTM OVERVIEW EUR million EARNINGS RATIOS 1. HY 2017 1. HY 2016
F I N A N C I A L R E P O R T H1 2014
 FINANCIAL REPORT H1 2014 AT A GLANCE H1 2014 H1 2013 in m in m Earnings figures Revenues 527.5 452.2 EBITDA 72.4 48.1 EBITDA margin 13.7% 10.6% Result from operating activities 44.8 23.4 EBIT margin 8.5%
REPORT Q AUTOMOTIVE TECHNOLOGY.
 REPORT Q1 2016 AUTOMOTIVE TECHNOLOGY. +7% +20% +22% +9% AT A GLANCE Earnings Figures Q1 2015 Q1 2016 Chg. in % Revenues in m 312.4 333.4 7 EBITDA in m 42.7 51.4 20 EBIT in m 28.1 34.3 22 Result of the
At a Glance H H1 2012
 Financial Report H1 2013 At a Glance H1 2013 H1 2012 in m in m Earnings figures Revenues 442.8 381.3 EBITDA 48.0 42.6 EBITDA margin 10.8% 11.2% Operating income (EBIT) 22.7 18.8 EBIT margin 5.1% 4.9% Net
+10% +10% TABLE OF CONTENTS
 REPORT Q1-3 2016 2 TABLE OF CONTENTS INTERIM CONSOLIDATED MANAGEMENT REPORT...4 Company...4 Employees...5 Economic environment...5 Revenues and earnings...6 Balance sheet and financial position...7 Cash
REPORT H AUTOMOTIVE TECHNOLOGY.
 REPORT H1 2016 AUTOMOTIVE TECHNOLOGY. TABLE OF CONTENTS TABLE OF CONTENTS Figures...3 Interim consolidated management report...4 Company...4 Employees...4 Economic environment...5 Revenues and earnings...5
HIGHLIGHTS H Increase of 417 employees. Record sales of more than 110,000 motorcycles in the first half year 2017
 REPORT H1 2017 2 HIGHLIGHTS H1 2017 Investments in the amount of 87.6 m Record sales of more than 110,000 motorcycles in the first half year 2017 Increase of 417 employees Record revenue of 758.8 m Stefan
QUARTERLY REPORT. 30 September 2017
 QUARTERLY REPORT 2017 CONTENTS 1 Page 4 BMW GROUP IN FIGURES 2 INTERIM GROUP MANAGEMENT REPORT Page 11 Page 11 Page 13 Page 18 Page 19 Page 21 Page 31 Page 31 Page 38 Page 39 Report on Economic Position
Report on the Third Quarter of 2012/13 (May 2012 January 2013)
") Report on the Third Quarter of 2012/13 (May 2012 January 2013) 1 Wolford Group Key Data Earnings Data 05/12-01/13 05/11-01/12 Chg. % 2011/12 Revenues in mill. 124.13 121.13 +2 154.06 EBITDA in mill. 9.79
Report on the Third Quarter of 2012/13 (May 2012 January 2013) 1 Wolford Group Key Data Earnings Data 05/12-01/13 05/11-01/12 Chg. % 2011/12 Revenues in mill. 124.13 121.13 +2 154.06 EBITDA in mill. 9.79
Interim Report. July September July- Sept. Sept
 Q3 Interim Report July September Doro AB Corporate Identity Number 556161-9429 18.2% Net sales growth 8.9% EBIT margin Growth in all markets and improved margins July September Net sales amounted to SEK
FINANCIAL REPORT H1 2017
 FINANCIAL REPORT H1 2017 02_Key Figures 03_Group Status Report 05_Consolidated Financial Statements 10_Notes 11_Declaration of Legal Representatives 02 PANKL KEY FIGURES PROFITABILITY RATIOS 2013 2014
CASH FLOW Cash flow from operating activities 66,599 20,389 70,348 71,673 83, % Free cash flow 42,318 8,420 33,077 15,572 25,
 ANNUAL REPORT 2013 KTM AT A GLANCE EURk 2009/2010 Sep. 1, 2010 2011 2012 2013 Change Dec. 31, 2010 EARNINGS RATIOS Revenue 459,795 131,584 526,801 612,008 716,390 17.1% EBITDA 54,576 18,178 64,495 67,838
QUARTERLY REPORT. 30 June 2017
 QUARTERLY REPORT 30 June 2017 CONTENTS 1 Page 4 BMW GROUP IN FIGURES 2 INTERIM GROUP MANAGEMENT REPORT Page 11 Page 11 Page 13 Page 18 Page 19 Page 21 Page 31 Page 31 Page 38 Page 39 Report on Economic
FY2017 Consolidated Financial Results (Japanese Accounting Standards) May 14, 2018
 May 14, 2018") Consolidated Financial Results (Japanese Accounting Standards) May 14, 2018 Company name : Nissan Motor Co., Ltd. Code no : 7201 (URL https://www.nissan-global.com/en/ir/)
Consolidated Financial Results (Japanese Accounting Standards) May 14, 2018 Company name : Nissan Motor Co., Ltd. Code no : 7201 (URL https://www.nissan-global.com/en/ir/)
Half-Year Report Geberit Group
 Half-Year Report 2007 Geberit Group 1 Key Figures First Half of 2007 MCHF Sales 1,311.2 Change in % +20.8 Operating profi t (EBIT) 305.3 Change in % +17.2 Margin in % 23.3 Net income 227.8 Change in %
Half-Year Financial Report Logwin AG
 Half-Year Financial Report 2012 Logwin AG Key Figures January 1 June 30, 2012 Group in thousand 2 2012 2011 Net Sales 652,696 659,362 Change to 2011 1.0 % Operating Income before valuations effects 7,149
Q1 Q3 (May 2015 January 2016) Report on the 3 rd Quarter 2015 / 16 of Zumtobel Group AG
 Report on the 3 rd Quarter 2015 / 16 of Zumtobel Group AG") Q1 (May 2015 January 2016) Report on the 3 rd Quarter 2015 / 16 of Zumtobel Group AG Overview of the Third Quarter >> Group revenues increase 2.8% in seasonally weak third quarter >> LED share of Group
Q1 (May 2015 January 2016) Report on the 3 rd Quarter 2015 / 16 of Zumtobel Group AG Overview of the Third Quarter >> Group revenues increase 2.8% in seasonally weak third quarter >> LED share of Group
Report on the First Three Quarters of 2003
 Report on the First Three Quarters of 2003 Financial highlights of PALFINGER AG (in accordance with IAS) EUR 000 Q1-3 2003 Q1-3 2002 Q1-3 2001 Q1-3 2000 Income statement Revenue 246,780 232,711 257,051
Quarterly Financial Report 2014 Logwin AG
 Quarterly Financial Report 2014 Logwin AG Key Figures 1 January 31 March 2014 Group In thousands of EUR 2014 2013 Revenues 278,533 320,696 Change on 2013-13.1% Operating result (EBIT) 8,048 8,016 Margin
Q1 (May July 2015) Report on the 1 st Quarter 2015/16 of Zumtobel Group AG
 Report on the 1 st Quarter 2015/16 of Zumtobel Group AG") Q1 (May July 2015) Report on the 1 st Quarter 2015/16 of Overview of the First Quarter 2015/16 >> Group revenues increase 5.9% over the previous year >> Continued strong growth momentum with LED products
Q1 (May July 2015) Report on the 1 st Quarter 2015/16 of Overview of the First Quarter 2015/16 >> Group revenues increase 5.9% over the previous year >> Continued strong growth momentum with LED products
EURk Change
 KTM AG ANNUAL REPORT 2017 KTM AT A GLANCE EURk 2013 2014 2015 2016 2017 Change EARNINGS RATIOS Revenue 716,390 864,636 1,022,487 1,141,819 1,331,717 16.6 % EBITDA 87,694 112,599 141,524 160,012 178,816
Interim Financial Report as at 30 September 2017
 Interim Financial Report as at 30 September 2017 Interim Report as at 30 September 2017 TRANSLATION FROM THE ORIGINAL ITALIAN TEXT INDEX PREFACE... 4 INTERIM MANAGEMENT REPORT AS AT 30 SEPTEMBER 2017...
Financial Report. Table of Contents
 Table of Contents Key Figures 02 Interim Group Status Report 03 Interim Consolidated Financial Statements 06 Notes to the Interim Report 10 Declaration of the Legal Representatives 11 Financial Report
Kapsch TrafficCom. Report on the first quarter of 2018/19
 EN Kapsch TrafficCom Report on the first quarter of 2018/19 Selected key data. 2018/19 and 2017/18: refers to the respective fiscal year (April 1 March 31) Q1: first quarter of fiscal year (April 1 June
Interim Group Management Report Consolidated Statement of Comprehensive Income Consolidated Cash Flow Statement... 8
 Interim Group Management Report... 3 Consolidated Balance Sheet... 6 Consolidated Statement of Comprehensive Income... 7 Consolidated Cash Flow Statement... 8 Consolidated Statement of Changes in Equity...
HUHTAMÄKI OYJ INTERIM REPORT. January 1 March 31, 2012
 HUHTAMÄKI OYJ INTERIM REPORT January 1 March 31, 2012 Huhtamäki Oyj, Interim Report January 1 March 31, 2012 Good start to the year Net sales growth in all segments Improved profitability Strong performance
Consolidated Financial Statements Second Quarter
 Consolidated Financial Statements 1 2014 Second Quarter Consolidated Financial Statements 2 CONDENSED INTERIM CONSOLI- DATED FINANCIAL STATEMENTS CONTENTS Key Developments in Second Quarter 2014 Consolidated
Half year financial report
 Half year financial report Six-month period ended June 30, 2016 Condensed Consolidated Financial Statements Management Report CEO Attestation Statutory Auditors Review Report Table of contents Condensed
Interim Group management report..3. Consolidated statement of financial position..6. Consolidated statement of comprehensive income..
 Interim Group management report..3 Consolidated statement of financial position..6 Consolidated statement of comprehensive income..7 Consolidated statement of cash flows.8 Consolidated statement of changes
Logwin AG. Interim Financial Report as of 30 June 2018
 Logwin AG Interim Financial Report as of 30 June 2018 Key Figures 1 January 30 June 2018 Earnings position In thousand EUR 2018 2017 Revenues Group 540,104 541,383 Change on 2017-0.2 % Air + Ocean 361,316
H1 (May October 2012) Interim Financial Report 2012/13 of Zumtobel AG
 Interim Financial Report 2012/13 of Zumtobel AG") H1 (May October ) Interim Financial Report of Overview of the second quarter of >> Lighting Segment revenues and adjusted EBIT at prior year level >> Components Segment minus 7.0% due to difficult market
H1 (May October ) Interim Financial Report of Overview of the second quarter of >> Lighting Segment revenues and adjusted EBIT at prior year level >> Components Segment minus 7.0% due to difficult market
INTERIM REPORT Q1 2018
 INTERIM REPORT Q1 2018 KEY FIGURES Q1 2018 Key figures Q1 Unit Q1 2018 Q1 2017 Change Sales EUR m 169.5 178.3-4.9% EBITDA EUR m 21.1 22.8-7.5% EBITDA margin (EBITDA/sales) % 12.4 12.8-0.4% points EBIT
FINANCIAL REPORT Q1 2015
 FINANCIAL REPORT Q1 2015 Q2 Q1 Q3 WITH RACING SPIRIT TO SUCCESS. PANKL. 02_Key Figures 03_Group Status Report 05_Consolidated Financial Statements 10_Notes 11_Declaration of the Legal Representatives 02
record your global partner for entrance solutions agta record ltd interim report 2017 your global partner for entrance solutions
 record your global partner for entrance solutions agta record ltd interim report 2017 your global partner for entrance solutions interim report 2017 Half-year report 30 June 2017 Trade activity Markets
Q1 (May July 2014) Report on the 1 st Quarter 2014/15 of Zumtobel Group AG
 Report on the 1 st Quarter 2014/15 of Zumtobel Group AG") Q1 (May July ) Report on the 1 st Quarter /15 of Zumtobel Group AG Overview of the First Quarter /15 >> Group revenues increase 4.6% year-on-year >> Continued strong growth momentum with LED products (plus
Q1 (May July ) Report on the 1 st Quarter /15 of Zumtobel Group AG Overview of the First Quarter /15 >> Group revenues increase 4.6% year-on-year >> Continued strong growth momentum with LED products (plus
Interim Report. January September High sales growth continues with strengthened order book. July September January September 2015
 Q3 Interim Report January September Doro AB Corporate Identity Number 556161-9429 34.5% Net sales growth 6.7% EBIT margin High sales growth continues with strengthened order book July September Net sales
EGGER HOLZWERKSTOFFE GMBH St. Johann in Tirol
 Consolidated Interim Financial Statements in accordance with International Financial Reporting Standards (IFRS) as of October 31, 2008 of EGGER HOLZWERKSTOFFE GMBH St. Johann in Tirol Egger Holzwerkstoffe
Interim Financial Report as at 31 March 2018
 Interim Financial Report as at 31 March 2018 Interim Report as at 31 March 2018 TRANSLATION FROM THE ORIGINAL ITALIAN TEXT INDEX PREFACE... 4 INTERIM MANAGEMENT REPORT AS AT 31 MARCH 2018... 5 CHANGES
Report on the first half of fiscal 2009
 Report on the first half of fiscal 2009 Table of Contents 3 Letter to the Shareholders 4 Management Report 8 Interim Financial Statement 9 Consolidated income statement for the period 01.01.2009 30.06.2009
Q1 (May July 2012) Report on the 1 st Quarter 2012/13 of Zumtobel AG
 Report on the 1 st Quarter 2012/13 of Zumtobel AG") Q1 (May July ) Report on the 1 st Quarter /13 of Overview of the first quarter /13 >> Lighting Segment generates 2.9% growth >> Increased profitability in Lighting Segment despite higher growth investments
Q1 (May July ) Report on the 1 st Quarter /13 of Overview of the first quarter /13 >> Lighting Segment generates 2.9% growth >> Increased profitability in Lighting Segment despite higher growth investments
ASSA ABLOY REPORTS STRONG SALES
 25 April 2006 25 April 2006 no: 8/06 ASSA ABLOY REPORTS STRONG SALES Sales for the first quarter increased organically by 12% to SEK 7,653 M (6,269). The operating margin (EBIT) for the first quarter amounted
A New Record in Sales and Earnings
 For immediate release MEDIA CONTACT: INVESTOR CONTACT: U.S.A.: Lisa Beachy, Tel. +1 617 488 2945 Europe: Ulf Santjer, Tel. +49 9132 81 2489 Dieter Bock, Tel. +49 9132 81 2261 Herzogenaurach, Germany, February
Press release. KION GROUP AG heading for solid full-year 2013 after successful nine-month period
 Press release KION GROUP AG heading for solid full-year 2013 after successful nine-month period At 3.317 billion, revenue of the KION Group for the first nine months of 2013 reaches high prior-year level
Dear Shareholders, The Tecan Group closed the first half of 2015 with double-digit sales growth and record net profit.
 Interim Report 2015 Contents 3 Letter to the Shareholders 6 Interim consolidated statement of profit or loss 7 Interim consolidated balance sheet 8 Interim consolidated statement of cash flows 9 Interim
Facts and figures. Interim Report as of June 30, 2017
 Facts and figures. Interim Report as of June 30, 2017 2 Key figures as of June 30, 2017 3 Sustained growth and improved results 5 Consolidated interim financial statements 8 Notes to the consolidated interim
AUSTRIAN POST IN 2017:
 AUSTRIAN POST IN 2017: INCREASE IN REVENUE AND EARNINGS Revenue increase in 2017 driven by dynamic parcel growth - Revenue up 2.3% to EUR 1,938.9m (excl. trans-o-flex) - Mail revenue decline (-2.1%) more
Press release Regulated information 2015 results Under embargo until Thursday 25 February 2016 at 7:15 a.m. CET
 Under embargo until Thursday 25 February 2016 at 7:15 a.m. CET Deceuninck 2015: Solid growth. Sales: 644.5m (+16.6%), EBITDA: 54.4(+54%) and net result: 13.3m (+ 27%) Growth driven by successful integration
Interim Financial Report as at 30 September 2018
 Interim Financial Report as at 30 September 2018 Interim Report as at 30 September 2018 TRANSLATION FROM THE ORIGINAL ITALIAN TEXT INDEX PREFACE... 4 INTERIM MANAGEMENT REPORT AS AT 30 SEPTEMBER 2018...
PRESS RELEASE. The following table shows a breakdown of sales by geographical area:
 PRESS RELEASE H1 2012 results approved: slight decrease in sales (-2.7%), the good level of profitability confirmed (EBITDA 17% of sales), net financial position improved. Net sales: 121.5 million euro
FOR THE FIRST QUARTER OF
 Fall in demand continues As expected the profit after tax of 16.2 million remained at the level of the fourth quarter of 2008 Cost-cutting measures are taking effect Free cash flow rose to 39 million Group
INTERIM FINANCIAL REPORT First quarter 2013 Company Announcement No. 493
 INTERIM FINANCIAL REPORT First quarter 2013 Company Announcement No. 493 30 April 2013 Selected financial and operating data for the period 1 January 31 March 2013 2013 2012 Revenue 10,981 10,819 Gross
Quarterly Statement January 1 to September 30, 2017 Dräger Group
 Quarterly Statement January 1 to September 30, 2017 Dräger Group THE DRÄGER GROUP OVER THE PAST FIVE YEARS 2013 2014 2015 2016 2017 Order intake million 1,756.7 1,743.4 1,895.1 1,849.1 1,928.3 Net sales
ASIAKASTIETO GROUP PLC. Interim Report 1 January 30 June 2015
 ASIAKASTIETO GROUP PLC Interim Report 1 January 30 June 2015 Asiakastieto Group Plc Työpajankatu 10 A P.O.Box 16 FI-00581 Helsinki Tel. +358 10 270 7000 investors.asiakastieto.fi Asiakastieto Group s interim
INTERIM REPORT Q3/2012
 INTERIM REPORT Q3/2012 POLYTEC GROUP 01 EARNINGS FIGURES EURO mill. Q3 2012 Q3 2011 CHANGE IN % 1-9 2012 1-9 2011 CHANGE IN % Sales 119,7 121,9-1,8% 362,6 527,3-31,2% EBITDA 1) 10,7 11,3-5,4% 31,8 44,0-27,8%
Yearly. Fourth quarter YEAR-END REPORT 2018 JANUARY - DECEMBER. Net sales for the fourth quarter reached SEK 363 m (301), corresponding to an
, corresponding to an") YEAR-END REPORT JANUARY - DECEMBER Fourth quarter Net sales for the fourth quarter reached SEK 363 m (301), corresponding to an increase of 20 %. Currency translations had a positive effect of SEK 21 m
YEAR-END REPORT JANUARY - DECEMBER Fourth quarter Net sales for the fourth quarter reached SEK 363 m (301), corresponding to an increase of 20 %. Currency translations had a positive effect of SEK 21 m
H Half-year financial report as at June 30
 H1 2016 Half-year financial report as at June 30 Sales revenues up by 13 % to 1,136 million Earnings (EBIT) increase to 183 million (+7 %) Outlook reaffirmed Content FUCHS at a glance 03 Half-year financial
AUSTRIAN POST Q :
 AUSTRIAN POST Q1 3 2018: PARCEL GROWTH COMPENSATES FOR MAIL DECLINE Revenue - Revenue increase of 0.8% to EUR 1,416.4m in the first three quarters of 2018 - Parcel growth (+11.5%) compensated for the decline
We benefit from our global presence. Third Quarter Interim Report 2002 Holcim Ltd
 We benefit from our global presence. Third Quarter Interim Report 2002 Holcim Ltd Our efficiency enhancement programs ensure further progress at operating level. Distinctly stronger third quarter In terms
KONE s interim report for January June 2016 JULY 19, 2016 HENRIK EHRNROOTH, PRESIDENT & CEO
 KONE s interim report for January June 2016 JULY 19, 2016 HENRIK EHRNROOTH, PRESIDENT & CEO Figures Key figures for for January June 2016 Q2 2016 Key figures STRONG EXECUTION AND PROFITABLE SALES GROWTH
INTERIM REPORT
 INTERIM REPORT 1.9.2010-28.2.2011 2 Vaahto Group For the period September 1, 2010 February 28, 2011 Vaahto Group s turnover for September 1, 2010, to February 28, 2011, was 24.9 million euros (compared
ANNUAL REPORT 2015 AUTOMOTIVE TECHNOLOGY.
 ANNUAL REPORT 2015 AUTOMOTIVE TECHNOLOGY. HIGHLIGHTS 2015 Streamlining of the Group structure Merger of into BF HOLDING AG Admission to the Prime Market of the Vienna Stock Exchange Restructuring of the
equal to a 19 % (20) operating margin Order intake was SEK 336 m (328), corresponding to an increase of 3 %
 operating margin Order intake was SEK 336 m (328), corresponding to an increase of 3 %") Second quarter Net sales for the second quarter reached SEK 329 m (299), corresponding to an increase of 10 % Operating profit reached SEK 63 m (59) equal to a 19 % (20) operating margin Order intake was
Second quarter Net sales for the second quarter reached SEK 329 m (299), corresponding to an increase of 10 % Operating profit reached SEK 63 m (59) equal to a 19 % (20) operating margin Order intake was
HUHTAMÄKI OYJ INTERIM REPORT. January 1 March 31, 2013
 HUHTAMÄKI OYJ INTERIM REPORT January 1 March 31, 2013 Huhtamäki Oyj, Interim Report January 1 March 31, 2013 Net sales and EBIT increased Net sales growth of 4% led by the foodservice acquisition in Asia
Financial Results for the First Quarter Ended June 30, 2015
 July 29, 2015 Company name : Nissan Motor Co., Ltd. Code no : 7201 (URL http://www.nissan-global.com/en/ir/) Representative : Carlos Ghosn, President Contact person : Joji
Interim Report to 30 June 2004
 Interim Report to 30 June 2004 Q2 Rolls-Royce Motor Cars Limited 02 BMW Group an Overview 06 Automobiles 09 Motorcycles 11 Financial Services 13 BMW Stock 14 Financial Analysis 20 Group Financial Statements
Half-Year Financial Report Logwin AG
 Half-Year Financial Report 2011 Logwin AG Key Figures January 1 June 30, 2011 Group in thousand 2 2011 2010 Net Sales 659,362 649,547 Change to 2010 1.5 % Operating Income (EBIT) 12,628 10,089 Margin 1.9
KSB Group. Half-year Financial Report 2018
 KSB Group Half-year Financial Report 2018 CONTENTS 4 Interim Management Report 11 Interim Consolidated Financial Statements 12 Balance Sheet 13 Statement of Comprehensive Income 15 Statement of Cash Flows
We aim to help shape the future.
 We aim to help shape the future. First Quarter Interim Report 2002 We aim to firmly establish the Holcim brand as a synonym for quality and reliability. This is something we are working on day in, day
OPEN INNOVATIVE FOCUSED SOLID
 OPEN INNOVATIVE FOCUSED SOLID QUARTERLY STATEMENT AS OF MARCH 31, 2018 To our shareholders Patrik Heider, Spokesman of the Executive Board and CFOO The Nemetschek Group began the 2018 fiscal year according
Report on the first half year 2017
 Report on the first half year Landsberg am Lech, 8 August 2 Report on the first half year Ideas that change the world Key Figures Letter from the Executive Board 03 05 Group Management Report Economic
Consolidated Statement of Comprehensive Income Consolidated Statement of Cash Flows Consolidated Statement of Shareholders Equity...
 Group Management Report For The Three Months Ended March 31, 2009 Contents Group Management Report... 3 Overall Economy and Industry... 3 Revenue Development... 3 Earnings Development... 4 Research and
HONDA MOTOR CO., LTD. AND SUBSIDIARIES. Condensed Consolidated Interim Financial Statements. December 31, 2017
 HONDA MOTOR CO., LTD. AND SUBSIDIARIES Condensed Consolidated Interim Financial Statements December 31, HONDA MOTOR CO., LTD. AND SUBSIDIARIES Consolidated Financial Results Overview of Operating Performance
hms networks JANUARY - DECEMBER 2014 Fourth quarter
 hms networks Y E A R - E N D R E P O R T 2 0 1 4 JANUARY - DECEMBER q Net sales for the full year increased by 18 % reaching SEK 589 m (501), corresponding to a 13 % increase in local currencies. The revaluation
REPORT FOR THE FIRST THREE QUARTERS MAYR-MELNHOF KARTON AG
 1 3Q REPORT FOR THE FIRST THREE QUARTERS MAYR-MELNHOF KARTON AG Results close to last year s high level Solid sales and volumes Acquisition of cosmetics packaging site in Poland Expectations for intact
Economic situation and outlook
 Economic situation and outlook 2/215 ELECTRONICS AND ELECTROTECHNICAL INDUSTRY MECHANICAL ENGINEERING METALS INDUSTRY CONSULTING ENGINEERING INFORMATION TECHNOLOGY Global and Finnish Economic Outlook Divergence
Operating profit improved clearly from last year and amounted to 12.0 MEUR (10.0 MEUR). Operating margin improved to 18.9% (15.8%).
. Operating margin improved to 18.9% (15.8%).") STOCK EXCHANGE RELEASE 1 (11) INTERIM REPORT JANUARY TO MARCH 2007 Improved profitability for the first quarter Despite the weakening of US dollar and slow sales of winter fishing and sports equipment,
STOCK EXCHANGE RELEASE 1 (11) INTERIM REPORT JANUARY TO MARCH 2007 Improved profitability for the first quarter Despite the weakening of US dollar and slow sales of winter fishing and sports equipment,
Orders received in CHF million. Sales in CHF million. EBIT in CHF million. Capital expenditures in CHF million
 Semi-Annual Report 2 Rieter. Semi-Annual Report. Rieter at a glance Rieter at a glance Orders received in Sales in EBIT in Capital expenditures in HY1 15 HY2 15 HY1 16 HY1 15 HY2 15 HY1 16 HY1 15 HY2 15
Interim report May July 2009/10
 Interim report May July 2009/10 Order bookings rose 19* percent. Net sales increased by 15* percent. Operating profit rose to SEK 89 M (13). Profit after taxes increased to SEK 56 M (1). Earnings per share
1 (19) Year-end report January December Tradedoubler year-end report January December 2016
 Year-end report January December Tradedoubler year-end report January December 2016") 1 (19) Year-end report January December 2016 Tradedoubler year-end report January December 2016 2 (19) Year-end report January December 2016 Improved financial performance THE FOURTH QUARTER OCTOBER -
1 (19) Year-end report January December 2016 Tradedoubler year-end report January December 2016 2 (19) Year-end report January December 2016 Improved financial performance THE FOURTH QUARTER OCTOBER -
PEGAS NONWOVENS SA. First nine months of 2010 unaudited consolidated financial results
 PEGAS NONWOVENS SA First nine months of 2010 unaudited consolidated financial results November 25, 2010 PEGAS NONWOVENS SA announces its unaudited consolidated financial results for the first nine months
HUHTAMÄKI OYJ INTERIM REPORT. January 1 September 30, 2012
 HUHTAMÄKI OYJ INTERIM REPORT January 1 September 30, 2012 Q1- Huhtamäki Oyj, Interim Report January 1 September 30, 2012 Strong earnings growth Profitability improvement continued The North America segment
9-Month Report of FJA AG
 www.fja.com 9-Month Report of FJA AG 01.01.2008-30.09.2008 Contact FJA AG Elsenheimerstrasse 65 80687 Munich GERMANY Investor Relations Phone: + 49 89 76901-274 or -7002 Fax: + 49 89 7698813 Email: investor.relations@fja.com
Quarterly Report of Zumtobel AG. 1 May 2010 to 31 January zumtobel group
 Quarterly Report of Zumtobel AG zumtobel group Overview of the Third Quarter >> 15.1% year-on-year increase in revenues (FX-adjusted: +9.2%) >> Components Segment: dynamic revenue growth continues with
Speech by Dr. Helmut Panke Member of the Board of Management of BMW AG Annual Accounts Press Conference of the BMW Group 19 March 2002
 - Check against delivery - Member of the Board of Management of BMW AG BMW Group Financial Statements 2001 Highlights 2001 Ladies and Gentlemen, 1. Introduction Key figures on an IAS basis The BMW Group
QUARTERLY REPORT. 30 September 2018
 QUARTERLY REPORT 30 September 2018 CONTENTS 1 BMW GROUP AT A GLANCE Page 4 BMW Group in Figures Page 10 BMW AG Stock and Capital Markets 2 INTERIM GROUP MANAGEMENT REPORT Page 13 Page 13 Page 15 Page 20
STRONG FINISH TO 2006 FOR ASSA ABLOY
 14 February 2007 14 February 2007 no:04/07 STRONG FINISH TO 2006 FOR ASSA ABLOY Sales for the fourth quarter increased by 7% to SEK 8,059 M (7,530), with 9% organic growth, 5% acquired growth and -7% exchange-rate
Net sales Operating income Ordinary income (27.6)
") Financial Results for the December 31, 2017 (Japanese Accounting Standards) (Consolidated) February 8, 2018 Company name : Nissan Motor Co., Ltd. Code no : 7201 (URL http://www.nissan-global.com/en/ir/)
Financial Results for the December 31, 2017 (Japanese Accounting Standards) (Consolidated) February 8, 2018 Company name : Nissan Motor Co., Ltd. Code no : 7201 (URL http://www.nissan-global.com/en/ir/)
Interim Report. Pilot. Passion. Partnership. Q3 2016/17.
 Interim Report Q3 2016/17 Pilot. Passion. Partnership. www.facc.com Foreword CEO Dear Shareholders! In the third quarter of 2016/17, FACC AG continued along its growth path as planned. This led in the
HONDA MOTOR CO., LTD. AND SUBSIDIARIES. Condensed Consolidated Interim Financial Statements. September 30, 2018
 Condensed Consolidated Interim Financial Statements September 30, 2018 Consolidated Financial Results Overview of Operating Performance Honda s consolidated sales revenue for the six months ended September
Quarterly Report to 30 June June 2013
 Quarterly Report to 30 June 2013 Q2 30 June 2013 2 BMW Group in figures 2 BMW Group in figures 5 Interim Group Management Report 5 The BMW Group an Overview 7 General Economic Environment 8 Automotive
AT 0000 A00XX9 HALF YEAR FINANCIAL REPORT H1 2017
 AT 0000 A00XX9 HALF YEAR FINANCIAL REPORT H1 2017 KEY FIGURES HALF YEAR 2017 Key figures by half year Unit H1 2017 H1 2016 Change Sales EUR m 348.3 326.3 6.7% EBITDA EUR m 45.1 33.0 36.6% EBITDA margin
Financial Results for the Three Months Ended June 30, 2017 (Japanese Accounting Standards) (Consolidated) July 27, 2017
 (Consolidated) July 27, 2017") Financial Results for the Three Months Ended June 30, 2017 (Japanese Accounting Standards) (Consolidated) July 27, 2017 Company name : Nissan Motor Co., Ltd. Code no : 7201
Financial Results for the Three Months Ended June 30, 2017 (Japanese Accounting Standards) (Consolidated) July 27, 2017 Company name : Nissan Motor Co., Ltd. Code no : 7201
Interim Condensed Consolidated Financial Statements_ for the period 1 January to 31 March 2017
 Interim Condensed Consolidated Financial Statements_ for the period 1 January to 31 March 2017 Consolidated Statements of Financial Position_ 2 Consolidated Statements of Financial Position_ Assets Notes
KONE s Interim Report for January September 2014
 KONE s Interim Report for January September 2014 Henrik Ehrnrooth, President & CEO HANNOVER, GERMANY Continuously improving customer experience To ensure excellent service, we gather constant customer
Report of the First Half of 2006 We are still growing. Kennzahlen von Palfinge. Global Reports LLC. Palfinger AG Report on the First Half of 2006
 Report of the First Half of 2006 We are still growing. Kennzahlen von Palfinge Palfinger AG Report on the First Half of 2006 Financial highlights of PALFINGER 1) EUR 000 HY1 2006 HY1 2005 HY1 2004 HY1
FORACO INTERNATIONAL S.A.
 FORACO INTERNATIONAL S.A. Unaudited Condensed Interim Consolidated Financial Statements Three-month and nine-month periods ended September 30, Table of Contents Unaudited condensed interim consolidated
hms networks JANUARY - DECEMBER 2013 Fourth quarter
 hms networks Y E A R - E N D R E P O R T 2 0 1 3 JANUARY - DECEMBER q Net sales for the full year reached SEK 501 m (382), corresponding to a 31 % increase. The revaluation of the Swedish currency had
Earnings per share attributable to owners of the parent-diluted (Yen) For the three months
 For the three months") English translation Financial Statements Summary for the three months [IFRS] (Consolidated) July 25, 2018 Company name: NIDEC CORPORATION URL http://www.nidec.com/en-global/ Stock listing: Tokyo Stock
English translation Financial Statements Summary for the three months [IFRS] (Consolidated) July 25, 2018 Company name: NIDEC CORPORATION URL http://www.nidec.com/en-global/ Stock listing: Tokyo Stock
Quarterly Report to 30 June 2010
 Quarterly Report to 30 June 2010 02 BMW Group in figures 02 BMW Group in figures 04 Interim Group Management Report 04 The BMW Group an Overview 06 Automobiles 10 Motorcycles 11 Financial Services 13 BMW
REPORT ON THE FIRST QUARTER OF 2014/15 (MAY JULY
 REPORT ON THE FIRST QUARTER OF 2014/15 (MAY JULY 2014) WOLFORD REPORT ON THE FIRST QUARTER OF 2014/15 Wolford Group Key Data Earnings Data 05-07/14 05-07/13 Chg. in % 2013/14 Revenues in mill. 31.91 32.28-1