SECOND QUARTER 2017 EARNINGS CONFERENCE CALL. August 2, 2017
|
|
|
- Rosanna Atkins
- 6 years ago
- Views:
Transcription


1 SECOND QUARTER 2017 EARNINGS CONFERENCE CALL August 2, 2017
2 FORWARD-LOOKING STATEMENTS This presentation contains some forward-looking statements that are not historical facts, including statements concerning our business, financial strength, future plans, objectives, and the performance of our products. These statements can be identified by words such as believe, expect, forecast, potential, "project", "future", "may, "will, and "should", and similar expressions or words. These forward-looking statements involve various known and unknown risks, uncertainties, and assumptions that are difficult to predict with regard to timing, extent, and likelihood. Therefore, actual performance and results may materially differ from what may be expressed or forecasted in such forward-looking statements. Factors that could contribute to these differences may include operational and other complications that may arise affecting the implementation of our plans and business objectives; continued pressures caused by economic conditions and the pace and extent of the economic recovery; challenges that may arise in connection with the integration of new businesses or assets we acquire or the disposition of assets; issues unique to government contracting, such as competitive bidding processes, qualification requirements, and delays or changes in funding; disruptions within our dealer network; changes in our relationship with major customers or suppliers; changes in the demand or supply of products within our markets or raw materials needed to manufacture those products; and changes in laws and regulations affecting our business. The risk factors disclosed in Part I Item 1A of our Annual Report on Form 10-K for the year ended December 31, 2016, filed with the Securities and Exchange Commission and available at or our website, include all known risks our management believes could materially affect the results described by forward-looking statements contained in this presentation. However, those risks may not be the only risks we face. Our business, operations, and financial performance could also be affected by additional factors that are not presently known to us or that we currently consider to be immaterial to our operations. In addition, new risks may emerge from time to time that may cause actual results to differ materially from those contained in any forward- looking statements. All forward-looking statements in this presentation are qualified by this paragraph. Investors should not place undue reliance on forward-looking statements as a prediction of actual results. All dividends are considered and declared by our Board of Directors, in its discretion. We undertake no obligation to publicly update or revise any forward-looking statements in this presentation, whether as a result of new information, future events, or otherwise.


3 SECOND QUARTER 2017 CORPORATE OVERVIEW 3


4 BUSINESS UPDATE & HIGHLIGHTS 4


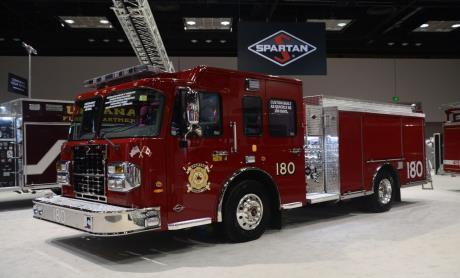
5 BUSINESS UPDATE & HIGHLIGHTS 180 truck 5


6 BUSINESS UPDATE & HIGHLIGHTS 6


7 BUSINESS UPDATE & HIGHLIGHTS 7
8 FINANCIAL REVIEW 2ND QUARTER 2017


9 2Q17 VS 2Q16 OVERVIEW 9


10 FLEET VEHICLES & SERVICES 2Q17 10


11 SPECIALTY CHASSIS & VEHICLES 2Q17 11


12 EMERGENCY RESPONSE 2Q17 12
13 BALANCE SHEET 2Q17 Spartan Motors Summary Balance Sheet Jun 30 Dec 31, (unaudited) (audited) Assets Cash $ 21,240 $ 32,041 Accts Receivable 81,951 65,441 Inventory 88,444 58,896 PP&E 57,078 53,116 Other Assets 47,631 33,800 Total Assets $ 296,344 $ 243,294 Liabilities & Shareholders' Equity Accts Payable $ 41,991 $ 31,336 Long-term Debt 22, Other Liabilities 79,196 58,932 Total Liabilities $ 144,036 $ 90,342 Shareholders' Equity 152, ,952 Total Liabilities & Equity $ 296,344 $ 243,294 Total Liquidity Cash $ 21,240 $ 32,041 Net Borrowing Capacity 35,313 71,057 Total Liquidity $ 56,553 $ 103,098 13
14 FINANCIAL OUTLOOK Guidance Current Guidance Previous Guidance ($M except per share) Low Mid-point High Low Mid-point High Revenue $680.0 $700.0 $720.0 $650.0 $675.0 $700.0 Restructuring/Acq Costs $3.7 $3.2 Adjusted EBITDA $28.3 $29.8 $31.3 $26.5 $27.8 $29.0 Income tax expense $0.7 $1.5 $2.2 $1.5 $1.9 $2.3 Interest Expense $0.6 $0.8 Adjusted EPS $0.48 $0.50 $0.52 $0.36 $0.39 $0.41 Shares outstanding 35,000 35, See GAAP reconciliation in Appendix
15 CLOSING REMARKS 15
16 APPENDIX
17 RECONCILIATION OF NON-GAAP FINANCIAL MEASURES This presentation contains Adjusted EBITDA (earnings before interest, taxes, depreciation and amortization), adjusted net income, adjusted earnings per share, forecasted Adjusted EBITDA, and forecasted adjusted earnings per share, which are all Non-GAAP financial measures. Our management uses Adjusted EBITDA to evaluate the performance of and allocate resources to our segments. These non- GAAP measures are calculated by excluding items that we believe to be infrequent or not indicative of our operating performance. For the periods covered by this release such items consist of expenses associated with restructuring actions taken to improve the efficiency and profitability of certain of our manufacturing operations, expenses related to a recent business acquisition, the impact of the step-up in inventory value associated with the recent business acquisition, and the impact of the business acquisition on the timing of chassis revenue recognition. We present these adjusted Non-GAAP measures because we consider them to be important supplemental measures of our performance and believe them to be useful to improve the comparability of our results from period to period and with our competitors, as well as to show ongoing results from operations distinct from items that are infrequent or not indicative of our operating performance. The adjusted Non-GAAP measures are not measurements of our financial performance under GAAP and should not be considered as an alternative to net income or earnings per share under GAAP. These adjusted Non-GAAP measures have limitations as analytical tools and should not be considered in isolation or as a substitute for analysis of our results as reported under GAAP. In addition, in evaluating the adjusted Non-GAAP measures, you should be aware that in the future we may incur expenses similar to the adjustments in this presentation, despite our assessment that such expenses are infrequent or not indicative of our operating performance. Our presentation of the adjusted Non-GAAP measures should not be construed as an inference that our future results will be unaffected by unusual or infrequent items. We compensate for these limitations by providing equal prominence of our GAAP results and using adjusted Non-GAAP measures only as a supplement. The following tables reconcile net income to Adjusted EBITDA, net income to adjusted net income, earnings per share to adjusted earnings per share, forecasted net income to Adjusted EBITDA and forecasted earnings per share to adjusted earnings per share for the periods indicated. 17
18 RECONCILIATION OF NON GAAP FINANCIAL MEASURES Financial Summary (Non-GAAP) Consolidate d (In thousands, except per share data) (Unaudited) Three Months Ended June 30, Spartan Motors, Inc 2017 % of sales 2016 % of sales Net income $ 1, % $ 4, % Restructuring Intercompany chassis impact Recall expense - 1,715 Acquistion related expenses 60 - Adjusted net income $ 2, % $ 6, % Net income $ 1, % $ 4, % Depreciation and amortization 2,365 1,778 Taxes on income 92 9 Interest expense EBITDA $ 3, % $ 6, % Restructuring Intercompany chassis impact Recall expense - 1,715 Acquistion related expenses 60 - Adjusted EBITDA $ 4, % $ 8, % 18 Diluted net earnings (loss) per share $ 0.03 $ 0.13 Restructuring Intercompany chassis impact Purchase accounting impact Adjusted Diluted net earnings (loss) per share $ 0.07 $ 0.19
19 RECONCILIATION OF NON GAAP FINANCIAL MEASURES Financial Summary (Non-GAAP) Consolidated (In thousands, except per share data) (Unaudited) Three Months Ended March 31, Spartan Motors, Inc 2017 % of sales 2016 % of sales Net income (loss) $ (1,099) -0.7% $ % Restructuring Intercompany chassis impact 1,112 - Purchase accounting impact Acquistion related expenses Deferred tax asset valuation allowance 466 (235) Tax effect of adjustments (719) (125) Adjusted net income $ 1, % $ % Net income (loss) $ (1,099) -0.7% $ % Depreciation and amortization 2,325 1,786 Taxes on income Interest expense EBITDA $ 1, % $ 2, % Restructuring Intercompany chassis impact 1,112 - Purchase accounting impact Acquistion related expenses Adjusted EBITDA $ 4, % $ 2, % Diluted net earnings (loss) per share $ (0.03) $ 0.02 Restructuring Intercompany chassis impact Purchase accounting impact Acquistion related expenses Deferred tax asset valuation allowance 0.01 (0.01) Tax effect of adjustments (0.02) (0.00) Adjusted Diluted net earnings (loss) per share $ 0.04 $
20 RECONCILIATION OF NON GAAP FINANCIAL MEASURES Emergency Response Vehicles Segment (In thousands, unaudited) Three Months Ended June 30, 2017 % of sales 2016 % of sales Net income (loss) attributable to Emergency Response $ (2,100) -2.6% $ (2,475) -4.7% Depreciation and amortization Taxes on income - 70 Earnings before interest, taxes, depreciation and amortization $ (1,516) -1.9% $ (2,195) -4.2% Earnings before interest, taxes, depreciation and amortization $ (1,516) -1.9% $ (2,195) -4.2% Restructuring charges Intercompany chassis impact Recall expense 1,715 Adjusted earnings before interest, taxes, depreciation and amortization $ (652) -0.8% $ (253) -0.5% Fleet Vehicles and Services Segment (In thousands, unaudited) Three Months Ended June 30, 2017 % of sales 2016 % of sales Net income (loss) attributable to Fleet Vehicles and Services $ 4, % $ 6, % Depreciation and amortization Interest expense Earnings before interest, taxes, depreciation and amortization $ 5, % $ 7, % Earnings before interest, taxes, depreciation and amortization $ 5, % $ 7, % Restructuring charges Adjusted earnings before interest, taxes, depreciation and amortization $ 6, % $ 7, % Specialty Chassis and Vehicles Segment (In thousands, unaudited) Three Months Ended June 30, 2017 % of sales 2016 % of sales Net income (loss) attributable to Specialty Chassis and Vehicles $ 2, % $ 3, % Depreciation and amortization Earnings before interest, taxes, depreciation and amortization $ 2, % $ 3, % 20 Earnings before interest, taxes, depreciation and amortization $ 2, % $ 3, % Restructuring charges - - Adjusted earnings before interest, taxes, depreciation and amortization $ 2, % $ 3, %
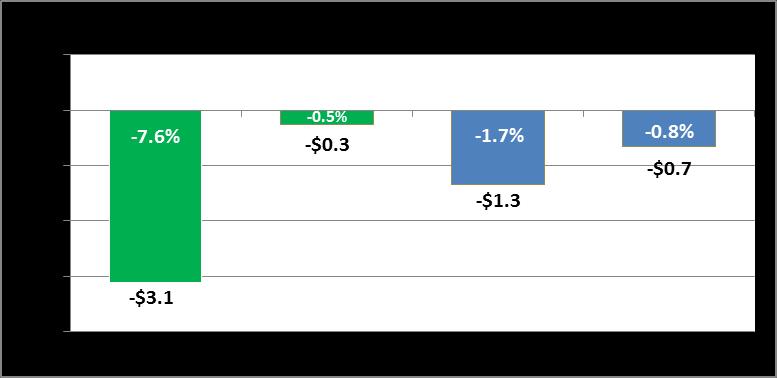
21 RECONCILIATION OF NON GAAP FINANCIAL MEASURES Emergency Response Vehicles Segment (In thousands, unaudited) Three Months Ended March 31, 2017 % of sales 2016 % of sales Net income (loss) attributable to Emergency Response $ (3,589) -4.5% $ (3,664) -8.9% Depreciation and amortization Taxes on income - - Interest expense - - Earnings before interest, taxes, depreciation and amortization $ (3,037) -3.8% $ (3,458) -8.4% Earnings before interest, taxes, depreciation and amortization $ (3,037) -3.8% $ (3,458) -8.4% Restructuring Intercompany chassis impact 1,112 - Purchase accounting impact Adjusted earnings before interest, taxes, depreciation and amortization $ (1,337) -1.7% $ (3,119) -7.6% Fleet Vehicles and Services Segment (In thousands, unaudited) Three Months Ended March 31, 2017 % of sales 2016 % of sales Net income (loss) attributable to Fleet Vehicles and Services $ 5, % $ 5, % Depreciation and amortization Taxes on income - - Interest expense Earnings before interest, taxes, depreciation and amortization $ 6, % $ 6, % Earnings before interest, taxes, depreciation and amortization $ 6, % $ 6, % Restructuring Adjusted earnings before interest, taxes, depreciation and amortization $ 6, % $ 6, % Specialty Chassis and Vehicles Segment (In thousands, unaudited) Three Months Ended March 31, 2017 % of sales 2016 % of sales Net income (loss) attributable to Specialty Chassis and Vehicles $ 1, % $ 1, % Depreciation and amortization Taxes on income - - Interest expense - - Earnings before interest, taxes, depreciation and amortization $ 1, % $ 1, % 21 Earnings before interest, taxes, depreciation and amortization $ 1, % $ 1, % Restructuring 96 - Adjusted earnings before interest, taxes, depreciation and amortization $ 1, % $ 1, %
22 RECONCILIATION OF NON GAAP FINANCIAL MEASURES Consolidated (In thousands, except per share data) (Unaudited) Low Mid High Net income $ 13,000 $ 13,750 $ 14,500 Add: 2017 Guidance Year Ending December 31, 2017 Depreciation and amortization 10,278 10,278 10,278 Interest expense Taxes 700 1,450 2,200 EBITDA $ 24,578 $ 26,078 $ 27,578 Acquisition expenses Restructuring charges Chassis shipment delay 2,725 2,725 2,725 Adjusted EBITDA $ 28,268 $ 29,768 $ 31, Earnings per share $ 0.37 $ 0.39 $ 0.41 Add: Acquisition expenses Chassis shipment delay Less tax effect of adjustments Adjusted earnings per share $ 0.48 $ 0.50 $ 0.52

23
THIRD QUARTER 2018 EARNINGS CONFERENCE CALL. October 31, 2018
 THIRD QUARTER 2018 EARNINGS CONFERENCE CALL October 31, 2018 FORWARD-LOOKING STATEMENT 2 2018 SPARTAN MOTORS, INC. IMPACT OF REVENUE RECOGNITION Consolidated Income Statement ($ M) As Reported Balances
Earnings Release Data Supplement
 Earnings Release Data Supplement Herman Miller, Inc. (together with its consolidated subsidiaries, the "company", "we", "our" or "us") provides this supplement to assist investors in evaluating the company's
Kraton Corporation. First Quarter 2018 Earnings Presentation. April 26, 2018
 Kraton Corporation First Quarter 2018 Earnings Presentation April 26, 2018 Disclaimers Forward Looking Statements Some of the statements and information in this presentation contain forward-looking statements
Q Financial Supplement
 Reconcilation of GAAP and Non-GAAP Financial Measures Non-GAAP Net Income and Non-GAAP EPS (in thousands except per share data) 2014 2015 Three Months Ending June 30, Low Range Guidance (1) High Range
Unifi, Inc. Second Quarter Ended December 24, 2006 Conference Call
 Unifi, Inc. Second Quarter Ended December 24, 2006 Conference Call Cautionary Statement Certain statements included herein contain forward-looking statements within the meaning of federal securities laws
Conference Call Presentation
 Conference Call Presentation First Quarter Ended September 24, 207 (Unaudited Results) Cautionary Statement on Forward-Looking Statements Certain statements included herein contain forward-looking statements
Financial Data Supplement
 Financial Data Supplement Herman Miller, Inc. (together with its consolidated subsidiaries, the "company", "we", "our" or "us") provides this supplement to assist investors in evaluating the company's
CSG SYSTEMS INTERNATIONAL, INC. DISCLOSURES FOR NON-GAAP FINANCIAL MEASURES
 CSG SYSTEMS INTERNATIONAL, INC. DISCLOSURES FOR NON-GAAP FINANCIAL MEASURES Use of Non-GAAP Financial Measures and Limitations To supplement its condensed consolidated financial statements presented in
KRATON PERFORMANCE POLYMERS, INC. SECOND QUARTER 2013 EARNINGS CONFERENCE CALL. August 1, 2013
 KRATON PERFORMANCE POLYMERS, INC. SECOND QUARTER 2013 EARNINGS CONFERENCE CALL August 1, 2013 Forward-Looking Statement Disclaimer This presentation includes forward-looking statements that reflect our
SS&C Technologies Holdings, Inc. and Subsidiaries Condensed Consolidated Statements of Operations (in thousands, except per share data) (unaudited)
 (unaudited)") SS&C Technologies Holdings, Inc. and Subsidiaries Condensed Consolidated Statements of Operations (in thousands, except per share data) (unaudited) 2017 2016 2017 2016 Revenues: Software-enabled services
SS&C Technologies Holdings, Inc. and Subsidiaries Condensed Consolidated Statements of Operations (in thousands, except per share data) (unaudited) 2017 2016 2017 2016 Revenues: Software-enabled services
ITRON, INC. CONSOLIDATED STATEMENTS OF OPERATIONS
 , INC. CONSOLIDATED STATEMENTS OF OPERATIONS (Unaudited, in thousands, except per share data) Revenues $ 447,536 $ 571,640 Cost of revenues 307,413 388,535 Gross profit 140,123 183,105 Operating expenses
ITRON, INC. CONSOLIDATED STATEMENTS OF OPERATIONS
 , INC. CONSOLIDATED STATEMENTS OF OPERATIONS (Unaudited, in thousands, except per share data) Revenues $ 474,795 $ 447,536 Cost of revenues 320,260 307,413 Gross profit 154,535 140,123 Operating expenses
ITRON, INC. CONSOLIDATED STATEMENTS OF OPERATIONS
 , INC. CONSOLIDATED STATEMENTS OF OPERATIONS (Unaudited, in thousands, except per share data) Revenues $ 489,353 $ 482,175 $ 964,148 $ 929,711 Cost of revenues 326,312 322,587 646,572 630,000 Gross profit
ITRON, INC. CONSOLIDATED STATEMENTS OF OPERATIONS
 , INC. CONSOLIDATED STATEMENTS OF OPERATIONS (Unaudited, in thousands, except per share data) Revenues $ 571,640 $ 563,691 Cost of revenues 388,535 378,713 Gross profit 183,105 184,978 Operating expenses
ITRON, INC. CONSOLIDATED STATEMENTS OF OPERATIONS
 , INC. CONSOLIDATED STATEMENTS OF OPERATIONS (Unaudited, in thousands, except per share data) Revenues $ 470,103 $ 489,353 $ 918,350 $ 964,148 Cost of revenues 351,532 326,312 661,580 646,572 Gross profit
ITRON, INC. CONSOLIDATED STATEMENTS OF OPERATIONS
 , INC. CONSOLIDATED STATEMENTS OF OPERATIONS (Unaudited, in thousands, except per share data) Revenues $ 504,063 $ 615,555 $ 1,654,843 $ 1,791,647 Cost of revenues 332,266 438,559 1,103,196 1,237,722 Gross
ITRON, INC. CONSOLIDATED STATEMENTS OF OPERATIONS
 , INC. CONSOLIDATED STATEMENTS OF OPERATIONS (Unaudited, in thousands, except per share data) Revenues $ 523,335 $ 642,477 $ 2,178,178 $ 2,434,124 Cost of revenues 359,835 449,944 1,463,031 1,687,666 Gross
First Quarter 2019 Earnings Presentation February 6, 2019
 First Quarter 2019 Earnings Presentation February 6, 2019 Cautionary statements This presentation contains forward-looking statements that are subject to known and unknown risks and uncertainties, many
Kraton Performance Polymers, Inc.
 Kraton Performance Polymers, Inc. Third Quarter 2015 Earnings Conference Call October 29, 2015 Forward Looking Statement Disclaimer This presentation includes forward looking statements that reflect our
Federal Signal Q Earnings Call August 8, 2017
 Federal Signal Q2 2017 Earnings Call August 8, 2017 Jennifer Sherman, President & Chief Executive Officer Ian Hudson, VP, Interim Chief Financial Officer Safe Harbor This presentation contains unaudited
Itron, Inc. Comparison of Key 2015 Financial Metrics to Preliminary Results Announced February 17, Total operating expenses 486, ,839
 Itron, Inc. Comparison of Key 2015 Financial Metrics to Preliminary Results Announced February 17, 2016 (Unaudited, in thousands, except per share data) (announced Feb. 17, 2016) Preliminary FY 2015 Final
Fourth Quarter and FY 2017 Earnings Presentation November 29, 2017
 Fourth Quarter and FY 2017 Earnings Presentation November 29, 2017 Cautionary statements This presentation contains forward-looking statements that are subject to known and unknown risks and uncertainties,
KRATON PERFORMANCE POLYMERS, INC. FIRST QUARTER 2013 EARNINGS CONFERENCE CALL. May 2, 2013
 KRATON PERFORMANCE POLYMERS, INC. FIRST QUARTER 2013 EARNINGS CONFERENCE CALL May 2, 2013 Forward-Looking Statement Disclaimer This presentation includes forward-looking statements that reflect our plans,
FAIR ISAAC CORPORATION CONDENSED CONSOLIDATED BALANCE SHEETS (In thousands) (Unaudited)
 (Unaudited)") CONDENSED CONSOLIDATED BALANCE SHEETS (In thousands) June 30, September 30, 2016 2015 ASSETS: Current assets: Cash and cash equivalents $ 118,155 $ 86,120 Accounts receivable, net 155,196 158,773 Prepaid
CONDENSED CONSOLIDATED BALANCE SHEETS (In thousands) June 30, September 30, 2016 2015 ASSETS: Current assets: Cash and cash equivalents $ 118,155 $ 86,120 Accounts receivable, net 155,196 158,773 Prepaid
FAIR ISAAC CORPORATION CONDENSED CONSOLIDATED BALANCE SHEETS (In thousands) (Unaudited)
 (Unaudited)") CONDENSED CONSOLIDATED BALANCE SHEETS (In thousands) March 31, September 30, 2016 2015 ASSETS: Current assets: Cash and cash equivalents $ 85,374 $ 86,120 Accounts receivable, net 155,207 158,773 Prepaid
CONDENSED CONSOLIDATED BALANCE SHEETS (In thousands) March 31, September 30, 2016 2015 ASSETS: Current assets: Cash and cash equivalents $ 85,374 $ 86,120 Accounts receivable, net 155,207 158,773 Prepaid
SS&C Technologies Holdings, Inc. and Subsidiaries Condensed Consolidated Statements of Operations (in thousands, except per share data) (unaudited)
 (unaudited)") SS&C Technologies Holdings, Inc. and Subsidiaries Condensed Consolidated Statements of Operations (in thousands, except per share data) (unaudited) 2018 2017 Revenues: Software-enabled services $ 294,803
SS&C Technologies Holdings, Inc. and Subsidiaries Condensed Consolidated Statements of Operations (in thousands, except per share data) (unaudited) 2018 2017 Revenues: Software-enabled services $ 294,803
Advanced Flow Solutions Energy Fluid Handling. Fourth Quarter Investor Review. Presented February 28, 2018
 Advanced Flow Solutions Energy Fluid Handling Fourth Quarter 2017 Investor Review Presented February 28, 2018 1 Safe Harbor This presentation contains forward-looking statements within the meaning of Section
FAIR ISAAC CORPORATION CONDENSED CONSOLIDATED BALANCE SHEETS (In thousands) (Unaudited)
 (Unaudited)") CONDENSED CONSOLIDATED BALANCE SHEETS (In thousands) June 30, September 30, 2018 2017 ASSETS: Current assets: Cash and cash equivalents $ 119,929 $ 105,618 Accounts receivable, net 182,419 168,586 Prepaid
CONDENSED CONSOLIDATED BALANCE SHEETS (In thousands) June 30, September 30, 2018 2017 ASSETS: Current assets: Cash and cash equivalents $ 119,929 $ 105,618 Accounts receivable, net 182,419 168,586 Prepaid
FAIR ISAAC CORPORATION CONDENSED CONSOLIDATED BALANCE SHEETS (In thousands) (Unaudited)
 (Unaudited)") CONDENSED CONSOLIDATED BALANCE SHEETS (In thousands) 2018 2017 ASSETS: Current assets: Cash and cash equivalents $ 90,023 $ 105,618 Accounts receivable, net 208,865 168,586 Prepaid expenses and other current
CONDENSED CONSOLIDATED BALANCE SHEETS (In thousands) 2018 2017 ASSETS: Current assets: Cash and cash equivalents $ 90,023 $ 105,618 Accounts receivable, net 208,865 168,586 Prepaid expenses and other current
Reconciliation of Non-GAAP Financial Measures. Adjusted Operating Income Reconciliation
 Reconciliation of Non-GAAP Financial Measures Adjusted Operating Income Reconciliation Adjusted operating income is not a measure of financial performance under generally accepted accounting principles
Bottomline Technologies Reconciliation to Non GAAP Measures Three Months Ended June 30, 2013
 Reconciliation to Measures Three Months Ended June 30, 2013 Non Cash Amortization of Equity Based Integration Restructuring Interest GAAP Intangible Assets Compensation Related Expenses Expenses Expense
Marvell Technology Group Ltd. First Quarter of Fiscal Year 2019 May 31, 2018
 Marvell Technology Group Ltd First Quarter of Fiscal Year 2019 May 31, Forward-Looking Statements under the Private Securities Litigation Reform Act of 1995 This document and the accompanying press release
KRATON PERFORMANCE POLYMERS, INC. THIRD QUARTER 2012 EARNINGS CONFERENCE CALL. November 1, 2012
 KRATON PERFORMANCE POLYMERS, INC. THIRD QUARTER 2012 EARNINGS CONFERENCE CALL November 1, 2012 Forward-Looking Statement Disclaimer This presentation includes forward-looking statements that reflect our
Second Quarter Investor Review
 Second Quarter 2018 Investor Review Presented July 27, 2018 1 Safe Harbor This presentation contains forward-looking statements within the meaning of Section 27 A of the Securities Act of 1933, as amended,
CFO Commentary. Third Quarter. Third-quarter diluted earnings per. share increased 33% year over year; non- GAAP diluted. earnings per share
 Third Quarter CFO Commentary As reflected in our earnings release, there are a number of items that impact the comparability of our results with those in the trailing quarter and prior quarter of last
Income from Operations
 CONSOLIDATED INCOME STATEMENT (UNAUDITED) For the Three Months Ended June 30, 2007, 2006 and March 31, 2007 Except for Per Share Amounts and Shares Outstanding 3 months ended 3 months ended Jun. 30, 2007
Driving Value Through Culture, Innovation and Results
 Driving Value Through Culture, Innovation and Results THIRD QUARTER 2018 EARNINGS PRESENTATION November 2, 2018 1 Agenda Introduction Business Overview Financial Overview Roger Hendriksen Director, Investor
Marvell Technology Group Ltd. Third Quarter of Fiscal Year 2018 November 28, 2017
 Marvell Technology Group Ltd Third Quarter of Fiscal Year 2018 November 28, Forward-Looking Statements under the Private Securities Litigation Reform Act of 1995 This press release contains forward-looking
THIRD QUARTER 2016 CONFERENCE CALL AND WEBCAST. November 1, 2016
 THIRD QUARTER 2016 CONFERENCE CALL AND WEBCAST November 1, 2016 AGENDA Introduction Business Overview Financial Overview Roger Hendriksen Director, Investor Relations Jeff Edwards Chairman and Chief Executive
ation erials nt Mat ese Pr or lementalestvin Supp
 Supplemental Investor Presentation Materials DENTSPLY International, Inc. Third Quarter 2014 Earnings Supplemental Materials October 29, 2014 2 Forward Looking Statements This presentation contains forward-looking
Schneider National, Inc. Reports First Quarter 2017 Results
 Schneider National, Inc. Reports First Quarter 2017 Results Operating Revenues of $1.0 billion, an increase of 8.4% compared to first quarter 2016 Net Income of $22.6 million, a decrease of 19.8% compared
Q Earnings. Supplemental Financials. September 25, 2018
 Q3 2018 Earnings Supplemental Financials September 25, 2018 Forward-looking statements This presentation contains forward-looking statements within the meaning of the federal securities laws, including
Third Quarter Fiscal 2019 Earnings Call
 NYSE: GHM January 30, 2019 Third Quarter Fiscal 2019 Earnings Call James R. Lines President & Chief Executive Officer Jeffrey F. Glajch Vice President & Chief Financial Officer 2019 Graham Corp. 1 Safe
Revenue $144M $134M $119M $110M $102M $89M $76M $71M $61M $55M $46M $150 $125 $100 $50 $25
 Revenue ($M) $150 $134M $144M $125 $100 $89M $102M $110M $119M $75 $50 $46M $55M $61M $71M $76M $25 $0 Q1'13 Q2'13 Q3'13 Q4'13 Q1'14 Q2'14 Q3'14 Q4'14 Q1'15 Q2'15 Q3'15 1 Adj. EBITDA ($M) Adjusted EBITDA
Non-GAAP Reconciliations Third Quarter 2016 Published November 9, 2016
 Non-GAAP Reconciliations Third Quarter 2016 Published November 9, 2016 We supplement our financial information prepared in accordance with GAAP with certain non-gaap measures including Adjusted EBITDA
KRATON PERFORMANCE POLYMERS, INC. FOURTH QUARTER 2012 EARNINGS CONFERENCE CALL. February 28, 2013
 KRATON PERFORMANCE POLYMERS, INC. FOURTH QUARTER 2012 EARNINGS CONFERENCE CALL February 28, 2013 Forward-Looking Statement Disclaimer This presentation includes forward-looking statements that reflect
Q2 Fiscal 2017 Earnings Commentary
 Q2 Fiscal 2017 Earnings Commentary August 31, 2017 The financial measures discussed below include both GAAP and adjusted non-gaap financial measures. In connection with the restructuring of its ivivva
DICK'S SPORTING GOODS, INC. GAAP to NON-GAAP RECONCILIATIONS (Dollars in thousands, except per share amounts) (unaudited)
 (unaudited)") DICK'S SPORTING GOODS, INC. GAAP to NON-GAAP RECONCILIATIONS (Dollars in thousands, except per share amounts) (unaudited) 13 Weeks Ended January 28, 2017 Cost of goods sold Selling, general and administrative
DICK'S SPORTING GOODS, INC. GAAP to NON-GAAP RECONCILIATIONS (Dollars in thousands, except per share amounts) (unaudited) 13 Weeks Ended January 28, 2017 Cost of goods sold Selling, general and administrative
Q %; 7.8% Q2 50%; 35% Q2 EPS
 At Home Group Inc. Announces Second Quarter Fiscal 2018 Financial Results Q2 net sales increased 23%; comparable store sales increased 7.8% Q2 net income increased 50%; pro forma adjusted net income 1
Investor Overview Presentation. August 2018
 Investor Overview Presentation August 2018 Forward-Looking Statements Statements about future results made in this presentation constitute forward-looking statements within the meaning of the Private Securities
DICK'S SPORTING GOODS, INC. GAAP to NON-GAAP RECONCILIATIONS (Dollars in thousands, except per share amounts) (unaudited)
 (unaudited)") 13 Weeks Ended October 28, 2017 Other income Income before income taxes Net income GAAP Basis $ (10,768) $ 57,930 $ 36,913 $ 0.35 % of Net Sales (0.55)% 2.98% 1.90% Sales tax refund 8,104 (8,104) (5,024)
13 Weeks Ended October 28, 2017 Other income Income before income taxes Net income GAAP Basis $ (10,768) $ 57,930 $ 36,913 $ 0.35 % of Net Sales (0.55)% 2.98% 1.90% Sales tax refund 8,104 (8,104) (5,024)
October 26, Earnings Summary Third Quarter FY 2016
 October 26, 2016 Earnings Summary Third Quarter FY 2016 SAFE HARBOR Certain information contained in this presentation may constitute forward-looking statements within the meaning of the Private Securities
Analog Devices, Third Quarter, Fiscal Schedule A Revenue and Earnings Summary (Unaudited) (In thousands, except per-share amounts)
 (In thousands, except per-share amounts)") Analog Devices, Third Quarter, Fiscal Schedule A Revenue and Earnings Summary (Unaudited) (In thousands, except per-share amounts) Revenue $ 1,433,902 $ 1,147,982 $ 869,591 Year-to-year change 65% 47 %
Analog Devices, Third Quarter, Fiscal Schedule A Revenue and Earnings Summary (Unaudited) (In thousands, except per-share amounts) Revenue $ 1,433,902 $ 1,147,982 $ 869,591 Year-to-year change 65% 47 %
Daseke, Inc. Q Earnings Presentation
 Daseke, Inc. Q2 2018 Earnings Presentation August 9, 2018 Important Disclaimers Forward-Looking Statements This presentation includes forward-looking statements within the meaning of the safe harbor provisions
CORRECTING and REPLACING United Natural Foods, Inc. Announces Fiscal 2017 Fourth Quarter and Full Fiscal Year Results and Fiscal 2018 Guidance
 CORRECTING and REPLACING United Natural Foods, Inc. Announces Fiscal 2017 Fourth Quarter and Full Fiscal Year Results and Fiscal 2018 Guidance September 13, 2017 PROVIDENCE, R.I.--(BUSINESS WIRE)--In the
UNITED STATES STEEL CORPORATION REPORTS FIRST QUARTER 2018 RESULTS
 NEWS RELEASE CONTACTS: Media Meghan Cox Manager Corporate Communications T - (412) 433-6777 E - mmcox@uss.com Investors/Analysts Dan Lesnak General Manager Investor Relations T - (412) 433-1184 E - dtlesnak@uss.com
UNITED STATES STEEL CORPORATION REPORTS THIRD QUARTER 2018 RESULTS
 Exhibit 99.1 NEWS RELEASE CONTACT: Media Meghan Cox Manager Corporate Communications T - (412) 433-6777 E - mmcox@uss.com Investors/Analysts Dan Lesnak General Manager Investor Relations T - (412) 433-1184
Second Quarter 2018 Earnings Presentation May 8, 2018
 Second Quarter 2018 Earnings Presentation May 8, 2018 Cautionary statements This presentation contains forward-looking statements that are subject to known and unknown risks and uncertainties, many of
RECONCILIATION OF NON-GAAP FINANCIAL MEASURES TO THE MOST DIRECTLY COMPARABLE GAAP FINANCIAL MEASURES
 RECONCILIATION OF NON-GAAP FINANCIAL MEASURES TO THE MOST DIRECTLY COMPARABLE GAAP FINANCIAL MEASURES For the Quarter Ended September 30, 2018 USE OF NON-GAAP FINANCIAL MEASURES Kraton Corporation ( Kraton
FINANCIAL REVIEW. R. Steve Kinsey. Chief Financial Officer and Chief Administrative Officer
 FINANCIAL REVIEW R. Steve Kinsey Chief Financial Officer and Chief Administrative Officer Information Regarding Forward-Looking Statements Statements contained in this press release that are not historical
Federal Signal Q Earnings Call August 7, Jennifer Sherman, President & Chief Executive Officer Ian Hudson, SVP, Chief Financial Officer
 Federal Signal Q2 2018 Earnings Call August 7, 2018 Jennifer Sherman, President & Chief Executive Officer Ian Hudson, SVP, Chief Financial Officer Safe Harbor This presentation contains unaudited financial
Debt. interested. reduction. Form 10-K. Margin EBITDA.
 RECONCILIATION OF NON-GAAP FINANCIAL MEASURESS TO THE MOST DIRECTLY COMPARABLE GAAP FINANICAL MEASURES Fourth Quarter and Fulll Year Ended December 31, 2017 USE OF NON-GAAP FINANCIAL MEASURES Kraton Corporation
First Quarter 2018 Earnings Call. May 10, 2018
 First Quarter 2018 Earnings Call May 10, 2018 Forward-Looking Statements This presentation includes certain statements relating to future events and our intentions, beliefs, expectations, and predictions
EARNINGS TELECONFERENCE
 EARNINGS TELECONFERENCE FOURTH QUARTER - FISCAL 2018 Q4 FISCAL 2018 1 FORWARD LOOKING STATEMENTS This presentation contains forward-looking statements based on management s current expectations, estimates
MYERS INDUSTRIES, INC. MARCH 9, 2017 FOURTH QUARTER & FULL YEAR EARNINGS PRESENTATION
 MYERS INDUSTRIES, INC. MARCH 9, 2017 FOURTH QUARTER & FULL YEAR EARNINGS PRESENTATION SAFE HARBOR STATEMENT Statements in this presentation concerning the Company s goals, strategies, and expectations
Earnings Teleconference. Second Quarter / Fiscal 2017
 Earnings Teleconference Second Quarter / Fiscal Forward Looking Statements This presentation contains forward-looking statements based on management s current expectations, estimates and projections. All
CIRCOR Reports Third-Quarter 2018 Financial Results
 CIRCOR Reports Third-Quarter Financial Results November 5, BURLINGTON, Mass.--(BUSINESS WIRE)--Nov. 5, -- CIRCOR International, Inc. (NYSE: CIR), a leading provider of flow control solutions and other
CIRCOR Reports Fourth-Quarter and Year-End 2018 Financial Results
 CIRCOR Reports Fourth-Quarter and Year-End 2018 Financial Results February 27, 2019 BURLINGTON, Mass.--(BUSINESS WIRE)--Feb. 26, 2019-- CIRCOR International, Inc. (NYSE: CIR), a leading provider of flow
UNITED STATES STEEL CORPORATION REPORTS FOURTH QUARTER AND FULL-YEAR 2017 RESULTS
 NEWS RELEASE CONTACTS: Media Meghan Cox Manager Corporate Communications T - (412) 433-6777 E - mmcox@uss.com Investors/Analysts Dan Lesnak General Manager Investor Relations T - (412) 433-1184 E - dtlesnak@uss.com
The Goodyear Tire & Rubber Company and Subsidiaries Consolidated Statements of Operations (unaudited)
") The Goodyear Tire & Rubber Company and Subsidiaries Consolidated Statements of Operations (unaudited) Three Months Ended (In millions, except per share amounts) NET SALES $ 3,830 $ 3,699 Cost of Goods
The Goodyear Tire & Rubber Company and Subsidiaries Consolidated Statements of Operations (unaudited) Three Months Ended (In millions, except per share amounts) NET SALES $ 3,830 $ 3,699 Cost of Goods
EVERETT, WA, October 26, Fortive Corporation ( Fortive ) (NYSE: FTV) today announced results for the third quarter 2017.
 (NYSE: FTV) today announced results for the third quarter 2017.") Fortive Reports Third Quarter Results EVERETT, WA, October 26, - Fortive Corporation ( Fortive ) (NYSE: FTV) today announced results for the third quarter. For the third quarter ended, net earnings were
Fortive Reports Third Quarter Results EVERETT, WA, October 26, - Fortive Corporation ( Fortive ) (NYSE: FTV) today announced results for the third quarter. For the third quarter ended, net earnings were
Diluted EPS $0.46 $0.46 0% $1.16 $1.26 (8)%
%") Donaldson Reports Third Quarter Results Donaldson Company, Inc. (NYSE: DCI) announced its financial results for its fiscal 2013 third quarter. Summarized financial results are as follows (dollars in millions,
Donaldson Reports Third Quarter Results Donaldson Company, Inc. (NYSE: DCI) announced its financial results for its fiscal 2013 third quarter. Summarized financial results are as follows (dollars in millions,
Q4 Fiscal 2017 Earnings Commentary. March 27, 2018
 Q4 Fiscal 2017 Earnings Commentary March 27, 2018 The financial measures discussed below include both GAAP and adjusted non-gaap financial measures. In connection with the restructuring of its ivivva operations,
Milacron Holdings Corp. Reports Third Quarter 2018 Results. Margin expansion and increased cash flow generation highlight solid third quarter
 Milacron Holdings Corp. Reports Third Quarter 2018 Results Margin expansion and increased cash flow generation highlight solid third quarter 2018 Third Quarter Overview Sales of $308.3 million decreased
Milacron Holdings Corp. Reports Full Year & Fourth Quarter 2018 Results
 Exhibit 99.1 Milacron Holdings Corp. Reports Full Year & Fourth Quarter 2018 Results Milacron closes 2018 with strong cash flow and concludes its multi-year restructuring initiative Full Year 2018: Sales
Overview Presentation to Investors. February 2016
 Overview Presentation to Investors February 2016 Forward-Looking Statements Statements about future results made in this presentation constitute forward-looking statements within the meaning of the Private
The Sherwin-Williams Company Reports 2016 Second Quarter Financial Results
 The Sherwin-Williams Company Reports 2016 Second Quarter Financial Results Second quarter consolidated net sales increased 2.8% to a record $3.22 billion in the quarter and increased 3.8% to $5.79 billion
WYNDHAM DESTINATIONS Supplementary Financial Information
 WYNDHAM DESTINATIONS Supplementary Financial Information May 2, 2018 Disclaimers Certain statements in this presentation constitute forward-looking statements within the meaning of Section 27A of the Securities
Q1 Fiscal Supplemental Slides. December 6, 2018
 Q1 Fiscal 2019 Supplemental Slides December 6, 2018 Disclaimer These forward looking statements involve risks and uncertainties and are based on current expectations and management estimates; actual results
First Quarter 2016 Business Update
 Focused. First Quarter 2016 Business Update Innovative. Investor Presentation April 27, 2016 Performance Driven. Disclaimer Statement Regarding Safe Harbor For Forward-Looking Statements This presentation
Q215 Earnings Call. August 5, Silver Spring Networks. All rights reserved.
 Earnings Call August 5, 2015 Forward-Looking Statements This document contains forward-looking statements that involve risks and uncertainties. These forwardlooking statements include statements regarding
Q Earnings. GAAP to Non-GAAP Reconciliation
 Q1 2012 Earnings GAAP to Non-GAAP Reconciliation This presentation contains forward-looking statements relating to, among other things, our outlook for full year 2012 bookings, adjusted EBITDA, stock-based
LKQ CORPORATION (Exact name of registrant as specified in its charter)
") UNITED STATES SECURITIES AND EXCHANGE COMMISSION WASHINGTON, D.C. 20549 FORM 8-K Current Report Pursuant to Section 13 or 15(d) of The Securities Exchange Act of 1934 Date of Report (Date of earliest event
UNITED STATES SECURITIES AND EXCHANGE COMMISSION WASHINGTON, D.C. 20549 FORM 8-K Current Report Pursuant to Section 13 or 15(d) of The Securities Exchange Act of 1934 Date of Report (Date of earliest event
Q RESULTS. 19 July 2017 HAROLD GODDIJN CEO TACO TITULAER CFO
 Q2 2017 RESULTS 19 July 2017 HAROLD GODDIJN CEO TACO TITULAER CFO Our strategy is to build on our leading position in navigation technologies and to provide location content, software, and services to
Non-GAAP Reconciliations Second Quarter 2017 Published August 2, 2017
 Non-GAAP Reconciliations Second Quarter 2017 Published August 2, 2017 We supplement our financial information prepared in accordance with GAAP with certain non-gaap measures including Adjusted EBITDA (earnings
MYERS INDUSTRIES, INC. First Quarter 2018 Earnings Presentation
 MYERS INDUSTRIES, INC. First Quarter 2018 Earnings Presentation SAFE HARBOR STATEMENT & NON-GAAP MEASURES Statements in this presentation concerning the Company s goals, strategies and expectations for
SECOND QUARTER 2018 BUSINESS REVIEW. Jonathan W. Painter, President & CEO Michael J. McKenney, Executive Vice President & CFO
 SECOND QUARTER 2018 BUSINESS REVIEW Jonathan W. Painter, President & CEO Michael J. McKenney, Executive Vice President & CFO Forward-Looking Statements The following constitutes a Safe Harbor statement
BankUnited, Inc. January 2019
 BankUnited, Inc. January 2019 Forward-Looking Statements This presentation contains forward-looking statements within the meaning of the Private Securities Litigation Reform Act of 1995 that reflect the
Knoll, Inc. Third Quarter 2016 Investor Presentation Knoll Inc.
 Knoll, Inc. Third Quarter 2016 Investor Presentation 2015 Knoll Inc. ANDREW COGAN, CEO CRAIG SPRAY, SVP & CFO August 15, 2016 Forward-Looking Statements/Non-GAAP Measures This presentation includes forward-looking
VISTEON CORPORATION AND SUBSIDIARIES CONSOLIDATED STATEMENTS OF OPERATIONS (Dollars in Millions, Except Per Share Data) (Unaudited)
 (Unaudited)") CONSOLIDATED STATEMENTS OF OPERATIONS (Dollars in Millions, Except Per Share Data) (Unaudited) Three Months Ended Six Months Ended June 30 June 30 2018 2017 2018 2017 Sales $ 758 $ 774 $ 1,572 $ 1,584
CONSOLIDATED STATEMENTS OF OPERATIONS (Dollars in Millions, Except Per Share Data) (Unaudited) Three Months Ended Six Months Ended June 30 June 30 2018 2017 2018 2017 Sales $ 758 $ 774 $ 1,572 $ 1,584
Annual Reconciliation of GAAP to Adjusted Non-GAAP Financials as Disclosed in the Company s Annual Earnings Press Release
 Annual Reconciliation of GAAP to Adjusted Non-GAAP Financials as Disclosed in the Company s Annual Earnings Press Release The 2017-2015 adjusted amounts presented below contain financial measures, such
Cooper Standard Reports Third Quarter Results; Raises Sales Guidance, Affirms Midpoint for Full-year Adjusted EBITDA Margin
 October 31, 2017 Cooper Standard Reports Third Quarter Results; Raises Sales Guidance, Affirms Midpoint for Full-year Adjusted EBITDA Margin NOVI, Mich., Oct. 31, 2017 /PRNewswire/ -- Cooper-Standard Holdings
Gardner Denver Reports Record First Quarter 2018 Results and Increases EBITDA Guidance for Full Year
 April 26, 2018 Gardner Denver Reports Record First Quarter 2018 Results and Increases EBITDA Guidance for Full Year Revenues of $619.6 million increased 29% over the prior year, supported by strong and
Fourth Quarter and FY 2018 Earnings Presentation November 28, 2018
 Fourth Quarter and FY 2018 Earnings Presentation November 28, 2018 Cautionary statements This presentation contains forward-looking statements that are subject to known and unknown risks and uncertainties,
Second Quarter Financial Results. Conference Call. Presentation
 Second Quarter 2018 Financial Results Conference Call Presentation FARMER MAC Speakers Lowell Junkins R. Dale Lynch Anjali D. Desai John C. Covington Acting President and Chief Executive Officer Executive
Q Earnings. GAAP to Non-GAAP
 Q4 2011 Earnings GAAP to Non-GAAP Reconciliation This presentation contains forward-looking statements relating to, among other things, our outlook for full year 2012 bookings, adjusted EBITDA, stock-based
SENSATA TECHNOLOGIES REPORTS SECOND QUARTER 2017 FINANCIAL RESULTS
 SENSATA TECHNOLOGIES REPORTS SECOND QUARTER 2017 FINANCIAL RESULTS Company delivers strong results and raises midpoint of organic revenue growth and adjusted EPS guidance for FY-17 Hengelo, the Netherlands
During the year, the Company achieved a number of milestones in executing its growth strategy:
 Party City Announces Fourth Quarter and Full Year 2015 Results Revenue increase of 4% 1 on a constant currency basis to a record $2.29 billion for fiscal year 2015 Adjusted Net Income increase of 32% in
Non-GAAP Reconciliations Third Quarter 2017 Published November 7, 2017
 Non-GAAP Reconciliations Third Quarter 2017 Published November 7, 2017 We supplement our financial information prepared in accordance with GAAP with certain non-gaap measures including Adjusted EBITDA
Clean Energy Reports 75.2 Million Gallons Delivered and Revenue of $85.8 Million for First Quarter of 2015
 May 11, 2015 Clean Energy Reports 75.2 Million Gallons Delivered and Revenue of $85.8 Million for First Quarter of 2015 NEWPORT BEACH, Calif.--(BUSINESS WIRE)-- Clean Energy Fuels Corp. (NASDAQ: CLNE)