Investor Presentation 30 th Annual ROTH Conference. Dr. Pierre-Yves Lesaicherre, President and CEO
|
|
|
- Aubrie Simon
- 6 years ago
- Views:
Transcription

1 Investor Presentation 30 th Annual ROTH Conference Dr. Pierre-Yves Lesaicherre, President and CEO March 13 th, 2018
2 Forward-Looking Statements This communication contains forward-looking statements within the meaning of the safe harbor provisions of the Private Securities Litigation Reform Act of 1995, including, but not limited to statements regarding Nanometrics ( us our or the Company ) future financial results, including, but not limited to our market share, industry demand and growth. These statements are not guarantees of future performance, involve certain risks, uncertainties and assumptions that are difficult to predict, and are based upon assumptions as to future events that may not prove accurate. Therefore, actual outcomes and results may differ materially from what is expressed herein. In any forward-looking statement in which Nanometrics expresses an expectation or belief as to future results, such expectation or belief is expressed in good faith and believed to have a reasonable basis, but there can be no assurance that the result will be achieved. The risks and uncertainties include, but are not limited to: our ability to achieve desired product mix and pricing; our ability to achieve desired market position; growth in target industries; levels and timing of capital expenditures in our target industries; customer adoption of certain technologies; market acceptance and timing of acceptance of our new products; interruptions or changes to supply chain; our ability to identify, complete and integrate acquisitions; and other economic, business, competitive and/or regulatory factors affecting Nanometrics businesses generally, including those set forth in Nanometrics filings with the SEC, including its Annual Report on Form 10-K for its most recent fiscal year, its most recent Quarterly Reports on Form 10-Q and its Current Reports on Form 8-K. All forward-looking statements included in this communication are based on information available to Nanometrics on the date hereof. We disclaim any intent or obligation to update publicly any forward-looking statements, whether in response to new information, future events, or otherwise. 2


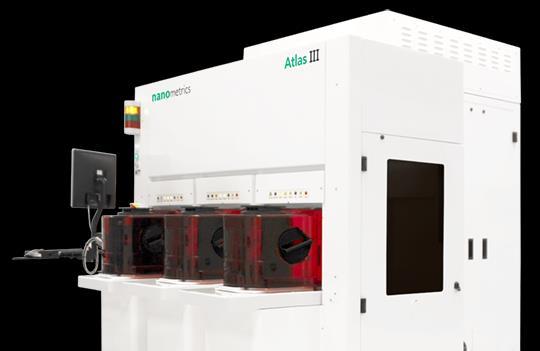


3 NANO: Leading Solutions for In-Line Process Control Comprehensive Suite of Highly- Differentiated Systems and Solutions Atlas IMPULSE NanoCD T3 UniFire Utilizing High-Speed, Non-Destructive In-Line Technologies Ellipsometry Scatterometry Interferometry Photoluminescence Inspection Technology Inflection Points Expanding Our Market, Footprint and Share FinFET 3D-NAND Novel Memory Structures Advanced 3D Packaging 3


4 Yield Systems and Software for Yield Management Throughout the Fab Pilot Ramp High Volume Manufacturing (HVM) In-line information accelerates yield ramp Time Tool of record at all major logic, foundry, DRAM and 3D-NAND manufacturers Deployed in every fab making sub-10nm logic devices ~80% share of 3D-NAND OCD applications: CMP, Deposition, Etch OCD = Optical Critical Dimension CVD = Chemical Vapor Deposition CMP = Chemical Mechanical Planarization 4

 Precision Signal to")


5 Atlas III The OCD Tool For All Leading Edge Devices Atlas III vs. Atlas II+ Atlas Shipments (Units) Precision Signal to Noise Throughput 2X Better 3X Better 25% Faster Atlas III Atlas III Atlas II+ Atlas II Atlas Adoption Device Customer Evaluation Pilot HVM DRAM 1 2 3D NAND Logic/ Foundry
6 Business Highlights and Growth Outlook 2017 Business Highlights 2018 Growth Drivers * Record 3D-NAND Sales Record Memory Sales Record OCD Sales Record Service Revenues Atlas III >50% of Automated System Sales SpectraProbe and NanoDiffract 4 Software Launches Continued Robust Industry Spending Continued Share Gains Increased Spending by Domestic China Fabs Increasing Contribution from Software and Analytics Increasing Contribution from Thin-Film Metrology and Materials Characterization First Revenues Domestic China 3D- NAND Introduction of New Product Platform * Outlook as of February 6 th, 2018 conference call. 6

7 Revenue and Operating Expenses in $M Operating Margin % Profitable Revenue Growth and Outperformance Revenue Outperformance Profitable Growth CY Revenues vs Year Financial Performance Trend 200% $300 20% 190% 4 Sequential Years of Double-Digit Revenue Growth 180% 4-Year CAGR of 16% $250 15% 170% Highest Organic Growth Rate in Process Control $200 10% 160% 150% $150 5% 140% 130% $100 0% 120% $50-5% 110% 100% $- $144 $166 $187 $221 $ % WFE NANO KLAC NVMI (Includes 2015 Revera Acq.) RTEC Revenues Operating Expenses Operating Margin * Total CY Revenues obtained from SEC filings For NVMI, Revera acquisition closed May WFE estimates are consensus among ~10 sellside analyst models as of February 28 th. Reflects non-gaap operating margin (reconciliation at end of presentation). 7


 (OCD & Thin (Optical (Optical")

8 Organic Growth Roadmap to $300M in Revenues ($ Millions) $259 $10-$20 $10-$20 $25-$30 $10-$14 $12-$15 $300M $15-$20 $5-$10 $5-$10 $10-$15 $14-$20 $20-$25 $15-$20 $221 $221 $30-$40 $40-$50 $20-$25 $20-$30 $30-$40 $187 $187 $166 $ Market Market SAM Market Software SAM & SAM Software Advanced Software & & Share Growth (OCD & Thin Film) Share Expansion Growth Share Growth AnalyticsExpansion Packaging Analytics Analytics (OCD (CD-SEM & Thin Film) (OCD & Thin (Optical (Optical Use Case) Film) Metrology) Metrology) Service Service & & Support Support Materials Characterization OCD = Optical Critical Dimension CD-SEM = Critical Dimension Scanning Electron Microscope 8


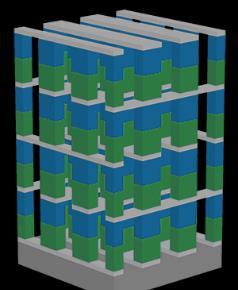
9 OCD Enabling 3D Process Control Metrology Foundry / IDM Logic NAND Flash Planar FinFET Planar 3D CD-SEM In-line & integrated solutions Non-destructive & high-speed OCD Profile OCD 3D Model Full structure detail Depth & width profile Atomic-level sensitivity 9

 3D-NAND Gen 4+")


")


")

10 3D Technology Driving Increased Demand for OCD NAND: Data Density 1X Planar Gen 1-3 (24-64 pairs) 3D-NAND Gen 4+ (96+ pairs) 3D-NAND Critical Process Steps >50 >50 Increasing OCD Recipes >10 >20 Increasing Planar G1 3D-NAND Gx 3D-NAND Increase in Intensity vs Planar 10-20% >60% Foundry/Logic: Speed & Power Planar FinFET NanoWire Critical Process Steps >100 >150 Increasing OCD Recipes >20 >40 Increasing Planar 3D FinFET Nanowire (future) Increase in Intensity vs Planar ~25% >25% DRAM: Data Density 2X DRAM 1X DRAM ReRAM Critical Process Steps >100 >100 Increasing OCD Recipes >20 >30 Increasing DRAM Scaling ReRAM (emerging) Increase in Intensity vs Planar Same Increasing ReRAM = Resistive RAM (example of Novel Memory Structure) 10
11 New NANO IR Presentation [ ROTH-2018 ] Products & Applications Existing Market & Product Growth Strategy to $500M Revenue Existing Every One of 6 Leading Customers Every Key Market: 5 of 5 3D-NAND Multiple DRAM Foundry Logic Logic IDM 2017 Revenue: $259M Market New Share Gains DRAM Domestic China Fabs Foundry/Logic IDM/New Devices Films Footprint Expansion New Product Features & Improved Tool Performance Expanded Applications for Litho, Etch & CVD Expand Service Business SAM Expansion New Product Platforms - Increased R&D Investment SW & Data Analytics M&A 11
12 Leverage ToR Positions to Expand Applications and Fab Footprint Fab Position Device Position Customer Etch Transistor Deposition Lithography Interconnect FinFET/ Logic 3D-NAND DRAM Novel Memory A B C D E F Tool of Record Position Opportunity 12
13 Financial Model Incremental Margin Model: Gross Margin of 55% - 65% Operating Margin of 45% - 55% Annual Revenue: 2016 Actual $221M 2017 Actual $259M 2018 Model $400M Model $500M Model Gross Margin 52% 53% 55% - 56% 56% - 57% 57% - 60% Operating Expenses 38% 36% 34% - 36% 29% - 31% 25% - 28% Operating Profit 14% 17% 19% - 21% 25% - 28% 30% - 35% Free Cash Flow (Cash From Operations Capex) 21% 6% ~20% 20% - 25% >25% Tax Rate 12% 29% ~25% ~25% ~25% NOTE: Financial model reflects the company s most recent commentary for 2018 investments in R&D and SG&A, as of February 6 th, This Non-GAAP financial model excludes the impact of amortization of acquired intangible assets and certain other charges. A reconciliation between GAAP operating results and non-gaap operating results is provided at the end of this presentation. 13

14 Combining Technology and Market Trends With Our Strengths and Execution to Deliver Superior Revenue Growth and Operating Leverage Market Leadership Share Gains and Expanding Footprint Serving Growth Markets, Expanding SAM Improving Financial Performance 14
15

16 Semi CapEx in $Billions Strong Multi-Year Cycle Driven by Top Spenders Semiconductor CapEx by Top Industry Spenders $28.0 $26.0 $24.0 $22.0 $20.0 $18.0 $16.0 $14.0 $12.0 $10.0 $8.0 $6.0 $4.0 $2.0 $- Samsung Intel TSMC SK Hynix Micron Alliance Toshiba Alliance Domestic China Est. Source: Capex by company obtained from press releases, SEC filings and conference call transcripts. Capex estimates for each period is an average from at least 10 industry analysts (or company guidance) as of February 28,
17 Increasing OCD Opportunity by Device/Node Device Type Node Relative Intensity (current node) Segment Opportunity/ 10K wspm Planar NAND 1X/1Y 1.0 $4M - $6M 3D NAND Gen $5M - $7M 3D NAND Gen $5M - $7M 3D NAND Gen $5M - $8M 3D NAND Gen $6M - $10M DRAM 2Y/1X 1.2 $5M - $8M FOUNDRY/LOGIC 1X/1Y 2.4 $10M - $14M FOUNDRY/LOGIC <10nm 2.6 $10M - $17M Source: Company Estimates wspm: wafer starts per month capacity 17


18 Revenue Segmentation Reflects Concentration of Spending Q4 17 Total Revenues by Geography Total Revenues by Product/Service Product Revenues by End Market 13% 14% 13% 9% 12% 31% 8% 9% 2% 19% 60% 28% 16% 67% Japan China S. Korea Singapore ROW Automated Integrated Mat. Char. Service DRAM NAND Logic/IDM Foundry Other Devices/Substrates FY % 16% 17% 10% 14% 13% 8% 19% 36% 12% 16% 59% 6% 51% Japan N. America China S. Korea ROW Automated Integrated Mat. Char. Service DRAM NAND Logic/IDM Foundry Other Devices/Substrates Mat. Char. = Materials Characterization Metrology Systems 18
19 Reconciliation of GAAP gross profit to non-gaap gross profit Q1 Q2 Q3 Q4 FY Q1 Q2 Q3 Q4 FY Q1 Q2 Q3 Q4 FY GAAP gross profit $ 23,379 $ 23,264 $ 22,219 $ 20,804 $ 89,667 $ 24,491 $ 28,425 $ 30,404 $ 30,804 $ 114,124 $ 28,447 $ 33,621 $ 30,660 $ 43,973 $ 136,701 Severance included in cost of revenues Amortization of intangible assets , , Reconciliation of GAAP operating income (loss) to non-gaap operating income (loss) Non-GAAP gross profit $ 24,011 23,721 $ 22,687 $ 21,273 $ 91,693 $ 24,926 $ 28,867 $ 30,838 $ 30,947 $ 115,578 $ 28,635 $ 33,726 $ 30,850 $ 44,100 $ 137,311 GAAP gross profit $ 23,379 23,264 $ 22,219 $ 20,804 $ 89,667 $ 24,491 $ 28,425 $ 30,404 $ 30,804 $ 114,124 - $ 28,447 $ 33,621 $ 30,660 $ 43,973 $ 136,701 - Total operating expenses 21,138 20,755 20,955 21,846 84,694 20,761 21,089 21,338 21,841 85,029 22,939 22,969 23,176 24,811 93,895 GAAP operating income (loss) $ 2,241 $ 2,509 $ 1,264 $ (1,042) $ 4,973 $ 3,730 $ 7,336 $ 9,066 $ 8,963 $ 29,095 $ 5,508 $ 10,652 $ 7,484 $ 19,162 $ 42,806 Non-GAAP adjustments to operating income (loss): Amortization of intangible assets included in cost of revenues , , Amortization of intangible assets included in operating expenses Restructuring ,322 1,380 (a) Severance costs ,249 Executive search costs Total non-gaap adjustments to operating income (loss) ,816 3, , ,810 Reconciliation of GAAP net income (loss) to non-gaap net income (loss) Non-GAAP operating income (loss) $ 2,969 $ 2,991 $ 1,758 $ 774 $ 8,493 $ 4,189 $ 7,778 $ 9,500 $ 9,106 $ 30,573 $ 5,844 $ 11,107 $ 7,867 $ 19,798 $ 44,616 GAAP operating income (loss) $ 2,241 $ 2,509 $ 1,264 $ (1,042) $ 4,973 $ 3,730 $ 7,336 $ 9,066 $ 8,963 $ 29,095 $ 5,508 $ 10,652 $ 7,484 $ 19,162 $ 42,806 Other income (expense) 632 (348) (449) (42) GAAP income (Loss) before income taxes 2,873 2,161 1,531 (998) 5,568 3,847 6,887 9,215 9,186 29,135 5,466 10,910 7,520 19,402 43,298 Provision (benefit) for income taxes , ,332 (17,468) (14,900) 114 2,622 1,756 8,604 13,096 Non-GAAP adjustments to net income (loss): RECONCILIATION OF GAAP TO NON-GAAP RESULTS (In thousands, except per share amounts) (Unaudited) Fiscal 2015 Fiscal 2016 GAAP net income (loss) $ 2,556 $ 1,344 $ 818 $ (1,814) $ 2,905 $ 3,467 $ 6,031 $ 7,883 $ 26,654 $ 44,035 $ 5,352 $ 8,288 $ 5,764 $ 10,798 $ 30,202 Total non-gaap adjustments to non-gaap operating income (loss) ,816 3, , ,810 Valuation allowance on deferred tax assets and other adjustments (18,443) (18,443) (b) Tax Reform 2,569 2,569 Adj. to tax provision: discrete tax items and tax effect of non-gaap adjustments (901) (948) (491) (432) (2,772) Non-GAAP net income (loss) $ 3,284 $ 1,826 $ 1,312 $ 2 $ 6,425 $ 3,926 $ 6,473 $ 8,317 $ 8,354 $ 27,070 $ 4,787 $ 7,795 $ 5,656 $ 13,571 $ 31,809 Fiscal 2017 Per share data: GAAP net income (loss) per diluted share $ 0.11 $ 0.06 $ 0.03 $ (0.07) $ 0.12 $ 0.14 $ 0.24 $ 0.31 $ 1.04 $ 1.75 $ 0.21 $ 0.32 $ 0.22 $ 0.42 $ 1.17 Non-GAAP net income (loss) per diluted share $ 0.14 $ 0.08 $ 0.05 $ 0.00 $ 0.26 $ 0.16 $ 0.26 $ 0.33 $ 0.33 $ 1.08 $ 0.19 $ 0.30 $ 0.22 $ 0.53 $ 1.23 Shares used in non-gaap diluted income per share calculation 24,257 24,285 24,352 24,446 24,375 24,597 24,927 25,282 25,514 25,153 25,833 25,906 25,932 25,819 25,919 Reconciliation of net cash provided by operating activities to free cash flow GAAP net cash provided by operating activities (5,874) (1,283) 9,505 (777) 1, ,721 20,881 11,584 45,685 3,075 7,183 5,126 5,219 20,603 Purchase of property and equipment (502) (541) (322) (481) (1,846) (610) (1,918) (821) (650) (3,999) (47) (1,489) (806) (2,862) (5,204) Free cash flow $ (6,376) $ (1,824) $ 9,183 $ (1,258) $ (275) $ (111) $ 10,803 $ 20,060 $ 10,934 $ 41,686 $ 3,028 $ 5,694 $ 4,320 $ 2,357 $ 15,399 Notes: (a) Includes severance, facility lease termination and other costs associated with consolidating operations into the U.S. and management changes. (b) Reflects a non-cash valuation allowance release related to certain deferred tax assets. 19
20th Annual Needham Growth Conference
 Investor Presentation 20th Annual Needham Growth Conference Pierre-Yves Lesaicherre, President and CEO January 18, 2018 Forward-Looking Statements This communication contains forward-looking statements
Investor Presentation
 Investor Presentation Dr. Pierre-Yves Lesaicherre, President and CEO Q1 2019 Forward-Looking Statements This communication contains forward-looking statements within the meaning of the safe harbor provisions
17 th Annual Needham Growth Conference. Dr. Timothy Stultz, President and CEO Jeffrey Andreson, CFO
 17 th Annual Needham Growth Conference Dr. Timothy Stultz, President and CEO Jeffrey Andreson, CFO January 2015 Forward-Looking Statements This communication contains forward-looking statements within
Nanometrics Investor Presentation Q4 2014
 Nanometrics Investor Presentation Q4 2014 Forward-Looking Statements This communication contains forward-looking statements within the meaning of the safe harbor provisions of the Private Securities Litigation
Nanometrics Investor Presentation. CEO Investor Summit July 2014
 Nanometrics Investor Presentation CEO Investor Summit July 2014 Forward-Looking Statements This communication contains forward-looking statements within the meaning of the safe harbor provisions of the
Investor Presentation
 Investor Presentation May 2018 PASSION. INNOVATION. PERFORMANCE Cautionary Statement Regarding Forward-Looking Statements This presentation includes statements that constitute forward-looking statements
Filed by Nanometrics Incorporated Pursuant to Rule 425 under the Securities Act of 1933 and deemed filed pursuant to Rule 14a-12 under the Securities
 Filed by Nanometrics Incorporated Pursuant to Rule 425 under the Securities Act of 1933 and deemed filed pursuant to Rule 14a-12 under the Securities Exchange Act of 1934 Commission File No. 000-13470
Investor Presentation MAY 2017
 Investor Presentation MAY 2017 Safe Harbor This presentation contains, or may be deemed to contain, "forward-looking statements" (as defined in the US Private Securities Litigation Reform Act of 1995)
Q Conference Call
 Q2 2017 Conference Call Veeco Instruments Inc. August 3, 2017 1 Investor Presentation Safe Harbor To the extent that this presentation discusses expectations or otherwise makes statements about the future,
Lam Research Corporation
 2017 Lam Research Corp. 1.25.2017 1 Lam Research Corporation December Quarter 2016 Financial Results January 25, 2017 2017 Lam Research Corp. 1.25.2017 2 Cautionary Statement Regarding Forward-Looking
Q Conference Call
 Q1 2018 Conference Call > Veeco Instruments Inc. > May 7, 2018 1 Q1 2018 Conference Call 2018 Veeco Instruments Inc. Safe Harbor To the extent that this presentation discusses expectations or otherwise
INVESTOR PRESENTATION
 INVESTOR PRESENTATION Q4 2016 RESULTS March 2, 2017 October 26, 2016 ASM proprietary information 2017 ASM CAUTIONARY NOTE REGARDING FORWARD-LOOKING STATEMENTS Cautionary note regarding forward-looking
ASML reports first-quarter sales and gross margin in line with guidance Strong Q2 outlook underpinned by 10 nanometer logic ramp
 ASML reports first-quarter sales and gross margin in line with guidance Strong Q2 outlook underpinned by 10 nanometer logic ramp ASML 2016 First-Quarter Results Veldhoven, the Netherlands Forward looking
Lam Research Corporation September Quarter 2017 Financial Results
 Lam Research Corporation September Quarter 2017 Financial Results October 17, 2017 2017 Lam Research Corp. 10.17.2017 1 Cautionary Statement Regarding Forward-Looking Statements This presentation and the
2018 Cabot Microelectronics Corporation 1
 1 Safe Harbor Statement The information contained in and discussed during this presentation may include forward-looking statements within the meaning of federal securities regulations. These forward-looking
9 th Annual CEO Summit Investor Presentation July 12, Cabot Microelectronics Corporation
 1 9 th Annual CEO Summit Investor Presentation July 12, 2017 Safe Harbor Statement 2 The information contained in and discussed during this presentation may include forward-looking statements within the
Semiconductor Manufacturing International Corporation
 14 Semiconductor Manufacturing International Corporation http://www.smics.com 18 Zhangjiang Road Pudong New Area Shanghai, 201203 People s Republic of China NEWS RELEASE All currency figures stated in
ASML Q1 net sales in line with guidance at 1.65 billion, gross margin 47.2%
 ASML Q1 net sales in line with guidance at 1.65 billion, gross margin 47.2% ASML 2015 First Quarter Results Veldhoven, the Netherlands April 15, 2015 Forward looking statements This document contains statements
Lam Research Corporation
 Lam Research Corp. 7.27.2016 1 Lam Research Corporation June Quarter 2016 Financial Results July 27, 2016 Lam Research Corp. 7.27.2016 2 Cautionary Statement Regarding Forward-Looking Statements This presentation
ASML confirms full-year sales guidance, supported by solid backlog
 ASML confirms full-year sales guidance, supported by solid backlog ASML 2014 Third Quarter Results Veldhoven, the Netherlands October 15, 2014 Forward looking statements This document contains statements
Q Conference Call. Veeco Instruments, Inc. August 2, 2018
 Q2 2018 Conference Call Veeco Instruments, Inc. August 2, 2018 Safe Harbor To the extent that this presentation discusses expectations or otherwise makes statements about the future, such statements are
INVESTOR PRESENTATION
 INVESTOR PRESENTATION Q4 2018 RESULTS February 21, 2019 October 26, 2016 ASM proprietary information 2019 ASM CAUTIONARY NOTE REGARDING FORWARD-LOOKING STATEMENTS Cautionary Note Regarding Forward-Looking
VERSUM MATERIALS. GUILLERMO NOVO EXECUTIVE VICE PRESIDENT, MATERIALS TECHNOLOGIES, AIR PRODUCTS Will be - CEO, VERSUM MATERIALS
 VERSUM MATERIALS GUILLERMO NOVO EXECUTIVE VICE PRESIDENT, MATERIALS TECHNOLOGIES, AIR PRODUCTS Will be - CEO, VERSUM MATERIALS Jefferies Industrials Conference August 2016 FORWARD-LOOKING STATEMENTS This
Q Conference Call
 Q4 2017 Conference Call > Veeco Instruments Inc. > February 12, 2018 1 Q4 2017 / FY 2017 Conference Call Veeco Instruments Inc 2018 Safe Harbor To the extent that this presentation discusses expectations
ASML Q2 sales as guided, gross margin tops guided range Full-year sales impacted by timing of logic capacity ramp
 ASML Q2 sales as guided, gross margin tops guided range Full-year sales impacted by timing of logic capacity ramp ASML 2014 Second Quarter Results Veldhoven, the Netherlands July 16, 2014 Forward looking
Investor Presentation. September 5 st, 2018
 Investor Presentation September 5 st, 2018 Forward-Looking Statements; Non-GAAP Financial Measures This presentation contains forward-looking statements that are based on our current expectations, forecasts
ASML 2007 Annual and Fourth Quarter Results
 ASML 2007 Annual and Fourth Quarter Results Technology leadership to provide robust H1 sales and profit amid market uncertainty January 16, 2008 / Slide 1 Safe Harbor Safe Harbor Statement under the U.S.
Investor Presentation August 2017
 Investor Presentation August 2017 Veeco Instruments Inc. 1 Investor Presentation 2017 Veeco Instruments Inc. Safe Harbor To the extent that this presentation discusses expectations or otherwise makes statements
Investor Presentation. August 15, 2017
 Investor Presentation August 15, 2017 Forward-Looking Statements; Non-GAAP Financial Measures This presentation contains forward-looking statements that are based on our current expectations, forecasts
Q2 FY2018 (July - September 2017) Financial Announcement
 Financial Announcement") FY218 (July - September 217) Financial Announcement October 31, 217 Agenda: FY218 Consolidated Financial Summary Tetsuro Hori, Representative Director, CFO, Executive Vice President Business Environment
FY218 (July - September 217) Financial Announcement October 31, 217 Agenda: FY218 Consolidated Financial Summary Tetsuro Hori, Representative Director, CFO, Executive Vice President Business Environment
INVESTOR PRESENTATION
 INVESTOR PRESENTATION Q1 2016 RESULTS April 21, 2016 April 24, 2015 ASM proprietary information 2016 ASM CAUTIONARY NOTE REGARDING FORWARD-LOOKING STATEMENTS Cautionary Note Regarding Forward-Looking Statements:
FY2017 (Apr. 1, 2016 Mar. 31, 2017) Financial Announcement
 Financial Announcement") FY217 (Apr. 1, 216 Mar. 31, 217) Financial Announcement April 28, 217 Agenda: FY217 Consolidated Financial Summary Tetsuro Hori, Representative Director, Executive Vice President & General Manager Business
FY217 (Apr. 1, 216 Mar. 31, 217) Financial Announcement April 28, 217 Agenda: FY217 Consolidated Financial Summary Tetsuro Hori, Representative Director, Executive Vice President & General Manager Business
Brooks Automation Needham Healthcare Conference
 Brooks Automation Needham Healthcare Conference March 27, 2018 1 Safe Harbor Statement Safe Harbor Statement under the U.S. Private Securities Litigation Reform Act of 1995; certain matters in this presentation,
INVESTOR PRESENTATION
 INVESTOR PRESENTATION Q3 2018 RESULTS October 31, 2018 October 26, 2016 ASM proprietary information 2018 ASM CAUTIONARY NOTE REGARDING FORWARD-LOOKING STATEMENTS Cautionary Note Regarding Forward-Looking
INVESTOR PRESENTATION
 INVESTOR PRESENTATION Q2 2017 RESULTS July 25, 2017 October 26, 2016 ASM proprietary information 2017 ASM CAUTIONARY NOTE REGARDING FORWARD-LOOKING STATEMENTS Cautionary Note Regarding Forward-Looking
Creating a New Global Innovator. September 24, 2013
 Creating a New Global Innovator September 24, 2013 Today s Announcement Applied Materials and Tokyo Electron combining in a merger of equals Creates a new global innovator in Precision Materials Engineering
ASML 2008 First Quarter Results
 ASML 2008 First Quarter Results ASML continues to execute its leadership strategy and expects gradual order pick-up April 16, 2008 / Slide 1 Safe Harbor "Safe Harbor" Statement under the US Private Securities
Innovation Driving Growth. Winter 2018
 Innovation Driving Growth Winter 2018 Safe Harbor The company s guidance with respect to anticipated financial results for the fourth quarter ending December 31, 2018, potential future growth and profitability,
INVESTOR PRESENTATION
 INVESTOR PRESENTATION Q2 2018 RESULTS July 24, 2018 October 26, 2016 ASM proprietary information 2018 ASM CAUTIONARY NOTE REGARDING FORWARD-LOOKING STATEMENTS Cautionary Note Regarding Forward-Looking
ASML reports EUR 2.2 billion sales at 41.6% gross margin in Q view unchanged
 ASML reports EUR 2.2 billion sales at 41.6% gross margin in Q1 2019 view unchanged ASML 2019 First-Quarter Results Veldhoven, the Netherlands Slide 2 Agenda Investor key messages Business summary Outlook
Stronger than expected demand drives ASML Q1 sales
 Stronger than expected demand drives ASML Q1 sales Positive momentum expected to continue throughout 2017 ASML 2017 First-Quarter Results Veldhoven, the Netherlands Slide 2 Agenda Investor key messages
Q Conference Call. Veeco Instruments Inc. February 11, 2019
 Q4 2018 Conference Call Veeco Instruments Inc. February 11, 2019 Safe Harbor To the extent that this presentation discusses expectations or otherwise makes statements about the future, such statements
Peter Wennink Good morning / good afternoon ladies and gentlemen, and thank you for joining us for our Q4 and 2017 annual results conference call.
 ASML exceeds 9 billion net sales and 2 billion net income in 2017 Continued solid growth of sales and profitability expected in 2018 2018-2019 share buyback program announced of 2.5 billion, proposes 17%
ASML reports Q2 as guided and raises 2013 sales outlook Cymer consolidated for month of June
 ASML reports Q2 as guided and raises 2013 sales outlook Cymer consolidated for month of June ASML 2013 Second Quarter Results Veldhoven, the Netherlands July 17, 2013 Forward looking statements Safe Harbor
Innovation Driving Growth. Winter 2019
 Innovation Driving Growth Winter 2019 Safe Harbor The company s guidance with respect to anticipated financial results for the first quarter ending March 31, 2019, potential future growth and profitability,
INVESTOR PRESENTATION
 INVESTOR PRESENTATION Q4 2017 RESULTS February 28, 2018 October 26, 2016 ASM proprietary information 2018 ASM CAUTIONARY NOTE REGARDING FORWARD-LOOKING STATEMENTS Cautionary Note Regarding Forward-Looking
FY2016 (Apr. 1, 2015 Mar. 31, 2016) Financial Announcement
 Financial Announcement") FY216 (Apr. 1, 215 Mar. 31, 216) Financial Announcement April 26, 216 Agenda: FY216 Consolidated Financial Summary Tetsuro Hori, Corporate Director, Senior Vice President & General Manager Business Environment
FY216 (Apr. 1, 215 Mar. 31, 216) Financial Announcement April 26, 216 Agenda: FY216 Consolidated Financial Summary Tetsuro Hori, Corporate Director, Senior Vice President & General Manager Business Environment
Q1 FY2019 (April 1, 2018 June 30, 2018) Financial Announcement
 Financial Announcement") Q1 FY219 (April 1, 218 June 3, 218) Financial Announcement July 26, 218 Agenda: Q1 FY219 Consolidated Financial Summary Ken Sasagawa, Vice President, Accounting Dept. Business Environment and Financial
Q1 FY219 (April 1, 218 June 3, 218) Financial Announcement July 26, 218 Agenda: Q1 FY219 Consolidated Financial Summary Ken Sasagawa, Vice President, Accounting Dept. Business Environment and Financial
Lam Research Corporation December Quarter 2017 Financial Results
 Lam Research Corporation December Quarter Financial Results January 24, 2018 2018 Lam Research Corp. 1.24.2018 1 Cautionary Statement Regarding Forward-Looking Statements This presentation and the accompanying
CABOT MICROELECTRONICS CORPORATION FIRST QUARTER FISCAL 2018 CONFERENCE CALL SCRIPT JANUARY 25, 2018
 Good morning. With me today are David Li, President and CEO, Scott Beamer, who joined us as our new CFO earlier this month, and Bill Johnson, who recently retired as CFO. This morning we reported results
Deutsche Bank Access European TMT Conference London
 Deutsche Bank Access European TMT Conference London Franki D Hoore, Director Investor Relations 5 September 2012 Safe Harbor Slide 2 4 September 2012 "Safe Harbor" Statement under the US Private Securities
Veeco Investor Presentation. John Peeler, CEO. January 8, 2008
 Veeco Investor Presentation John Peeler, CEO January 8, 2008 Veeco Investment Themes We possess leading positions in our Process Equipment and Metrology market segments #1 or #2 in every technology we
The 55th Annual General Meeting of Shareholders June 19, 2018
 The 55th Annual General Meeting of Shareholders June 19, 2018 The 55 th Annual General Meeting of Shareholders 1 FY2018 Financial Report (FY2018: April 1, 2017 March 31, 2018) The 55 th Annual General
INVESTOR PRESENTATION
 INVESTOR PRESENTATION Q3 2017 RESULTS October 31, 2017 October 26, 2016 (updated on November 8, 2017) ASM proprietary information 2017 ASM CAUTIONARY NOTE REGARDING FORWARD-LOOKING STATEMENTS Cautionary
FormFactor, Inc. Reports 2018 First Quarter Results
 May 2, 2018 FormFactor, Inc. Reports 2018 First Quarter Results Company Delivers Results at the Top End of Financial Outlook LIVERMORE, Calif., May 02, 2018 (GLOBE NEWSWIRE) -- FormFactor, Inc. (Nasdaq:FORM)
UNITED STATES SECURITIES AND EXCHANGE COMMISSION Washington, D.C FORM 8-K
 UNITED STATES SECURITIES AND EXCHANGE COMMISSION Washington, D.C. 20549 FORM 8-K CURRENT REPORT PURSUANT TO SECTION 13 OR 15(d) OF THE SECURITIES EXCHANGE ACT OF 1934 Date of Report (Date of earliest event
Financial Results. First Quarter Fiscal 2018
 Financial Results First Quarter Fiscal 2018 2017 Micron Technology, Inc. All rights reserved. Information, products, and/or specifications are subject to change without notice. All information is provided
Strong DUV demand drives solid Q1 results and confirms positive outlook for 2018
 Strong DUV demand drives solid Q1 results and confirms positive outlook for 2018 Multiple EUV orders, including High-NA, demonstrate further adoption of EUV technology ASML 2018 First-Quarter Results Veldhoven,
January 24, Letter to Shareholders Q3 FY13 FY FY WEST SIXTH STREET, AUSTIN, TEXAS 78701
 January 24, 2013 Letter to Shareholders Q3 FY13 FY FY13 CIRRUS LOGIC, INC. 1 800 WEST SIXTH STREET, AUSTIN, TEXAS 78701 January 24, 2013 Dear Shareholders, Q3 was another great quarter for Cirrus Logic
INVESTOR PRESENTATION
 INVESTOR PRESENTATION Q1 2018 RESULTS April 19, 2018 October 26, 2016 ASM proprietary information 2018 ASM CAUTIONARY NOTE REGARDING FORWARD-LOOKING STATEMENTS Cautionary Note Regarding Forward-Looking
KULICKE & SOFFA INDUSTRIES NASDAQ: KLIC JUNE QUARTER 2018 INVESTOR PRESENTATION
 KULICKE & SOFFA INDUSTRIES JUNE QUARTER 2018 INVESTOR PRESENTATION SAFE HARBOR STATEMENT In addition to historical statements, this presentation contains statements relating to future events and our future
KULICKE & SOFFA INDUSTRIES, INC. NASDAQ: KLIC JUNE QUARTER 2017 INVESTOR PRESENTATION
 JUNE QUARTER 2017 INVESTOR PRESENTATION SAFE HARBOR STATEMENT In addition to historical statements, this press release contains statements relating to future events and our future results. These statements
Q Conference Call. Veeco Instruments Inc. November 1, 2018
 Q3 2018 Conference Call Veeco Instruments Inc. November 1, 2018 Safe Harbor To the extent that this presentation discusses expectations or otherwise makes statements about the future, such statements are
FY2015 (April 1, 2014 March 31, 2015) Financial Announcement
 Financial Announcement") FY215 (April 1, 214 March 31, 215) Financial Announcement Agenda: FY215 Consolidated Financial Summary Yoshiteru Harada, Corporate Director, Executive Officer Business Environment and Approach to Raising
FY215 (April 1, 214 March 31, 215) Financial Announcement Agenda: FY215 Consolidated Financial Summary Yoshiteru Harada, Corporate Director, Executive Officer Business Environment and Approach to Raising
ASMI ANNUAL MEETING OF SHAREHOLDERS 2017
 ASMI ANNUAL MEETING OF SHAREHOLDERS 2017 May 22, 2017 ASMI annual meeting of shareholders 2017 ASMI 1 ASMI ANNUAL MEETING OF SHAREHOLDERS 2017 Chuck del Prado, President & CEO May 22, 2017 ASMI annual
Fourth Quarter and Full Year 2017 Results Conference Call. March 9, 2018
 Fourth Quarter and Full Year 2017 Results Conference Call March 9, 2018 Forward-Looking Statements and Non-GAAP Financial Measures This presentation includes information that may constitute forward-looking
Financial Results. Fourth Quarter Fiscal 2016
 Financial Results Fourth Quarter Fiscal 2016 2016 Micron Technology, Inc. All rights reserved. Information, products, and/or specifications are subject to change without notice. All information is provided
KULICKE & SOFFA INDUSTRIES NASDAQ: KLIC DECEMBER QUARTER 2018 INVESTOR PRESENTATION
 KULICKE & SOFFA INDUSTRIES DECEMBER QUARTER 2018 INVESTOR PRESENTATION SAFE HARBOR STATEMENT In addition to historical statements, this press release contains statements relating to future events and our
Oppenheimer 15th Annual Technology, Internet & Communications Conference
 Oppenheimer 15th Annual Technology, Internet & Communications Conference Judy Bruner Executive Vice President, Administration & Chief Financial Officer Forward Looking Statements During our meeting today,
Bruker Corporation (NASDAQ: BRKR)
") Bruker Corporation (NASDAQ: BRKR) Q4 2017 Earnings Presentation February 8, 2018 Frank Laukien, President & CEO Anthony Mattacchione, SVP & CFO Miroslava Minkova, Head of Investor Relations Innovation
Bruker Corporation (NASDAQ: BRKR) Q4 2017 Earnings Presentation February 8, 2018 Frank Laukien, President & CEO Anthony Mattacchione, SVP & CFO Miroslava Minkova, Head of Investor Relations Innovation
Second Quarter of Fiscal 2019 Earnings Presentation
 Second Quarter of Fiscal 2019 Earnings Presentation January 24, 2019 2019 Western Digital Corporation or its affiliates. All rights reserved. Forward-Looking Statements Safe Harbor Disclaimers This presentation
THIRD QUARTER 2018 FINANCIAL RESULTS OCTOBER 24, AMD Q FINANCIAL RESULTS OCTOBER 24, 2018
 THIRD QUARTER 2018 FINANCIAL RESULTS OCTOBER 24, 2018 1 AMD Q3 2018 FINANCIAL RESULTS OCTOBER 24, 2018 This presentation contains forward-looking statements concerning Advanced Micro Devices, Inc. (AMD)
Steve Martens VP Investor Relations FY13 Q3
 Steve Martens VP Investor Relations steve.martens@molex.com FY13 Q3 Forward-Looking Statement Statements in this presentation that are not historical are forward-looking and are subject to various risks
Second Quarter Fiscal Year Supplemental Financial Information Jan 25, 2018
 Second Quarter Fiscal Year 2018 Supplemental Financial Information Jan 25, 2018 Q2-18 Key Financials Shipments $1,041M Revenues $976M Net Income* $309M Diluted EPS* $1.97 * Non-GAAP, See appendix for GAAP
Company Press Release. Nova Reports Second Quarter 2018 Results
 Company Contact: Dror David, Chief Financial Officer Nova Measuring Instruments Ltd. Tel: +972-73-229-5760 E-mail: info@novameasuring.com www.novami.com Investor Relations Contact: Miri Segal MS-IR LLC
NEWS RELEASE. SMIC Reports 2014 Fourth Quarter Results. All currency figures stated in this report are in US Dollars unless stated otherwise.
 Contact: Investor Relations +86-21-3861-0000 ext. 12804 ir@smics.com NEWS RELEASE SMIC Reports 2014 Fourth Quarter Results All currency figures stated in this report are in US Dollars unless stated otherwise.
Q EARNINGS 8/1/2018 CONFERENCE CALL. Copyright 2017 ARRIS Enterprises, LLC. All rights reserved
 Q2 2018 EARNINGS 8/1/2018 CONFERENCE CALL Copyright 2017 ARRIS Enterprises, LLC. All rights reserved Safe Harbor FORWARD-LOOKING STATEMENTS Statements made in this presentation, including those related
A brief recap. Industry leader. Expanding TAM investing in the future. Industry trends playing to our strengths
 Disclosures This presentation contains non-gaap financial measures relating to our performance. You can find the reconciliation of these measures to the most directly comparable GAAP financial measure
TERADYNE FINANCIAL RESULTS FOR Q1-2015
 Because Technology Never Stops TERADYNE FINANCIAL RESULTS FOR Q1-2015 May 1, 2015 SAFE HARBOR This presentation contains forward-looking statements regarding future business prospects, Teradyne s results
Infineon Reports Results for the Fourth Quarter and the 2005 Financial Year
 Infineon Reports Results for the Fourth Quarter and the 2005 Financial Year Fourth quarter revenues were Euro 1.73 billion, up 8 percent sequentially, reflecting increased sales in all operating segments.
Fourth Quarter & Full Year 2018 Results. February 26, 2018 (U.S. Eastern Time) February 27, 2018 (Singapore / Hong Kong Time)
 February 27, 2018 (Singapore / Hong Kong Time)") Fourth Quarter & Full Year Results February 26, (U.S. Eastern Time) February 27, (Singapore / Hong Kong Time) Disclaimer This presentation by Sea Limited ( Sea ) contains forward-looking statements. These
Fourth Quarter & Full Year Results February 26, (U.S. Eastern Time) February 27, (Singapore / Hong Kong Time) Disclaimer This presentation by Sea Limited ( Sea ) contains forward-looking statements. These
Investor Update. July 11, 2018
 Investor Update July 11, 2018 Safe Harbor This presentation contains, and management may make, forwardlooking statements within the meaning of the Private Securities Litigation Reform Act of 1995. The
Shaping the Future of Electronics
 Shaping the Future of Electronics Asher Levy, CEO New York, NY November 6 th, 2017 Forward-Looking Statements The matters discussed in this presentation are forward-looking statements within the meaning
1Q FY2016 (April 1, 2015 June 30, 2015) Financial Announcement
 Financial Announcement") FY216 (April 1, 215 June 3, 215) Financial Announcement Agenda: Introduction Tetsuro Higashi, Representative Director, President & CEO FY216 Consolidated Financial Summary Tetsuro Hori, Corporate Director,
FY216 (April 1, 215 June 3, 215) Financial Announcement Agenda: Introduction Tetsuro Higashi, Representative Director, President & CEO FY216 Consolidated Financial Summary Tetsuro Hori, Corporate Director,
Mellanox Achieves Record Quarterly and Annual Revenues; Forecasts Strong 2018
 PRESS RELEASE Mellanox Technologies, Ltd. Press/Media Contact Allyson Scott McGrath/Power Public Relations and Communications +1-408-727-0351 allysonscott@mcgrathpower.com Investor Contact Jeffrey Schreiner
Q3 FY 18 Financial Results
 Q3 FY 18 Financial Results February 6, 2018. Forward-Looking Statements and Non-GAAP Financial Measures This presentation contains forward-looking statements, as that term is defined under the federal
Infineon reports Third Quarter Results for Fiscal Year 2003
 Infineon reports Third Quarter Results for Fiscal Year 2003 Third quarter revenues were Euro 1.47 billion flat sequentially and increasing 11 percent year-on-year - mainly driven by increased sales in
JULY 26, Earnings Summary Second Quarter 2018
 JULY 26, 2018 Earnings Summary Second Quarter 2018 SAFE HARBOR This presentation contains, and management may make, forward-looking statements within the meaning of the Private Securities Litigation Reform
Applied Materials, Inc.
 February 12, 2015 Applied Materials, Inc. Current Recommendation Prior Recommendation NEUTRAL Outperform Date of Last Change 10/22/2013 Current Price (02/11/15) $24.26 Target Price $25.00 SUMMARY (AMAT-NASDAQ)
TSMC Reports 95% Increase in Record Year Profit Quarterly Net Income Reached NT$22 Billion
 Reports 95% Increase in Record Year Profit Quarterly Net Income Reached NT$22 Billion Hsin-Chu, Taiwan, R.O.C., Jan. 27, 2005 -- Taiwan Semiconductor Manufacturing Company, Ltd. today announced revenue
UMC Reports 2008 Fourth Quarter Results:
 Contacts: Bowen Huang / Tien Yu Tseng UMC, Investor Relations +886-2-2700-6999 ext. 6957 bowen_huang@umc.com tien_yu_tseng@umc.com UMC Reports 2008 Fourth Quarter Results: Customer demand stabilized, while
Copyright 2018 CPI Card Group. Fourth Quarter & FY 2017 Earnings Conference Call March 12, 2018
 Fourth Quarter & FY 2017 Earnings Conference Call March 12, 2018 Safe Harbor Forward-Looking Statements Statements in this presentation that are not statements of historical fact are forward-looking statements
Financial Results Fourth Quarter Fiscal 2018
 Financial Results Fourth Quarter Fiscal 2018 2018 Micron Technology, Inc. All rights reserved. Information, products, and/or specifications are subject to change without notice. All information is provided
ASML reports 2.8 billion sales in Q3, expects 3 billion sales in Q4
 ASML reports 2.8 billion sales in Q3, expects 3 billion sales in Q4 ASML sees further growth for 2019 ASML 2018 Third-Quarter Results Veldhoven, the Netherlands Slide 2 Agenda Investor key messages Business
Bruker Corporation (NASDAQ: BRKR)
") Bruker Corporation (NASDAQ: BRKR) Q4 and FY 2015 Earnings Presentation February 10, 2016 Frank Laukien, President & CEO Anthony Mattacchione, SVP & Interim CFO Joshua Young, VP, IR & Corporate Development
Bruker Corporation (NASDAQ: BRKR) Q4 and FY 2015 Earnings Presentation February 10, 2016 Frank Laukien, President & CEO Anthony Mattacchione, SVP & Interim CFO Joshua Young, VP, IR & Corporate Development
FY2015 1Q Information Meeting
 Information Meeting July 28th, 2015 Advantest Corporation 2015/7/28 All Rights Reserved - ADVANTEST CORPORATION 1 NOTE Prepared in accordance with US GAAP Cautionary Statement with Respect to Forward-Looking
NEWS RELEASE. SMIC Reports 2014 First Quarter Results. All currency figures stated in this report are in US Dollars unless stated otherwise.
 Contact: Investor Relations +86-21-3861-0000 ext. 12804 ir@smics.com NEWS RELEASE SMIC Reports 2014 First Quarter Results All currency figures stated in this report are in US Dollars unless stated otherwise.
Q EARNINGS Presentation
 Q1 2018 EARNINGS Presentation Disclosures This presentation contains non-gaap financial measures relating to our performance. You can find the reconciliation of these measures to the most directly comparable
ASML reports 10.9 billion net sales and 2.6 billion net income in 2018 January 23, 2019
 ASML reports 10.9 billion net sales and 2.6 billion net income in 2018 Sales growth expected in 2019 despite challenging environment Proposes to raise dividend by 50% ASML 2018 Fourth-Quarter and Full
KULICKE & SOFFA INDUSTRIES, INC. NASDAQ: KLIC 2017 SEMICON WEST SAN FRANCISCO, CALIFORNIA JULY 11-13, 2017
 2017 SEMICON WEST SAN FRANCISCO, CALIFORNIA JULY 11-13, 2017 SAFE HARBOR STATEMENT In addition to historical statements, this press release contains statements relating to future events and our future