Investor Day 2016 February 18, 2016
|
|
|
- Adelia Patterson
- 6 years ago
- Views:
Transcription


1 Investor Day 2016 February 18, 2016
2 Agenda February 18, :00 3:30 pm Investor Day Presentation 3:30 4:00 pm Additional Discussion and Q&A 4:00 pm onwards Reception 2
3 Presentation agenda Gold market overview Company update New Gold overview Randall Oliphant Randall Oliphant / Robert Gallagher Hannes Portmann 2015 operational results, 2016 outlook and New Afton update David Schummer Mineral reserves and resources update and exploration update Mark Petersen Rainy River development Peter Marshall 2015 financial results Brian Penny Conclusion Randall Oliphant 3
4 Cautionary statements ALL AMOUNTS IN U.S. DOLLARS UNLESS OTHERWISE STATED CAUTIONARY NOTE REGARDING FORWARD-LOOKING STATEMENTS Certain information contained in this presentation, including any information relating to New Gold s future financial or operating performance are forward looking. All statements in this presentation, other than statements of historical fact, which address events, results, outcomes or developments that New Gold expects to occur are forward-looking statements. Forward-looking statements are statements that are not historical facts and are generally, but not always, identified by the use of forward-looking terminology such as plans, expects, is expected, budget, scheduled, targeted, estimates, forecasts, intends, anticipates, projects, potential, believes or variations of such words and phrases or statements that certain actions, events or results may, could, would, should, might or will be taken, occur or be achieved or the negative connotation of such terms. Forward-looking statements in this presentation include, among others, statements with respect to: guidance for production, total cash costs and all-in sustaining costs, and the factors contributing to those expected results, as well as expected capital and other expenditures; grades expected to be mined at the Company s operations; planned activities for 2016 and beyond at the Company s operations and projects, as well as planned exploration activities and expenses; the expected production, costs, economics and operating parameters of the Rainy River project and the New Afton C-zone; targeting timing for development, first production and other activities related to the Rainy River project; plans to advance the New Afton C-zone project; expected production, costs and timing for the Blackwater project; and statements with respect to the payment of the remaining $75 million from Royal Gold. All forward-looking statements in this presentation are based on the opinions and estimates of management as of the date such statements are made and are subject to important risk factors and uncertainties, many of which are beyond New Gold s ability to control or predict. Certain material assumptions regarding such forward-looking statements are discussed in this presentation, New Gold s annual and quarterly management s discussion and analysis ( MD&A ), its Annual Information Form and its Technical Reports filed at In addition to, and subject to, such assumptions discussed in more detail elsewhere, the forward-looking statements in this presentation are also subject to the following assumptions: (1) there being no significant disruptions affecting New Gold s operations; (2) political and legal developments in jurisdictions where New Gold operates, or may in the future operate, being consistent with New Gold s current expectations; (3) the accuracy of New Gold s current mineral reserve and mineral resource estimates; (4) the exchange rate between the Canadian dollar, Australian dollar, Mexican peso and U.S. dollar being approximately consistent with current levels; (5) prices for diesel, natural gas, fuel oil, electricity and other key supplies being approximately consistent with current levels; (6) equipment, labour and materials costs increasing on a basis consistent with New Gold s current expectations; (7) arrangements with First Nations and other Aboriginal groups in respect of the Rainy River and Blackwater projects being consistent with New Gold s current expectations; (8) all required permits, licenses and authorizations being obtained from the relevant governments and other relevant stakeholders within the expected timelines; (9) the results of the feasibility studies for the Rainy River, New Afton C-zone and Blackwater projects being realized; (10) in the case of production, cost and expenditure outlooks at operating mines for 2016 and 2017, commodity prices and exchange rates being consistent with those estimated for the purposes for 2016 guidance; and (11) conditions to the payment of the remaining $75 million from Royal Gold being satisfied mid Forward-looking statements are necessarily based on estimates and assumptions that are inherently subject to known and unknown risks, uncertainties and other factors that may cause actual results, level of activity, performance or achievements to be materially different from those expressed or implied by such forward-looking statements. Such factors include, without limitation: significant capital requirements and the availability and management of capital resources; additional funding requirements; price volatility in the spot and forward markets for metals and other commodities; fluctuations in the international currency markets and in the rates of exchange of the currencies of Canada, the United States, Australia and Mexico; discrepancies between actual and estimated production, between actual and estimated mineral reserves and mineral resources and between actual and estimated metallurgical recoveries; changes in national and local government legislation in Canada, the United States, Australia and Mexico or any other country in which New Gold currently or may in the future carry on business; taxation; controls, regulations and political or economic developments in the countries in which New Gold does or may carry on business; the speculative nature of mineral exploration and development, including the risks of obtaining and maintaining the validity and enforceability of the necessary licenses and permits and complying with the permitting requirements of each jurisdiction in which New Gold operates, including, but not limited to: in Canada, obtaining the necessary permits for the Rainy River, New Afton C-zone and Blackwater projects; and in Mexico, where Cerro San Pedro has a history of ongoing legal challenges related to our environmental authorization; the lack of certainty with respect to foreign legal systems, which may not be immune from the influence of political pressure, corruption or other factors that are inconsistent with the rule of law; the uncertainties inherent to current and future legal challenges New Gold is or may become a party to; diminishing quantities or grades of mineral reserves and mineral resources; competition; loss of key employees; rising costs of labour, supplies, fuel and equipment; actual results of current exploration or reclamation activities; uncertainties inherent to mining economic studies including the feasibility studies for Rainy River, New Afton C-zone and Blackwater; the uncertainty with respect to prevailing market conditions necessary for a positive development decision at Blackwater; changes in project parameters as plans continue to be refined; accidents; labour disputes; defective title to mineral claims or property or contests over claims to mineral properties; unexpected delays and costs inherent to consulting and accommodating rights of First Nations and other Aboriginal groups; risks, uncertainties and unanticipated delays associated with obtaining and maintaining necessary licenses, permits and authorizations and complying with permitting requirements, including those associated with the environmental assessment process for Blackwater. In addition, there are risks and hazards associated with the business of mineral exploration, development and mining, including environmental events and hazards, industrial accidents, unusual or unexpected formations, pressures, cave-ins, flooding and gold bullion losses (and the risk of inadequate insurance or inability to obtain insurance to cover these risks) as well as Risk Factors included in New Gold s disclosure documents filed on and available at Forward-looking statements are not guarantees of future performance, and actual results and future events could materially differ from those anticipated in such statements. All of the forward-looking statements contained in this presentation are qualified by these cautionary statements. New Gold expressly disclaims any intention or obligation to update or revise any forward-looking statements whether as a result of new information, events or otherwise, except in accordance with applicable securities laws. 4 The footnotes, endnotes and appendices to this presentation contain important information. The endnotes and appendices are found at the end of the presentation.

5 GOLD MARKET OVERVIEW Randall Oliphant, Executive Chairman 5
6 Gold market overview Factors influencing the gold price Gold market fundamentals Impact of India and China 6

7 Global demand Gold market diversity and growth Europe 18% Asia 23% North America 6% China 24% India 24% South America 1% Others 4% 1. Source: GFMS, Thomson Reuters. Based on 2014 tonnage, demand includes jewellery, bar and coin, and technology. Excludes ETFs and OTC investment. Does not include revisions subsequent to the Gold Survey
8 Gold demand Volume and Value (1) Changing Composition (2) Tonnes 5,000 US$bn 300 Tonnes 5,000 4, , ,000 3, t 14% 150 2, t 21% 2, t 8% 100 1,000 2,415t 57% 1, Gold demand* Gold demand value (rhs) 0 (1,000) Jewellery Technology Investment Central bank net purchases 1. Gold demand comprises jewellery, investment (excl. OTC and stock flows), technology and official sector purchases. Source: Metals Focus; GFMS, Thomson Reuters; ICE Benchmark Administration; World Gold Council. 2. Source: Metals Focus; GFMS, Thomson Reuters; World Gold Council. 8
9 China s gold consumer demand China s Gold Consumer Demand Since 2005 (1) Tonnes 1,500 1,250 1, Jewellery Demand Investment (Bar & Coin) Demand Consumer Demand (rolling 5y average) 1. Source: Metals Focus; GFMS, Thomson Reuters; ICE Benchmark Administration; World Gold Council. 9
10 Gold supply Changing Composition (1) Lack of Major New Discoveries (1) Tonnes 5,000 Tonnes 5,000 US$M 7,000 4,000 3,000 2,000 1, ,000 3,000 2,000 1,000 6,000 5,000 4,000 3,000 2,000 1,000 (1,000) Mine production Net producer hedging Recycled gold year running average AU gold in in discoveries* Discovery-oriented gold budget** (rhs) 1. Source: Metals Focus; GFMS, Thomson Reuters; World Gold Council. 10
11 India and China India China 15% of world gold stock 24% of annual global demand Strong traditional affinity to gold In 2013, became the world s number one market for gold Country has experienced 10 years of rapid growth and middle class affluence Gold market growth increasing Largest import after oil Traditional affinity to gold 100,000 12,000 Gold Price (RUP/oz) 80,000 60,000 40,000 20,000 Gold Price (CNY/oz) 10,000 8,000 6,000 4,000 2, Domestic gold prices remain strong 11
12 Gold bull and bear cycles Gold has experienced five bear and bull cycles since the 1970s The most recent bear cycle is not far off the mean Bull Market Bear Market Dates Length (months) Cumulative Return Dates Length (months) Cumulative Return Jan 1970 Jan % Jan 1975 Sep (46.4%) Oct 1976 Feb % Feb 1980 Mar (55.9%) Mar 1985 Dec % Dec 1987 Mar (34.7%) Apr 1993 Feb % Feb 1996 Sep (39.1%) Oct 1999 Sep % Sep 2011 Dec (44.1%) Average % Average 47 (44.0%) Median % Median 52 (42.7%) Gold price is up 17% since beginning of 2016 (3) 1. Defining a bull market as a period where the US dollar gold price rose for at least two consecutive years and bear markets as the subsequent periods where price generally fell for a sustained time. 2. Source: Bloomberg, ICE Benchmark Administration Ltd, World Gold Council. 3. As at February 12,
13 Gold market outlook Central banks remain net purchasers Investment demand from most populous countries remains strong Jewellery demand from most populous countries remains strong Mine production on course to plateau / decline 13

14 COMPANY UPDATE Randall Oliphant, Executive Chairman Robert Gallagher, President and CEO 14
15 Experienced and invested team Executive Management Team Randall Oliphant Executive Chairman Robert Gallagher President & Chief Executive Officer David Schummer Executive Vice President & Chief Operating Officer Brian Penny Executive Vice President & Chief Financial Officer Hannes Portmann Executive Vice President, Business Development Board of Directors David Emerson Former Canadian Cabinet Minister James Estey Chairman, PrairieSky Royalty Robert Gallagher President & Chief Executive Officer Vahan Kololian Founder, TerraNova Partners Martyn Konig Chief Investment Officer, T Wealth Management Pierre Lassonde Chairman, Franco-Nevada Randall Oliphant Executive Chairman Kay Priestly Former Chief Executive Officer, Turquoise Hill Resources Raymond Threlkeld Chairman, Newmarket Gold $60 million collectively invested in New Gold 15
16 Executive leadership team Randall Oliphant Executive Chairman David Schummer Executive Vice President & Chief Operating Officer Brian Penny Executive Vice President & Chief Financial Officer Hannes Portmann Executive Vice President, Business Development Operations/Projects Business Improvement Health and Safety Information Technology Finance Treasury Legal Concentrate Marketing Corporate Development Investor Relations Exploration Human Resources New Gold s President and CEO, Robert Gallagher, to retire in June 2016 after eight successful years in the role and over 35 great years in the mining industry 16

 Share price outperformed S&P/TSX Global Gold Index by >150% since beginning of 2009 1.")

17 New Gold investment thesis Portfolio of assets in top-rated jurisdictions Invested and experienced team Among lowest-cost producers with established track record Peer-leading growth pipeline A history of value creation 15.0 Moz gold reserves(1), >85% located in Canada $60 million investment by Board & Management 2015 gold production exceeded guidance, 2015 all-in sustaining costs(2) of $809/oz ~800 Koz annual production potential from growth projects(3) Share price outperformed S&P/TSX Global Gold Index by >150% since beginning of For a detailed breakdown of Mineral Resources and Reserves by category, refer to New Gold s news release dated February 17, 2016 titled New Gold Announces 2015 financial results with record gold production leading to strong cash flow. Refer to Endnotes under the heading Cautionary note to U.S. readers concerning estimates of Mineral Reserves and Mineral Resources and Technical Information. 2. Refer to Endnote on all-in sustaining costs under the heading Non-GAAP Measures. 3. Based on 325Koz annual production from Rainy River and ~485Koz annual production from Blackwater, as outlined in the feasibility studies for the projects. 17
18 Reinvesting free cash flow generation Rainy River +75% of expected 2016 company production at lower all-in sustaining costs (2) 2015 All-in Sustaining Cost Margin (1) $ 340 /oz New Afton C-zone Opportunity to extend mine life of New Gold s most significant cash flow generator Blackwater +120% of expected 2016 company production at lower all-in sustaining costs (2) Investing in longer-lived, larger-scale, lower-cost assets 1. Refer to Endnote on margin under the heading Non-GAAP Measures. Margin per ounce is equal to realized gold price per ounce during the period less costs (being cash costs or all-in sustaining costs, as the case may be) per ounce. 2. Refer to Endnote on all-in sustaining costs under the heading Non-GAAP Measures. 18
19 Rainy River project economics Project Economics (1) Gold Price ($/oz) $1,200 Silver Price ($/oz) $15.00 CDN/USD ($) $1.40 After-tax 5% NPV ($mm) $759 $100 per ounce change in gold price equals ~$175 million change in after-tax NAV and 3.4% change in IRR $0.05 change in exchange rate equals ~$50 million change in after-tax NAV and 1.3% change in IRR IRR (%) 14.8 Payback (years) 5.3 Grade, Production and Cost Profiles Capital and operating costs benefit from a depreciation of Canadian dollar ~80% of costs denominated in Canadian dollars In addition, operating costs expected to benefit from: proximity to infrastructure, lower power costs, ~1.5 g/t average head grade (2) and silver by-product GOLD PRODUCTION (Koz) 325 TOTAL CASH COSTS (3) ALL-IN SUSTAINING COSTS (4) $ 570 /oz $ 670 /oz 1. Net present value discounted to December 31, 2015 and excludes historical project development costs. IRR and payback period inclusive of all project development costs. Stream proceeds included as a net reduction to capital costs. Assumes second instalment of stream proceeds paid in mid First five years. 3. Refer to Endnote on total cash costs under the heading Non-GAAP Measures. First nine years. 4. Refer to Endnote on all-in sustaining costs under the heading Non-GAAP Measures. First nine years. 19
20 New Afton C-zone Feasibility study economics C-zone: Project Economics C-zone: Key Sensitivities Gold price ($/oz) $1,200 Copper price ($/lb) $2.75 $0.25 per pound change in copper price ~$34 million in after-tax NPV and 1.9% change in IRR CDN/USD ($) $ Scoping Study 2016 Feasibility Study After-tax 5% NPV ($mm) $0.05 change in exchange rate ~$24 million in after-tax NPV and 1.5% change in IRR After-tax IRR (%) After-tax Payback (years) $100 per ounce change in gold price ~$18 million in after-tax NPV and 1.0% change in IRR Based on the feasibility study, during the years of full production, average annual pre-tax cash flow of ~$200 million 20
 Significant Gold and Silver Resource (4) 2016 Plan 8.")
21 Blackwater project summary Jurisdiction and Regional Upside 2013 Feasibility Study # 1 Country Ranking (1) British Columbia, Canada ~1,100 km 2 Land Package ~$ 1,576 million Development Capital (2) 17-year Mine Life First nine years: 485 Koz Annual Gold Production 1.8 Moz Annual Silver Production $590/oz All-in Sustaining Costs (3) Significant Gold and Silver Resource (4) 2016 Plan 8.2 Moz Gold Reserves 1.3 Moz Gold M&I Resources 60.8 Moz Silver Reserves 7.8 Moz Silver M&I Resources Complete Federal Environmental Assessment process by late 2016/ early Source: 2015 Behre Dolbear Report 2015 Ranking of Countries for Mining Investment. 2. Development capital assumes $1.25 CDN/USD exchange rate. 3. Refer to Endnote on all-in sustaining costs under the heading Non-GAAP Measures. 4. Mineral resources are exclusive of reserves. For a detailed breakdown of Mineral Resources and Reserves by category, refer to New Gold s news release dated February 17, 2016 titled New Gold Announces 2015 financial results with record gold production leading to strong cash flow. Refer to Endnotes under the heading Cautionary note to U.S. readers concerning estimates of mineral reserves and mineral resources and Technical Information. 21

22 NEW GOLD OVERVIEW Hannes Portmann, EVP Business Development 22
 $ 809 per oz All-in sustaining costs (2) EXCEEDED PRODUCTION GUIDANCE AND BEAT COST OUTLOOK Corporate Developments New Afton Rainy")
23 2015 operational highlights 2015 Gold Production 2015 Copper/Silver Production 2015 Costs 436 thousand oz 100 Record full-year production Copper 1.9 Silver million lbs million oz $ 443 per oz Total cash costs (1) $ 809 per oz All-in sustaining costs (2) EXCEEDED PRODUCTION GUIDANCE AND BEAT COST OUTLOOK Corporate Developments New Afton Rainy River Further strengthened financial flexibility through two transactions: Rainy River stream Sale of El Morro Mill expansion completed ahead of schedule and under budget Completed C-zone feasibility study On schedule for mid-2017 $877 million total development capital Overall construction 25% complete 1. Refer to Endnote on total cash costs under the heading Non-GAAP Measures. 2. Refer to Endnote on all-in sustaining costs under the heading Non-GAAP Measures. 23
24 2015 corporate developments July 2015 Sale of $175 million Rainy River stream to Royal Gold November 2015 Sale of 30% interest in El Morro to Goldcorp The two transactions collectively increased our liquidity position by ~$235 million and eliminated $94 million of debt (1) ~$330 million improvement in financial position without equity issuance 1. Assumes receipt of second instalment of $75 million from Royal Gold. Second instalment of $75 million is to be paid when 60% of development capital spent and other customary conditions are satisfied. 24
25 Stream comparison El Morro Stream Retained Rainy River Stream Sold (gold portion) (1) Initial gold stream percentage 4% 6.5% Average annual stream ounces (Koz) >16 ~16 Total gold reserves (2) (Moz) Reserves subject to stream (Koz) Transfer price pre-threshold ($ per ounce) $400 25% of spot gold price Ounce threshold (Koz) Gold stream percentage post-threshold 4% 3.25% M&I gold resources subject to stream (exclusive) (Koz) Inferred resources subject to stream (Koz) Transfer price post-threshold ($ per ounce) $ % inflation factor 25% of spot gold price 1. Does note include portion of stream attributable to silver. New Gold to deliver 60% of the project's silver production up to a total of 3.1 million ounces of silver, and 30% of the project's silver production thereafter. Royal Gold to pay 25% of the average silver spot price. 2. M&I resources are exclusive of Reserves. For a detailed breakdown of Mineral Resources and Reserves by category, refer to New Gold s news release dated February 17, 2016 titled New Gold Announces 2015 financial results with record gold production leading to strong cash flow. Refer to Endnotes under the heading Cautionary note to U.S. readers concerning estimates of Mineral Reserves and Mineral Resources and Technical Information. 25
26 Portfolio of assets in top-rated jurisdictions All Assets Ranked in Top 5 Global Mining Jurisdictions (1) Mineral Reserves (2) # 1 CANADA Blackwater New Afton Rainy River Mine Life: 17 years Mine Life: 7 years + C-zone potential Mine Life: 14 years # 3 UNITED STATES Mesquite Mine Life: 7 years + residual leach # 5 MEXICO Cerro San Pedro Mine Life: Final year + residual leach # 2 AUSTRALIA Peak Mines Mine Life: 6+ years OPERATING DEVELOPMENT 1. Source: 2015 Behre Dolbear Report 2015 Ranking of Countries for Mining Investment. 26
27 Low costs drive robust margins Record fourth quarter operating performance 2015 Fourth Quarter and Full Year Total cash costs (1) ($/oz) All-in sustaining costs (2) ($/oz) Continue to generate strong margins in current commodity price environment $389 $443 $613 $809 Free cash flow from four operations being reinvested into the business Total cash cost margin (3) ($/oz) All-in sustaining cost margin (3) ($/oz) Margin % 64% 61% 44% 30% $705 $706 $481 $ Refer to Endnote on total cash costs under the heading Non-GAAP Measures. 2. Refer to Endnote on all-in sustaining costs under the heading Non-GAAP Measures. 3. Refer to Endnote on margin under the heading Non-GAAP Measures. Margin per ounce is equal to realized gold price per ounce during the period less costs (being cash costs or all-in sustaining costs, as the case may be) per ounce. 27
28 2016 guidance Sustaining exploration expense ~$ 30 General and administrative and other (4) Sustaining capital (3) ~$ 80 ~$ 280 All-in Sustaining Costs (1) $ 825- $ 865 /oz Total cash costs (2) $ 435- $ 475 Gold Production (Koz) 1. Refer to Endnote on all-in sustaining costs under the heading Non-GAAP Measures. 2. Refer to Endnote on total cash costs under the heading Non-GAAP Measures. 3. Sustaining capital based on New Gold s 2016 estimated capital expenditures including capitalized exploration and excluding expenditures related to growth-related initiatives. 4. General and administrative and other includes stock-based compensation and asset retirement obligation. 28

29 2015 OPERATIONAL RESULTS David Schummer, EVP and COO 29

 Independent Tailings Review board implemented to provide additional assurance to current practices Recognized as one of the top five socially responsible mining companies in Canada by")
30 Health, safety and corporate social responsibility 2015 Highlights Lowest lost time incident frequency rate and total reportable incident frequency rate in company s history Fourth consecutive year without a health and safety fine Health and Safety Performance Indicators Change All Injury Frequency Rate (9%) All approvals and permits to start Rainy River construction obtained Total Reportable Incident Frequency Rate (27%) Independent Tailings Review board implemented to provide additional assurance to current practices Recognized as one of the top five socially responsible mining companies in Canada by Sustainalytics Lost Time Incident Frequency Rate (91%) Severity (78%) LOWEST IN COMPANY S HISTORY Over the past five years, achieved significant recognition through the following awards: CanCham Outstanding Business Award, WorkSafe BC Certificate of Recognition, Best Safety Culture in Canada, James T. Ryan (awarded twice), Cerro De Plata Mexico, and PDAC Safe Day Every Day Award (awarded three times) 30
31 2015 consolidated operational results GOLD PRODUCTION (Koz) 436 SILVER PRODUCTION (Moz) 1.9 COPPER PRODUCTION (Mlbs) 100 Exceeded guidance Achieved guidance Achieved guidance TOTAL CASH COSTS (1) ($/oz) $443 ALL-IN SUSTAINING COSTS (2) ($/oz) $ Refer to Endnote on total cash costs under the heading Non-GAAP Measures. 2. Refer to Endnote on all-in sustaining costs under the heading Non-GAAP Measures. 31
32 2015 operational scorecard Achieved or exceeded gold production guidance at each mine New Afton Mesquite Peak Mines Cerro San Pedro 2015 production guidance (Koz) actual production (Koz) E key metric ranges Tonnes processed (000 tonnes) 5,100 5,300 13,500 13, ,500 13,900 Gold grade (g/t) Silver grade (g/t) Copper grade (%) 0.91% % % 1.00% -- Gold recovery (%) 82% 84% ~62% 90% 92% ~40% Silver recovery (%) ~22% Copper recovery (%) 83% 85% -- 89% 91% -- Copper grade of 0.90% slightly below lower range Positive model reconciliation on ore tonnes partially offset by slightly lower grade Lower ore tonnes due to seismic activity in Q1 2015, copper recovery slightly below lower range Timing difference on leach pad recovery schedule 32
33 2015 mine-by-mine operating results 2015 Fourth Quarter New Gold record for quarterly gold production and all-in sustaining costs Gold production (Koz) Total cash costs (1) ($/oz) All-in sustaining costs (2) ($/oz) GOLD PRODUCTION (Koz) 132 $631 $552 $868 $869 $706 $883 TOTAL CASH COSTS (1) ($/oz) $389 ALL-IN SUSTAINING COSTS (2) ($/oz) $ ($614) ($340) 2015 Full Year New Gold record for annual gold production Gold production (Koz) Total cash costs (1) ($/oz) All-in sustaining costs (2) ($/oz) GOLD PRODUCTION (Koz) $743 $791 $865 $1,156 $1,071 $879 TOTAL CASH COSTS (1) ($/oz) $443 ALL-IN SUSTAINING COSTS (2) ($/oz) $809 ($724) ($242) (3) (4) 1. Refer to Endnote on total cash costs under the heading Non-GAAP Measures. 2. Refer to Endnote on all-in sustaining costs under the heading Non-GAAP Measures. 3. Refer to Endnote on total cash costs under the heading Non-GAAP Measures. New Afton co-product cash costs: Fourth quarter: Gold - $433/oz, Copper - $0.86/lb. Full-year: Gold - $464/oz, Copper - $0.96/lb. 4. Refer to Endnote on all-in sustaining costs under the heading Non-GAAP Measures. New Afton co-product all-in sustaining costs: Fourth quarter: Gold - $539/oz, Copper - $1.07/lb. Full-year: Gold - $642/oz, Copper - $1.34/lb. 33

34 2016 OUTLOOK David Schummer, EVP and COO 34
35 2016 consolidated operational outlook GOLD PRODUCTION (Koz) Cerro San Pedro transition to residual leaching SILVER PRODUCTION (Moz) In line with 2015 COPPER PRODUCTION (Mlbs) Lower copper grade at New Afton Peak Mines focusing on more gold-rich ore bodies TOTAL CASH COSTS (1) ($/oz) $435-$475 In line with 2015 despite lower by-product revenues ALL-IN SUSTAINING COSTS (2) ($/oz) $825-$865 Lower gross sustaining costs allocated across a lower gold production base KEY INPUT ASSUMPTIONS Copper $2.00/lb Silver $14.00/oz CDN/USD $1.40 AUD/USD $1.40 MXN/USD $ Refer to Endnote on total cash costs under the heading Non-GAAP Measures. 2. Refer to Endnote on all-in sustaining costs under the heading Non-GAAP Measures. 35
36 Mesquite 2016 guidance Gold Production (Koz) Overview 2016 production expected to remain in line with 2015 Decrease in costs attributable to continued operational efficiencies and lower diesel prices Total Cash Costs (1) ($/oz) All-in Sustaining Costs (2) ($/oz) 2017 Outlook Production expected to increase to over 150,000 ounces as gold grade should continue to increase Higher production is scheduled to be coupled with lower costs $590-$630 $1,015-$1, Refer to Endnote on total cash costs under the heading Non-GAAP Measures. 2. Refer to Endnote on all-in sustaining costs under the heading Non-GAAP Measures. 36
37 Peak Mines 2016 guidance Gold Production (Koz) Copper Production (Mlbs) Overview Gold production expected to remain in line with 2015 Copper production expected to decrease as 2016 mine plan intentionally focuses on mining more gold-rich ore bodies Key Sensitivities Total Cash Costs (1) ($/oz) All-in Sustaining Costs (2) ($/oz) $800-$840 $1,020-$1,060 $0.25 per pound change in copper price equals ~$20 per ounce change in Peak Mines all-in sustaining costs (2) $0.05 change in Australian dollar exchange rate equals ~$35 per ounce change in Peak Mines all-in sustaining costs (2) 2017 Outlook Gold-copper production mix will be optimized to maximize cash flow and profitability for Refer to Endnote on total cash costs under the heading Non-GAAP Measures. 2. Refer to Endnote on all-in sustaining costs under the heading Non-GAAP Measures. 37
38 Cerro San Pedro 2016 guidance Gold Production (Koz) Silver Production (Moz) Overview Decrease in production as mine transitions to residual leaching Costs to decrease relative to 2015 Key Sensitivities Total Cash Costs (1) ($/oz) All-in Sustaining Costs (2) ($/oz) $755-$795 $765-$805 $1.00 per ounce change in silver price equals ~$20 per ounce change in Cerro San Pedro all-in sustaining costs (2) $1.00 change in Mexican peso exchange rate equals ~$30 per ounce change in Cerro San Pedro all-in sustaining costs (2) 2017 Outlook Gold production from residual leaching expected to be approximately 25 thousand ounces Silver production expected to be approximately one million ounces 1. Refer to Endnote on total cash costs under the heading Non-GAAP Measures. 2. Refer to Endnote on all-in sustaining costs under the heading Non-GAAP Measures. 38
39 New Afton 2016 guidance Gold Production (Koz) Copper Production (Mlbs) Overview Gold and copper production decreases due to lower gold and copper grades Higher costs due to lower by-product revenues Key Sensitivities Total Cash Costs (1) ($/oz) All-in Sustaining Costs (2) ($/oz) ($335)-($295) $95-$135 $0.25 per pound change in copper price equals ~$210 per ounce change in New Afton all-in sustaining costs (2) $0.05 change in Canadian dollar exchange rate equals ~$55 per ounce change in New Afton all-in sustaining costs (2) 2017 Outlook Gold production of ~85,000 ounces and copper production of ~80 million pounds 1. Refer to Endnote on total cash costs under the heading Non-GAAP Measures. Co-product cash costs guidance: Gold - $505-$545 per ounce, Copper - $0.90-$1.05 per pound. 2. Refer to Endnote on all-in sustaining costs under the heading Non-GAAP Measures. Co-product all-in sustaining costs guidance: Gold - $660-$700 per ounce, Copper - $1.20-$1.35 per pound. 39
40 2016 capital expenditures by category Total Capital Expenditures ~$ 615 million Sustaining Capital: ~$105 million Growth Capital: ~$510 million New Afton $5 million Peak Mines $12 million Blackwater $5 million New Afton $38 million Mesquite $55 million Rainy River $500 million 40
41 2016 capital expenditures by category (cont d) Rainy River Mesquite New Afton Peak Mines Blackwater $500 million $55 million $43 million $12 million $5 million $405 million mining, infrastructure and process facilities $95 million owners costs, indirects and other See slide 66 for detailed breakdown $35 million capitalized stripping $12 million plant and equipment $8 million complete leach pad expansion $38 million mine development, plant and equipment $5 million C-zone studies, C-zone capitalized exploration $12 million plant and equipment and capitalized exploration $5 million permitting, environmental studies and site support Sustaining capital 41

42 NEW AFTON UPDATE David Schummer, EVP and COO 42
 3% increase in gold recovery (1) 4% increase in copper recovery (1) Current throughput of over 15,500 tonnes per day")
43 New Afton mill expansion Mill Expansion Completed Completed in second quarter 2015 Capital cost of expansion was $35 million, approximately $10 million less than budget Strong fourth quarter production figures attributable to: 12% increase in mill throughput (1) 3% increase in gold recovery (1) 4% increase in copper recovery (1) Current throughput of over 15,500 tonnes per day Successfully commissioned, ahead of schedule and under budget 1. Relative to fourth quarter of
44 New Afton C-zone update Main Zone Extraction Level Measured Indicated Inferred Open to West Open at depth C-zone 1,180m C-zone Block Cave Volume 44
45 New Afton C-zone reserves and resources Added 583 thousand ounces of gold and 430 million pounds of copper C-zone originally identified through limited deep holes drilled from surface prior to 2007 Since July 2012 have completed 138 holes totaling 85,585 metres and continually updated resource Additional drilling planned in 2016 to further expand C-zone 2015 Year-End C-zone Reserves and Resources (1) Tonnes (000s) Gold (g/t) Copper (%) Gold (Koz) Copper (Mlbs) Proven Probable 25, Total P&P 25, Measured 2, Indicated 15, Total M&I 17, Inferred 6, Resource remains open at depth and to the west 1. M&I resources exclusive of reserves. For a detailed breakdown of Mineral Resources and Reserves by category, refer to New Gold s news release dated February 17, 2016 titled New Gold Announces 2015 financial results with record gold production leading to strong cash flow. Refer to Endnotes under the heading Cautionary note to U.S. readers concerning estimates of mineral reserves and mineral resources and Technical Information. 45
46 New Afton C-zone Scoping study versus feasibility study The below table compares the 2015 scoping study to the current feasibility study results C-zone: Scoping Study versus Feasibility Study (1) 2015 Scoping Study 2016 Feasibility Study Total tonnes mined/processed (Mt) % increase in ore tonnes Average gold grade (g/t) Average copper grade (%) Contained metal Gold (Koz) Contained metal Copper (Mlbs) % increase in contained gold 14% increase in contained copper Mine life (years) Average full-year gold production (Koz) Average full-year copper production (Mlbs) Development capital ($mm) Sustaining capital ($mm) Average operating cost ($/t) Increase primarily driven by the inclusion of a $41 million provision for capital escalation given six year development timeline 1. CDN/USD exchange rate of $
47 New Afton C-zone indicative timeline Based on market conditions and the receipt of permits, development of the C-zone could begin after the start-up of Rainy River Targeted milestones Rainy River start-up + 1 year + 2 years + 3 years + 4 years + 5 years + 6 years COMPLETE MAIN ACCESS RAMP DEVELOP BLOCK CAVE PRODUCTION LEVELS FIRST PRODUCTION Over 70% of $402 million development capital expected to be spent in the final 3.5 years Significant capital spending to begin well after Rainy River start-up 47

48 MINERAL RESERVES AND RESOURCES UPDATE Mark Petersen, VP Exploration 48
49 Reserves summary 2015 year-end gold reserves in line with prior year (pro forma El Morro sale) Key changes in gold reserves mainly attributable to increases in New Afton due to conversion of C-zone resources, offset by 2015 mine depletion and sale of El Morro Gold Reserves (1) (Moz) >85 % El Morro 2015 year-end mineral reserve assumptions: $1,200 per ounce gold Copper Reserves (1) (Blbs) Silver Reserves (1) (Moz) $15 per ounce silver (previously $18 per ounce) $2.75 per pound copper (previously $3.00 per pound) CDN/USD $ El Morro 1. For a detailed breakdown of Mineral Resources and Reserves by category, refer to New Gold s news release dated February 17, 2016 titled New Gold Announces 2015 financial results with record gold production leading to strong cash flow. Refer to Endnotes under the heading Cautionary note to U.S. readers concerning estimates of mineral reserves and mineral resources and Technical Information. 49
50 Reserves summary (cont d) (1) Bridging 2014 to 2015 Gold Reserves (Moz) 17.7 (2.7) Increased cash Sale of El Morro $ 62 million Decreased debt $ 94 million Retained 4% gold stream 0.1 (0.7) For a detailed breakdown of Mineral Resources and Reserves by category, refer to New Gold s news release dated February 17, 2016 titled New Gold Announces 2015 financial results with record gold production leading to strong cash flow. Refer to Endnotes under the heading Cautionary note to U.S. readers concerning estimates of mineral reserves and mineral resources and Technical Information. 50
51 Gold geographic breakdown Gold Reserves (1) (Moz) Gold M&I Resources (1) (Moz) (exclusive of Reserves) Australia (2%) USA (10%) Australia (7%) USA (12%) Canada (81%) Canada (88%) Growing resource base in Canada 1. At December 31, M&I resources exclusive of reserves. For a detailed breakdown of Mineral Resources and Reserves by category, refer to New Gold s news release dated February 17, 2016 titled New Gold Announces 2015 financial results with record gold production leading to strong cash flow. Refer to Endnotes under the heading Cautionary note to U.S. readers concerning estimates of mineral reserves and mineral resources and Technical Information. 51
52 Copper geographic breakdown Copper Reserves (1) (Blbs) Copper M&I Resources (1) (Blbs) (exclusive of Reserves) Australia (7%) Australia (9%) Canada (93%) Canada (91%) 1. At December 31, M&I resources exclusive of reserves. For a detailed breakdown of Mineral Resources and Reserves by category, refer to New Gold s news release dated February 17, 2016 titled New Gold Announces 2015 financial results with record gold production leading to strong cash flow. Refer to Endnotes under the heading Cautionary note to U.S. readers concerning estimates of mineral reserves and mineral resources and Technical Information. 52

53 EXPLORATION UPDATE Mark Petersen, VP Exploration 53


54 2015 exploration achievements 2015 Achievements Peak Mines Chronos discovery system of high grade gold-copper and lead-zinc-silver lenses extending above top of Perseverance ore body at south end of mine corridor Anjea discovery system of stacked copper-gold and lead-zinc-silver lenses located immediately south of historic Great Cobar mine at north end of mine corridor Significant copper and gold and lead-zinc-silver mineralization intercepted in reconnaissance drilling at three early-stage targets along mine corridor Rainy River Integration of mineral resources on Burns Block (Bayfield) into underground reserves extending from Intrepid and ODM-17 zone Blackwater Confirmed Blackwater mineralization signature extending several kilometres west and south of main deposit, more widespread than previously thought 54
55 2016 exploration program overview Sustaining exploration Growth exploration New Afton Expensed - $4 million New Afton $ 12 million Capitalized - $2 million $ 4 million Peak Mines Capitalized - $2 million Expensed - $6 million Rainy River Expensed - $2 million 55
56 2016 exploration program overview (cont d) 2016 Program New Afton Test potential to extend C-zone block cave resource to west Underground and surface reconnaissance drilling to test newly identified satellite targets Main Zone Extraction Level 10,000 metre drill program C-zone C-zone Block Cave Volume Open to West 1,180m Measured Indicated Open at depth Inferred 56

57 2016 exploration program overview (cont d) 2016 Program Rainy River Continue to advance district reconnaissance and target identification Peak Mines Chronos underground diamond drilling to expand inferred status and upgrade central gold lens to M&I status Anjea surface diamond drilling to delineate resource to inferred status Mine Corridor surface and underground drilling to test newly identified mine corridor targets at Burrabungie, Dapville, Gladstone, Mt. Pleasant, Young Australian 2016: 10,000 metres of drilling Positive results from initial reconnaissance drilling 2016: 10,000 metres of drilling 57
58 RAINY RIVER DEVELOPMENT Peter Marshall, VP Project Development 58


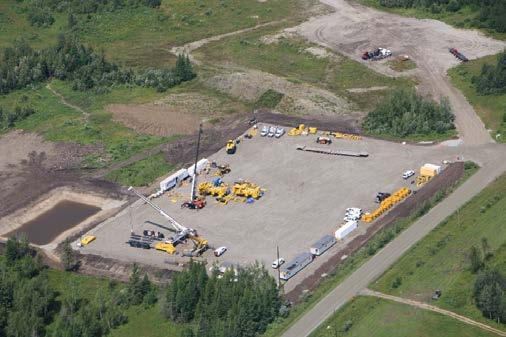
59 Rainy River plant site construction photos April 2015 August


60 Rainy River plant site construction photos (cont d) October 2015 November


61 Rainy River plant site construction photos (cont d) December 2015 February
62 Rainy River project summary Jurisdiction Resource Scale (2) Ontario, Canada # 1 Underground 0.7Moz at 5.0g/t Gold Reserves 3.8 Moz Open Pit 3.1Moz at 1.0g/t 17km tie-in to power and close to regional infrastructure Land package over 190 square kilometres Supportive local government and community Underground 0.6Moz at 3.7g/t Open Pit 2.0Moz at 0.8g/t Gold M&I Resources 2.6 Moz 1. Source: Based on 2015 Behre Dolbear Report 2015 Ranking of Countries for Mining Investment. 2. For a detailed breakdown of Mineral Resources and Reserves by category, refer to New Gold s news release dated February 17, 2016 titled New Gold Announces 2015 financial results with record gold production leading to strong cash flow. Refer to Endnotes under the heading Cautionary note to U.S. readers concerning estimates of mineral reserves and mineral resources and Technical Information. Mineral resources are exclusive of reserves. 62

63 Rainy River project update Significant milestones have been achieved to date: Engineering complete Overall construction currently 25% complete $312 million spent through December 31, 2015 Impacts and Benefits agreements completed with key First Nations and Métis Secured low power rates through Industrial Electricity Incentive Program to end of 2024 Indicative power cost of C$2.4 cents/kwh (based on 2015 actual power rates) Commissioning on track for mid-2017 Development capital estimate of $877 million (1) projected cost increases related to earthworks, tailings dam construction and installation of mechanical equipment, piping and electrical in processing plant, offset by depreciation of Canadian dollar $500 million capital program for Assumes $1.40 CDN/USD foreign exchange rate. 63


64 Rainy River capital update As project construction has advanced, capital costs for mining specific inputs have generally come in at, or below, budget Initial mine fleet on budget Process equipment on budget Steel supply and installation under budget Supply and installation of leach tanks under budget Where input cost pressures have arisen it has primarily been on items linked to the continued activity in the broader Ontario construction market including Concrete supply and installation Installation of Mechanical, Piping, Electrical and Instrumentation In addition, plant site earthworks, water management and construction of the tailings facility have required more materials/man hours than budgeted Haul truck Mill shells 64
65 Rainy River capital committed to date Project Development Capital Costs (1) Description Estimate Total Spent / Committed Direct Costs ($mm) ($mm) Mining $161 $76 On-Site Infrastructure ~59% of total capital spent/committed as at December 31, 2015 Spent to Dec 31, 2015 $312 million Process Plant Tailings Facility Access Corridor Off-Site Facilities Total Direct Capital Costs Fixed Price and Quantities $95 million Fixed Unit Prices, Variable Quantities $111 million $ 518 million Total Owners & Indirect Costs (2) Total Project Development Capital Costs $0.05 change in exchange rate equals ~$15 million change in development capital 1. Current plan based on $1.40 C$/US$ foreign exchange rate. Contingency has been distributed across the cost items. 2. Net of pre-commercial production revenues and investment tax credit receivables 65
66 Rainy River 2016 capital expenditures and program 2016 Capital Expenditure Details 2016 Program Description ($mm) Advance overall construction to 75% Mining $47 On-Site Infrastructure 59 Process Plant 204 Tailings Facilities 71 Access Corridor 10 Off-Site Facilities 14 Indirect Costs 63 Owners Costs 32 Total $500 Ramp-up of pre-production mining activities Continued commissioning of mobile fleet Process plant construction Complete concrete and structural steel work by mid-year Advance mechanical, piping, electrical and instrumentation installation to 50% completion Water management pond complete; commence storage of water for start-up Transmission line complete and energized Advance tailings dam construction to 60% 66
67 Rainy River timeline Targeted milestones Q1 Q2 Q3 Q4 Q1 Q2 POWER LINE CONSTRUCTION PROCESS PLANT CONSTRUCTION TAILINGS & WATER MANAGEMENT FACILITIES CONSTRUCTION PRE-STRIP & PIT DEVELOPMENT Z COMMISSIONING Start-up and commissioning planned for mid

68 2015 FINANCIAL RESULTS Brian Penny, EVP and CFO 68
 1.")
69 2015 financial highlights Revenues $ 713 million Revenues Operating Margin (1) $ 293 million Operating margin STRONG MARGINS DESPITE LOWER METAL PRICES Cash Generated from Operations $ 263 million Balance Sheet $ 336 million $ 0.52 per share 2015 year-end cash balance Additional financial flexibility with $300 million credit facility (2) 1. Refer to Endnote on operating margin under the heading Non-GAAP Measures. 2. $116 million of $300 million facility used for Letters of Credit at December 31,
70 Consolidated financial summary Average Realized Prices (1) Financial Summary GOLD ($/oz): $1,188 (8%) $1,094 $1,256 (9%) $1,149 Three months ended Dec 31 Twelve months ended Dec 31 (in millions of U.S. dollars, except per share amounts) Revenues $199 $188 $713 $726 Operating margin (2) COPPER ($/lb): (26%) (20%) Adjusted net earnings/(loss) (3) 3 13 (11) 45 $2.92 $2.16 $3.02 $2.42 Adjusted net earnings/(loss) per share (3) (0.02) 0.09 Net (loss) (10) (432) (201) (477) SILVER ($/oz): (8%) $18.86 (18%) Net (loss) per share (0.02) (0.86) (0.40) (0.95) Cash generated from operations before changes in non-cash operating working capital (4) $15.73 $14.44 $15.38 Cash generated from operations Refer to Endnote on average realized prices under the heading Non-GAAP Measures. 2. Refer to Endnote on operating margin under the heading Non-GAAP Measures. 3. Refer to Endnote on adjusted net earnings under the heading Non-GAAP Measures. 4. Refer to Endnote on net cash generated from operations before changes in working capital under the heading Non-GAAP Measures. 70
71 Strong balance sheet Cash and cash equivalents (1) $336 million Undrawn Credit Facility (2) $184 million Liquidity Position $ 595 million Ongoing Sustaining Free Cash Flow Generation 2016E All-in Sustaining Costs (4) $825 $865 /oz Remaining proceeds Rainy River stream (3) $75 million Remaining Rainy River capital of $590 million 1. Cash and cash equivalents as at December 31, $116 million of $300 million facility used for Letters of Credit at December 31, Second instalment of $75 million to be paid when 60% of development capital spent and other customary conditions are satisfied. 4. Refer to Endnote on all-in sustaining costs under the heading Non-GAAP Measures. 71
72 Credit facility overview At current gold, silver and copper prices, New Gold remains below the original Net Debt/EBITDA ratio through the Rainy River construction period Considering the recent volatility in metal prices, for additional flexibility New Gold has negotiated a higher Net Debt/EBITDA covenant Revolving Credit Facility at December 31, 2015 ($mm) Revolving credit facility (expires August 14, 2019) $300 Letters of credit issued $116 Undrawn credit facility $184 Credit Facility Financial Covenants Prior Terms Current Terms At Dec 31, 2015 EBITDA/Interest > 3.0x > 3.0x 5.1x Maximum Net Debt/EBITDA 3.5x Q x Q4 16-Q x Thereafter 3.5x 2.0x Current covenant terms provide greater flexibility to access credit facility in the event of lower metal prices 72
73 2016 total liquidity Indicative Cash Continuity Schedule ($mm) $184 ($52) ~$45 $336 $75 ~$135 ~($500) Remaining Rainy River Capital in H ~$ 90 million Approximately ~($10) $213 YE2015 Cash RGLD Stream Deposit (1) AISC Margin (2) Working Capital Credit Facility (3) Interest Rainy River Capital Other Growth Capital YE2016 Total Liquidity $100 change in gold price equals ~$38 million change in AISC Margin 1. Assumes receipt of second instalment of $75 million from Royal Gold. Second instalment of $75 million is to be paid when 60% of development capital spent and other customary conditions are satisfied. 2. Refer to Endnote on all-in sustaining costs margin under the heading Non-GAAP Measures. Based on $1,200 per ounce gold price. Assumes mid-point of production guidance range and all-in sustaining costs guidance range, and commodity price and exchange rate assumptions used for all-in sustaining costs estimates. 3. $116 million of $300 million facility used for Letters of Credit at December 31,

74 CONCLUSION Randall Oliphant, Executive Chairman 74
 60.8 Moz Silver Reserve (2) >1,100km 2 land package New Afton 1.")
75 Strong Canadian presence Our Footprint in Canada Top global mining jurisdiction (1) >85% gold reserves (2) in Canada Significant Canadian dollar exposure ~70% of cash flow generated from Canadian operations ~25% gold production from Canadian assets >55% with Rainy River in full production Blackwater 8.2 Moz Gold Reserve (2) 60.8 Moz Silver Reserve (2) >1,100km 2 land package New Afton 1.2 Moz Gold Reserve (2) 1.1 Blb Copper Reserve (2) 2015 operating margin: $187 million Rainy River 3.8 Moz Gold Reserve (2) 9.4 Moz Silver Reserve (2) >190km 2 land package OPERATING DEVELOPMENT 1. Source: 2015 Behre Dolbear Report 2015 Ranking of Countries for Mining Investment. 2. For a detailed breakdown of Mineral Resources and Reserves by category, refer to New Gold s news release dated February 17, 2016 titled New Gold Announces 2015 financial results with record gold production leading to strong cash flow. Refer to Endnotes under the heading Cautionary note to U.S. readers concerning estimates of Mineral Reserves and Mineral Resources and Technical Information. 75
76 New Afton value creation $1,259 VALUE CREATION ($mm) $873 $1,153 $557 $466 $1,126 Current NAV $ 1,126 million $ 11 million Net Investment (1) $ 369 million $701 $793 $757 $441 $396 $596 Value Creation (2) NAV ($mm) $336 $90 $305 $432 Achieved commercial production $369 $ 757 million / $ 1.49 per sh. $219 $246 Capital Spend ($mm) Early 2010 Mid-2010 Early 2011 Mid-2011 Early 2012 Mid 2012 Feb 2016 ~$1,100 ~$3.25 $1.05 Gold Price ($/oz) Copper Price ($/lb) Foreign Exchange (CDN/USD) $1,200 $2.05 $1.40 Significant value creation realized 18 months prior to start-up 1. Net investment equal to total development capital of $793 million plus sustaining and growth capital of $312 million (mid-2012 to December 31, 2015) less total operating margin of $736 million (mid-2012 to December 31, 2015). Operating margin calculated as revenue less operating expenses. 2. Value creation equal to current New Afton analyst consensus net asset value less net investment. 76
 Mid-2017 14 year ~$ 33 million Base mine life Average sustaining capital per year (3) Operations Annual Production (3) Costs (3) Open pit and")
77 Rainy River highlights Gold Reserve (1) and Mine Life Capital Targeted Start-up 3.8 Moz Gold reserve Direct Processing Material 3.5 Moz at 1.5 g/t $ 590 million Remaining development capital (2) Mid year ~$ 33 million Base mine life Average sustaining capital per year (3) Operations Annual Production (3) Costs (3) Open pit and underground 21,000 tonne per day processing plant with conventional crushing, grinding, leaching and carbon-in-pulp technology 325 Koz Gold production ~ 480 Koz Silver production $ 570 per oz Total cash costs (4) $ 670 per oz All-in sustaining costs (5) 1. For a detailed breakdown of Mineral Resources and Reserves by category, refer to New Gold s news release dated February 17, 2016 titled New Gold Announces 2015 financial results with record gold production leading to strong cash flow. Refer to Endnotes under the heading Cautionary note to U.S. readers concerning estimates of mineral reserves and mineral resources and Technical Information. 2. Current plan based on $1.40 C$/US$ foreign exchange rate. As at December 31, First nine years. 4. Refer to Endnote on total cash costs under the heading Non-GAAP Measures. 5. Refer to Endnote on all-in sustaining costs under the heading Non-GAAP Measures. 77
78 Blackwater highlights Gold Reserves (2) 8.2 Moz Development Capital (1) ~$ 1,576 million Life-of-Mine Production (based on reserves) Life-of-Mine Revenue($B) (3) Gold Silver 7 Moz 30 Moz Gold Silver $ 8.4 $ 0.5 Sustaining Cost Margin (4) Regional Upside $610 /oz ~$295 million ~1,100 km Land Package 2 Flagship asset already in portfolio 1. Development capital assumes $1.25 CDN/USD exchange rate. 2. Mineral resources are exclusive of reserves. For a detailed breakdown of Mineral Resources and Reserves by category, refer to New Gold s news release dated February 17, 2016 titled New Gold Announces 2015 financial results with record gold production leading to strong cash flow. Refer to Endnotes under the heading Cautionary note to U.S. readers concerning estimates of mineral reserves and mineral resources and Technical Information. 3. Gold revenue at $1,200 per ounce, silver revenue at $15 per ounce. 4. Refer to Endnote on margin under the heading Non-GAAP Measures. Margin per ounce equal to $1,200 per ounce less all-in sustaining costs of $590 per ounce. Margin in millions (pre-tax) equal to margin per ounce multiplied by average annual gold production of 485Koz. 78

79 Multiple growth initiatives (1) Successfully Commissioned New Afton mill expansion BLACKWATER Construction Rainy River 325 Koz of annual production RAINY RIVER Permitting Blackwater 485 Koz of annual production Engineering/Planning 2016E GOLD PRODUCTION Koz New Afton C-zone El Morro New Gold has multiple organic growth options in its portfolio 1. Based on 325Koz annual production from Rainy River (first nine years) and ~485Koz annual production from Blackwater (first nine years) as outlined in the feasibility studies for the projects. 79
80 New Gold looking forward Average Mine Life Average Annual Gold Production Per Asset All-in Sustaining Costs (3) Weighted Average Current Portfolio ~7 years (1) ~100 Koz ~$845 /oz >2x 4x ($225)/oz Organic Growth Projects (2) 15 + years ~400 Koz ~$620 /oz Investing in longer-lived, larger-scale, lower-cost assets 1. Based on 12 years at New Afton (including C-zone), seven years at Mesquite, six years at Peak Mines and one year at Cerro San Pedro. 2. Based on 325Koz annual production from Rainy River (first nine years) and ~485Koz annual production from Blackwater (first nine years) as outlined in the feasibility studies and all-in sustaining costs for the projects as outlined in the feasibility studies. 3. Refer to Endnote on all-in sustaining costs under the heading Non-GAAP Measures. 80
81 A history of value creation Performance since beginning of 2009 Compound Annual Growth Rate 10.9% 5.2% (9.1%) 106 % New Gold (NYSE MKT) 43 % Gold Price New Gold/Western Goldfields business combination announced in March 2009 (49 % ) S&P/TSX Global Gold Index (1) 1. S&P/TSX Global Gold Index includes 35 gold companies in various stages of development/production. 81

82 New Gold investment thesis Establishing the leading intermediate gold company Portfolio of assets in top-rated jurisdictions Invested and experienced team Among lowest-cost producers with established track record Peer-leading growth pipeline A history of value creation 82
Corporate Presentation May 2016
 Corporate Presentation May 2016 Cautionary statements ALL AMOUNTS IN U.S. DOLLARS UNLESS OTHERWISE STATED CAUTIONARY NOTE REGARDING FORWARD-LOOKING STATEMENTS Certain information contained in this presentation,
ANNUAL GENERAL MEETING. April 25, 2018
 ANNUAL GENERAL MEETING April 25, 2018 1 Cautionary statements ALL AMOUNTS IN U.S. DOLLARS UNLESS OTHERWISE STATED CAUTIONARY NOTE REGARDING FORWARD-LOOKING STATEMENTS Certain information contained in this
Blackwater Gold Project Update. Minerals North. Prince George, BC. April 26, 2017
 Blackwater Gold Project Update Minerals North Prince George, BC April 26, 2017 1 Cautionary statements ALL AMOUNTS IN U.S. DOLLARS UNLESS OTHERWISE STATED CAUTIONARY NOTE REGARDING FORWARD-LOOKING STATEMENTS
2017 FIRST QUARTER RESULTS WEBCAST. April 27, 2017
 2017 FIRST QUARTER RESULTS WEBCAST April 27, 2017 1 Speaker Hannes Portmann President and CEO 2 Cautionary statements ALL AMOUNTS IN U.S. DOLLARS UNLESS OTHERWISE STATED CAUTIONARY NOTE REGARDING FORWARD-LOOKING
New Gold Delivers on 2017 Production and Cost Guidance and Provides 2018 Outlook (All dollar figures are in US dollars unless otherwise indicated)
") New Gold Delivers on 2017 Production and Cost Guidance and Provides 2018 Outlook (All dollar figures are in US dollars unless otherwise indicated) January 16, 2018 New Gold Inc. ( New Gold or the Company
New Gold Delivers on 2017 Production and Cost Guidance and Provides 2018 Outlook (All dollar figures are in US dollars unless otherwise indicated) January 16, 2018 New Gold Inc. ( New Gold or the Company
Deutsche Bank Leveraged Finance Conference October 2014
 Deutsche Bank Leveraged Finance Conference October 2014 Cautionary statements All monetary amounts in U.S. dollars unless otherwise stated Total cash costs shown net of by-product sales unless otherwise
2018 SECOND QUARTER RESULTS WEBCAST. July 26, 2018
 2018 SECOND QUARTER RESULTS WEBCAST July 26, 2018 1 Speakers Ray Threlkeld President and CEO Cory Atiyeh EVP Operations Paula Myson EVP and CFO 2 Cautionary statements ALL AMOUNTS IN U.S. DOLLARS UNLESS
New Gold Announces 2017 Financial Results with 11% Increase in Cash Flow Per Share (All dollar figures are in US dollars unless otherwise indicated)
") New Gold Announces 2017 Financial Results with 11% Increase in Cash Flow Per Share (All dollar figures are in US dollars unless otherwise indicated) February 20, 2018 New Gold Inc. ( New Gold or the Company
New Gold Announces 2017 Financial Results with 11% Increase in Cash Flow Per Share (All dollar figures are in US dollars unless otherwise indicated) February 20, 2018 New Gold Inc. ( New Gold or the Company
Rainy River Second Quarter 2017 Highlights. Financial Update
 New Gold Provides Rainy River Development Update; Project Schedule and Cost Remain in Line with January 2017 Plan (All dollar figures are in US dollars unless otherwise indicated) June 27, 2017 New Gold
July 28, 2015 New Gold Inc. ( New Gold ) (TSX:NGD) (NYSE MKT:NGD) today announces its 2015 second quarter operational and financial results.
 (TSX:NGD) (NYSE MKT:NGD) today announces its 2015 second quarter operational and financial results.") NEW GOLD ANNOUNCES SECOND QUARTER RESULTS RAINY RIVER CONSTRUCTION ON SCHEDULE AND ON BUDGET (All dollar figures are in US dollars unless otherwise indicated) July 28, 2015 New Gold Inc. ( New Gold ) (TSX:NGD)
NEW GOLD ANNOUNCES SECOND QUARTER RESULTS RAINY RIVER CONSTRUCTION ON SCHEDULE AND ON BUDGET (All dollar figures are in US dollars unless otherwise indicated) July 28, 2015 New Gold Inc. ( New Gold ) (TSX:NGD)
Denver Gold Forum September 2015
 Denver Gold Forum September 2015 Cautionary statements ALL AMOUNTS IN U.S. DOLLARS UNLESS OTHERWISE STATED CAUTIONARY NOTE REGARDING FORWARD-LOOKING STATEMENTS Certain information contained in this presentation,
New Gold Reports Strong Fourth Quarter Rainy River Achieves Revised Annual Guidance New Afton Exceeds Annual Guidance
 New Gold Reports Strong Fourth Quarter Rainy River Achieves Revised Annual Guidance New Afton Exceeds Annual Guidance January 8, 2019 New Gold Inc. ( New Gold or the Company ) (TSX and NYSE American: NGD)
NEW GOLD DELIVERS 2016 FIRST QUARTER PRODUCTION AT SIGNIFICANTLY LOWER COSTS (All dollar figures are in US dollars unless otherwise indicated)
") NEW GOLD DELIVERS 2016 FIRST QUARTER PRODUCTION AT SIGNIFICANTLY LOWER COSTS (All dollar figures are in US dollars unless otherwise indicated) April 27, 2016 New Gold Inc. ( New Gold ) (TSX:NGD) (NYSE
NEW GOLD DELIVERS 2016 FIRST QUARTER PRODUCTION AT SIGNIFICANTLY LOWER COSTS (All dollar figures are in US dollars unless otherwise indicated) April 27, 2016 New Gold Inc. ( New Gold ) (TSX:NGD) (NYSE
CORPORATE PRESENTATION. May 2018
 CORPORATE PRESENTATION May 2018 1 Cautionary statements ALL AMOUNTS IN U.S. DOLLARS UNLESS OTHERWISE STATED CAUTIONARY NOTE REGARDING FORWARD-LOOKING STATEMENTS Certain information contained in this news
CORPORATE PRESENTATION. February 2018
 CORPORATE PRESENTATION February 2018 1 Cautionary statements ALL AMOUNTS IN U.S. DOLLARS UNLESS OTHERWISE STATED CAUTIONARY NOTE REGARDING FORWARD-LOOKING STATEMENTS Certain information contained in this
European Gold Forum May 2014
 European Gold Forum May 2014 Cautionary statements All monetary amounts in U.S. dollars unless otherwise stated Total cash costs shown net of by-product sales unless otherwise stated CAUTIONARY NOTE REGARDING
A Canadian Focused Gold Producer
 A Canadian Focused Gold Producer CORPORATE PRESENTATION Denver Gold Forum September 2018 1 Cautionary statements ALL AMOUNTS IN U.S. DOLLARS UNLESS OTHERWISE STATED CAUTIONARY NOTE REGARDING FORWARD-LOOKING
New Gold Announces Lowest Costs and Highest Cash Flow Quarter in its History with Record Net Earnings and Net Cash Generated from Operations in 2012
 New Gold Announces Lowest Costs and Highest Cash Flow Quarter in its History with Record Net Earnings and Net Cash Generated from Operations in 2012 (All figures are in US dollars unless otherwise indicated)
Deutsche Bank 21 st Annual Leveraged Finance Conference October 2013
 Deutsche Bank 21 st Annual Leveraged Finance Conference October 2013 Cautionary statements All monetary amounts in U.S. dollars unless otherwise stated Total cash costs shown net of by-product sales unless
New Gold Announces Third Quarter Results with Lowest Costs in Company s History Updates 2013 Outlook
 New Gold Announces Third Quarter Results with Lowest Costs in Company s History Updates 2013 Outlook (All figures are in US dollars unless otherwise indicated) October 29, 2013 New Gold Inc. ( New Gold
John Tumazos Very Independent Research LLC Conference March 2014
 John Tumazos Very Independent Research LLC Conference March 2014 Cautionary statements All monetary amounts in U.S. dollars unless otherwise stated Total cash costs shown net of by-product sales unless
CORPORATE PRESENTATION. September 2017
 CORPORATE PRESENTATION September 2017 1 Cautionary statements ALL AMOUNTS IN U.S. DOLLARS UNLESS OTHERWISE STATED CAUTIONARY NOTE REGARDING FORWARD-LOOKING STATEMENTS Certain information contained in this
New Gold Announces 2014 Third Quarter Results Increases Cash Flow Despite Lower Metal Prices
 New Gold Announces 2014 Third Quarter Results Increases Cash Flow Despite Lower Metal Prices (All figures are in US dollars unless otherwise indicated) October 30, 2014 New Gold Inc. ( New Gold ) (TSX:NGD)
2017 Second Quarter Highlights
 New Gold Announces 2017 Second Quarter Results; Rainy River Project Schedule and Cost Remain in Line with January 2017 Plan (All dollar figures are in US dollars unless otherwise indicated) July 26, 2017
2014 FINANCIAL REVIEW
 2014 FINANCIAL REVIEW OPERATIONAL AND FINANCIAL HIGHLIGHTS OPERATIONAL HIGHLIGHTS All dollar figures are in United States dollars and tabular dollar amounts are in millions, unless otherwise noted. New
OPERATING AND FINANCIAL HIGHLIGHTS OPERATING HIGHLIGHTS
 Q2 SECOND QUARTER REPORT 2016 FOR THE QUARTER ENDED JUNE 30, 2016 OPERATING AND FINANCIAL HIGHLIGHTS OPERATING HIGHLIGHTS All dollar figures are in United States dollars and tabular dollar amounts are
PRESS RELEASE New Gold Reports Consolidated Reserve & Resource Statements
 PRESS RELEASE New Reports Consolidated Reserve & Resource Statements March 3, 2009 VANCOUVER, BC New Inc. ( New ) (TSX and NYSE Alternext US: NGD) today reports consolidated mineral reserve and resource
BUILDING VALUE 2015 ANNUAL REPORT 2015 NEW GOLD ANNUAL REPORT 3
 BUILDING VALUE 2015 ANNUAL REPORT 2015 NEW GOLD ANNUAL REPORT 3 New Gold Inc. is an intermediate gold producer with operating mines in Canada, the United States, Australia and Mexico, development projects
Bank of America Merrill Lynch 2012 Global Metals, Mining & Steel Conference Florida May 15-17, 2012
 Bank of America Merrill Lynch 2012 Global Metals, Mining & Steel Conference Florida May 15-17, 2012 Cautionary statement All monetary amounts in U.S. dollars unless otherwise stated CAUTIONARY NOTE REGARDING
2015 FIRST QUARTER REPORT FOR THE QUARTER ENDED MARCH 31, 2015
 2015 FIRST QUARTER REPORT FOR THE QUARTER ENDED MARCH 31, 2015 OPERATIONAL AND FINANCIAL HIGHLIGHTS OPERATIONAL HIGHLIGHTS All dollar figures are in United States dollars and tabular dollar amounts are
OPERATING AND FINANCIAL HIGHLIGHTS OPERATING HIGHLIGHTS
 Q1 FIRST QUARTER REPORT 2016 FOR THE QUARTER ENDED MARCH 31, 2016 OPERATING AND FINANCIAL HIGHLIGHTS OPERATING HIGHLIGHTS All dollar figures are in United States dollars and tabular dollar amounts are
New Gold Announces 2011 Third Quarter Results with 105% Increase in Net Cash Generated from Operations to $71 million
 New Gold Announces 2011 Third Quarter Results with 105% Increase in Net Cash Generated from Operations to $71 million (All figures are in US dollars unless otherwise indicated) November 4, 2011 New Gold
Spanish Mountain Gold Announces Results of New PEA for the First Zone
 1120-1095 West Pender Street Vancouver, British Columbia, V6E 2M6 Tel: 604.601.3651 April 10, 2017 Spanish Mountain Gold Announces Results of New PEA for the First Zone VANCOUVER, B.C. Spanish Mountain
Canaccord Genuity Global Resource Conference 2013 October 2013
 Canaccord Genuity Global Resource Conference 2013 October 2013 Cautionary statements All monetary amounts in U.S. dollars unless otherwise stated Total cash costs shown net of by-product sales unless otherwise
STRATEGY. DISCIPLINE. EXECUTION. FEBRUARY 15, 2013 FOURTH QUARTER CONFERENCE CALL
 STRATEGY. DISCIPLINE. EXECUTION. FEBRUARY 15, 2013 FOURTH QUARTER CONFERENCE CALL MANAGEMENT PARTICIPANTS Chuck Jeannes President and Chief Executive Officer Lindsay Hall EVP & Chief Financial Officer
New Gold Announces 2013 Financial Results Finishing the Year with Highest Quarterly Cash Flow
 New Gold Announces 2013 Financial Results Finishing the Year with Highest Quarterly Cash Flow (All f igures are in US dollars unless otherwise indicated) February 27, 2014 New Gold Inc. ( New Gold ) (TSX:NGD)
CAUTIONARY STATEMENT ON FORWARD LOOKING INFORMATION
 Third Quarter 2012 Results Conference Call / Webcast 1 CAUTIONARY STATEMENT ON FORWARD LOOKING INFORMATION Certain information contained or incorporated by reference in this presentation, including any
CIBC Whistler 2014 Investor Conference January 2014
 CIBC Whistler 2014 Investor Conference January 2014 Cautionary statements All monetary amounts in U.S. dollars unless otherwise stated Total cash costs shown net of by-product sales unless otherwise stated
GOLDCORP DELIVERS RECORD 2009 GOLD PRODUCTION; PEER-LEADING FIVE-YEAR GROWTH PROFILE EXTENDED
 Suite 34 666 Burrard St. Vancouver, BC, V6C 2X8 Tel: (64) 696-3 Fax: (64) 696-31 Toronto Stock Exchange: G New York Stock Exchange: GG All Amounts in $US unless stated otherwise GOLDCORP DELIVERS RECORD
NEWS RELEASE. Fort Knox Gilmore project feasibility study highlights 1
 25 York Street, 17th Floor Toronto, ON Canada M5J 2V5 NEWS RELEASE Kinross to proceed with initial Fort Knox Gilmore expansion Project expected to extend mine life to 2030 and generate 17% IRR at a low
Strategy Investment Execution Results
 Strategy Investment Execution Results Second Quarter Results CAUTIONARY STATEMENT ON FORWARD-LOOKING INFORMATION Certain information contained or incorporated by reference in this presentation and related
Q4 and Full Year 2017 Results & 2018 Outlook. February 16, 2018
 Q4 and Full Year 2017 Results & 2018 Outlook February 16, 2018 Cautionary Note Regarding Forward-Looking Statements CAUTIONARY NOTE REGARDING FORWARD-LOOKING STATEMENTS: This presentation contains or incorporates
FNV. Forward-Looking Statements
 1 Forward-Looking Statements This presentation contains certain forward looking information and forward looking statements within the meaning of applicable Canadian securities laws and the United States
Capstone Mining 2017 Production Results and 2018 Operating and Capital Guidance
 Suite 2100 510 West Georgia Street Vancouver, BC, V6B 0M3, Canada Tel: 604-684-8894 Fax: 604-688-2180 www.capstonemining.com January 10, 2018 Capstone Mining 2017 Production Results and 2018 Operating
CIBC 17th Annual Whistler
 CIBC 17th Annual Whistler Institutional Investor Conference January 23, 2014 CAUTIONARY STATEMENT ON FORWARD-LOOKING INFORMATION Certain information contained or incorporated by reference in this presentation,
RBC Capital Markets Underground Mining Technical Session Ernest Mast President & COO October 22, 2015
 RBC Capital Markets Underground Mining Technical Session Ernest Mast President & COO October 22, 2015 Cautionary Statement This presentation may contain forward-looking statements within the meaning of
together creating sustainable value SECOND QUARTER 2016 CONFERENCE CALL JULY 28, 2016
 together creating sustainable value SECOND QUARTER 2016 CONFERENCE CALL JULY 28, 2016 Management Participants 2 David Garofalo President and Chief Executive Officer George Burns EVP and Chief Operating
A Canadian Focused Gold Producer
 A Canadian Focused Gold Producer CORPORATE PRESENTATION Scotiabank Mining Conference November 2018 1 Cautionary statements ALL AMOUNTS IN U.S. DOLLARS UNLESS OTHERWISE STATED CAUTIONARY NOTE REGARDING
KINROSS GOLD CORPORATION Q Results Conference Call & Webcast
 November 3 2016 KINROSS GOLD CORPORATION Q3 2016 Results Conference Call & Webcast 1 1 CAUTIONARY STATEMENT ON FORWARD-LOOKING INFORMATION All statements, other than statements of historical fact, contained
2018 FIRST QUARTER RESULTS. May 3, 2018
 2018 FIRST QUARTER RESULTS May 3, 2018 CAUTIONARY NOTE REGARDING FORWARD-LOOKING STATEMENTS 2 CAUTIONARY NOTE REGARDING FORWARD-LOOKING STATEMENTS: This presentation contains or incorporates by reference
PRIMERO REPORTS FIRST QUARTER 2015 RESULTS; SAN DIMAS ACHIEVES RECORD QUARTERLY PRODUCTION
 PRIMERO REPORTS FIRST QUARTER 2015 RESULTS; SAN DIMAS ACHIEVES RECORD QUARTERLY PRODUCTION (Please note that all dollar amounts in this news release are expressed in U.S. dollars unless otherwise indicated.
Q4 and FY 2018 Earnings Review
 Q4 and FY 2018 Earnings Review 1 Cautionary Note Non-GAAP Measures This presentation of Pan American Silver Corp. and its subsidiaries (collectively, Pan American, Pan American Silver, the Company, we
Q Earnings Review
 Q2 2018 Earnings Review 1 Cautionary Note Non-GAAP Measures This presentation of Pan American Silver Corp. and its subsidiaries (collectively, Pan American, Pan American Silver, the Company, we or our
A Canadian Focused Gold Producer CORPORATE PRESENTATION TD MINING CONFERENCE JANUARY 16, 2019
 A Canadian Focused Gold Producer CORPORATE PRESENTATION TD MINING CONFERENCE JANUARY 16, 2019 Cautionary Statements ALL AMOUNTS IN U.S. DOLLARS UNLESS OTHERWISE STATED CAUTIONARY NOTE REGARDING FORWARD-LOOKING
Strategy Investment Execution Results
 Strategy Investment Execution Results BMO Capital Markets 2008 Global Metals and Mining Conference CAUTIONARY STATEMENT ON FORWARD-LOOKING INFORMATION Certain information contained or incorporated by reference
Kinross provides outlook for Production expected to rise by 32 per cent as cost per ounce declines
 News Release Kinross provides outlook for 2009 Production expected to rise by 32 per cent as cost per ounce declines Toronto, Ontario, January 7, 2009 Kinross Gold Corporation (TSX-K; NYSE-KGC) today provided
LEAGOLD ANNOUNCES 2018 EARNINGS, INCLUDING AISC OF $974/oz AND AISC MARGIN OF $83.2 MILLION
 News Release TSX: LMC March 14, 2019 LEAGOLD ANNOUNCES 2018 EARNINGS, INCLUDING AISC OF $974/oz AND AISC MARGIN OF $83.2 MILLION (All amounts in US dollars, unless otherwise indicated) 2018 Highlights
Northgate Minerals Reports Second Quarter Results
 Northgate Minerals Reports Second Quarter Results Fosterville Achieves Record Quarterly Production Notice: Conference Call and Webcast of Q2 Results Today at 10:00 am ET Dial in: +647-427-7450 or 1-888-231-8191
ANNUAL GENERAL MEETING APRIL 28, 2017
 ANNUAL GENERAL MEETING APRIL 28, 2017 Forward Looking Statements The information in this presentation has been prepared as at April 28, 2017. Certain statements contained in this presentation constitute
2014 FIRST Quarter Report
 2014 FIRST Quarter Report for the quarter ended March 31, 2014 TABLE OF CONTENTS MANAGEMENT S DISCUSSION AND ANALYSIS FINANCIAL STATEMENTS 2 EXECUTIVE SUMMARY 3 FINANCIAL AND OPERATING HIGHLIGHTS 4 Operating
Royal Gold Reports Record Operating Cash Flow in its Third Quarter 2017
 Royal Gold Reports Record Operating Cash Flow in its Third Quarter 2017 DENVER, COLORADO. MAY 10, 2017: ROYAL GOLD, INC. (NASDAQ: RGLD) (together with its subsidiaries, Royal Gold or the Company, we or
CAUTIONARY STATEMENT ON FORWARD-LOOKING INFORMATION
 Bank of America Merrill Lynch 19th Annual Canada Mining Conference Toronto - September 12, 2013 1 CAUTIONARY STATEMENT ON FORWARD-LOOKING INFORMATION Certain information contained or incorporated by reference
Boto Gold Project Feasibility Study Conference Call
 Boto Gold Project Feasibility Study Conference Call October 23, 2018 l TSX: IMG l NYSE: IAG l Cautionary Statement All information included in this presentation whether in narrative or chart form, including
NEWS RELEASE Lundin Mining Third Quarter Results
 Corporate Office 150 King Street West, Suite 2200 P.O. Box 38 Toronto, ON M5H 1J9 Phone: +1 416 342 5560 Fax: +1 416 348 0303 NEWS RELEASE Lundin Mining Third Quarter Results Toronto, October 24, 2018
Q Earnings Review
 Q3 2018 Earnings Review 1 Cautionary Note Non-GAAP Measures This presentation of Pan American Silver Corp. and its subsidiaries (collectively, Pan American, Pan American Silver, the Company, we or our
(All amounts are expressed in United States dollars unless otherwise indicated.)
") YAMANA ANNOUNCES METAL PURCHASE AGREEMENTS WITH SANDSTORM AND PROVIDES UPDATE ON BRIO GOLD MONETIZATION INITIATIVE --Proceeds to be applied towards balance outstanding on revolving credit facility -- TORONTO,
YAMANA ANNOUNCES METAL PURCHASE AGREEMENTS WITH SANDSTORM AND PROVIDES UPDATE ON BRIO GOLD MONETIZATION INITIATIVE --Proceeds to be applied towards balance outstanding on revolving credit facility -- TORONTO,
FIRST MAJESTIC SILVER CORP. NEWS RELEASE. First Majestic Reports Second Quarter Financial Results
 FIRST MAJESTIC SILVER CORP. Suite 1805 925 West Georgia Street Vancouver, B.C., Canada V6C 3L2 Telephone: (604) 688-3033 Fax: (604) 639-8873 Toll Free: 1-866-529-2807 Web site: www.firstmajestic.com; E-mail:
FOURTH QUARTER 2017 RESULTS. February 21, 2018
 FOURTH QUARTER 2017 RESULTS February 21, 2018 FORWARD LOOKING STATEMENTS Certain statements contained herein may constitute forward-looking statements (or forward looking information ) and are made pursuant
The Gold Industry Leader. TD Newcrest Mining Conference January 26, 2011
 The Gold Industry Leader TD Newcrest Mining Conference January 26, 2011 CAUTIONARY STATEMENT ON FORWARD-LOOKING INFORMATION Certain information contained in this presentation, including any information
CANADA S INTERMEDIATE GOLD PRODUCER
 CANADA S INTERMEDIATE GOLD PRODUCER European Gold Forum Zurich April 4-6, 2017 1 Forward Looking Information This presentation contains certain forward-looking information and forward-looking statements,
Turquoise Hill files 2016 Oyu Tolgoi Technical Report
 October 21, 2016 Press release Turquoise Hill files 2016 Oyu Tolgoi Technical Report VANCOUVER, CANADA Turquoise Hill Resources today filed an updated compliant independently-prepared technical report
CANADA S INTERMEDIATE GOLD PRODUCER
 CANADA S INTERMEDIATE GOLD PRODUCER Third Quarter 2018 Results Conference Call & Webcast October 25, 2018 1 Cautionary Statement on Forward Looking Information This presentation contains certain forward-looking
Pan American Silver Reports Cash from Operating Activities of $41.7 million in Q3 2018
 Pan American Silver Reports Cash from Operating Activities of $41.7 million in Q3 2018 Vancouver, B.C. - November 6, 2018 - Pan American Silver Corp. (NASDAQ: PAAS) (TSX: PAAS) today reported unaudited
CANADA S INTERMEDIATE GOLD PRODUCER
 CANADA S INTERMEDIATE GOLD PRODUCER Fourth Quarter and Year-End 2017 Results Conference Call & Webcast March 9, 2018 1 Forward Looking Information This presentation contains certain forward-looking information
Q2 SECOND QUARTER REPORT 2018 FOR THE QUARTER ENDED JUNE 30, 2018
 Q2 SECOND QUARTER REPORT 2018 FOR THE QUARTER ENDED JUNE 30, 2018 OPERATING AND FINANCIAL HIGHLIGHTS OPERATING HIGHLIGHTS All dollar figures are in United States dollars and tabular dollar amounts are
A Story of Transformation
 A Story of Transformation September 2017 STEPHEN LETWIN, PRESIDENT & CEO Empowering People, Extraordinary Performance l TSX: IMG l NYSE: IAG l Cautionary Statement All information included in this presentation,
Kinross Gold Corporation. Merrill Lynch Global Metals & Mining Conference 2007 May 9, 2007
 DELIVERING DISCIPLINED GROWTH 1 Cautionary Statements All statements, other than statements of historical fact, contained or incorporated by reference in this presentation, including any information as
NEWS RELEASE Lundin Mining Second Quarter Results
 Corporate Office 150 King Street West, Suite 2200 P.O. Box 38 Toronto, ON M5H 1J9 Phone: +1 416 342 5560 Fax: +1 416 348 0303 NEWS RELEASE Lundin Mining Second Quarter Results Toronto, July 25, 2018 (TSX:
Bank of America-Merrill Lynch 18th Annual Canada Mining Conference
 Bank of America-Merrill Lynch 18th Annual Canada Mining Conference September 6, 2012 CAUTIONARY STATEMENT ON FORWARD-LOOKING INFORMATION Certain information contained or incorporated by reference in this
Silver and Gold (and Base Metals Too!)
") January 2018 Silver and Gold (and Base Metals Too!) Creating Short and Long Term Value Cautionary Statements Cautionary Statement Regarding Forward Looking Statements, This presentation contains forward-looking
January 2018 Silver and Gold (and Base Metals Too!) Creating Short and Long Term Value Cautionary Statements Cautionary Statement Regarding Forward Looking Statements, This presentation contains forward-looking
TSX:AR CORPORATE PRESENTATION
 TSX:AR CORPORATE PRESENTATION Second Quarter 2018 Conference Call August 10, 2018 FORWARD LOOKING INFORMATION This presentation contains certain forward-looking statements and forward-looking information
Building Value Annual General Meeting of Shareholders
 Building Value. 2017 Annual General Meeting of Shareholders All statements, other than statements of historical fact, contained or incorporated by reference in or made in giving this presentation and responses
Barrick Gold Corporation JP Morgan Basics & Industrials Conference New York - June 2007
 CAUTIONARY STATEMENT ON FORWARD-LOOKING INFORMATION Certain information contained or incorporated by reference in this presentation and related material, including any information as to our future financial
ATLANTIC ANNOUNCES STRATEGIC INVESTMENT IN VELOCITY MINERALS LTD.
 ATLANTIC ANNOUNCES STRATEGIC INVESTMENT IN VELOCITY MINERALS LTD. January 17, 2019 Canadian dollars unless otherwise noted Vancouver, British Columbia Atlantic Gold Corporation (TSX-V: AGB) ("Atlantic"
SUITE WEST HASTINGS STREET VANCOUVER, BC V6C 2W2 CANADA TEL: FAX: November 12, 2009
 SUITE 900-999 WEST HASTINGS STREET VANCOUVER, BC V6C 2W2 CANADA TEL: 604.684.8894 FAX: 604.688.2180 FOR IMMEDIATE RELEASE November 12, 2009 #09-36 Capstone Reports Strong Third Quarter and Year-to-Date
Q PRESENTATION
 Q2 2018 PRESENTATION August 1, 2018 Cautionary Information This presentation contains forward-looking information within the meaning of applicable Canadian and United States securities legislation. All
YEAR END 2015 CONFERENCE CALL
 YEAR END 2015 CONFERENCE CALL February 26, 2015 SSRI:NDAQ SSO: TSX 1 Cautionary Notes Cautionary Note Regarding Forward-Looking Statements This presentation contains forward-looking information within
Management s Discussion and Analysis. For the year ended December 31, 2017
 Management s Discussion and Analysis For the year ended December 31, 2017 OPERATING AND FINANCIAL HIGHLIGHTS OPERATING HIGHLIGHTS All dollar figures are in United States dollars and tabular dollar amounts
Corporate Presentation
 Corporate Presentation November 2014 1 CAUTIONARY STATEMENT ON FORWARD-LOOKING INFORMATION Certain information contained or incorporated by reference in this presentation, including any information as
Mount Milligan Stream Update
 Mount Milligan Stream Update Cautionary Statement This presentation contains certain forward looking statements within the meaning of the Private Securities Litigation Reform Act of 1995. Such forward-looking
Detour Gold Achieves Production and Cost Guidance for 2017 and Provides 2018 Guidance
 January 16, 2018 NEWS RELEASE Detour Gold Achieves Production and Cost Guidance for 2017 and Provides 2018 Guidance Detour Gold Corporation (TSX: DGC) ( Detour Gold or the Company ) today announces fourth
True Value Proposition. Corporate Summary. May 2015 TSX: YRI NYSE: AUY
 True Value Proposition Corporate Summary May 215 TSX: YRI NYSE: AUY Cautionary Note Regarding Forward-looking Statement CAUTIONARY NOTE REGARDING FORWARD-LOOKING STATEMENTS: This presentation contains
Royal Gold Reports Record Annual Revenue, Earnings and Cash Flow
 Royal Gold Reports Record Annual Revenue, Earnings and Cash Flow DENVER, COLORADO. AUGUST 9, 2017: ROYAL GOLD, INC. (NASDAQ: RGLD) (together with its subsidiaries, Royal Gold or the Company, we or our
Detour Gold Reports Third Quarter 2018 Results
 NEWS RELEASE Detour Gold Reports Third Quarter 2018 Results October 24, 2018 Detour Gold Corporation (TSX: DGC) ( Detour Gold or the Company ) reports its operational and financial results for the third
Three months ended Twelve months ended December 31, December 31, US$ Millions (except per share amounts)
") NEWS RELEASE Corporate Office 150 King Street West, Suite 1500 P.O. Box 38 Toronto, ON M5H 1J9 Phone: +1 416 342 5560 Fax: +1 416 348 0303 Lundin Mining Fourth Quarter and Full Year Results Toronto, February
NEWS RELEASE Corporate Office 150 King Street West, Suite 1500 P.O. Box 38 Toronto, ON M5H 1J9 Phone: +1 416 342 5560 Fax: +1 416 348 0303 Lundin Mining Fourth Quarter and Full Year Results Toronto, February
NEWS RELEASE. Centerra Gold Announces Positive Feasibility Study on the Öksüt Project
 NEWS RELEASE Centerra Gold Announces Positive Feasibility Study on the Öksüt Project All figures are in United States dollars. This news release contains forward-looking information that is subject to
KINROSS GOLD CORPORATION
 April 1 2014 KINROSS GOLD CORPORATION Results of the Tasiast feasibility study 1 1 CAUTIONARY STATEMENT ON FORWARD-LOOKING INFORMATION All statements, other than statements of historical fact, contained
Merrill Lynch Global Metals, Mining & Steel Conference
 Merrill Lynch Global Metals, Mining & Steel Conference Key Biscayne, Florida May 13-15, 2008 CAUTIONARY STATEMENT ON FORWARD-LOOKING INFORMATION Certain information contained or incorporated by reference
Bank of America Merrill Lynch Global Metals, Mining & Steel Conference
 Bank of America Merrill Lynch Global Metals, Mining & Steel Conference May 14-16, 2013 Barcelona, Spain Cautionary statement All monetary amounts in U.S. dollars unless otherwise stated Total cash costs
Strategy Investment Execution Results
 Strategy Investment Execution Results Morgan Stanley Conference New York, Feb. 21, 2008 CAUTIONARY STATEMENT ON FORWARD-LOOKING INFORMATION Certain information contained or incorporated by reference in