Delivering on our strategy. Analyst presentation 2 March 2009
|
|
|
- Dortha Walters
- 6 years ago
- Views:
Transcription
1 Delivering on our strategy Analyst presentation 2 March 2009
2 1 David Andrews Chief Executive Officer
3 Another strong year in Increase Revenue 468.2m 557.8m 19% XEBIT margin 6.8% 7.3% 50 bps XEBIT 31.6m 40.8m 29% Pro forma EPS 10.51p % Dividend per share 2.0p 2.5p 25% Free cash flow 27.7m 33.0m 19% Group net cash 98.4m 117.8m 2 creating value for our shareholders
4 Delivering on our strategy Growing existing platforms Expanded our Broking Services platform through Cooper Gay contract Significant progress in moving from paper-based to electronic processing in the London insurance market Expanded our Hosting services including signing contract with Northgate Arinso and implementing a new technology trading infrastructure for the London Metal Exchange Completed acquisition of Mercuris SA, French Procurement outsourcing services provider Expanded the Central Price Services capabilities and automated the valuation process for our financial services customers Upgraded our securities processing platform to address new German withholding tax laws (Abgeltungssteuer) Adding new platforms Successfully completed re-alignment phase of EP with Allianz Global Investors Grew 3rd party Open Architecture customer accounts for Fondsdepot Bank by c.40% Signed contracts to acquire Cambridge Solutions Ltd Becoming the lean processor Implemented a set of standard production methods across our top 10 centres globally Commissioned a new technology to support complex processing Increased sharing to balance work loads across processing centres 3 for rapid international growth

5 4 Richard Houghton Chief Financial Officer
6 Profit & Loss (1) m % increase Revenue % Cost of Sales (414.2) (491.4) Gross profit Administrative expenses (15.2) (16.7) Adjusted operating profit % Net finance income Adjusted profit before tax % Taxation (13.4) (15.0) Adjusted profit for year % Profit attributable to minority interests Profit attributable to equity holders of the Group (XPAT) % (2) Pro forma EPS basic 10.89p 15.22p 40% (2) Pro forma EPS diluted 10.51p 14.67p 40% (1) Pre exceptional items and post add backs which include share-based payments of 2.3m (2007: 0.5m) (2) Pro forma number of shares for the year ended 31 December 2007 has been calculated by adding weighted average number of shares issued between IPO and 31 December 2007 to the actual number of shares in issue at IPO 5
7 Revenues ( m) (50) (0) (3) (3) (3) (9) (14) (15) (21) % 558 Business lines Insurance Financial markets Intercompany (1) (1) Includes BPS and Corporate. 6
8 Revenue visibility Visible revenue Basis of preparation 86% 84% 80% Visible revenue comprises the following: ( m) Annuity revenue from contracts which have a remaining contracted period greater than one year. Revenue at risk which is contracted revenue that is volume dependent after contingency Renewals where there is an ongoing relationship and for which contracts renew within a year. Visible revenue Revenue achieved 7 84 expected to remain at similar levels
9 Profits Xchanging share of EBIT (XEBIT) Xchanging share of profit after tax (XPAT) % % 33.0 ( m) ( m) Note: Pre exceptional items and after add backs including share-based payments of 2.3m (2007: 0.5m) 8
10 Margin upside Xchanging EBIT margin Margin drivers 10% 8% 6% 4% 2% 3.6% 5.6% 5.6% 8.3% 6.8% 8.9% 7.3% Leveraging central costs Productivity improvement Offshoring Partly offset by dilutive impact of: 0% XEBIT Margin EBIT Margin (including minorities) addition of FDB additional discounts weakness of Business Support revenues Note: Pre exceptional items and after add backs including share-based payments of 2.3m (2007: 0.5m) 9 84 strongly underpinned
11 Segmental performance Business Lines Revenue ( m) % Strong organic growth in procurement Increased volumes from existing long-term customers Full-year effect of new contracts which were being implemented in 2007 Mercuris SA acquisition FY XEBIT % 21.4 Improvements in procurement margins ( m) Diluted by weak performance of the Business Support offerings which operate at higher margins XEBIT margins 5.6% 9.1% 8.2% 10
12 Segmental performance Insurance Revenue Higher claims volumes ( m) 100 Automation of insurance processes 50 0 Offset by impact of discounts and loss of certain policy preparation services FY XEBIT Cost savings in Xchanging Broking Services resulting from offshoring ( m) 10 productivity improvements XEBIT margins 12.3% 12.6% 12.3% Offset by increased discounts and non-recurring implementation costs associated with offshoring and electronification of the London market 11
13 Segmental performance Financial Markets Revenue % Contribution from FDB ( m) Strong transaction volumes in XTB 50 Strengthening of the Euro against Sterling FY XEBIT % 15.1 Productivity gains ( m) Arbitrage savings from offshoring in 2007 Strengthening of the Euro against Sterling Partly offset by guaranteed discounts to Deutsche Bank and margin dilution due to FDB XEBIT margins 13.8% 10.1% 10.0% 12
14 Finance income and tax Adjusted net interest (1) Higher cash balances held by the Group driven by ( m) strong cash conversion full year effect of the primary funding received from the IPO (1) Excludes imputed interest on put options and employee loans FY Adjusted tax (2) 35% 30% 25% 20% 15% 10% 31.8% 26.6% 27.0% Utilisation of tax losses in the central services entity 2007 effective tax affected by decrease in corporation tax rates in Germany and the UK, resulting in a reduction in deferred tax assets (2) Effective tax rate on Xchanging s share of adjusted profit before tax 13 84
15 Operating cash flow Cash generated from operations and cash conversion (pre investment) (1) ( m) % % % % % 160% 140% 120% 100% 80% % Cash generated from operations Cash conversion (pre investment) (1) Cash conversion ratio, calculated as cash generated from operations divided by the Group s adjusted operating profit 14 91
16 Capital expenditure 8% 7% 6% 5% 4% 3% 2% 5.0% 3.1% 6.1% 2.6% 4.0% 3.0% 3.1% 2.9% 7.0% 3.1% Expected longterm rate 1% 0% Capex as % of revenue Depreciation as % of revenue 15 tangible and intangible
17 Strong cash flow ( m) Cash generated from operations Tax Capex Net interest received Free cash flow Minority dividend Xchanging free cash flow (post minority dividend) 16
18 Strong balance sheet m Cash/ debt Assets Non-current assets Trade and other receivables Cash and cash equivalents Net cash of 117.8m at 31 December 2008 includes 25.5m held in escrow in relation to the Cambridge acquisition. Of this net cash, 75.3m was centrally controlled cash. Liabilities Current liabilities (109.6) (129.9) Net current assets Total assets less current liabilities Pensions Pensions deficit of 18.2m (2007: 8.7m). Increase primarily due to falls in the value of the schemes investments during Non-current liabilities (61.5) (73.3) Net assets
19 Update on Cambridge process January 2009 February 2009 March 2009 April 2009 David Andrews and Letter of Offer dispatched Open Offer closes on 16 Sale of shares under the two Richard Houghton to Cambridge Shareholders March share purchase agreements appointed to the Board of Cambridge on 12 January on 20 February Open Offer to the public opened on 25 February Open Offer completes on 31 March expected to complete on 2 April acquisition expected to complete in early 2009
20 Financial overview of Cambridge business Financial overview (fiscal YE 31 March) Geographic segments m Revenue ( m) (1) Revenue (2) Europe 8% RoW 5% Australia 17% North America 70% 50 0 Adjusted EBIT ( m) (1) % Employees (3) m % % 4.4% % 10.0% 8.0% 6.0% 4.0% 2.0% 0.0% EBIT EBIT Margin (1) Cambridge consolidated revenues and adjusted operating profit under Xchanging s IFRS accounting policies excluding discontinued operations; GBP:Rs exchange rate of 1: North America 30% Australia 9% (2) Cambridge reported revenue by geography for fiscal year ended 31 March (3) As at 31 March substantial revenue base with opportunity to increase margin India 61%
21 Significant potential to create value Acceleration of consolidation of US BPO business to reduce fixed costs Strategy to create flagship processing centre to appeal to US buyer sentiment Existing and new customers have responded well to the acquisition and there is evidence of increased interest in the USA and Australia Scale benefits in Indian BPO and IT as spare capacity is utilised through access to enhanced global sales opportunities
22 Investment Guidance Current view m $m m $m Exceptional costs (1) Capex Total (1) At original $/ exchange rate of $1.8/ Total capex for the enlarged Xchanging Group in 2009 including implementation investment is expected to be 5% of revenue 21 27
23 Strong cash position post Cambridge acquisition Pro forma controllable cash position Headroom = c. 93m ( m) (1) Central cash as at 31 December 2008 of 75.3 million (including 25.5m in escrow account) Lloyd s facility extended to 90 million in October m utilised under LOC 70.5m un-drawn facility remains Post completion, pro forma group central cash of c. 22 million Available central cash plus unused facility is c. 93 million 0 Centrally controlled Cash (31/12/2008) Cash consideration (incl. non-compete and fees not yet paid) Central cash after consideration Unutilised Facility Cambridge net debt of 36 million to be refinanced using some combination of external debt and Xchanging facility (1) Centrally controlled cash includes a 25.5 million cash balance in escrow account 22 90
24 In summary Continued strong strong organic organic growth growth Significant margin margin improvement High High revenue revenue visibility visibility Confident in in the outlook for 2009 and beyond Cambridge acquisition on on track track 23

25 24 David Andrews Chief Executive Officer
26 Xchanging s vision is to be 25 THE global business processor


27 Making change happen Policy / Strategy Industry Specific Core Business Human Resources Procurement Accounting IT & Hosting 26 in non-core processing


28 THE global business processor vision >$1.3 trillion Fortune 500 non-core cost base $68 billion IDC 2012 BPO market size 27 is there to go after
29 THE global business processor vision c.1,300 employees c.3,900 employees Revenue 78% Revenue 17% (1) c.3,400 employees Revenue 5% Operations in 9 countries 28 (1) % of illustrative pro forma Enlarged Group revenues. Pro forma Enlarged Group revenues comprise: Xchanging revenues for year ended 31/12/2008 ( 558m) and Cambridge revenues for year ended 31/03/2008 ( 159m) is there FOR US to go after


30 THE global processor vision Customers in 38 countries 29 is what the market expects


31 Our 3-pronged strategy Grow existing platforms Add new platforms Lean Processor 30 to achieve the vision


32 Our Go to Market offerings Business Support Straight Through Processing Products Outsourcing Partnering 31 for sustaining rapid growth


33 A good pipeline Continue to see accelerated market demand with a high number of opportunities Go to Market Strategy trend towards bigger and more complex opportunities with an international dimension 2008 emphasis on our outsourcing, products and additional services to existing and new customers Major partnering opportunities take longer to conclude in uncertain conditions aggressively pursuing several partnering opportunities Arrangement Letter Memorandum of Understanding MOU Letter of Intent LOI Pipeline visibility Interest Shaping Validation Conclusion Contract Authority to Proceed Authority to Continue 1 Authority to Continue 2 Authority to Start of well-qualified opportunities


34 Our lean processor strategy Global Balancing Repeatable Standard Operating Model Standard Processing Centres Large Scale 33 a proven formula


 India (Gurgaon)")
 Xchanging")
 through")
35 Becoming the lean processor Lloyd s Building Farnborough Preston Hof Employees c.18% Deutsche Bank Branch c. 10% Employees c. 67% Sossenheim c. 51% Xchanging (excl. Cambridge) Xchanging (incl. Cambridge) Xchanging (excl. Cambridge) Xchanging (incl. Cambridge) Employees c. 15% c. 39% 34 Malaysia (Kuala Lumpur) India (Gurgaon) India (Cambridge, Bangalore) Xchanging (excl. Cambridge) Xchanging (incl. Cambridge) through processing precision and Global Balancing

36 What will lean processor look like? 35 large scale, standard and repeatable

37 Global business processing Service Definition Service Academy Customer Experience Change Register Performance Control Entrepreneurial Spirit Improvement Pipeline Service strives for very satisfied customers Baselining delivery Inspiring service professionals Optimising relations Anticipating new requirements Meeting obligations Optimising the value chain Enhancing results Production Definition Process Flow Work Package Capacity Schedule Workflow Control Global Balancing Improvement Pipeline Production attains precision processing Baselining productivity Reducing friction Eliminating duplication Maximising resource usage Managing throughput effectively Driving cost efficiency Increasing productivity Sales Definition Partnering Outsourcing Straight Through Processing Products Business Support Revenue Control Sales finds new revenues Baselining channels Maximising value together Guaranteeing sustainable savings Optimising the value chain Delivering the best solution Applying know-how for results Increasing predictability Relations Relations Definition Network Management Relationship Management Pioneering Regional Cooperation Stakeholder Management Value Management builds high reputation Defining stakeholders Establishing contacts Building the network Targeting opportunities Leveraging relationships Satisfying stakeholder requirements Optimising relationships Technology Technology Definition Enterprise Map Processing Components Technology Blueprint Risk Balancing Platform Innovation Technology Agenda builds long-term competitive advantage Baselining technology Linking technology with business Driving standardisation Enabling reusability Mitigating business risk Deploying best technology Targeting superior platforms Quality Quality Definition Quality System Risk Register Control Universe Compliance Regime Contract Repository Corporate Social Responsibility controls risk Implementation Raising standards Improvement Definition Deploying best practice Component Library Controlling risk Best Practice Driving rigour Ensuring adherence People Pyramid Capacity Schedule making change happen Honouring commitments Project Control Making a difference Business Plan makes change happen Progressing to the next level Capitalising on reusable assets Boosting effectiveness Enhancing career opportunities Maximising resource usage Securing results Improving performance 36 power, precision, performance
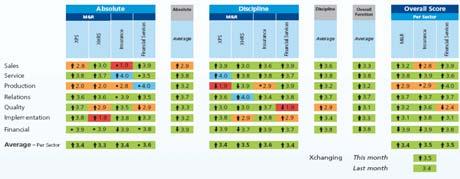
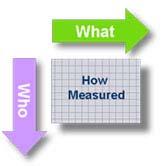


38 Measuring performance Classes 1 Types We Measure: Empirical Discipline Perception 37 the Xchanging Way
39 Our imperatives in 2009 Seize Seize the the global global business business processing opportunity Capitalise on on our our German German track track record record Position Position Xchanging in in the the USA USA Consolidate our our global global reach reach in in claims claims processing and and procurement Leverage Leverage our our UK UK market market position position Drive Drive lean lean processing 38 for building a global business processor of choice
Half Year Results 30 June 2008
 Half Year Results 30 June 2008 468 393 0 350 High revenue and 222 profit 1 growth 8 8 267 Distinctive international delivery capabilities Enhanced Insurance, Procurement, HR and Banking platforms Half
XCHANGING PLC RESULTS FOR THE SIX MONTHS ENDED 30 JUNE 2008
 XCHANGING PLC RESULTS FOR THE SIX MONTHS ENDED 30 JUNE 2008 We have continued our rapid growth in revenues and profits and our prospects for the rest of the year are strong. ended 30 June 2008 ended 30
Xchanging plc. Half year report for the six months ended 30 June 2009
 Xchanging plc Half year report for the six months ended 30 June 2009 Contents Highlights for the period Page 1 Key performance indicators Page 2 Business and financial review Page 3 Consolidated income
Xchanging plc. Annual report and accounts Building the global business processor of choice
 Serving customers in 42 countries 8,211 employees 750.4m revenue Xchanging plc Annual report and accounts 2009 4,541 employees 557.8m revenue 4,255 employees 468.2m revenue 3,449 employees 393.5m revenue
Full Year 2017 Results Presentation Bravura Solutions Limited
 Full Year 2017 Results Presentation Bravura Solutions Limited 23 rd August 2017 Important notice and disclaimer The information contained in this document (including this notice) or discussed at this presentation
RESULTS For the year ended 30 September 2011
 RESULTS For the year ended 30 September 2011 AGENDA Highlights Patrick Coveney, CEO Financial Review Alan Williams, CFO Operating Review & Strategy Patrick Coveney, CEO Outlook Patrick Coveney, CEO Q &
Financial results & business update. Quarter and year ended 31 December February 2016
 Financial results & business update Quarter and year ended 31 December 2015 11 February 2016 Disclaimer 3 Any remarks that we may make about future expectations, plans and prospects for the company constitute
Transpacific FY15 Half Year Results Presentation
 Transpacific FY15 Half Year Results Presentation Robert Boucher CEO Brendan Gill CFO 20 February 2015 - Disclaimer Forward looking statements - This presentation contains certain forward-looking statements,
FINANCIAL REVIEW. Financial Review INCOME STATEMENT Reported
 Financial Review OVERVIEW The Group made good progress in 2016 as we continued to drive growth in relatively challenging market conditions. To a large extent, the non-discretionary nature of our services
2013 FINAL RESULTS PRESENTATION
 2013 FINAL RESULTS PRESENTATION 27 th February 2014 Overall progress Business review Business development 1 CONTINUING PROGRESS Further progress on transformation during 2013 Good financial performance
ELECTROCOMPONENTS Full-year results for the year ended 31 March 2018
 ELECTROCOMPONENTS Full-year results for the year ended 31 March 2018 24 May 2018 SAFE HARBOUR This presentation contains certain statements, statistics and projections that are or may be forward-looking.
FY18 Results Presentation Bravura Solutions Limited. 28 August 2018
 FY18 Results Presentation Bravura Solutions Limited 28 August 2018 Important notice and disclaimer The information contained in this document (including this notice) and discussed at this presentation
0 Preliminary Results December Preliminary Results December March 2011
 0 Preliminary Results December 2010 Preliminary Results December 2010 23 March 2011 Agenda Introduction 2010 Results International business Acquisition of Atomic PR Citigate Grayling Red Huntsworth Health
Q Results. Adecco Group
 Adecco Group Zurich, Disclaimer and Note on Terminology Forward-looking statements Information in this release may involve guidance, expectations, beliefs, plans, intentions or strategies regarding the
Standard Life plc Full year results February 2015
 Standard Life plc Full year results 2014 20 February 2015 Increased focus on fee business driving growth and performance Assets under administration from continuing operations increased by 38% to 296.6bn,
Adecco delivers on gross margin improvements and cost cuts
 Adecco delivers on gross margin improvements and cost cuts Despite weak topline net profit remains in the black and operating cash flow is robust Q1 HIGHLIGHTS (Q1 2009 versus Q1 2008) Revenues of EUR
ARYZTA AG. FY 2016 Results. 26 September 2016
 ARYZTA AG FY 2016 Results 26 September 2016 Forward Looking Statement This document contains forward looking statements which reflect management s current views and estimates. The forward looking statements
The Morgan Crucible Company plc Preliminary Results 20 th February 2007
 The Morgan Crucible Company plc 2006 Preliminary Results 20 th February 2007 Agenda Introduction Tim Stevenson 2006 preliminary financial results Kevin Dangerfield Our continuing progress in 2006 Mark
Philips Lighting reports 0.5% full year comparable sales growth, 10% operational profitability and EUR 403 million free cash flow
 Philips Lighting reports 0.5% full year comparable sales growth, 10% operational profitability and EUR 403 million free cash flow Q4 & Full Year 2017 presentation February 2, 2018 Important information
Segmental operating profit 227.7m Down 17% 1. Reported earnings per share 59.8p Down 4%
 Highlights Revenue 1,649m Down 5% 1 Segmental operating profit 227.7m Down 17% 1 Segmental operating margins 13.8% Down 160bps Operating cash flow 2 246m Up 6% Reported earnings per share 59.8p Down 4%
Investor presentation
 Investor presentation Important information Forward-Looking Statements and Risks & Uncertainties This document and the related oral presentation contain, and responses to questions following the presentation
Fevertree Drinks plc ( Fever-Tree ) Preliminary Results
 Preliminary Results") 23 rd March 2015 Fevertree Drinks plc ( Fever-Tree ) Preliminary Results Fever-Tree, the world s leading supplier of premium carbonated mixers for alcoholic spirits by retail sales value, today announces
23 rd March 2015 Fevertree Drinks plc ( Fever-Tree ) Preliminary Results Fever-Tree, the world s leading supplier of premium carbonated mixers for alcoholic spirits by retail sales value, today announces
2014 FULL YEAR RESULTS PRESENTATION. 26 February 2015
 2014 FULL YEAR RESULTS PRESENTATION 26 February 2015 AGENDA 1 Where we are today Review of the year Ken Lever Chief Executive 2 Financial performance David Bauernfeind Chief Financial Officer 3 Business
31 March 2018 Audited Preliminary Results. 6 June 2018
 31 March 2018 Audited Preliminary Results 6 June 2018 1 Presentation Team Euan Fraser Chief Executive Officer Stuart McNulty UK Chief Executive Officer John Paton Chief Financial Officer Has led Alpha
Analysts Meeting FY & Q4 2015
 1 Analysts Meeting FY & Q4 2015 Forward Looking Information Such forward-looking statements are based on Dassault Systèmes management's current views and assumptions and involve known and unknown risks
AUDITED RESULTS FOR THE YEAR ENDED 31 DECEMBER 2016
 AUDITED RESULTS FOR THE YEAR ENDED 31 DECEMBER 2016 AGENDA 2 1 Opening remarks / market update 2 Financial results 3 Operational review 4 Strategy update 5 Outlook 1 2 3 4 5 OPENING REMARKS / MARKET UPDATE
Refresco Gerber reports solid 2015 results and delivers on strategic goals
 Press release March 10, 2016 Refresco Gerber reports solid 2015 results and delivers on strategic goals Key indicators: Volume in full year 2015 increased 2.1% to 6,095.5 million liters (FY 2014: 5,968.9
Global Offer CITIGROUP UBS
 Global Offer CITIGROUP UBS This document comprises a prospectus relating to Xchanging plc (the Company ) prepared in accordance with the Prospectus Rules of the Financial Services Authority (the FSA )
2010 Full Year Results Conference Call. James Singh Chief Financial Officer
 2010 Full Year Results Conference Call James Singh Chief Financial Officer Disclaimer This presentation contains forward looking statements which reflect Management s current views and estimates. The forward
DP WORLD ANNOUNCES STRONG FINANCIAL RESULTS Earnings grow 50% in First Half of 2016
 DP WORLD ANNOUNCES STRONG FINANCIAL RESULTS Earnings grow 50% in First Half of Dubai, United Arab Emirates, 18 August,. Global trade enabler DP World today announces strong financial results for the six
Financial Information
 Accelerating & profit in H1: Revenue up +4% reported, Adj. EBITA +8%, Net Income +18%, FCF +15% H1 revenue of 12.2bn, +2.7% organic, +4.1% outside Infrastructure H1 adj. EBITA margin up 60bps 1 org., to
Quarter ended 30 September Financial results & business update
 Quarter ended 30 September 2014 Financial results & business update 21 October 2014 Disclaimer Any remarks that we may make about future expectations, plans and prospects for the company constitute forward-looking
Investor and Analyst presentation Senvion S.A.
 Investor and Analyst presentation Senvion S.A. Nine month results for the period ended on 30 September 2018 14 November 2018 Disclaimer This presentation (the Presentation ) has been prepared by Senvion
Investor Presentation
 Investor Presentation 1 Disclaimer This document has been prepared by Energy One Limited (EOL) and comprises written materials and slides for a presentation concerning EOL. This presentation is for information
2005 FULL YEAR RESULTS. March / April 2006
 2005 FULL YEAR RESULTS March / April 2006 DISCLAIMER Safe Harbour Statement This presentation contains forward-looking statements (made pursuant to the safe harbour provisions of the Private Securities
2012 half year results
 2012 half year results 29 th August 2012 Leading global nutritional solutions and cheese group Cautionary statement This presentation contains forward-looking statements. These statements have been made
B. Riley FBR Investor Conference May 24, 2018
 B. Riley FBR Investor Conference May 24, 2018 Safe Harbor Statement Forward-Looking Statements All statements other than statements of historical fact are forward-looking statements. These forward-looking
Financial results & business update. Quarter and year ended 31 December February 2017
 Financial results & business update Quarter and year ended 31 December 2016 14 February 2017 Disclaimer 3 Any remarks that we may make about future expectations, plans and prospects for the company constitute
Financial Overview. Leslie Varon
 Financial Overview Leslie Varon Xerox Investment Proposition Global Market Leader Attractive Market Opportunities Disciplined Operator Strong Annuity- Driven Cash Flow Sustainable Shareholder Returns Strong
Foxtons Interim results presentation For the period ended 30 June 2018
 Foxtons Interim results presentation For the period ended 30 June 2018 Important information This presentation includes statements that are, or may be deemed to be, forward-looking statements. These forward-looking
2013 Results. Mark Wilson Group Chief Executive Officer
 2013 Results 1 Disclaimer Cautionary statements: This should be read in conjunction with the documents filed by Aviva plc (the Company or Aviva ) with the United States Securities and Exchange Commission
Foxtons Preliminary results presentation For the year ended December 2018
 Foxtons Preliminary results presentation For the year ended December 2018 Important information This presentation includes statements that are, or may be deemed to be, forward-looking statements. These
ARYZTA AG. H1 Results, FY March 2017
 ARYZTA AG H1 Results, FY 2017 13 March 2017 Forward Looking Statement This document contains forward looking statements which reflect the Board of Directors' current views and estimates. The forward looking
RESULTS 1 st QUARTER 2018 (IFRS, UNAUDITED)
") RESULTS 1 st QUARTER (IFRS, UNAUDITED) April 19, SAFE HARBOR This presentation includes forward-looking statements based on the beliefs of Software AG management. Such statements reflect current views
RESULTS 1 st QUARTER (IFRS, UNAUDITED) April 19, SAFE HARBOR This presentation includes forward-looking statements based on the beliefs of Software AG management. Such statements reflect current views
Recommended Merger of QANTM Intellectual Property Limited and Xenith IP Group Limited. 27 November 2018
 Recommended Merger of QANTM Intellectual Property Limited and Xenith IP Group Limited 27 November 2018 Disclaimer This presentation is issued by QANTM Intellectual Property Limited (ACN 612 441 326) (QANTM;
Revenue 1,716 million (7% y/y) EBITA 150 million (11% y/y) EBITA margin 8,8 %
 EBITA 150 million (11% y/y) EBITA margin 8,8 %") Q3 HIGHLIGHTS GROUP Revenue 1,716 million (7% y/y) EBITA 150 million (11% y/y) EBITA margin 8,8 % Gaining share in Bank & Finance; +6% y/y Change in pension scheme implemented Significant restructuring
Q3 HIGHLIGHTS GROUP Revenue 1,716 million (7% y/y) EBITA 150 million (11% y/y) EBITA margin 8,8 % Gaining share in Bank & Finance; +6% y/y Change in pension scheme implemented Significant restructuring
Lloyds TSB Group plc Results
 Lloyds TSB Group plc 2004 Results PRESENTATION OF RESULTS In order to provide a clearer representation of the underlying performance of the Group, the results of the Group s life and pensions and general
STRONG REVENUE GROWTH AND IMPROVED PROFITABILITY
 FINANCIAL REVIEW STRONG REVENUE GROWTH AND IMPROVED PROFITABILITY 2018 has been a year of significant financial progress. Revenue growth has accelerated, gross and operating profit margins have improved
ATS REPORTS FOURTH QUARTER AND ANNUAL FISCAL 2018 RESULTS
 (519) 653-6500 730 Fountain Street North, Cambridge, Ontario N3H 4R7 ATS REPORTS FOURTH QUARTER AND ANNUAL FISCAL 2018 RESULTS Cambridge, Ontario (May 17, 2018): ATS Automation Tooling Systems Inc. (TSX:
Roadshow presentation 3-Month Key Sales Figures 2016/17. January 2017
 Roadshow presentation 3-Month Key Sales Figures 2016/17 Agenda BC at a glance Highlights 3 months 2016/17 Strategy & Outlook Page 2 BC at a glance Who we are? The heart and engine of the chocolate industry
Temenos announces very strong Q3 results, full year guidance raised
 Temenos announces very strong Q3 results, full year guidance raised GENEVA, Switzerland, 17 October 2018 Temenos AG (SIX: TEMN), the banking software company, today reports its third quarter 2018 results.
For personal use only
 RELIANCE WORLDWIDE CORPORATION LIMITED ACN 610855877 www.rwc.com FY2016 RESULTS PRESENTATION 29 August 2016 Important notice This presentation contains general information about s activities at the date
CONTENT FINANCIAL HIGHLIGHTS BUSINESS OVERVIEW Highlights
 FINANCIAL HIGHLIGHTS BUSINESS OVERVIEW CONTENT FINANCIAL HIGHLIGHTS 2013 Highlights Revenue Analysis Operating Income Analysis Cash Flows Currency Analysis Second half 2013 BUSINESS OVERVIEW 2 FINANCIAL
Fourth Quarter and Full Year Earnings Call March 1, 2019
 Fourth Quarter and Full Year Earnings Call March 1, 2019 Safe Harbor & Non-GAAP Financial Measures Cautionary Notice Statements in this news release and the schedules hereto that are not purely historical
FOR IMMEDIATE RELEASE Contact: Sridhar Ramasubbu Wipro Limited Results for the quarter ended December 31, 2009 under IFRS
 FOR IMMEDIATE RELEASE Contact: Sridhar Ramasubbu Wipro Limited 408-242-6285 Results for the quarter ended December 31, 2009 under IFRS Wipro Records 19% YoY Growth in Profit After Tax IT Services Business
2017 Full Year Results. Tuesday 21 November 2017
 2017 Full Year Results Tuesday 21 November 2017 Disclaimer Certain information included in the following presentation is forward looking and involves risks, assumptions and uncertainties that could cause
The Food Travel Experts.
 The Food Travel Experts www.foodtravelexperts.com Presentation structure 1. Group highlights Kate Swann 2. Financial review Jonathan Davies 3. Business review Kate Swann 4. Q&A All 2 Group highlights Good
Engineering smarter solutions together TT Electronics plc 2018 Interim Results
 Engineering smarter solutions together TT Electronics plc 2018 Interim Results August 2018 1 H1 2018 overview Strong organic performance, enhanced by acquisitions Strong financial results, ahead of expectations
For personal use only
 Affinity Education Group (ASX:AFJ) Morgans Conference 10 October 2014 Disclaimer This presentation contains general information in summary form which is current as at 10 October 2014. It presents financial
PRESENTATION OF 2017 ANNUAL RESULTS
 PRESENTATION OF 2017 ANNUAL RESULTS Paris, 19 February 2018 Delivering Transformation. Together. DISCLAIMER This presentation contains forward-looking information subject to certain risks and uncertainties
2017 Interim Results. Continuing Execution of Our Strategy. 3 August 2017
 2017 Interim Results Continuing Execution of Our Strategy 3 August 2017 0 Disclaimer THIS PRESENTATION IS NOT FOR RELEASE, PUBLICATION OR DISTRIBUTION, IN WHOLE OR IN PART, IN OR INTO THE UNITED STATES
FY2017 Result Presentation. 21 August 2017
 FY2017 Result Presentation 21 August 2017 The Hansen journey growing and diversifying by geography, industry, propriety products and customer Early 1990 s Today Revenue by geography Industry verticals
The Food Travel Experts.
 The Food Travel Experts www.foodtravelexperts.com Presentation structure 1. Group highlights Kate Swann 2. Financial review Jonathan Davies 3. Business review Kate Swann 4. Q&A All 2 Group highlights Strong
CHIEF FINANCIAL OFFICER S REVIEW
 15 CHIEF FINANCIAL OFFICER S REVIEW Capita has early adopted IFRS 15, the new revenue recognition standard, and this report on our performance in 2017 against the comparative period in 2016 is under the
Financial results & business update. Quarter ended 31 March April 2018
 Financial results & business update Quarter ended 31 March 2018 18 April 2018 Disclaimer 3 Any remarks that we may make about future expectations, plans and prospects for the company constitute forward-looking
SIEMENS GAMESA'S FIRST FINANCIAL RESULTS REFLECT THE INCREASE IN VOLATILITY IN SOME OF THE GROUP'S MAIN ONSHORE MARKETS
 6 November 2017 April-September 2017 Results SIEMENS GAMESA'S FIRST FINANCIAL RESULTS REFLECT THE INCREASE IN VOLATILITY IN SOME OF THE GROUP'S MAIN ONSHORE MARKETS Siemens Gamesa Renewable Energy 1 commenced
Q4 & FY 2017 EARNINGS PRESENTATION MARCH 13, 2018
 Q4 & FY 2017 EARNINGS PRESENTATION MARCH 13, 2018 FORWARD-LOOKING STATEMENTS & NON-GAAP FINANCIAL INFORMATION 2 FORWARD-LOOKING STATEMENTS This presentation contains, and management may make on our call
BUSINESS STRATEGY & FINANCE MANAGEMENT. Presentation to Small & Medium Enterprises
 BUSINESS STRATEGY & FINANCE MANAGEMENT Presentation to Small & Medium Enterprises STRATEGY Person, Corporation or Nation Who or where they are Where they want to be How to get there DEVELOPMENT OF STRATEGIC
BAML Conference - Miami
 BAML Conference - Miami Francois Luscan, President & CEO Xavier Leclerc de Hauteclocque, CFO December 3, 2013 Forward Looking Statement This presentation may include forward-looking statements. Forward-looking
Morgan Stanley European Financials Conference Gregor Pottmeyer, CFO. London, 26 March 2014
 Morgan Stanley European Financials Conference Gregor Pottmeyer, CFO London, 26 March 2014 Morgan Stanley European Financials Conference 26 March 2014 Deutsche Börse Group 1 Investment Highlights Deutsche
Our Transformation Continues Sidoti NDR May 29-30, 2018
 Our Transformation Continues Sidoti NDR May 29-30, 2018 Disclosure Regarding Forward-Looking Statements Forward-Looking Statements and Factors That May Affect Future Results: Throughout this presentation,
FY 2015 Results Presentation. 19 January 2016
 FY 2015 Results Presentation 19 January 2016 Disclaimer THIS PRESENTATION IS NOT AN OFFER OR SOLICITATION OF AN OFFER TO BUY OR SELL SECURITIES IN THE UNITED STATES OF AMERICA OR IN ANY OTHER JURISDICTION.
Lindorff. Company Presentation. November 2016
 Lindorff Company Presentation November 06 Disclaimer IMPORTANT INFORMATION Not for distribution in or into the United States, Australia, Canada, Japan or any other jurisdiction in which such distribution
Bank of Queensland. Full Year Results 31 August 2008
 Bank of Queensland Full Year Results 31 August 2008 Agenda Result highlights David Liddy Managing Director & CEO Financial result in detail Ram Kangatharan Group Executive & CFO BOQ Portfolio Ram Kangatharan
Press Release 23 September 2014 CentralNic Group plc ( CentralNic or the Company or the Group ) Interim results for the six months ended 30 June 2014
 Interim results for the six months ended 30 June 2014") Press Release 23 September 2014 CentralNic Group plc ( CentralNic or the Company or the Group ) Interim results for the six months 30 June 2014 CentralNic (AIM: CNIC), developer and manager of a technology
Press Release 23 September 2014 CentralNic Group plc ( CentralNic or the Company or the Group ) Interim results for the six months 30 June 2014 CentralNic (AIM: CNIC), developer and manager of a technology
Temenos reports final results for 2008 and gives outlook for 2009
 Temenos reports final results for 2008 and gives outlook for 2009 Geneva, Switzerland, February 18, 2009 Temenos Group AG (SWX: TEMN), the global provider of integrated core banking solutions, today reports
(Registration no C) (Registration no C) Financial Results
 (Registration no C) Financial Results") 3 rd Quarter & 9-Month 2011 Financial Results (unaudited) 10 November 2011 1 1 Important note on forward looking statements The presentation herein may contain forward looking statements by the management
3 rd Quarter & 9-Month 2011 Financial Results (unaudited) 10 November 2011 1 1 Important note on forward looking statements The presentation herein may contain forward looking statements by the management
Performance for the Quarter ended June 30, 2009 and Outlook for our Quarter ending September 30, 2009
 FOR IMMEDIATE RELEASE Contact: Sridhar Ramasubbu Wipro Limited 408-242-6285 Wipro records 13% growth in Net Income Results for the quarter ended June 30, 2009 under IFRS Bangalore, India and East Brunswick,
Hellas Group 4th Quarter 2007 Results. February 19, 2008
 Hellas Group 4th Quarter 2007 Results February 19, 2008 Forward looking statement This presentation includes forward-looking statements. These forward-looking statements include all matters that are not
Investor & Analyst Presentation Ful YearResults 30 June2016 For personal use only 25th August 2016 Rebekah O Flaherty - CEO I Jonathan Kenny - CFO
 Investor & Analyst Presentation Full YearResults 30 June2016 25th August 2016 Rebekah O Flaherty - CEO I Jonathan Kenny - CFO Agenda 1 Overview 2 Strategic Priorities 3 FY16 Financial Results 4 FY17 Outlook
Preliminary results for the year ended 31 March 2014
 Preliminary results for the year ended 31 March 2014 7 May 2014 2014 Experian plc. All rights reserved. Experian and the marks used herein are service marks or registered trademarks of Experian plc. Other
Cover-More Group. UBS Australasia Conference. November 2015
 Cover-More Group UBS Australasia Conference November 2015 Executive summary: FY15 overview Cover-More delivered another year of double digit earnings growth, with offshore business growing substantially.
NORTHGATE PLC INTERIM RESULTS FOR THE SIX MONTHS ENDED 31 OCTOBER 2011
 6 December 2011 NORTHGATE PLC INTERIM RESULTS FOR THE SIX MONTHS ENDED 31 OCTOBER 2011 Northgate plc ( Northgate, the Company or the Group ), the UK and Spain s leading specialist in light commercial vehicle
Financial Review. Strategic Report - Performance. Table 1: Performance Metrics
 58 Financial Review Despite the challenge of a mild winter, the Group had a good year with revenue increasing by 6.2%, operating profits increasing 11.5%, adjusted earnings per share increasing by 11.7%,
Bank and Bondholder presentation
 Bank and Bondholder presentation 19 September 2013 0 Geopost, Enfield Agenda Welcome and strategic overview (David Sleath, CEO) Operational and financial performance (Justin Read, Group Finance Director)
8 th Annual Australian & New Zealand Investment Conference London 8 March Christopher Rex, Managing Director
 8 th Annual Australian & New Zealand Investment Conference London 8 March 2011 Christopher Rex, Managing Director AGENDA About Ramsay Health Care Growth Story Formula For Success Recap Half-Year Results
MICROGEN plc ( Microgen ) Audited Preliminary Results for the Year Ended. 31 December 2016
 Audited Preliminary Results for the Year Ended. 31 December 2016") 8 March 2017 MICROGEN plc ( Microgen ) Audited Preliminary Results for the Year Ended 31 December 2016 Microgen, a leading provider of business critical software and services, reports its audited preliminary
8 March 2017 MICROGEN plc ( Microgen ) Audited Preliminary Results for the Year Ended 31 December 2016 Microgen, a leading provider of business critical software and services, reports its audited preliminary
For personal use only. Investor Presentation Bravura Solutions Limited
 Investor Presentation Bravura Solutions Limited Tony Klim CEO 27 April 2017 The information contained in this document (including this notice) or discussed at this presentation (collectively, the Presentation)
William Blair Growth Stock Conference June 15, Member FINRA/SIPC
 William Blair Growth Stock Conference June 15, 2011 Member FINRA/SIPC Safe Harbor Disclosure The following information contains forward-looking statements. Forward-looking statements include statements
Group revenue of 35.5 billion, an increase of 14.1%, with organic growth of 4.2%
 news release VODAFONE GROUP PLC VODAFONE ANNOUNCES RESULTS FOR THE YEAR ENDED 31 MARCH 2008 Embargo: Not for publication before 07:00 hours 27 May 2008 Key highlights (1) : Group revenue of 35.5 billion,
KION Q3 UPDATE CALL Gordon Riske, CEO Thomas Toepfer, CFO Wiesbaden, 14 November 2013
 KION Q3 UPDATE CALL 2013 Gordon Riske, CEO Thomas Toepfer, CFO Wiesbaden, 14 November 2013 AGENDA 1 Highlights 2013 Gordon Riske 2 Financial Update Thomas Toepfer 3 Outlook Gordon Riske 14 November 2013
Temenos announces very strong start to 2018 with Q1 total software licensing growth of 40%
 Temenos announces very strong start to 2018 with Q1 total software licensing growth of 40% GENEVA, Switzerland, 18 April 2018 Temenos Group AG (SIX: TEMN), the banking software company, today reports its
Driving Total Shareholder Return
 ANALYST MEETING Driving Total Shareholder Return David Shedlarz Vice Chairman Agenda Total Shareholder Return (TSR) framework Key TSR drivers Business development Cost reduction Continuous improvement
For personal use only
 Click to edit Master text styles IDP Education FY16 Results Presentation Twelve months to 30 June 2016 11 February 2016 Important notice and disclaimer Click Disclaimer to edit Master text styles The material
FINANCIAL OVERVIEW AL MISTYSYN SENIOR VICE PRESIDENT, FINANCE & CHIEF FINANCIAL OFFICER FINANCIAL COMMUNITY PRESENTATION OCTOBER 3, 2017
 FINANCIAL OVERVIEW AL MISTYSYN SENIOR VICE PRESIDENT, FINANCE & CHIEF FINANCIAL OFFICER FINANCIAL COMMUNITY PRESENTATION OCTOBER 3, 2017 Forward Looking Statement The presentations today will contain certain
VOUGEOT BIDCO PLC QUARTERLY REPORT TO NOTEHOLDERS 300,000, % SENIOR SECURED NOTES DUE 2020
 VOUGEOT BIDCO PLC QUARTERLY REPORT TO NOTEHOLDERS 300,000,000 7.875% SENIOR SECURED NOTES DUE 2020 290,000,000 SENIOR SECURED FLOATING RATE NOTES DUE 2020 (the Notes ) Q4 2013 PERIOD ENDED 28 NOVEMBER
Q3 FY18 Noteholder Presentation 29 TH AUGUST 2018
 Q3 FY18 Noteholder Presentation 29 TH AUGUST 2018 The Presenting Team David Flochel Gabriel Pirona CEO CFO Agenda 01 SELECTA TODAY 02 TRADING UPDATE 03 FINANCIAL RESULTS 04 APPENDIX 01 Selecta Today 01
FY 2017 RESULTS. March 8 th, 2018
 FY 2017 RESULTS March 8 th, 2018 AGENDA Highlights 2017 performance 2018 outlook FY 2017 RESULTS 2 HIGHLIGHTS SUCCESSFUL STRATEGIC REPOSITIONING Our 3-year plan is now 90% completed after 2 years Strategic
Half Year Results for the Six Months to 31 January 2019
 Close Brothers Group plc T +44 (0)20 7655 3100 10 Crown Place E enquiries@closebrothers.com London EC2A 4FT W www.closebrothers.com Registered in England No. 520241 Half Year Results for the Six Months
RESULTS 2 nd QUARTER 2018
 RESULTS 2 nd QUARTER (IFRS, UNAUDITED) July 18, Software AG. All rights reserved. SAFE HARBOR This presentation includes forward-looking statements based on the beliefs of Software AG management. Such