Presentation to Portfolio Committee
|
|
|
- Robert Short
- 6 years ago
- Views:
Transcription
1 Presentation to Portfolio Committee Oxford Economic Model and Market Investment Framework August 2017 Slide no. 1
2 Contents SA Tourism s Goal for the Next Five Years (slide 3) Approach for Developing the Marketing Investment Framework (slide 4) Consultation Process (slide 5) Stakeholder Feedback (slides 6 8) Developing the Market Investment Framework (slides 9 29) Operating Strategy: The Hub and Spoke Model (slides 30 ) Strategy Framework for Engagement with the Provinces(slides 31) Slide no. 2
 is expected to reach ZAR 142Bn by 2021 SA TOURISM s GOAL FOR THE NEXT FIVE YEARS All International Tourists Domestic Holiday Tourists To")
3 Total tourism revenue from the two markets (i.e., international and domestic) is expected to reach ZAR 142Bn by 2021 SA TOURISM s GOAL FOR THE NEXT FIVE YEARS All International Tourists Domestic Holiday Tourists To meet the goal aspirations, South Africa should reach ~14.0 million international tourist arrivals Boosting the domestic holiday travel will allow South Africa to reach ~3.6 million holiday trips by international tourists, who, on a day spends ZAR 850 and stays 9.2 nights in SA in 2016 TOTAL TOURIST Revenue 1 by domestic holiday tourists, who, on a day spends ZAR 530 and stays 5.1 nights on a trip ZAR ~109Bn (TTFDS based on 2016 ) ZAR ~118Bn by 2021 ZAR ~9.7Bn (holiday Revenue based on 2016) (TTFDS + Holiday Revenue) ZAR ~142Bn by 2021 (TTFDS + TTDS based on 2016) Note: 1 Based on the spend in 2016, and not adjusted for inflation or currency fluctuations; Source: Departure Survey 2016; MIF, SA Tourism Domestic Survey 3
4 Our approach to develop the marketing investment framework is laid out below: Gather Inputs from Relevant Stakeholders Gathered inputs from stakeholders to develop hypotheses and identify the guiding principles that would help define the framework for the strategic thrust Draft Framework for Investment Choices Drafted preliminary framework, taking cognisance of the key objectives of the thrust Discuss Framework with Relevant Stakeholders Finalise the Framework Discussed and review the Marketing Investment Framework with the relevant stakeholders and gathered their inputs and refine them Finalised the framework in accordance with the inputs shared by the stakeholders, and in mutual discussion with the SA Tourism business teams Final Sign-off on the Framework Got final sign-off on the Marketing Investment Framework and portfolio selection from the relevant stakeholders 4
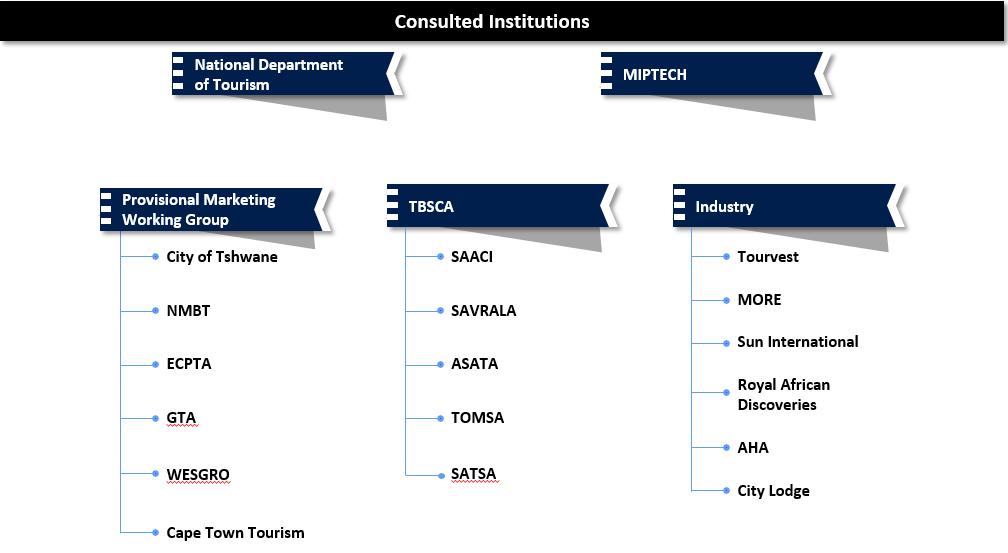
5 5
6 The opinion of stakeholders across the South Africa s tourism ecosystem was gathered to determine the guiding principles to develop the investment framework Conversations with the stakeholders have provided the following inputs to be considered when developing the investment framework Measurability of Impact Clarity in Role Pragmatic Approach Guiding Principles Synergy in Efforts Agility Simplicity 6

7 Guiding Principles All the entities operating in South Africa s tourism ecosystem need to have a unified focus on the destination s tourism positioning, with synergised efforts and simplified processes Clarity in Role Key Guiding Principles Share the mandate of SA Tourism in the tourism value chain and its role in contributing to the economy of the country. Synergy in Efforts Synergies needed must be achieved among different entities operating in the tourism ecosystem New MIF needed to relate to industry s footprint in the market. Simplicity Over the years, the addition of various elements to the existing processes for defining portfolios has resulted in making the processes complex and cumbersome; therefore, MIF has define (redefine) clear and standard guidelines 7
8 Additionally, the efforts towards meeting the goal should be practical and allow for agility, and the impact should be assessed to establish effectiveness Guiding Principles Key Guiding Principles Measurability of Impact The impact of various efforts that SA Tourism is making to enhance tourism growth in South Africa were assessed. There is a clear set of indicators to establish the ROI across various aspects of the tourism value chain, which will allow monitoring of different entities effectiveness. Pragmatic Approach It is imperative that the efforts to spur the South African tourism industry should not only follow a scientific approach but also factor in the realities of the operating environment, which is what the MIF delivers Agility The evolving internal and external parameters, which impact the South African tourism ecosystem, have been addressed, to tap into the potential of emerging opportunities and or quick wins 8

9 Thrust 1 : Developing the Market Investment Framework OPTIMISING MARKETING INVESTMENTS Develop and implement an investment strategy that allows SA Tourism to focus on prioritised markets Define a robust portfolio to target opportunities Formulate an optimal investment plan 9


10 To achieve the goal of 5 in 5 SA Tourism needed to develop a marketing investment strategy that will help the organisation focus on prioritised Markets and Segments To achieve the goal of adding five million tourists to the existing baseload, in the next five years, SA Tourism needs to develop a marketing investment strategy that will help the organisation focus on prioritised markets and segments 1 Reassess Key 2 Develop Marketing 3 Inform Investment 4 Source Markets Investment Model Strategy Design a robust and replicable portfolio review approach for SA Tourism, taking into consideration each market s attractiveness and the overall targets Develop an agile, intuitive excel-based model to help SA Tourism distribute its marketing budget across identified key markets Develop and test various market scenarios to formulate an optimal investment plan and performance review schedule based on the current allocated financial resources Prepare for Future Build an Scenarios agile model that will enable SA Tourism to assess their performance in the future and adjust their strategy accordingly 10

11 Developing the Marketing Investment Framework SA Tourism s is guided by the philosophy of bringing together the targets, market selection and available resources, to establish optimal marketing investments Establish annualised targets in line with market performance and investment by leveraging information from an Oxford Econometric model What? Targets Prioritise markets for marketing investment based on performance and outlook, South Africa s ability to win in the market, return on past investments and SA Tourism s mandate Why? Purpose/ Mandate Gain clarity on the role of SA Tourism to inform the investment and partnership strategies Optimise marketing investment distribution to ensure high return on investments by mapping targets across the prioritised markets and identifying synergies across entities operating in the tourism ecosystem Where? Markets How? Investment Optimal Investment Distribution 11

12 Key steps in developing the Marketing Investment Framework Targets Determine growth to be achieved across different markets - TDM Outcome: Growth rates to assess nominal growth across all source markets Markets Level 0: Eliminate markets based on data availability Market Attractiveness Level 1: Rank markets on macroeconomic strength/stability Level 2: Rank markets on outbound attractiveness Ability to Win Rank markets on South Africa s ability to win Outcome: Priority order of Markets Allocate budget across the prioritised markets by leveraging baseline growth, setting activated growth, and applying the relative cost of acquisition Investments Assess arrivals (by specific purpose) from the existing portfolio markets Determine marketing spend (for the purpose) across the specific portfolio markets Outcome: Relative cost of acquisition of tourists across all markets 12
13 SA Tourism leverages the Tourism Decision Metrics (TDM) developed by Oxford Economics. The model forecast Global Tourism Demand for 190 countries. Targets It currently estimates that the WORLD will reach 1,553Mn arrivals by 2021 From the Global tourism demand it calculate a share of each destination country based on historic and future performance. For SA it estimates a share of 12.7Mn arrivals by Global Tourism Demand (190 Markets) Destination Market Share Calculation For each origin market: Real GDP Consumer Spending Exchange rates Unemployment For each potential destination: Prices Consumer price Index, Exchange rate, Interest rates Destination competitiveness Index Regulatory frame work Environment & Infrastructure Human, cultural and natural resources 13
14 Market prioritisation exercise ranks countries on their relative attractiveness as a source market and South Africa s ability to operate and perform in that market Marketing Investment Framework: Markets Targets Baseline vs. Activated Growth: Determine growth achieved with/without marketing investment across different markets Outcome: Growth rates to assess nominal growth across all source markets Markets Level 0: Eliminate markets based on data availability Market Attractiveness Level 1: Rank markets on macroeconomic strength/stability Level 2: Rank markets on outbound attractiveness Ability to Win Rank markets on South Africa s ability to win Outcome: Priority order of Markets Allocate budget across the prioritised markets by leveraging baseline growth, setting activated growth, and applying the relative cost of acquisition Investments Assess arrivals (by specific purpose) from the existing portfolio markets Determine marketing spend (for the purpose) across the specific portfolio markets Outcome: Relative cost of acquisition of tourists across all markets 14
15 As the first step, the prioritisation framework filters out countries with no data availability for select essential indicators that demonstrate the macro-economic state of the market Markets: Attractiveness Level 0 As the framework is driven by several data points, data availability is a key criterion to remove countries from further analysis For market prioritisation, the framework considers all the countries in the world (214 countries), and shortlists markets based on their data availability across mandatory indicators, which can be selected from the following: Indicator Name Data Availability (By Country) Mandatory Indicator for Next Level Selection Urban Population 209 GDP PPP per Capita Currency Exchange Rate Political Stability Index Education Index In the current selection scenario, for a source market, if data is not available for any of the selected indicator that market will be filtered out from the next level analysis 15
16 Social Economic Owing to data unavailability, lack of information consistency and redundancy, few indicators are not considered for Level 1 analysis of the market attractiveness framework Level 1 Markets: Attractiveness Level 1 Indicators Political Political Stability Index GDP PPP (Per Capita) Inflation Rate Annual Disposable Income Unemployment Percentage Inequality in Income Currency Exchange Rate GDP PPP (Total) GINI Index Cost of Living Index GNP (Total) GNP (Per Capita) Income Quartiles Education Index Urban Population Urban Population (% Growth) Total Population Population (15-64 Years) Human Development Index Literacy Rate Youth Literacy Rate 1 Technology Internet Penetration Mobile Phone Subscription 1 Mobile Device Penetration 1 Others Proximity to South Africa No. of International Flights 1 No. of Metro Cities 1 Note: 1 Excluded based on low data availability 16
17 Social Economic Driven by the principle of simplicity : Indicators are further shortlisted using correlation analysis, removing redundant indicators reflecting similar trends Markets: Attractiveness Level 1 Indicators (Correlation) Political: Political Stability Index GDP PPP (Per Capita)* Inflation Rate Unemployment Percentage Inequality in Income Currency Exchange Rate Annual Disposable Income GDP PPP (Total) GINI Index Cost of Living Index Education Index Urban Population Urban Population (% Growth) Total Population Population (15-64 Years) Human Development Index Literacy Rate Technology: Internet Penetration Others: Proximity to South Africa Political Stability Index 1.00 GDP PPP per Capita Inflation Rate Unemployment Inequality in Income Currency Exchange Rate Annual Disposable Income GDP PPP Total GINI Index Cost of Living Index Education Index Urban Population Indicators are excluded on the basis of correlation between them. The indicators with correlation value of more than ±0.5 are excluded (subject to their relevance) * Indicator is used as a composite score of the current value, historic growth rate and future growth rate Urban Population Growth Total Population Population Years Human Development Index Literacy rate Internet Penetration
18 Relative weights of the different indicators are calculated by regressing them against dependent variables that demonstrate the anticipated impact from the level of analysis Economic Social Markets: Attractiveness Level 1 Indicators (Regression) Level 1 Dependent Variable Africa Land Markets Africa Air Markets Total Outbound Trips Overseas Markets Percentage of Long Haul Trips Political: Political Stability Index 10% 12% GDP PPP (Per Capita) 12% 17% Inflation Rate Unemployment Percentage Inequality in Income 3% 18% The weights are calculated by taking proportion of the coefficients of each variable in the regression equation Currency Exchange Rate Education Index 13% 9% 1 11% The weights are further readjusted to ensure that each variable is given relevant weight Urban Population 13% 22% Urban Population (% Growth) 8% 10% Technology: Internet Penetration 7% Others: Proximity to South Africa 2 10% 18
19 Similar to Level 1, a few indicators are not considered for Level 2 analysis due to data unavailability or redundancy South Africa Travel Global Travel Index Markets: Attractiveness Level 2 Indicators Level 2 Total Outbound Trips Total Domestic Trips Passport Index Tourist Outbound Expenditure Short Haul vs Long Haul Trips % Leisure Outbound Trips % Business Outbound Trips Outbound Air Passenger Carried No. of International Tickets Sold (Air/ Water/ Road) 1 No. of International Packages Sold 1 Index Holiday Arrivals (% of Total) MICE Arrivals (% of Total) Average Spend in South Africa Length of Stay No. of Expatriates Travelling to South Africa* Average Spend by Purpose The geographic positioning of a country has an impact on the outbound nature of the source markets; thus, to ensure relevance of outbound attractiveness of South Africa s source markets, travel behaviour related to South Africa has been considered Note: 1 Excluded based on low data availability *Total Arrivals to South Africa are estimated based on country of residence and not nationality (and includes information on expatriates travelling). This data is considered as a key component to estimate weights, and its impact has been accommodated while prioritising markets 19
20 For Level 2 analysis, a few redundant indicators are removed from the assessment by leveraging correlation analysis to streamline the list of indicators Global Travel Index South Africa Travel Index Markets: Attractiveness Level 2 Indicators (Correlation) Level 2 Total Outbound Trips* Total Domestic Trips Total Outbound Trips 1.00 Total Domestic Trips Passport Index Indicators are excluded on the basis of correlation between them. The indicators with correlation value of more than ±0.5 are excluded (subject to their relevance) Passport Index Tourist Outbound Expenditure Tourist Outbound Expenditure Short Haul vs Long Haul Trips * Indicator is used as a composite score of the current value, historic growth rate and future growth rate Short Haul vs Long Haul Trips % Business Outbound Trips % Leisure Outbound Trips Outbound Air Passenger Carried Holiday Arrivals (% of Total) MICE Arrivals (% of Total) Average Spend in South Africa Length of Stay % Business Outbound Trips % Leisure Outbound Trips Outbound Air Passenger Carried Holiday Arrivals (% of Total) MICE Arrivals (% of Total) Average Spend in South Africa Length of Stay
21 South Africa Travel Index Global Travel Index Global and South Africa-specific travel trends and behaviour are likely to impact South Africa s Market Share in the outbound market; hence, it is leveraged as the dependent variable Markets: Attractiveness Level 2 Indicators (Regression) Level 2 Africa Land Markets Africa Air Markets Overseas Markets Dependent Variable Market Share: Arrivals to South Africa by Total Trips Total Outbound Trips 21% 22% 9% Total Domestic Trips Passport Index 23% 1 9% 19% 20% 1 The weights are calculated by taking proportion of the coefficients of each variable in the regression equation Tourist Outbound Expenditure Short Haul vs Long Haul Trips 21% - - 8% 12% The weights are further readjusted to ensure that each variable is given relevant weight % Business Outbound Trips Holiday Arrivals (% of Total) 3% 9% MICE Arrivals (% of Total) 3% 7% 12% Average Spend in South Africa 17% Length of Stay 3% 8% 21
 and Level 2 indicators (Tourism View) have a different magnitude of impact on tourist arrivals to South Africa.")
22 The framework calculates the overall attractiveness score of source markets by combining scores from Level 1 and Level 2 analysis, after applying relevant weights Combined Score Markets: Attractiveness Combined Score Level 1 (Macroeconomic View) and Level 2 indicators (Tourism View) have a different magnitude of impact on tourist arrivals to South Africa. Therefore, the scores from these two analyses are appropriately cumulated to calculate the overall attractiveness of a market To consider the expected difference in impact of the two parameters, both scores are provided a weighted percentage that reflects their impact on arrivals to South Africa To calculate this ratio, the final scores of Level 1 and Level 2 are regressed against South Africa s market share of arrivals, where coefficients from the regression output determine the weights for level 1 and 2 scores Independent Variables Level 1 Score Level 2 Score Regression Analysis Dependent Variable South Africa s Market Share of Arrivals Weights 1 Level 1 Weights: 20% Level 2 Weights: 80% Market Attractiveness Score Level 1 Score Level 2 Score Note: 1 The weights have been calculated based on the relative contribution of each Level of analyses on the outcome of Level 2 across the different sets of markets, i.e., Africa Land, Africa Air and Overseas 22
23 Ability to win analysis evaluates markets based on South Africa s ability to operate and perform in these markets Markets: Attractiveness Ability to Win Ability to Win Analysis Relationship Better political relations and welcoming visa/travel policies act as an advantage for a destination market, increasing the number of tourists from different source markets Infrastructure Existing diplomatic and tourism specific operational centres in source markets provide an additional advantage of ease of operation Market Favourability Source markets with supporting business policies are easy to enter and conduct marketing operations Operational Connectivity Better air connectivity and proximity between source and destination market provide additional advantages of reduced travel time and ease of travel, thereby improving travel 23
24 Qualitative indicators in the ability to win analysis are quantified on appropriate scales to conduct a relative assessment Markets: Attractiveness Ability to Win Indicators Ability to Win Relationship and Infrastructure Political Scenario Visa Regulations by South Africa Current Partner Network South Africa s Presence Market Favourability Starting a Business Index Enforcing Contracts Index Trading Across Border Index Resolving Insolvency Index Operational Connectivity Airports with Direct Flight Proximity to South Africa South Africa s Brand Perception 1 Brand Recall Rating on Willingness to Visit Perception as Leisure Destination Likelihood to Recommend Rating as Affordable Destination Rating as Leisure Destination Other Language Constraints Note: 1 Excluded based on low data availability on all markets 24
25 Operational Connectivity Market Favourability Relationship and Infrastructure Indicators determining South Africa s ability to operate and perform in these markets are likely to influence the Arrivals to South Africa from the source market; thus, arrivals is leveraged as the dependent variable to determine the relative weights Markets: Attractiveness Ability to Win Indicators (Regression) Ability to Win Africa Land Markets Africa Air Markets Overseas Markets Dependent Variable Tourist Arrivals to South Africa Political Scenario Visa Regulations by South Africa Current Partner Network South Africa s Presence Starting a Business Index 17% 17% 17% 9% 7% 18% Leveraged Tourism Competitiveness Score as a proxy to Current Partner Network, as state of tourism economy in a market is a good reflection of trade in the market, and can determine the possibility of having good partnerships Trading Across Border Index Enforcing Contracts Index 9% Resolving Insolvency Index 1 10% Airports with Direct Flight 10% 21% 21% Proximity to South Africa 10% Others: Language Constraints 1 25
26 The framework calculates cost of tourist acquisition in each market, and factors in targets to be achieved and priority order of markets to distribute the marketing budget Marketing Investment Framework: Investments Targets Baseline vs. Activated Growth: Determine growth achieved with/without marketing investment across different markets Outcome: Growth rates to assess nominal growth across all source markets Markets Market Attractiveness Level 0: Level 1: Eliminate markets Rank markets on based on data macroeconomic availability strength/stability Level 2: Rank markets on outbound attractiveness Ability to Win Rank markets on South Africa s ability to win Outcome: Priority Priority Order order of of Markets Markets Allocate budget across the prioritised markets by leveraging baseline growth, setting activated growth, and applying the relative cost of acquisition Investments Assess arrivals (by specific purpose) from the existing portfolio markets Determine marketing spend (for the purpose) across the specific portfolio markets Outcome: Relative cost of acquisition of tourists across all markets 26
27 As SA Tourism has limited resources, it needs to prioritise the markets that should qualify in its investment set, i.e., which can be nurtured through in-market marketing. Other attractive opportunities need to be kept in the purview for future actions Classification of Markets across the Three Tiers: Investment Set Budgets are allocated across the markets, in reducing order of attractiveness, to conduct inmarket activity and achieve the desired growth Core Markets Strategic Markets Rest of the World Budgets exhaust here Opportunities that are attractive but cannot be invested in due to resource unavailability, have been categorised as strategic markets Remaining markets, which are not included in either the core set or the strategic set, will be dealt with minimum support Similarly, markets in the tiers of Other Arrivals (i.e., VFR) and Overall Arrivals are also classified as core and strategic 27

 markets predominantly contribute to VFR Two (2) markets have the highest share of traders/resellers Core Markets (in order of priority) USA Australia")
 Lesotho Swaziland Zimbabwe Botswana Mozambique Overall Arrivals (such as resellers and traders) Malawi Zambia Note: The categorisation across the three tiers is based on the prominent")
28 The allocated budget for SAT could only afford to service a total of 29 countries. These markets were categorised across the three tiers of the role pyramid, leading to a varied set of responsibility within each tier. Marketing Investment Framework: Core Markets Twenty nine (29) core markets have been shortlisted, for dedicated in-market marketing investments, of which: Twenty two (22) markets predominantly contribute to holiday and MICE arrivals Five (5) markets predominantly contribute to VFR Two (2) markets have the highest share of traders/resellers Core Markets (in order of priority) USA Australia Germany UK France Switzerland Netherlands Brazil Canada China Italy Tanzania Holiday and MICE Arrivals India Denmark Belgium Portugal Sweden Kenya Ireland Nigeria Namibia DRC Other Tourism Arrivals (such as VFR) Lesotho Swaziland Zimbabwe Botswana Mozambique Overall Arrivals (such as resellers and traders) Malawi Zambia Note: The categorisation across the three tiers is based on the prominent purpose of visit. For the Holiday + MICE tier, all Holiday and MICE arrivals have been considered, in addition to the other visits 28 related to business, which are not classified as business resale purposes. Other tourism arrivals are primarily based on VFR and personal shopping. Overall arrivals primarily comprise business resale
29 Based on the MIF the ROI provided sufficient ground for Treasury to allocate budget to cover the additional 14 Strategic markets. Marketing Investment Framework: Core + Strategic Selection Certain markets, ranked high in the investment framework, are not selected as Core markets based on value/volume contribution or available budgets. These markets are inspected for potential and ability to collaborate, and are selected to form the Strategic set 11+5 in Europe 3 +1 in Americas 3+4 in Asia Pacific + # Additive numbers in grey represent strategic markets Darker shade represents Core markets Lighter shade represents Strategic markets 12+4 in Africa 29

30 OPERATING STRATEGY: The Hub and Spoke Model HUB-AND-SPOKE OPERATING STRATEGY FOR INTERNATIONAL MARKETS United Kingdom Ireland Netherlands Belgium Norway Denmark Sweden Finland SA Tourism will configure itself in a Hub-and-Spoke manner, to ensure effective marketing initiatives, support to the value chain partners and effective delegation of authority and responsibility Canada United States *Domestic market as well as markets in South America, Central and Eastern Africa, and Africa Land will be operated from South Africa. Brazil Argentina France Portugal Spain Italy Nigeria Ghana DRC Angola Mozambique Malawi Zambia Zimbabwe Namibia Botswana Swaziland Lesotho Germany Switzerland Austria represents hub in the region Turkey UAE Uganda Tanzania Ethiopia Kenya South Africa* India Singapore North America Malaysia China Japan Australia New Zealand Northern Europe Eastern Africa South America United Kingdom Western Africa Australasia Central Europe Central Africa China Southern Europe Africa Land South East Asia There will be some markets such as those in South America that will be managed virtually via third-party marketing agencies, in a prudent manner 30
31 SA Tourism Strategy Framework for Engagement with the Provinces The SA Tourism strategy is underpinned by the 5-in-5 National Tourism Target which is jointly owned by SAT and the PTAs. This drives strategic alignment, proportionate resource allocation and coordination of marketing activity. Source Markets 5-in-5 National Tourism Target Drives Resource Allocation Distribution Markets Success Factors: Making 5-in-5 come alive and relevant in the provinces. APPs and Strategies need to link up Current 10m India Australia Netherlands United Kingdom Eastern Cape Western Cape Northern Cape Gauteng SAT and PTA become jointly accountable for the targets Effort, resources and funding deployed according to targets eg hostings, APPs etc Elevate targets into provincial performance (Premier + SOP) + 5m in 5yrs Germany United States China Africa Other DIRCO North West Limpopo Mpumalanga Free State KwaZulu-Natal Grading targets included PTA CVP: Strategy formulation and market execution Global and local market support and alignment Ownership of local activities and activations + local capacity and tourist activities - 4% of global target (eg) - Key source markets 31
32 THANK YOU 32
Market Allocation Platform Guiding investment decisions to maximize ROI. Tourism Economics
 Market Allocation Platform Guiding investment decisions to maximize ROI Tourism Economics core services Travel data and forecasts for 190 countries, 50 states, and 300 cities Policy analysis and recommendations
FOURTH MEETING OF THE OECD FORUM ON TAX ADMINISTRATION January Cape Town Communiqué 11 January 2008
 ORGANISATION FOR ECONOMIC CO-OPERATION AND DEVELOPMENT FOURTH MEETING OF THE OECD FORUM ON TAX ADMINISTRATION 10-11 January 2008 Cape Town Communiqué 11 January 2008 CENTRE FOR TAX POLICY AND ADMINISTRATION
AUTOMOTIVE COMPONENTS PRODUCT / MARKET MATRIX. AIEC P O Box Arcadia 0007 Tel: Fax: Website:
 AIEC P O Box 0 Arcadia 000 Tel: + 0 00 Fax: + 0 0 Website: www.aiecco.za AUTOMOTIVE COMPONENTS PRODUCT/MARKET MATRIX A diverse range of original components and aftermarket are manufactured in South Africa.
July 2014 Kagiso Asset Management Quarterly
 July 2014 Kagiso Asset Management Quarterly Global brewers: working harder for growth pg 1 Volkswagen s ambitious vision pg 5 The coal conundrum pg 13 www.kagisoam.com Hospital groups face tougher times
Travel Insurance and Assistance in the Asia-Pacific Region
 Travel Insurance and Assistance in the Asia-Pacific Region Report Prospectus October 2013 Web: www.finaccord.com. E-mail: info@finaccord.com 1 Prospectus contents Page What is the research? What methodology
Summary of key findings
 1 VAT/GST treatment of cross-border services: 2017 survey Supplies of e-services to consumers (B2C) (see footnote 1) Supplies of e-services to businesses (B2B) 1(a). Is a non-resident 1(b). If there is
Appendix. Table S1: Construct Validity Tests for StateHist
 Appendix Table S1: Construct Validity Tests for StateHist (5) (6) Roads Water Hospitals Doctors Mort5 LifeExp GDP/cap 60 4.24 6.72** 0.53* 0.67** 24.37** 6.97** (2.73) (1.59) (0.22) (0.09) (4.72) (0.85)
Fiscal Policy and Income Inequality
 Fiscal Policy and Income Inequality Francesca Bastagli Overseas Development Institute Taxation & Developing Countries (a PEAKS training course) 16 September 2013 Overview Trends in income inequality The
San Francisco Retiree Health Care Trust Fund Education Materials on Public Equity
 M E K E T A I N V E S T M E N T G R O U P 5796 ARMADA DRIVE SUITE 110 CARLSBAD CA 92008 760 795 3450 fax 760 795 3445 www.meketagroup.com The Global Equity Opportunity Set MSCI All Country World 1 Index
International Travel & Tourism Study (Published March 2005)
") International Travel & Tourism Study (Published March 2005) Roy Morgan International conducts surveys in the US,, Australia, New Zealand and Indonesia on a continuous basis. Respondents are asked about
International Travel & Tourism Study (Published March 2005) Roy Morgan International conducts surveys in the US,, Australia, New Zealand and Indonesia on a continuous basis. Respondents are asked about
Financial wealth of private households worldwide
 Economic Research Financial wealth of private households worldwide Munich, October 217 Recovery in turbulent times Assets and liabilities of private households worldwide in EUR trillion and annualrate
Southern Africa regional superpower in the making. Dr Roelof Botha
 Southern Africa regional superpower in the making Dr Roelof Botha Health sector focus Composition of Gauteng health budget FY 01 by programme (total R5. billion) R b Central Hospitals: 6.5 Facilities Management:.
World s Best Investment Bank Awards 2018
 Global Finance will publish its selections for the 19th Annual World s Best Investment Banks in the April 2018 issue. Winners will be honored at an awards ceremony in New York City in March, and all award
Global Monitoring Report: Findings on Progress since Monterrey
 Global Monitoring Report: Findings on Progress since Monterrey Governance, institutions, and capacity A number of developing regions have made considerable progress toward regulatory reform, but Sub-Saharan
Pension Payments Made To Foreign Bank Accounts
 West Midlands Pension Fund West Midlands Pension Fund Pension Payments Made To Foreign Bank Accounts A Guide to Worldlink Payment Services August 2012 What does WorldLink Payment Services offer? WorldLink
Contents. 1. Working with Barclays 2. Bespoke client solutions 3. Your Barclays team 4. Appendix 5. Client case studies. 2 Offshore Corporate
 Offshore Corporate Contents 1. Working with Barclays 2. Bespoke client solutions 3. Your Barclays team 4. Appendix 5. Client case studies 2 Offshore Corporate Working with Barclays 3 Offshore Corporate
Trends, like horses, are easier to ride in the direction they are going
 2050 Hindsight. Trends, like horses, are easier to ride in the direction they are going - John Naisbitt, Megatrends, 1982 CFA Society San Diego Lawrence Speidell Chief Investment Officer, CEO Frontier
Actuarial Supply & Demand. By i.e. muhanna. i.e. muhanna Page 1 of
 By i.e. muhanna i.e. muhanna Page 1 of 8 040506 Additional Perspectives Measuring actuarial supply and demand in terms of GDP is indeed a valid basis for setting the actuarial density of a country and
Travel Insurance and Assistance
 Travel Insurance and Assistance Worldwide research covering over 40 countries Series Prospectus Finaccord Web: www.finaccord.com. E-mail: info@finaccord.com 1 Prospectus contents Page What is the research?
WORKING DRAFT Last Modified 4/10/2012 3:27:03 PM Central Standard Time Printed. Long-term capitalism. Icare Santiago presentation April 2012
 WORKING DRAFT Last Modified 4/10/2012 3:27:03 PM Central Standard Time Printed Long-term capitalism Icare Santiago presentation April 2012 Five mega-trends reshaping the global economy The great rebalancing
SHARE IN OUR FUTURE AN ADVENTURE IN EMPLOYEE STOCK OWNERSHIP DEBBI MARCUS, UNILEVER
 SHARE IN OUR FUTURE AN ADVENTURE IN EMPLOYEE STOCK OWNERSHIP DEBBI MARCUS, UNILEVER DEBBI.MARCUS@UNILEVER.COM RUTGERS SCHOOL OF MANAGEMENT AND LABOR RELATIONS NJ/NY CENTER FOR EMPLOYEE OWNERSHIP AGENDA
CNH and China QFII market: Opportunities and Challenges A Fund Custodian and Administrator's Perspective"
 CNH and China QFII market: Opportunities and Challenges A Fund Custodian and Administrator's Perspective" Eric Chow HSBC Securities Services June 2011 2 Agenda About HSBC Securities Services (HSS) Introducing
Travel Insurance and Assistance
 Travel Insurance and Assistance Worldwide research covering over 40 countries Series Prospectus Finaccord 1 Prospectus contents Page What is the research? Which countries are covered What methodology has
Second Quarter Trading Update 9 July 2010
 Second Quarter Trading Update 9 July 2010 Michael Page International Second Quarter Trading Update 2010 2 Group gross profit Constant Group gross profit m m Reported exchange 2010 vs 2009 111.5 83.8 +33.1%
Argentina Bahamas Barbados Bermuda Bolivia Brazil British Virgin Islands Canada Cayman Islands Chile
 Americas Argentina (Banking and finance; Capital markets: Debt; Capital markets: Equity; M&A; Project Bahamas (Financial and corporate) Barbados (Financial and corporate) Bermuda (Financial and corporate)
Air Passenger Forecasts
 www.iata.org/pax-forecast Example report: numbers are for illustration purposes only Global report Page Table of Contents 1 Top Markets 2 Top Domestic Markets 3 Top International Country Pairs 4 Largest
Travel Insurance and Assistance
 Travel Insurance and Assistance Worldwide research covering over 40 countries Series Prospectus Finaccord Ltd., 2016 Web: www.finaccord.com. E-mail: info@finaccord.com 1 Prospectus contents Page What is
Impact on Education and Healthcare Sector Revenue from a 10% Increase in Broadband Penetration in India
 Presentation for GSMA Impact on Education and Healthcare Sector Revenue from a 10% Increase in Broadband Penetration in India 20 May 2011 Ref: Contents 2 Approach and Results Summary Overview of Education
SANGAM GLOBAL PHARMACEUTICAL & REGULATORY CONSULTANCY
 SANGAM GLOBAL PHARMACEUTICAL & REGULATORY CONSULTANCY Regulatory Affairs Worldwide An ISO 9001:2015 Certified Company Welcome to Sangam Global Pharmaceutical & Regulatory Consultancy (SGPRC) established
Employer Social Charges 13/10/2017 EURO/USD USD 1.20 JPY/USD 0.01 AUD/USD USD 0.73 GBP/USD Charges patronales obligatoires %
 Charges 13/10/2017 Salaire Brut Mensuel Charges patronales obligatoires % Charges patronales totales Pays Albania $4,500.00 16.70% $218 Algeria $4,500.00 28.00% $1,260 Angola $4,500.00 20.7500% $933.75
Hartford Multifactor Index Methodologies
 Hartford Multifactor Index Methodologies Hartford Risk-Optimized Multifactor Developed Markets (ex-us) Index Hartford Risk-Optimized Multifactor US Equity Index Hartford Risk-Optimized Multifactor Emerging
FRANKLIN TEMPLETON INVESTMENTS. Franklin Resources, Inc. Bank of America Merrill Lynch Banking and Financial Services Conference November 18, 2010
 Franklin Resources, Inc. Bank of America Merrill Lynch Banking and Financial Services Conference November 18, 2010 Forward-Looking Statements The financial results in this presentation are preliminary.
CGMA global economic forecast
 CGMA global economic forecast -insights from management accountants 2Q, 2012 Detailed survey results with regional appendices Appendix - Regional breakdown Asia CGMA global economic forecast -2Q 2012 Asia
CARD FRAUD BOOKLET Protect your card and information at all times PAGE: 1 // 42
 PAGE: 1 // 42 www.sabric.co.za CARD FRAUD BOOKLET Protect your card and information at all times Table of Contents Executive Summary 05 21 Card Fraud in the UK Qualification of Information Payments Association
the sanlam group impact of data on strategy: the sanlam emerging markets africa growth story august 2014
 impact of data on strategy: the sanlam emerging markets africa growth story august 2014 Insurance Financial Planning Retirement Investments Wealth agenda Brief overview of strategy and strategic positioning
Can low-income countries afford social protection?
 Can low-income countries afford social protection? Designing and Implementing Social Transfer Programmes 22 July - 4 August 2007 Cape Town, South Africa Krzysztof Hagemejer Social Security Department,,
Investor Presentation Q3 Results. 12 November 2014
 Investor Presentation Q3 Results 12 November 2014 1 Forward-looking statements This presentation contains forward-looking statements, including, but not limited to, the statements and expectations contained
Boost competitiveness, attract foreign capital. Italy's Plan for new Investment
 Boost competitiveness, attract foreign capital Italy's Plan for new Investment intro Economic recovery presents new opportunities to contribute to the country's growth. But investment needs fertile terrain
Leading global banking practices Emilio Pera, May 2013
 Leading global banking practices Emilio Pera, May 203!@# Agenda Banking in Africa 2 Global Banking Outlook 3 Questions/discussion 2 Africa Attractiveness Getting down to business!@# How Infrastructure
Annuities: a private solution to longevity risk
 Annuities: a private solution to longevity risk Product & Knowledge Fair 2007 Rüschlikon 30 March 2007 Thomas Hess Head of Economic Research & Consulting Veronica Scotti Client Solutions Need for private
PORTUGAL E O CAMINHO PARA O FUTURO: A BANCA E O SEU PAPEL
 XV CONFERÊNCIA A CRISE EUROPEIA E AS REFORMAS NECESSÁRIAS PORTUGAL E O CAMINHO PARA O FUTURO: A BANCA E O SEU PAPEL FERNANDO FARIA DE OLIVEIRA AGENDA European Context: From the Actual Crisis to Growth
The impact of broadband on the economy: research to date and policy issues
 The impact of broadband on the economy: research to date and policy issues Dr. Raúl L. Katz, Adjunct Professor, Division of Finance and Economics, and Director, Business Strategy Research, Columbia Institute
Transfer Pricing in Botswana and Southern Africa. Christian Wiesener KPMG Global Transfer Pricing Services 26 June 2014
 Transfer Pricing in Botswana and Southern Africa Christian Wiesener KPMG Global Transfer Pricing Services 26 June 2014 Agenda Introduction to Transfer Pricing Transfer Pricing Example Africa Transfer Pricing
Enhancing Productivity. Philippe Aghion
 Enhancing Productivity Philippe Aghion Basic questions How to enhance productivity growth in advanced and in emerging market economies? Technological waves and differences in their diffusion patterns across
WHY UHY? The network for doing business
 The network for doing business the network for doing business UHY has over 6,800 professionals to choose from trusted advisors and consultants operating in more than 250 business centres, based in 81 countries
Methodology Calculating the insurance gap
 Methodology Calculating the insurance gap Insurance penetration Methodology 3 Insurance Insurance Penetration Rank Rank Rank penetration penetration difference 2018 2012 change 2018 report 2012 report
2012 Canazei Winter Workshop on Inequality
 2012 Canazei Winter Workshop on Inequality Measuring the Global Distribution of Wealth Jim Davies 11 January 2012 Collaborators Susanna Sandström, Tony Shorrocks, Ed Wolff The world distribution of household
Global Business Barometer April 2008
 Global Business Barometer April 2008 The Global Business Barometer is a quarterly business-confidence index, conducted for The Economist by the Economist Intelligence Unit What are your expectations of
 3. Bloomberg European Local Currency Sovereign Bloomberg Belgium Sovereign Bond Index 1 to 5 Year Bloomberg Bulgaria Local Sovereign Index Bloomberg Czech Rep Local Sovereign Index Bloomberg Eurozone
Distribution Channels for Travel Insurance and Assistance: Finding the Right Mix for European Markets
 Distribution Channels for Travel Insurance and Assistance: Finding the Right Mix for European Markets Presentation at the Uniglobal Travel Insurance Forum Prague, December 5 th 6 th 2013 Finaccord Ltd.,
SANLAM EMERGING MARKETS INVESTOR DAYS
 SANLAM EMERGING MARKETS INVESTOR DAYS 16 th & 17 th October 2018 Agenda Our Vision Our Pan-African opportunity The Saham rationale How we will deliver on the Pan-African opportunity The SEM business model
BDO USA, LLP. International Assignment Issues in Emerging Markets/Developing Countries (China, Latin America, Africa)
") BDO USA, LLP International Assignment Issues in Emerging Markets/Developing Countries (China, Latin America, Africa) Ken Guilfoyle, Senior Director Expatriate Tax Services, BDO USA, LLP September 23, 2014
BDO USA, LLP International Assignment Issues in Emerging Markets/Developing Countries (China, Latin America, Africa) Ken Guilfoyle, Senior Director Expatriate Tax Services, BDO USA, LLP September 23, 2014
The Impact of Broadband on the Economy: Research to Date and Policy Issues
 Committed to Connecting the World The Impact of Broadband on the Economy: Research to Date and Policy Issues Dr. Raúl L. Katz, Adjunct Professor, Division of Finance and Economics, and Director, Business
Quarterly Investment Update First Quarter 2017
 Quarterly Investment Update First Quarter 2017 Market Update: A Quarter in Review March 31, 2017 CANADIAN STOCKS INTERNATIONAL STOCKS Large Cap Small Cap Growth Value Large Cap Small Cap Growth Value Emerging
Corrigendum. OECD Pensions Outlook 2012 DOI: ISBN (print) ISBN (PDF) OECD 2012
 ISBN (PDF) OECD 2012") OECD Pensions Outlook 2012 DOI: http://dx.doi.org/9789264169401-en ISBN 978-92-64-16939-5 (print) ISBN 978-92-64-16940-1 (PDF) OECD 2012 Corrigendum Page 21: Figure 1.1. Average annual real net investment
OECD Pensions Outlook 2012 DOI: http://dx.doi.org/9789264169401-en ISBN 978-92-64-16939-5 (print) ISBN 978-92-64-16940-1 (PDF) OECD 2012 Corrigendum Page 21: Figure 1.1. Average annual real net investment
Think Global, think Portugal
 Think Global, think Portugal 2008 CONTENTS www.portugalglobal.pt 3 About aicep Portugal Global Structure and Services Recent Awards 4 6 About Portugal Portugal Offers Investors Access to Markets Investment
Global Consumer Confidence
 Global Consumer Confidence The Conference Board Global Consumer Confidence Survey is conducted in collaboration with Nielsen 4TH QUARTER 2017 RESULTS CONTENTS Global Highlights Asia-Pacific Africa and
26 MAY Boustead Singapore Limited / Boustead Projects Limited Joint FY2015 Financial Results Presentation
 26 MAY 2015 Boustead Singapore Limited / Boustead Projects Limited Joint FY2015 Financial Results Presentation Disclaimer This presentation contains certain statements that are not statements of historical
Developing Housing Finance Systems
 Developing Housing Finance Systems Veronica Cacdac Warnock IIMB-IMF Conference on Housing Markets, Financial Stability and Growth December 11, 2014 Based on Warnock V and Warnock F (2012). Developing Housing
Trade and Development Board Sixty-first session. Geneva, September 2014
 UNITED NATIONS CONFERENCE ON TRADE AND DEVELOPMENT Trade and Development Board Sixty-first session Geneva, 15 26 September 2014 Item 3: High-level segment Tackling inequality through trade and development:
Tunis, Tunisia 17 June 2005
 Tunis, Tunisia 17 June 2005 United Nations Department of Economic and Social Affairs United Nations Development Programme UNDP Africa Presented by John M. Kauzya The Africa Governance Inventory (AGI) Portal
South African Tourism ANNUAL PERFOMANCE PLAN FINAL 2016/17
 South African Tourism ANNUAL PERFOMANCE PLAN FINAL 2016/17 FOREWORD 2 FOREWORD BY THE EXECUTIVE AUTHORITY Tourism has been identified as one of the sectors that can contribute to employment creation. As
Focus on: Hong Kong. International Business Report 2011 Economy focus series
 Focus on: Hong Kong International Business Report 11 Economy focus series The recovery The economy rebounded strongly in, posting growth of 6.8 per cent as recovering global demand boosted exports. Prospects
Improving the Investment Climate in Sub-Saharan Africa
 REALIZING THE POTENTIAL FOR PROFITABLE INVESTMENT IN AFRICA High-Level Seminar organized by the IMF Institute and the Joint Africa Institute TUNIS,TUNISIA,FEBRUARY28 MARCH1,2006 Improving the Investment
SARS OVERVIEW. Presentation to the Select Committee on Finance
 SARS OVERVIEW Presentation to the Select Committee on Finance SARS mandate In terms of the SARS Act (No.34 of 1997), SARS s mandate is to efficiently and effectively - Collect all revenue Ensure enforcement
Institutions, Capital Flight and the Resource Curse. Ragnar Torvik Department of Economics Norwegian University of Science and Technology
 Institutions, Capital Flight and the Resource Curse Ragnar Torvik Department of Economics Norwegian University of Science and Technology The resource curse Wave 1: Case studies, Gelb (1988) The resource
An Unparalleled Economic Opportunity
 An Unparalleled Economic Opportunity Tourism is the world s 4th fastest growing industry 1 billion international travellers $1 trillion in revenues 4% growth globally per year Tourism s footprint in Canada
I N V E S TO R P R E S E N TAT I O N. A U G U S T, elementcorp.com
 I N V E S TO R P R E S E N TAT I O N A U G U S T, 2 0 1 4 Certain information in this presentation is forward-looking and related to anticipated financial performance, events and strategies. When used
Working Paper Series
 Working Paper Series North-South Business Cycles Michael A. Kouparitsas Working Papers Series Research Department WP-96-9 Federal Reserve Bank of Chicago Æ 4 2 5 6 f S " w 3j S 3wS 'f 2 r rw k 3w 3k
Capital Access Index 2006 Gauging Entrepreneurial Access to Capital
 Capital Access Index 2006 Gauging Entrepreneurial Access to Capital Max = 10 9.0 Hong Kong 8.5 8.0 7.5 7.0 6.5 6.0 5.5 5.0 4.5 40 Source: Milken Institute United Kingdom U.S. India China Brazil Russia
TRENDS AND MARKERS Signatories to the United Nations Convention against Transnational Organised Crime
 A F R I C A WA T C H TRENDS AND MARKERS Signatories to the United Nations Convention against Transnational Organised Crime Afghanistan Albania Algeria Andorra Angola Antigua and Barbuda Argentina Armenia
Travel Metrics: Consumer Approaches to Travel Insurance and Assistance in Selected Global Markets
 Travel Metrics: Consumer Approaches to Travel Insurance and Assistance in Selected Global Markets Series Prospectus November 2017 1 Prospectus contents Page What is the research? What is the research?
Global Construction 2030 Expo EDIFICA 2017 Santiago Chile. 4-6 October 2017
 Global Construction 2030 Expo EDIFICA 2017 Santiago Chile 4-6 October 2017 Graham Robinson Global Construction Perspectives Global Construction 2030 is the fourth in a series of global studies of the construction
Internet Appendix: Government Debt and Corporate Leverage: International Evidence
 Internet Appendix: Government Debt and Corporate Leverage: International Evidence Irem Demirci, Jennifer Huang, and Clemens Sialm September 3, 2018 1 Table A1: Variable Definitions This table details the
The macroeconomic effects of a carbon tax in the Netherlands Íde Kearney, 13 th September 2018.
 The macroeconomic effects of a carbon tax in the Netherlands Íde Kearney, th September 08. This note reports estimates of the economic impact of introducing a carbon tax of 50 per ton of CO in the Netherlands.
Tourism Forecasting Applied to Destination
 Tourism Forecasting Applied to Destination Strategy ETC-UNWTO Forecasting Seminar Vienna, 12 September, 2008 Prepared by: Tourism Economics 121, St Aldates, Oxford, OX1 1HB UK 303 W Lancaster Ave. Wayne
Invesco Indexing Investable Universe Methodology October 2017
 Invesco Indexing Investable Universe Methodology October 2017 1 Invesco Indexing Investable Universe Methodology Table of Contents Introduction 3 General Approach 3 Country Selection 4 Region Classification
Best Treasury & Cash Management Providers 2017
 Page 1 of 5 In March 2017, Global Finance will publish its selections for the Seventeenth Annual World s Best Treasury & Cash Management Providers. Global Finance will select the best overall global cash
Challenges for Today s Short-Term Assignments
 Point of view Challenges for Today s Short-Term Assignments Consulting. Outsourcing. Investments. Why is there an increasing trend for short-term assignments? What are the current challenges? How do companies
The political-economy of power sector reform in South Africa. Prof Anton Eberhard
 The political-economy of power sector reform in South Africa Prof Anton Eberhard Graduate School of Business University of Cape Town & Board of the National Electricity Regulator Overview istorical development
INTERIM RESULTS PRESENTATION FOR THE SIX MONTHS ENDED 31 AUGUST 2017
 INTERIM RESULTS PRESENTATION FOR THE SIX MONTHS ENDED 31 AUGUST 2017 AGENDA BUSINESS TRENDS AND STRATEGY Zak Calisto SEGMENTAL PERFORMANCE Zak Calisto FINANCIAL REVIEW John Edmeston OUTLOOK AND QUESTIONS
UPDATE ON FISCAL STIMULUS AND FINANCIAL SECTOR MEASURES. April 26, 2009
 UPDATE ON FISCAL STIMULUS AND FINANCIAL SECTOR MEASURES April 26, 2009 This note provides an update of information in the paper, The State of Public Finances: Outlook and Medium-Term Policies After the
Global Select International Select International Select Hedged Emerging Market Select
 International Exchange Traded Fund (ETF) Managed Strategies ETFs provide investors a liquid, transparent, and low-cost avenue to equities around the world. Our research has shown that individual country
Mauritius as a base for Regional Headquarters Companies
 as a base for Regional Headquarters Companies 1 Scope of the presentation Regional business schemes Regional Headquarters Scheme Regional Development Scheme Business opportunities in the Region Other headquarters
NOTE SFIC opinion on the Multi-Annual Roadmaps for international cooperation
 EUROPEAN UNION EUROPEAN RESEARCH AREA AND INNOVATION COMMITTEE Strategic Forum for International S&T Cooperation Secretariat Brussels, 10 June 2014 (OR. en) ERAC-SFIC 1359/14 NOTE Subject: SFIC opinion
RUSSIAN ECONOMIC OUTLOOK AND MONETARY POLICY CHALLENGES RUSSIAN ECONOMIC OUTLOOK AND MONETARY POLICY CHALLENGES. Bank of Russia.
 RUSSIAN ECONOMIC OUTLOOK AND MONETARY POLICY CHALLENGES Bank of Russia July 218 < -1% -1-9% -9-8% -8-7% -7-6% -6-5% -5-4% -4-3% -3-2% -2-1% -1 % 1% 1 2% 2 3% 3 4% 4 5% 5 6% 6 7% 7 8% 8 9% 9 1% 1 11% 11
2012 Interim Results - Presentation ZURICH, 23 AUGUST 2012
 2012 Interim Results - Presentation ZURICH, 23 AUGUST 2012 Agenda - Highlights - Financials - Outlook 2 Strong position in Asia leads to improved operating results for HY 2012 Turnover +26.7% Negative
Emerging Markets Outlook
 Mark Mobius, Ph.D. Executive Chairman Templeton Emerging Markets Group Emerging Markets Outlook Dealer Use Only / Not for Distribution to the Public Agenda Performance Emerging Markets Equities: Demand
The Johns Hopkins Center for Civil Society Studies UN NONPROFIT HANDBOOK PROJECT. Lester M. Salamon
 UN NONPROFIT HANDBOOK PROJECT Lester M. Salamon The Johns Hopkins Comparative Nonprofit Sector Project THE GLOBAL ASSOCIATIONAL REVOLUTION Forprofit Sector Civil Society Sector Government Sector TREATMENT
DOING BUSINESS Augusto Lopez-Claros, Director Global Indicators Group
 DOING BUSINESS 2016 Augusto Lopez-Claros, Director Global Indicators Group November 19, 2015 What does Doing Business measure? Doing Business indicators: Focus on regulations relevant to the life cycle
Corporate Governance and Investment Performance: An International Comparison. B. Burçin Yurtoglu University of Vienna Department of Economics
 Corporate Governance and Investment Performance: An International Comparison B. Burçin Yurtoglu University of Vienna Department of Economics 1 Joint Research with Klaus Gugler and Dennis Mueller http://homepage.univie.ac.at/besim.yurtoglu/unece/unece.htm
CGMA global economic forecast
 CGMA global economic forecast -insights from management accountants 2Q, 2012 Detailed survey results with regional appendices Highlights CGMA global economic forecast -2Q 2012 Highlights combined results,
STOXX EMERGING MARKETS INDICES. UNDERSTANDA RULES-BA EMERGING MARK TRANSPARENT SIMPLE
 STOXX Limited STOXX EMERGING MARKETS INDICES. EMERGING MARK RULES-BA TRANSPARENT UNDERSTANDA SIMPLE MARKET CLASSIF INTRODUCTION. Many investors are seeking to embrace emerging market investments, because
Corporate and Place Reputation
 Corporate and Place Reputation ITB Berlin Convention, March 8th 2013 Shahar Silbershatz, Director ssilbershatz@reputationinstitute.com Who we are Knowledge Center Advice Group Publications Conferences
Overview of FSC-certified forests January January Maps of extend of FSC-certified forest globally and country specific
 Overview of FSCcertified forests January 2009 Maps of extend of FSCcertified forest globally and country specific Global certified forest area: 120.052.350 ha ( = 4,3%) + 11% Hectare FSCcertified forest
YUM! Brands, Inc. Historical Financial Summary. Second Quarter, 2017
 YUM! Brands, Inc. Historical Financial Summary Second Quarter, 2017 YUM! Brands, Inc. Consolidated Statements of Income (in millions, except per share amounts) 2017 2016 2015 YTD Q3 Q4 FY FY Revenues Company
Is Economic Growth Good for Investors? Jay R. Ritter University of Florida
 Is Economic Growth Good for Investors? Jay R. Ritter University of Florida What (modern day) country had the highest per capita income, in the following years? 1500 1650 1800 1870 1900 1920 It is widely
bangkok office market
 research Q2 2010 bangkok office market Quarterly highlights Average vacancy rates increased from Q1 2010 by 2.18%, up to 12.64%. Rentals held firm in Q2, with minor increases reported in Grade C sector.
Turkey: Recent Developments and Future Prospects. ISBANK Economic Research Division October 2018
 Turkey: Recent Developments and Future Prospects ISBANK Economic Research Division October 2018 Macroeconomic Outlook Strong Economic Growth Cycle GDP of 851 bn USD (2017), 10.6k USD (2017) per capita
SUMMARY OF RESULTS PUBLIC CONSULTATION ON FINANCIAL AND INSURANCE
 EUROPEAN COMMISSION DIRECTORATE-GENERAL TAXATION AND CUSTOMS UNION Indirect Taxation and Tax administration VAT and other turnover taxes SUMMARY OF RESULTS PUBLIC CONSULTATION ON FINANCIAL AND INSURANCE