Optimism, Attribution and Corporate Investment Policy. Richard Walton
|
|
|
- Carol King
- 6 years ago
- Views:
Transcription
1 Optimism, Attribution and Corporate Investment Policy by Richard Walton A Dissertation Presented in Partial Fulfillment of the Requirements for the Degree Doctor of Philosophy Approved April 2016 by the Graduate Supervisory Committee: Thomas Bates, Chair Ilona Babenko Laura Lindsey ARIZONA STATE UNIVERSITY May 2016
2 ABSTRACT Chief Executive Officers (CEOs) whose observed personal option-holding patterns are not consistent with theoretical predictions are variously described as overconfident or optimistic. Existing literature demonstrates that the investment and financing decisions of such CEOs differ from those of CEOs who do not exhibit such behavior and interprets the investment and financing decisions by overconfident or optimistic CEOs as inferior. This paper argues that it may be rational to exhibit behavior interpreted as optimistic and that the determinants of a CEO s perceived optimism are important. Further, this paper shows that CEOs whose apparent optimism results from above average industry-adjusted CEO performance in prior years make investment and financing decisions which are actually similar, and sometimes superior to, those of unbiased CEOs. i
3 TABLE OF CONTENTS Page LIST OF TABLES... iii CHAPTER 1 INTRODUCTION DATA Variable Construction Measuring Optimism PERMANENCE OF OPTIMISM DETERMINANTS OF CHANGE IN ANNUAL OPTIMISM Alternative Explanations GROUPING OPTIMISTIC CEOS OPTIMISM AND INVESTMENT SENSITIVITY TO CASH FLOW OPTIMISM AND M&A ACTIVITY OPTIMISM AND PAYOUT POLICY Optimism and Dividend Payout Optimism and Total Payout CONCLUSIONS REFERENCES ii
4 LIST OF TABLES Table Page 1. Distribution of Frequency of CEO-Year Observation ( ) Where ITM of Unexercised, Exercisable Options >=67% (a). Self-Attribution Differential Impact of Positive and Negative Returns on Optimism. Conditional Logit Regression of Factors Influencing Probability of CEO Being Optimistic (b). Self-Attribution Differential Impact of Positive and Negative Returns on Optimism. OLS Regression of Factors Influencing ITM of Unexercised, Exercisable Options Summary Statistics CEO Optimism and Corporate Investment Probability of Takeover Attempt Cumulative Abnormal Returns and Optimism CEO Optimism and Dividend Policy CEO Optimism and Total Payout Policy iii
5 CHAPTER 1 INTRODUCTION Since the articulation of the principal-agent problem it has been widely accepted that firms are not necessarily run in the best interests of their owners. The disproportionate impact of the Chief Executive Officer (CEO) on both the behavior and the performance of the firm has prompted research in corporate finance to better understand why CEOs behave as they do. Agency problems occur when the interests of the CEO and the shareholders diverge and the CEO can intentionally follow policies that further his own interests at the expense of those of the shareholders. A different line of research considers how a CEO s personal bias may cause him to unintentionally act against the best interests of the shareholders even in the absence of any deliberate attempt to further his own advantage. Hirshleifer (2001) presents an overview of biases which can affect investment. Two such biases in the literature are optimism about likely outcomes and a CEO s overconfidence in the precision of his information. The literature is however not always consistent in its use of the terms overconfidence and optimism. This paper follows the traditional approach of Hackbarth (2008), which defines optimistic agents as predicting that favorable future events are more likely than they actually are and overconfident agents as believing that they have more precise knowledge about future events than they actually have. In short, optimists overestimate expected values, and overconfident agents underestimate risk. There is a broad and growing literature in which the personal option-holding patterns of CEOs are used to identify CEOs with an upward bias in the assessment of future outcomes (Malmendier & Tate (2005a)). The bias is labelled overconfidence, by authors 1
6 who wish to distinguish a CEO s tendency to overestimate his personal attributes and outcomes from a tendency to overestimate exogenous outcomes, and as optimism, by authors who wish to distinguish it from the tendency to underestimate risk. The bias is generally claimed to be present when a CEO fails to exercise exercisable options until the final year of the options or when a CEO fails to exercise exercisable options exceeding a threshold in-the-moneyness (ITM). Such behavior has been shown to be associated with a variety of negative behaviors. Malmendier & Tate (2005a, 2008) find that a biased CEO s reluctance to raise external financing makes his investment decisions more sensitive to the availability of internal funds. In addition, CEOs subject to this bias engage in more mergers and acquisitions and that the market reacts less favorably to the announcement of their acquisitions. Deshmukh, Goel & Howe (2013) finds that a biased CEO s preference for internal financing causes the CEO to pay lower dividends but the dividend policy deviates less when the firm has growth opportunities. However, there are theoretical and empirical findings demonstrating positive consequences of CEO optimism. Hirshleifer, Low & Teoh (2012) shows biased CEOs in innovative industries are more successful at investing in innovation. Campbell, Gallmeyer, Johnson, Rutherford & Stanley (2011) claims there is an optimal level of CEO optimism and finds that CEOs with relatively low or high optimism face a higher probability of forced turnover than moderately optimistic CEOs face. While these behavioral distortions have been identified and well documented, it is less well known how CEOs become subject to the optimism bias and whether inter-temporal variation in the exhibition of this bias can provide information about its causes and the resultant quality of a CEO s decisions. 2
7 This paper considers whether seemingly optimistic behaviors might sometimes be an unbiased response to short-term conditions and therefore examines the annual variation in a CEO s measured optimism rather than optimism as a permanent characteristic. Information on CEOs option-holdings found in Compustat s Execucomp database is used to estimate the average in-the-moneyness of unexercised exercisable options as a measure of a CEO s optimism. Concentrating on short term variation in optimism allows the consideration of the determinants of changes in optimism and the classification of optimistic CEOs into distinct groups. The existing literature suggests that, as a whole, CEOs who exhibit optimistic option-holding behaviors are likely to implement suboptimal and value-destroying investment and financing decisions. Van den Steen (2004) shows how choice-driven overoptimism can result from rational behavior under uncertainty, but the CEO s choice is still ex post incorrect, in that it was the result of inaccurate expectations. Optimistic option-holding behaviors essentially identify CEOs whose expectations of the future value of the firm are more positive than those of the market. This can be the result of bias or a response to superior information concerning the prospects of the firm or the CEO s abilities. This paper finds that CEOs exhibiting both optimistic option-holding behaviors and superior prior industry-adjusted performance actually implement investment and financing decisions which are comparable to or better than those of non-optimistic CEOs, supporting the hypothesis that, for a significant proportion of CEOs, such behavior is most likely a rational response to temporary conditions rather than the unfortunate consequence of bias. Related literature that uses the observed option-holding policies of CEOs in order to identify optimistic CEOs are generally interested in a permanent rather than a 3
8 transitory effect (Malmendier & Tate (2005a)). A CEO is typically classified as exhibiting an optimistic bias only if he displays qualifying behaviors at least twice and, if so, from the first such display until the end of the sample period. In Malmendier, Tate and Yan (2010), the effects of a bias to overestimate future cash-flows are discussed and treated in the same way as the effects of permanent impacts on a CEO s personal history, such as growing up during the Great Depression or having a military background. In Campbell et al. (2011), optimism is treated as semi-permanent but only to the extent that a CEO s optimism classification may change if the CEO exhibits the opposite bias later in the sample period. This paper finds that CEOs in the period who would be classified as exhibiting a permanent bias using the Holder67 measure described in Malmendier & Tate (2005a) actually exhibit option-holding behaviors associated with this bias only infrequently, with 58% of such CEOs exhibiting such behavior less than 67% of the time. Despite the high degree of annual variation in associated option-holding behaviors, the existing literature has focused exclusively on the effects of long term bias. This paper investigates the causes and consequences of short term variations in CEO optimism and demonstrates some important differences between the effects of short term optimism and more permanent optimism. Next, having established that CEO optimism does indeed vary over the short term, this paper investigates the factors which lead to annual changes in optimism and finds some support for the self-attribution hypothesis that CEOs attribute good performance to their own skills and poor performance to bad luck. CEO optimism increases more following good performance than it decreases following poor performance. This is not the expected result if optimism were purely the mechanical consequence of equity returns. This paper 4
9 classifies CEOs exhibiting optimistic option-holding behavior according to the CEO s most recent performance, where CEO performance is measured by the equity returns of the CEO s firm relative to industry returns. CEOs whose option-holding behaviors identify them as optimists and whose optimism increases following superior CEO performance are classified as Justified Optimists. This nomenclature is chosen as, while a Justified Optimist s option-holding behavior identifies him as optimistic, this paper hypotheses that his expectation that firm value will increase is the result of his private information rather than a bias. Optimists whose optimism increases despite following inferior CEO performance are classified as Unjustified Optimists. This paper chooses to classify optimism as justified based on the CEO s ex ante rationale for his increasing optimism rather than the ex post realized outcomes of his option-holding decisions as the paper is interested in those CEOs who had a common rational justification for their optimism rather than those whose optimism happened to be profitable. The remainder of the paper investigates whether the determinants of a CEO s optimism impacts his investment and financing decisions. It is hypothesized that Justified Optimists are not actually subject to bias and consequently the investment and financing decisions of Justified Optimists should not be subject to the distortions identified in the existing literature. After all, sometimes an unbiased, rational CEO will correctly have a more positive view of the future than the market, or, in other words, it s not optimism if you know you re right. Heaton (2002) explains how managerial optimism can impact a firm s investment policy. Overvaluing investment opportunities leads optimistic CEOs with available cash to overinvest relative to an unbiased CEO. However, overvaluing the firm causes an 5
10 optimistic CEO to be reluctant to raise external financing for investment. This paper finds that while the investment decisions of CEOs exhibiting optimistic behaviors are on average less sensitive to cash flow (in contrast to Malmendier & Tate (2005a)), the investment decisions of Justified Optimists are no more or less sensitive to cash flow than those of CEOs who are not displaying optimistic behaviors. Roll (1986) explains how management hubris can lead to value-destroying mergers. Billet & Qian (2008) claims an association between management hubris, acquisitiveness and negative post-acquisition performance. Malmendier & Tate (2008) and Kolasinski & Li (2013) find that a CEO s tendency to overestimate future outcomes is associated with a higher propensity to complete mergers and a less favorable market reaction to those mergers as judged by announcement returns. This paper finds that optimistic CEOs are more likely to attempt a merger, but the announcement returns for Justified Optimists are actually higher than for the average CEO. This result suggests that the M&A performance of Justified Optimists is actually superior to that of CEOs who are not displaying optimistic behaviors. Deshmukh et al. (2013) predicts and finds that firms led by overconfident CEOs pay lower dividends than firms led by rational CEOs and that the difference between the dividend payments by a rational CEO and an overconfident CEO is smaller in a firm with higher growth (Q). It is argued that higher growth opportunities indicate less private information for overconfident CEOs to misinterpret and so the dividend decisions of overconfident CEOs and rational CEOs will be more similar. This paper finds that while optimistic CEOs are more likely to pay a lower dividend, the difference in dividend policy versus that of unbiased CEOs only narrows for Justified Optimists. This suggests 6
11 that unbiased CEOs make decisions similar to Justified Optimists in the absence of private information. The dividend policy of other types of optimistic CEOs do not become more like the dividend policy of rational CEOs as information about growth opportunities becomes widely available, suggesting that their dividend policy differences are indeed due to the effect of their bias rather than different information sets. Combining the evidence, it is reasonable to conclude that Justified Optimists are not so much overly optimistic as better informed or aware that they possess better skills for dealing with current uncertainties. The investment sensitivity of Justified Optimists is no different from that of unbiased CEOs which suggests Justified Optimists are not more likely to forego value-creating investment opportunities due to biased beliefs about the value of their firm. Justified Optimists do engage in more M&A activity but achieve better returns than CEOs who do not exhibit optimism. Lastly, unlike other optimistic CEOs, the dividend policies of Justified Optimists become more like those of unbiased CEOs as the informational advantage of CEOs versus their shareholders decreases. In short, there is a distinct group of optimistic CEOs whose decisions are either no different from or superior to those of CEOs who do not exhibit optimistic behaviors. This paper adds to the current literature on overconfidence and optimism. First, this paper demonstrates that many CEOs categorized as overconfident or optimistic actually exhibit the qualifying option-holding behavior relatively infrequently. Furthermore, by focusing on the determinants of annual variation in optimistic behaviors, rather than treating the bias as a permanent trait, it is possible to identify distinct groups of optimistic CEOs. Previously, CEOs who persistently displayed optimistic behaviors were shown to implement seemingly sub-optimal investment and financing decisions. Classifying 7
12 optimistic CEOs according to the determinants of their optimism allows the identification of a significant and distinct group of CEOs whose investment and financing decisions seem as good as or better than those of unbiased CEOs. While some groups behaviors may be characterized as irrational (or at least different from those of non-optimistic CEOs), those CEOs whose ITM is increasing as a result of the CEO s own superior performance are not biased: their expectations of improved firm value is justified by their own prior performance and the appropriateness of their investment and financing decisions. 8
13 CHAPTER 2 DATA This paper employs data from Compustat s Execucomp database for information on CEO compensation including the number and estimated value of unexercised, exercisable options and the number and estimated realized value of exercised options. Therefore, the sample consists of S&P1500 firms from 1992 to The data is supplemented with information on stock returns, index returns and market prices from the Center for Research in Security Prices (CRSP) database. Data on a company s annual balance sheet and income statement items comes from the Compustat Annual database. Data on industry returns is taken from French s website ( as are the definitions of the 49 different industries. The Thomson Securities Data Company (SDC) merger database is used to obtain information on the timing, incidence and proposed financing of takeover attempts to create a sample of 26,350 acquisitions, mergers and acquisitions of majority interest by publicly traded US firms announced over the period where the acquirer held less than 50% of the target stock before the announcement but sought to own more than 50% after the announcement. Variable definitions, other than those pertaining to CEO optimism, are given in the parts of the paper describing the experiments where they are used and in the respective tables. 9
14 VARIABLE CONSTRUCTION This paper closely follows Campbell et al. (2011) s methodology for calculating estimated average ITM of a CEO s unexercised, exercisable options and the estimated average realized ITM of exercised options using aggregated data from Execucomp. Of a sample of 35,413 CEO-year observations from Execucomp over the period 1992 to 2012, 18,940 could be classified as high-optimism, moderate-optimism or low-optimism according to the methodology outlined in Campbell et al. (2011) based on the estimated average ITM of unexercised, exercisable options and the estimated average realized ITM of exercised options. When the estimated average ITM of a CEO s unexercised, exercisable options in a given year is greater than or equal to 100%, this paper classifies the CEO as an Optimist. When a CEO s option-holding policy in a given year would be classified as an indicator of low-optimism or moderate-optimism, this paper classifies the CEO as not an Optimist. Of the remaining CEO-year observations, 15,941 could not be classified as the combination of the ITM of unexercised, exercisable options and the realized value of exercised options did not allow a definitive classification and 68 could not be classified because of missing data. Column 1 of table 2, Panel A shows the distribution of CEO-year observations by year and their classification as Optimist or Not Optimist by year. There are 11,516 CEO-year observations where the CEO is not an Optimist, representing 4,098 unique CEO s and 2,651 unique firms. There are 7,424 CEO-year observations where the CEO exhibits optimistic behaviors, representing 2,722 unique CEOs and 2,206 unique firms. The last three columns of the table will be explained in Chapter 5. 10
15 MEASURING OPTIMISM There are two general approaches to measuring an individual s optimism. Surveys of specific individuals potentially generate the most accurate measures of optimism but are expensive and time-consuming to collect, particularly for a large sample of individuals or over a long period of time: Ben-David, Graham & Campbell (2007) uses the results of a survey of CFO predictions; Graham, Campbell & Puri (2007) applies psychometric tests to test subjects. The alternative to surveys of limited samples of subjects is to identify optimistic behaviors using information from existing databases which cover a large sample of CEOs over a long period of time. Researchers have successively innovated by applying related research and exploiting existing databases in order to develop measures of optimism based on existing, large databases. Hall & Murphy (2002) develops a theoretical threshold ITM of 67% at which a rational under-diversified CEO should exercise his stock options. Cicero (2009) confirms that executives do immediately sell their shares after exercising their options about 70% of the time, consistent with reducing their exposure to their own company. Malmendier & Tate (2005) applies this theoretical threshold to actual CEO option-holdings and classify CEOs who persistently fail to exercise options at or above the threshold as overconfident. Unfortunately, the information they use is not generally available and, as Kolasinski & Li (2013) puts it, empirical research on CEO overconfidence is largely limited to a relatively small sample of less than 500 large firms that ends in Campbell et al. (2011) overcomes this limitation by developing a measure of average values of ITM using information available in Compustat s Execucomp database. While a large sample of US firms is covered over a 11
16 reasonable period, the required option information is only available in Execucomp from Kolasinski & Li (2013) proposes an even more readily calculable alternative, where a CEO is classified as being overconfident in a given year if the CEO on average loses money from open-market purchases of his own company s stock in the next 2 years. Confusingly, different authors use the same metric as a measure of both CEO overconfidence and CEO optimism. This paper is concerned with short term variation in a CEO s evaluation of his firm s prospects and follows Campbell et al. (2011) by referring to the metric as a measure of optimism, except when reviewing the existing literature where the cited authors own preferred description is used. 12
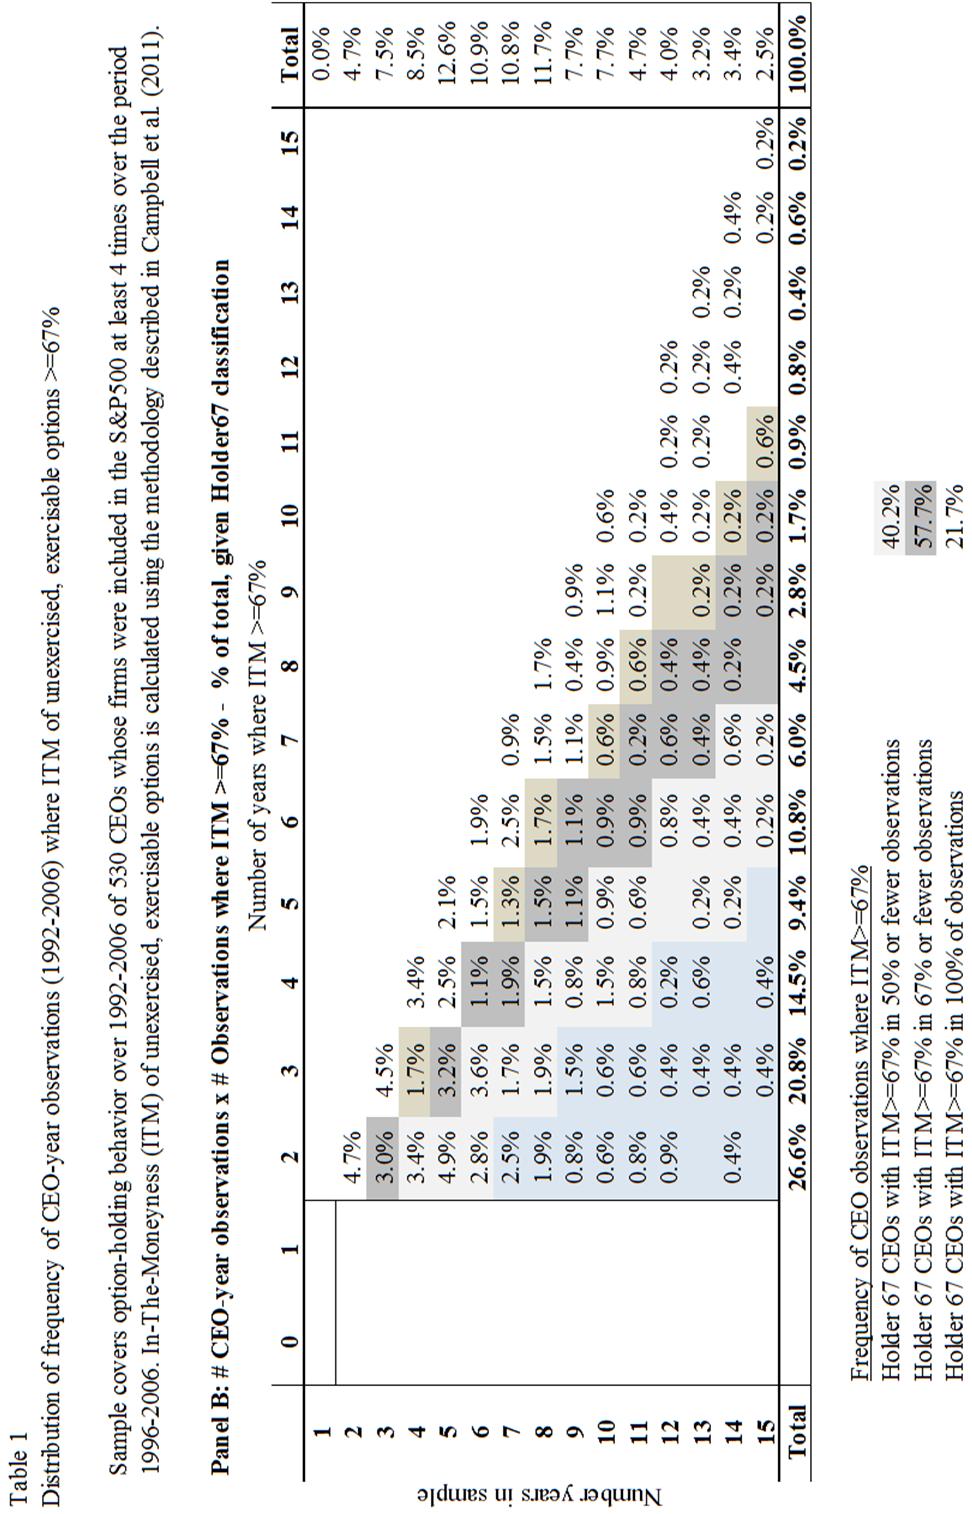
17 CHAPTER 3 PERMANENCE OF OPTIMISM In order to demonstrate the relative infrequency of optimistic behavior amongst CEOs classified as exhibiting a permanent bias, this paper estimates the average ITM of unexercised exercisable options of 1,416 CEOs of 530 large, publicly traded firms over the sample period using Campbell et al. s (2011) methodology. CEO s are classified as Holder67 if the ITM of their unexercised exercisable options is at least 67% at least twice in the sample period. Table 1 shows the frequency of distribution of CEO-year observations in which ITM of unexercised exercisable options is at least 67%. The rows of the tables represent the number of annual observations where the ITM can be calculated. The columns represent the number of annual observations where ITM met or exceeded the 67% threshold. Panel A shows that 48.7% of CEOs never exhibited optimistic behavior and 13.8% exhibited it only once. Panel B shows the distribution of those CEOs which meet the Holder67 classification for each year. It should be noticed that 57.7% of CEOs classified as Holder67 (or permanently biased) exhibited this behavior in two-thirds or fewer of the years in which the ITM could be calculated and 40.2% exhibited this behavior in half or fewer of the years in which the ITM could be calculated. Clearly, even those CEOs for whom a tendency to overestimate future outcomes has been identified as a permanent trait, the qualifying option-holding behavior is actually exhibited relatively rarely. 13
18 This paper seeks to understand what factors cause CEOs to exhibit optimistic behavior and whether the effects of CEO optimism on investment and financing decisions are different when CEO optimism has different causes. 14
19 15
20 16
21 CHAPTER 4 DETERMINANTS OF CHANGE IN ANNUAL OPTIMISM It is widely accepted that humans are subject to a psychological bias called selfattribution where individuals credit success to their own skills and failure to external factors or, as Langer & Roth (1975) succinctly puts it, heads I win, tails it s chance. There are theoretical models linking self-attribution and overconfidence in investors (Daniel, Hirshleifer & Subrahmanyam (1998)) and traders (Gervais & Odean (2011)) and Hilary & Menzly (2006) offers empirical support for a link between confidence and selfattribution for analysts. Using the sample of CEOs and the measure of optimism described in Chapter 2, this paper provides evidence of an association between CEO optimism and self-attribution. This paper first tests the self-attribution hypothesis by performing a logit regression to show how the probability of a CEO being classified as an optimist is affected by conditional returns. If the self-attribution hypothesis is correct then the probability that a CEO is optimistic increases more as a result of positive total equity returns than it decreases as a result of comparable negative equity returns. This can be tested using the following conditional logit regression: Conditional Logit Regression (1): Pr[Optimistic CEO t ] = b 1 [returns returns>0] + b 2 [returns returns<0] + b 3 [controls] where a CEO is Optimistic in year t if the ITM of a CEO s unexercised, exercisable options is greater than or equal to 100% in year t. A conditional logit regression is performed rather than a regular logit regression to allow the use of fixed effects without introducing bias due to the incidental parameters problem, 17
22 Chamberlain (1980). Standard errors are robust to heteroskedasticty across the error terms. The key variables of interest are the conditional returns. The self-attribution hypothesis predicts: b 1 > b 2 >= 0. In other words, the probability that a CEO is optimistic increases more as a result of positive total equity returns than it decreases as a result of comparable negative equity returns. It is expected that b 2 will be positive as negative returns are expected to reduce the probability that a CEO is optimistic. It should be expected that returns are associated with optimism as high returns lead to high equity prices and hence, ceteris paribus, high ITM of options. However unless the stock price is close to the exercise price of the unexercised option, a situation which is later controlled for, the impact of positive and negative returns on the ITM of the unexercised, exercisable options should be symmetrical. Equity returns are winsorized at 0.5% to avoid distortions from extreme values. Control variables include: change in total volatility versus (t-1); year x industry fixed effects (using Fama-French 49 classification); and age and gender CEO characteristics. Total volatility is calculated as the 60-month annualized volatility of the firm s equity returns. Young is an indicator variable with a value of 1 if the CEO is 52 years old or younger in the year of observation (putting the CEO in the youngest tercile of CEOs in the sample) and 0 otherwise. Old is an indicator variable with a value of 1 if the CEO is 59 years old or older in the year of observation (putting the CEO in the oldest tercile of CEOs in the sample) and 0 otherwise. Female is an indicator variable with a value of 1 if the CEO is female and 0 otherwise. Utility and finance firms (with SICs between and respectively) are excluded from the sample as industry specific 18
23 regulation may influence the behaviors of their CEOs. The results of these analyses are robust to including these firms. Model 1 compares the impact of the positive total conditional equity returns and negative total conditional equity returns. Model 2 compares the impact of positive industryadjusted conditional equity returns and negative industry-adjusted conditional equity returns. Total equity returns are actually the result of CEO performance and general industry trends outside the CEO s control; whereas industry-adjusted returns are more closely related to CEO performance relative to his industry peers. Models 1(b) and 2(b) exclude observations where the ITM of the CEO s unexercised, exercisable options are less than 30%. The remaining CEOs would be classified as moderately or highly optimistic according to Campbell et al. s (2011) thresholds. The price of the underlying stock should be sufficiently above than the exercise price of the underlying options to avoid distortions due to the non-linear payoffs of options close to their exercise price. To counter concerns that high values of the ITM of unexercised, exercisable options may identify inattentive CEOs rather than optimistic ones, models 1(c) and 2(c) also exclude years in which the CEO did not exercise any options. Holding some options despite having exercised others indicates a conscious decision not to exercise the remaining options. Table 2(a) Self-attribution differential impact of positive and negative returns on optimism summarizes the results of the conditional logit regressions estimating the impact of various factors on the probability that a CEO is optimistic for an original sample of 15,054 CEO-year observations of all those CEO-year observations where the CEO optimism could be classified according to Campbell et al. s methodology described 19
24 above. The table shows the absolute estimated coefficients for the variables and separate t-tests are performed to confirm whether the estimates of b 1 and b 2 are statistically different from one another. Table 2(a) provides some support for the self-attribution hypothesis. The estimated coefficients for conditional returns in each of the models are significantly different from zero and the point estimates of the coefficients for positive conditional returns are higher than those for negative conditional returns. However, t-tests show that the estimated coefficient for positive total conditional returns is statistically distinguishable from the estimated coefficient for negative total conditional returns only in models 1(b) and 1(c). Models 2(a), 2(b) and 2(c) in table 2(a) show that while the estimated coefficients for industry-adjusted conditional returns in each of the models are significantly different from zero and the point estimates of the coefficients for positive conditional returns are higher than those for negative conditional returns, the coefficients for positive industryadjusted conditional returns are not statistically different from the coefficients for negative industry-adjusted conditional returns. Interestingly, changes in the volatility of the stock price of the underlying stock do not have a statistically significant impact on a CEO s optimism even though it will have an impact on the value of the CEO s options. There is a non-linear relationship between CEO optimism and CEO age with both the youngest and the oldest tercile of CEOs being more likely to be optimistic. Table 2(a) also suggests that female CEOs are less likely than male CEOs to be Optimists. 20
25 The following robustness check tests how conditional returns directly impact the ITM of a CEO s unexercised, exercisable options through the following ordinary least squares regression. OLS Regression (2): ITM = b 1 [returns returns>0] + b 2 [returns returns<0] + b 3 [controls] If the self-attribution hypothesis is correct then we would expect the following to be true: b 1 > b 2 >=0 (the ITM of unexercised, exercisable options should increase as a result of positive returns more than it decreases as a result of negative returns). This is because increasing ITM of unexercised, exercisable options is associated with increasing optimism. It is expected that b 2 will be greater than zero as negative returns should reduce the ITM of unexercised options. Table 2(b) Self-attribution differential impact of positive and negative returns on optimism summarizes the results of OLS regressions estimating the impact of various factors on the change in ITM of a CEO s unexercised, exercisable options for a sample of 15,054 CEO-year observations of all those CEO-year observations where the CEO optimism could be classified according to Campbell et al. s methodology described above and where the firms were not utility or finance firms. Model 1 considers the differential impact of total conditional returns; model 2 considers the differential impact of positive industry-adjusted conditional returns and negative industry-adjusted conditional returns. As in table 2(a), models 1(b) and 2(b) exclude observations where the ITM of the CEO s unexercised, exercisable options were less than 30% and models 1(c) and 2(c) also exclude observations where the CEO did not exercise any options in order to exclude any observations where the CEO might not have made a deliberate decision to hold onto the unexercised exercisable options. In all models, ITM 21
26 and equity returns are winsorized at 0.5% to avoid distortions from extreme values. The OLS regressions use firm and year fixed effects, otherwise each model uses the same control variables as in table 2(a). Standard errors are clustered by firm and robust to heteroskedasticity and correlation in the residuals across observations for the same firm. The adjusted r-squared for all models is low (about 3-6%). This is to be expected as there are many other factors impacting the ITM of unexercised exercisable options including the availability of exercisable options and the decision the CEO s decision whether to exercise any exercisable options. As predicted, the estimated coefficients for the positive conditional returns are highly significant and positive. The estimated coefficients for negative conditional returns are positive in all models and lower than those for positive conditional returns in all but model 2(c). This is consistent with the predictions of the self-attribution hypothesis: b 1 > b 2 >=0 however the t-tests show that the estimated coefficients for positive conditional returns are only statistically different from those for conditional negative returns for the industry-adjusted returns. Overall, the table suggests that ITM increases more when industry-adjusted returns are positive than it decreases when they are negative: consistent with the self-attribution hypothesis. ALTERNATIVE EXPLANATIONS One alternative explanation of these results might be that the CEO was falsely classified as an Optimist due to a combination of the mechanistic impact of higher returns on the ITM of the CEO s unexercised, exercisable options and CEO inertia (resulting in a failure to exercise his options through inaction rather than as a deliberate decision). This explanation is unlikely. 22
27 The mechanistic impact of returns on the ITM of unexercised, exercisable options would not generally explain the asymmetric impact of positive and negative returns: as long as the price of the stock underlying the option is not close to the exercise price of the option then an increase in the stock price will cause a comparable change in the ITM of an option to a comparable decrease in the stock price. It is true that when the stock price is close to the exercise price of the option the impact of positive and negative returns will not be symmetrical. However, the ITM of an unexercised, exercisable option is not purely a function of the price of the underlying stock: so long as an option has a positive ITM, the CEO can decide to exercise the option (in which case the option will not be included in the unexercised options) or hold the option. Secondly, to reduce concerns that the asymmetric impact of positive and negative returns is driven by options which were close to the money, models 1(b), 1(c), 2(b) and 2(c) in tables 2(a) and 2(b) exclude observations where the ITM was below 30%. The remaining observations are above Campbell et al. s (2011) threshold for moderate optimism and are unlikely to have been close to the money options. Table 2(a) shows that the asymmetric impact of positive and negative returns on the probability of a CEO being an optimist actually becomes more pronounced when this adjustment is made. For CEOs to be misclassified as Optimists, they would also have to unintentionally hold the exercisable high ITM options. Such CEO inertia could occur if the CEOs were too busy to manager their personal wealth; however, over 54% of Optimists did exercise some options (this is only 6% lower than for non-optimists), suggesting that these CEOs did make a conscious decision to hold onto their remaining exercisable options. Cicero 23
28 (2009) shows that executives are actually sophisticated and deliberate in their choice of option exercising strategies, choosing strategies which exploit differential tax rates and private information. Secondly, concerns about the inertia hypothesis are alleviated by excluding all CEO-year observations where the CEO did not exercise any options in models 1(c) and 2(c). Exercising some but not all options implies that holding the unexercised, exercisable options was a deliberate decision by the CEO. Table 2(a) shows that excluding potentially inert CEOs improves the explanatory power of the models while increasing the gap between the estimated coefficients b 1 and b 2. A second potential concern is that annual changes in the ITM of unexercised, exercisable options may be measuring annual changes in CEO risk tolerance rather than changes in CEO optimism. Hall & Murphy s (2002) threshold ITM was calculated assuming the CEO had a Constant Relative Risk Aversion (CRRA) of 3. A CEO with a much higher risk tolerance will have a higher ITM threshold. If the ITM of unexercised exercisable options were actually measuring changes in annual risk tolerance rather than changes in optimism then the expected results of some tests in this paper would be different. It should not be expected that CEOs with high risk tolerance should prefer low payout ratios (as this paper finds) and it should not be expected that risk tolerance reacts asymmetrically to positive and negative total returns. It is therefore reasonable to accept that the observed option-holding behavior is a result of annual changes in the CEO s optimism rather than risk tolerance. In summary, the combined results of the conditional logit and OLS regressions provide considerable, if not definitive, evidence to support the self-attribution hypothesis. 24
29 Table 2(a) Self-attribution - differential impact of positive and negative returns on optimism Conditional logit regressions of factors influencing probability of CEO being an optimism Sample of 15,054 CEO-year observations (excluding finance and utility firms) over the period Models 1(b) and 2(b) exclude observations where the ITM of a CEO's unexercised, exercisable options are less than 30%. Models 1(c) and 2(c) also exclude observations where the CEO did not exercise any options. Table shows estimated coefficients from conditional logit regressions of the probability that the ITM of a CEO's unexercised, exercisable options >=100%. Total returns (t), given >0 are total positive equity returns in year t. Total returns (t), given <0 are total negative equity returns in year t. Industry-adj returns(t), given >0 are positive industry-adjusted equity returns in year t. Industry-adj returns (t), given <0 are negative industry-adjusted equity returns in year t. Change in total volatility (t) is the change in annualized 60-month volatility of a firm's monthly stock returns from (t-1) to t. Young is an indicator variable with value 1 if the CEO is 52 or younger in the year of the observation and 0 otherwise. Old is an indicator variable with a value of 1 if the CEO is 59 or older in the year of the observationand0otherwise.female is an indicator variable with a value of 1 if the CEO is female and 0 otherwise. All models include fixed effects for industry x year. Standard errors are robust. The superscripts ***, ** and * indicate statistical significance at the 1%, 5% and 10% levels, respectively. Pr(Optimist) Model 1(a) Model 1(b) Model 1(c) Model 2(a) Model 2(b) Model 2(c) Number of observations used 11,032 9,421 4,776 11,032 9,421 4,776 Pseudo R-squared Stock Returns Total returns (t), given > *** 0.959*** 1.082*** x x x Total returns (t), given < *** x x x Industry-adj returns (t), given >0 x x x 1.096*** 1.003*** 1.181*** Industry-adj returns (t), given <0 x x x 0.997*** 0.799*** 0.730*** Change in total volatility (t) CEO characteristics Young (<52 years old) ** 0.194*** 0.157*** 0.112** 0.198*** Old (>59 years old) 0.108* 0.116** ** 0.11** 0.072*** Female *** *** *** *** *** ** Fixed effects Years x Industry (FF49) Y Y Y Y Y Y t-test: coefficient of cond'l returns equal x N*** N** x x x 25
30 Table 2(b) Self-attribution - differential impact of positive and negative returns on optimism OLS regressions of factors influencing ITM of unexercised, exercisable options Sample of 15,054 CEO-year observations (excluding finance and utility firms) over the period Models 1(b) and 2(b) exclude observations where the ITM of a CEO's unexercised, exercisable options are less than 30%. Models 1(c) and 2(c) also exclude observations where the CEO did not exercise any options. Table shows estimated coefficients from OLS regressions of the ITM of a CEO's unexercised, exercisable options >=100%. Total returns (t), given >0 are total positive equity returns in year t. Total returns (t), given <0 are total negative equity returns in year t. Industry-adj returns(t), given >0 are positive industry-adjusted equity returns in year t. Industry-adj returns (t), given <0 are negative industry-adjusted equity returns in year t. Change in total volatility (t) is the change in annualized 60-month volatility of a firm's monthly stock returns from (t-1) to t. Young is an indicator variable with value 1 if the CEO is 52 or younger in the year of the observation and 0 otherwise. Old is an indicator variable with a value of 1 if the CEO is 59 or older in the year of the observation and 0 otherwise. Female is an indicator variable with a value of 1 if the CEO is female and 0 otherwise. All models include firm and year fixed effects. Standard errors are clustered by firm. The superscripts ***, ** and * indicate statistical significance at the 1%, 5% and 10% levels, respectively. OLS ITM Model 1(a) Model 1(b) Model 1(c) Model 2(a) Model 2(b) Model 2(c) Number of observations used 11,499 9,791 5,224 11,499 9,791 5,224 R-squared (adj) Stock Returns Total returns (t), given > *** 0.910*** 1.311*** x x x Total returns (t), given < ** 0.871* 1.329* x x x Industry-adj returns (t), given >0 x x x 1.147*** 1.052*** 1.579*** Industry-adj returns (t), given <0 x x x 0.323* 0.371* Change in total volatility (t) 1.370** 1.424** 3.016** 1.199* 1.291* 2.651** CEO characteristics Young (<52 years old) Old (>59 years old) Female Fixed effects Firm Y Y Y Y Y Y Years Y Y Y Y Y Y t-test: coefficient of cond'l returns equal x x x N** N* N** 26
31 CHAPTER 5 GROUPING OPTIMISTIC CEOS This paper shows that there is a significant and distinct group of optimistic CEOs whose apparently optimistic behavior is not necessarily the result of psychological bias and that this sub-group of CEOs makes investment and financing decisions which are no different from or superior to those of unbiased, non-optimistic CEOs. Malmendier & Tate (2005a) divides its Holder67 CEOs into Hold and Win 67 and Hold and Lose 67, according to the outcome of their decision to hold exercisable options with an ITM of greater than 67% turned out ex post, in order to test whether investment distortions may be due to superior private information. They find no difference between the two groups. Kolasinski and Li (2013) defines CEOs as justifiably confident CEOs, according to the ex post 180-day returns from buying their own company stock and finds that the merger announcement returns of the justifiably confident CEOs are no different from those of CEOs who are not confident. While claiming that optimism is justifiable based on ex post realized returns might be intuitively appealing, optimism is defined as a tendency to overestimate the value of uncertain future outcomes, it ignores the rationale for a CEO s expectation. A manager who believes his firm is undervalued without any reasonable justification will be right in a rising market; whereas a rational CEO without bias will not always realize positive outcomes even when the positive outcome could be rationally justified. In other words, the rationale for a decision is a better indication of the absence of bias than the ex post results of that decision. 27
32 This paper distinguishes between justified and unjustified optimism based on the rationale for the optimism. Chapter 4 of this paper provides support for the claim that CEO optimism is subject to self-attribution (it increases more when CEO performance is positive than it decreases when CEO performance is negative) and so it is reasonable to separate optimistic CEOs into justifiable optimists and unjustifiable optimists according to the CEO s recent performance rather than the ex post accuracy of their expectations. The results of this methodology suggest that this approach may be superior to the alternative of determining justifiability based on outcomes. Kolasinski and Li (2013) highlights that, according to its methodology, the merger announcement returns for justifiably confident CEOs are negative; whereas Chapter 7 of this paper shows that its methodology yields positive merger announcement returns for justified optimists. To identify Justified Optimists, this paper selects optimistic CEOs whose optimism increased following positive industry-adjusted equity returns. To identify Unjustified Optimists, optimistic CEOs whose optimism increases despite following negative industry-adjusted equity returns are selected. The rationale for this classification is that increases in optimism due to positive industry-adjusted returns are likely to be due to the demonstrated superior skill or judgment of the CEO; whereas increases in optimism despite negative industry-adjusted returns are more likely to be due to the CEO s bias. The classification is performed using increasing ITM of unexercised, exercisable options as a measure of increasing optimism. Table 3, panel A summarizes the annual frequency of Justified Optimists and Unjustified Optimists. There are 3,079 CEO-year observations where the CEO is classified as a Justified Optimist (16.3% of the total CEO-year observations and 41.5% of the 28
33 observations classified as Optimistic). There are 1,269 CEO-year observations where the CEO is classified as an Unjustified Optimist (6.7% of the total CEO-year observations and 17.1% of the observations classified as Optimistic). Table 3, Panel B summarizes the characteristics of the different groups of CEOs. The differences in the ITM of unexercised, exercisable options and returns reflect the definitions of the various groups. There seems to be no significant difference in the mean ages of the different groups of CEOs and, due to the low percentage of female CEOs, the differences in the gender ratio of the various groups is also low. The CFO Optimist indicator is shown as a simple robustness test for the Justified Optimist indicator. If the optimism of Justified Optimists is indeed justified, it would be expected that the CFOs working for Justified Optimists should be more likely to exhibit optimism than the CFOs of Unjustified Optimists. Firstly, CFOs are likely to be astute concerning the financial prospects of the firm and optimal option-holding behavior. Secondly, the CFO is less likely than the CEO to be subject to a biased evaluation of the CEO s abilities. Lastly, Wang, Shin & Francis (2012) shows that CFOs tend to earn higher returns than CEOs when trading the stock of their own company and concludes that CFO trades have more informational content than those of CEOs. The CFO Optimist indicator is equal to 1 when the CFO exhibits optimistic optionholding behavior and is set to 0 otherwise. Table 3, Panel B shows that Justified Optimists have the highest mean value for CFO Optimist indicator (indicating that 73.8% of Justified Optimists CFOs are also optimistic, compared to 26.3% for CFOs of the average CEO and 66.4% of CFOs of the average Optimist). Separate t-tests show the differences in means between Justified Optimists and all other CEOs (54.7%) and 29
34 between Justified Optimists and all other Optimist CEOs (12.6%) are both statistically significant with p-values less than 1%. If it is accepted that CFOs are less likely to be biased and are more likely to be financially astute, then the higher coincidence of CFO optimism and CEO optimism for Justified Optimists is an indication that Justified Optimists are indeed justified in their optimism. While this is reassuring, the key test of whether the behavior of Justified Optimists is indeed not the result of a psychological bias is whether Justified Optimists as a group implement financing and investment decisions different from those of CEOs who do not exhibit optimistic option-holding behavior. 30
35 Table 3 Summary Statistics Panel A: CEO observations by year Sample includes CEOs of S&P1500 firms whose optimism can be calculated according to the methodology described in Campbell et al. (2011). CEO classified as Optimist if ITM of unexercised exercisable options >=100% in given year. Justified Optimist is an Optimist where the ITM-ness of unexercised exercisable options has increased versus the prior year and industry-adjusted returns are positive. Unjustified Optimist is an Optimist where the ITM-ness of unexercised exercisable options has increased vs prior year and industry-adjusted returns are negative. Year Total Not Optimist Optimist Justified Optimist Unjust'd Optimist Optimist Other x x , , , , , , , , Total 18,940 11,516 7,424 3,079 1,269 3,076 31
Overconfidence or Optimism? A Look at CEO Option-Exercise Behavior
 Overconfidence or Optimism? A Look at CEO Option-Exercise Behavior By Jackson Mills Abstract The retention of deep in-the-money exercisable stock options by CEOs has generally been attributed to managers
Managerial Optimism, Investment Efficiency, and Firm Valuation
 1 Managerial Optimism, Investment Efficiency, and Firm Valuation I-Ju Chen* Yuan Ze University, Taiwan Shin-Hung Lin Yuan Ze University, Taiwan This study investigates the relationship between managerial
How Markets React to Different Types of Mergers
 How Markets React to Different Types of Mergers By Pranit Chowhan Bachelor of Business Administration, University of Mumbai, 2014 And Vishal Bane Bachelor of Commerce, University of Mumbai, 2006 PROJECT
DO TARGET PRICES PREDICT RATING CHANGES? Ombretta Pettinato
 DO TARGET PRICES PREDICT RATING CHANGES? Ombretta Pettinato Abstract Both rating agencies and stock analysts valuate publicly traded companies and communicate their opinions to investors. Empirical evidence
Managerial Characteristics and Corporate Cash Policy
 Managerial Characteristics and Corporate Cash Policy Keng-Yu Ho Department of Finance National Taiwan University Chia-Wei Yeh Department of Finance National Taiwan University December 3, 2014 Corresponding
Overconfidence and Incentive Compensation
 Overconfidence and Incentive Compensation Mark Humphery-Jenner Australian School of Business University of New South Wales mlhj@unsw.edu.au Ling Lei Lisic School of Management George Mason University llisic@gmu.edu
Do CEO Beliefs Affect Corporate Cash Holdings?
 Do CEO Beliefs Affect Corporate Cash Holdings? Sanjay Deshmukh, Anand M. Goel, and Keith M. Howe February 17, 2015 Abstract We examine the effect of CEO optimism on corporate cash holdings by developing
Do CEO Beliefs Affect Corporate Cash Holdings?
 Do CEO Beliefs Affect Corporate Cash Holdings? Sanjay Deshmukh, Anand M. Goel, and Keith M. Howe December 20, 2015 Abstract We examine the effect of CEO optimism on corporate cash holdings by developing
Capital allocation in Indian business groups
 Capital allocation in Indian business groups Remco van der Molen Department of Finance University of Groningen The Netherlands This version: June 2004 Abstract The within-group reallocation of capital
CEO Overconfidence and Agency Cost of Debt
 CEO Overconfidence and Agency Cost of Debt : Evidence from Voluntary Turnovers Subramanian. R. Iyer Anderson School of Management University of New Mexico Albuquerque, New Mexico 87131 Ph: (505) 277-3207
The Consistency between Analysts Earnings Forecast Errors and Recommendations
 The Consistency between Analysts Earnings Forecast Errors and Recommendations by Lei Wang Applied Economics Bachelor, United International College (2013) and Yao Liu Bachelor of Business Administration,
Optimal Financial Education. Avanidhar Subrahmanyam
 Optimal Financial Education Avanidhar Subrahmanyam Motivation The notion that irrational investors may be prevalent in financial markets has taken on increased impetus in recent years. For example, Daniel
Optimism or Over-Precision? What Drives the Role of Overconfidence in Managerial Decisions?
 Optimism or Over-Precision? What Drives the Role of Overconfidence in Managerial Decisions? Ronghong Huang 1, Kelvin Jui Keng Tan 2*, Johan Sulaeman 3, Robert Faff 4 Version: November 13, 2016 1 The University
Sources of Financing in Different Forms of Corporate Liquidity and the Performance of M&As
 Sources of Financing in Different Forms of Corporate Liquidity and the Performance of M&As Zhenxu Tong * University of Exeter Jian Liu ** University of Exeter This draft: August 2016 Abstract We examine
MERGERS AND ACQUISITIONS: THE ROLE OF GENDER IN EUROPE AND THE UNITED KINGDOM
 ) MERGERS AND ACQUISITIONS: THE ROLE OF GENDER IN EUROPE AND THE UNITED KINGDOM Ersin Güner 559370 Master Finance Supervisor: dr. P.C. (Peter) de Goeij December 2013 Abstract Evidence from the US shows
Daily Stock Returns: Momentum, Reversal, or Both. Steven D. Dolvin * and Mark K. Pyles **
 Daily Stock Returns: Momentum, Reversal, or Both Steven D. Dolvin * and Mark K. Pyles ** * Butler University ** College of Charleston Abstract Much attention has been given to the momentum and reversal
Long Run Stock Returns after Corporate Events Revisited. Hendrik Bessembinder. W.P. Carey School of Business. Arizona State University.
 Long Run Stock Returns after Corporate Events Revisited Hendrik Bessembinder W.P. Carey School of Business Arizona State University Feng Zhang David Eccles School of Business University of Utah May 2017
Prior target valuations and acquirer returns: risk or perception? *
 Prior target valuations and acquirer returns: risk or perception? * Thomas Moeller Neeley School of Business Texas Christian University Abstract In a large sample of public-public acquisitions, target
HOUSEHOLDS INDEBTEDNESS: A MICROECONOMIC ANALYSIS BASED ON THE RESULTS OF THE HOUSEHOLDS FINANCIAL AND CONSUMPTION SURVEY*
 HOUSEHOLDS INDEBTEDNESS: A MICROECONOMIC ANALYSIS BASED ON THE RESULTS OF THE HOUSEHOLDS FINANCIAL AND CONSUMPTION SURVEY* Sónia Costa** Luísa Farinha** 133 Abstract The analysis of the Portuguese households
Risk Tolerance and Risk Exposure: Evidence from Panel Study. of Income Dynamics
 Risk Tolerance and Risk Exposure: Evidence from Panel Study of Income Dynamics Economics 495 Project 3 (Revised) Professor Frank Stafford Yang Su 2012/3/9 For Honors Thesis Abstract In this paper, I examined
Market Variables and Financial Distress. Giovanni Fernandez Stetson University
 Market Variables and Financial Distress Giovanni Fernandez Stetson University In this paper, I investigate the predictive ability of market variables in correctly predicting and distinguishing going concern
Are Mergers Driven by Overvaluation? Evidence from Managerial Insider Trading Around Merger Announcements
 Paper 1 of 2 USC FBE FINANCE SEMINAR presented by Mehmet Akbulut FRIDAY, September 16, 2005 10:00 am 11:30 am, Room: JKP-104 Are Mergers Driven by Overvaluation? Evidence from Managerial Insider Trading
CHAPTER 5 RESULT AND ANALYSIS
 CHAPTER 5 RESULT AND ANALYSIS This chapter presents the results of the study and its analysis in order to meet the objectives. These results confirm the presence and impact of the biases taken into consideration,
Management Ownership and Dividend Policy: The Role of Managerial Overconfidence
 1 Management Ownership and Dividend Policy: The Role of Managerial Overconfidence Cheng-Shou Lu * Associate Professor, Department of Wealth and Taxation Management National Kaohsiung University of Applied
Managerial confidence and initial public offerings
 Managerial confidence and initial public offerings Thomas J. Boulton a, T. Colin Campbell b,* May, 2014 Abstract Initial public offering (IPO) underpricing is positively correlated with managerial confidence.
Overconfidence and investor size
 Overconfidence and investor size Anders Ekholm * and Daniel Pasternack Abstract Recent research documents that institutional or large investors act as antagonists to other investors by showing opposite
Online Appendix to Managerial Beliefs and Corporate Financial Policies
 Online Appendix to Managerial Beliefs and Corporate Financial Policies Ulrike Malmendier UC Berkeley and NBER ulrike@econ.berkeley.edu Jon Yan Stanford jonathan.yan@stanford.edu January 7, 2010 Geoffrey
Cash Flow Sensitivity of Investment: Firm-Level Analysis
 Cash Flow Sensitivity of Investment: Firm-Level Analysis Armen Hovakimian Baruch College and Gayane Hovakimian * Fordham University May 12, 2005 ABSTRACT Using firm level estimates of investment-cash flow
Acquisitions, Overconfident Managers and Self-Attribution Bias. John A. Doukas* and Dimitris Petmezas
 Acquisitions, Overconfident Managers and Self-Attribution Bias John A. Doukas* and Dimitris Petmezas ABSTRACT We examine whether acquisitions by overconfident managers generate superior abnormal returns
The Effect of Financial Constraints, Investment Policy and Product Market Competition on the Value of Cash Holdings
 The Effect of Financial Constraints, Investment Policy and Product Market Competition on the Value of Cash Holdings Abstract This paper empirically investigates the value shareholders place on excess cash
How do serial acquirers choose the method of payment? ANTONIO J. MACIAS Texas Christian University. P. RAGHAVENDRA RAU University of Cambridge
 How do serial acquirers choose the method of payment? ANTONIO J. MACIAS Texas Christian University P. RAGHAVENDRA RAU University of Cambridge ARIS STOURAITIS Hong Kong Baptist University August 2012 Abstract
The Overconfidence and Self-Attribution Bias of Investors in the. Primary Market
 The Overconfidence and Self-Attribution Bias of Investors in the Primary Maret Yenshan Hsu Department of Finance National Chengchi University Taipei, Taiwan, ROC Email: ysshiu@nccu.edu.tw Tel: 886-2-2939309
The Importance (or Non-Importance) of Distributional Assumptions in Monte Carlo Models of Saving. James P. Dow, Jr.
 of Distributional Assumptions in Monte Carlo Models of Saving. James P. Dow, Jr.") The Importance (or Non-Importance) of Distributional Assumptions in Monte Carlo Models of Saving James P. Dow, Jr. Department of Finance, Real Estate and Insurance California State University, Northridge
The Importance (or Non-Importance) of Distributional Assumptions in Monte Carlo Models of Saving James P. Dow, Jr. Department of Finance, Real Estate and Insurance California State University, Northridge
Differential Cash versus Accrual Persistence and Performance Target Setting
 Differential Cash versus Accrual Persistence and Performance Target Setting Laura Li liyue@illinois.edu Shuyang Wang swang162@illinois.edu Wei Zhu zhuwei@illinois.edu May 2017 Abstract We examine the extent
Financial Economics Field Exam August 2011
 Financial Economics Field Exam August 2011 There are two questions on the exam, representing Macroeconomic Finance (234A) and Corporate Finance (234C). Please answer both questions to the best of your
Heterogeneous Institutional Investors and Earnings Smoothing
 Heterogeneous Institutional Investors and Earnings Smoothing Yudan Zheng Long Island University This paper examines the relationship between institutional ownership and earnings smoothing by taking into
Corporate disclosure, information uncertainty and investors behavior: A test of the overconfidence effect on market reaction to goodwill write-offs
 Corporate disclosure, information uncertainty and investors behavior: A test of the overconfidence effect on market reaction to goodwill write-offs VERONIQUE BESSIERE and PATRICK SENTIS CR2M University
Online Appendix to. The Value of Crowdsourced Earnings Forecasts
 Online Appendix to The Value of Crowdsourced Earnings Forecasts This online appendix tabulates and discusses the results of robustness checks and supplementary analyses mentioned in the paper. A1. Estimating
Managements' Overconfident Tone and Corporate Policies
 University of Pennsylvania ScholarlyCommons Summer Program for Undergraduate Research (SPUR) Wharton Undergraduate Research 2017 Managements' Overconfident Tone and Corporate Policies Sin Tae Kim University
Volume 35, Issue 1. Effects of Aging on Gender Differences in Financial Markets
 Volume 35, Issue 1 Effects of Aging on Gender Differences in Financial Markets Ran Shao Yeshiva University Na Wang Hofstra University Abstract Gender differences in risk-taking and investment decisions
Leveling Playing Field or Obfuscation: The Informational Role of Overconfident CEOs*
 Leveling Playing Field or Obfuscation: The Informational Role of Overconfident CEOs* Chishen Wei Nanyang Technological University cswei@ntu.edu.sg Lei Zhang Nanyang Technological University zhangl@ntu.edu.sg
Discussion of Information Uncertainty and Post-Earnings-Announcement-Drift
 Journal of Business Finance & Accounting, 34(3) & (4), 434 438, April/May 2007, 0306-686X doi: 10.1111/j.1468-5957.2007.02031.x Discussion of Information Uncertainty and Post-Earnings-Announcement-Drift
People are more willing to bet on their own judgments when they feel skillful or knowledgeable. We investigate
 MANAGEMENT SCIENCE Vol. 55, No. 7, July 2009, pp. 1094 1106 issn 0025-1909 eissn 1526-5501 09 5507 1094 informs doi 10.1287/mnsc.1090.1009 2009 INFORMS Investor Competence, Trading Frequency, and Home
Feedback Effect and Capital Structure
 Feedback Effect and Capital Structure Minh Vo Metropolitan State University Abstract This paper develops a model of financing with informational feedback effect that jointly determines a firm s capital
ARE LOSS AVERSION AFFECT THE INVESTMENT DECISION OF THE STOCK EXCHANGE OF THAILAND S EMPLOYEES?
 ARE LOSS AVERSION AFFECT THE INVESTMENT DECISION OF THE STOCK EXCHANGE OF THAILAND S EMPLOYEES? by San Phuachan Doctor of Business Administration Program, School of Business, University of the Thai Chamber
Managerial Insider Trading and Opportunism
 Managerial Insider Trading and Opportunism Mehmet E. Akbulut 1 Department of Finance College of Business and Economics California State University Fullerton Abstract This paper examines whether managers
Fresh Momentum. Engin Kose. Washington University in St. Louis. First version: October 2009
 Long Chen Washington University in St. Louis Fresh Momentum Engin Kose Washington University in St. Louis First version: October 2009 Ohad Kadan Washington University in St. Louis Abstract We demonstrate
Investor Competence, Information and Investment Activity
 Investor Competence, Information and Investment Activity Anders Karlsson and Lars Nordén 1 Department of Corporate Finance, School of Business, Stockholm University, S-106 91 Stockholm, Sweden Abstract
Can managerial (over)confidence lead firms to bankruptcy? Evidence from the UK
confidence lead firms to bankruptcy? Evidence from the UK") Can managerial (over)confidence lead firms to bankruptcy? Evidence from the UK Jingsi Leng De Montfort University Agnieszka Trzeciakiewicz University of Hull Aydin Ozkan University of Bradford Abstract
Can managerial (over)confidence lead firms to bankruptcy? Evidence from the UK Jingsi Leng De Montfort University Agnieszka Trzeciakiewicz University of Hull Aydin Ozkan University of Bradford Abstract
The Role of Credit Ratings in the. Dynamic Tradeoff Model. Viktoriya Staneva*
 The Role of Credit Ratings in the Dynamic Tradeoff Model Viktoriya Staneva* This study examines what costs and benefits of debt are most important to the determination of the optimal capital structure.
Research on the Relationship between CEO's Overconfidence and Corporate Investment Financing Behavior
 Research on the Relationship between CEO's Overconfidence and Corporate Investment Financing Behavior Yan-liang Zhang*, Zi-wei Yang Shandong University of Finance and Economics. Jinan P.R.China E-mail:zhyanliang@sina.com
A Balanced View of Storefront Payday Borrowing Patterns Results From a Longitudinal Random Sample Over 4.5 Years
 Report 7-C A Balanced View of Storefront Payday Borrowing Patterns Results From a Longitudinal Random Sample Over 4.5 Years A Balanced View of Storefront Payday Borrowing Patterns Results From a Longitudinal
Internet Appendix for Do General Managerial Skills Spur Innovation?
 Internet Appendix for Do General Managerial Skills Spur Innovation? Cláudia Custódio Imperial College Business School Miguel A. Ferreira Nova School of Business and Economics, ECGI Pedro Matos University
Optimal Risk Adjustment. Jacob Glazer Professor Tel Aviv University. Thomas G. McGuire Professor Harvard University. Contact information:
 February 8, 2005 Optimal Risk Adjustment Jacob Glazer Professor Tel Aviv University Thomas G. McGuire Professor Harvard University Contact information: Thomas G. McGuire Harvard Medical School Department
MARKET-BASED VALUATION: PRICE MULTIPLES
 MARKET-BASED VALUATION: PRICE MULTIPLES Introduction Price multiples are ratios of a stock s market price to some measure of value per share. A price multiple summarizes in a single number a valuation
The relationship between share repurchase announcement and share price behaviour
 The relationship between share repurchase announcement and share price behaviour Name: P.G.J. van Erp Submission date: 18/12/2014 Supervisor: B. Melenberg Second reader: F. Castiglionesi Master Thesis
Liquidity skewness premium
 Liquidity skewness premium Giho Jeong, Jangkoo Kang, and Kyung Yoon Kwon * Abstract Risk-averse investors may dislike decrease of liquidity rather than increase of liquidity, and thus there can be asymmetric
Online Appendix Results using Quarterly Earnings and Long-Term Growth Forecasts
 Online Appendix Results using Quarterly Earnings and Long-Term Growth Forecasts We replicate Tables 1-4 of the paper relating quarterly earnings forecasts (QEFs) and long-term growth forecasts (LTGFs)
Does R&D Influence Revisions in Earnings Forecasts as it does with Forecast Errors?: Evidence from the UK. Seraina C.
 Does R&D Influence Revisions in Earnings Forecasts as it does with Forecast Errors?: Evidence from the UK Seraina C. Anagnostopoulou Athens University of Economics and Business Department of Accounting
CHAPTER 12: MARKET EFFICIENCY AND BEHAVIORAL FINANCE
 CHAPTER 12: MARKET EFFICIENCY AND BEHAVIORAL FINANCE 1. The correlation coefficient between stock returns for two non-overlapping periods should be zero. If not, one could use returns from one period to
Managerial Power, Capital Structure and Firm Value
 Open Journal of Social Sciences, 2014, 2, 138-142 Published Online December 2014 in SciRes. http://www.scirp.org/journal/jss http://dx.doi.org/10.4236/jss.2014.212019 Managerial Power, Capital Structure
CEOs Personal Portfolio and Corporate Policies
 CEOs Personal Portfolio and Corporate Policies Hamid Boustanifar Dan Zhang October, 2016 Abstract Using a unique data set of personal wealth and sociodemographic characteristics for all Norwegian CEOs,
Econ 234C Corporate Finance Lecture 8: External Investment (finishing up) Capital Structure
 Capital Structure") Econ 234C Corporate Finance Lecture 8: External Investment (finishing up) Capital Structure Ulrike Malmendier UC Berkeley March 13, 2007 Outline 1. Organization: Exams 2. External Investment (IV): Managerial
Econ 234C Corporate Finance Lecture 8: External Investment (finishing up) Capital Structure Ulrike Malmendier UC Berkeley March 13, 2007 Outline 1. Organization: Exams 2. External Investment (IV): Managerial
The Impact of Shareholder Taxation on Merger and Acquisition Behavior
 The Impact of Shareholder Taxation on Merger and Acquisition Behavior Eric Ohrn, Grinnell College Nathan Seegert, University of Utah Grinnell College Department of Economics Seminar November 8, 2016 Introduction
Factors in the returns on stock : inspiration from Fama and French asset pricing model
 Lingnan Journal of Banking, Finance and Economics Volume 5 2014/2015 Academic Year Issue Article 1 January 2015 Factors in the returns on stock : inspiration from Fama and French asset pricing model Yuanzhen
INVESTIGATING THE ASSOCIATION BETWEEN DISCLOSURE QUALITY AND MISPRICING OF ACCRUALS AND CASH FLOWS: CASE STUDY OF IRAN
 INVESTIGATING THE ASSOCIATION BETWEEN DISCLOSURE QUALITY AND MISPRICING OF ACCRUALS AND CASH FLOWS: CASE STUDY OF IRAN Kordestani Gholamreza Imam Khomeini International University(IKIU) Gholamrezakordestani@ikiu.ac.ir
Revisiting Idiosyncratic Volatility and Stock Returns. Fatma Sonmez 1
 Revisiting Idiosyncratic Volatility and Stock Returns Fatma Sonmez 1 Abstract This paper s aim is to revisit the relation between idiosyncratic volatility and future stock returns. There are three key
INVESTOR SENTIMENT, MANAGERIAL OVERCONFIDENCE, AND CORPORATE INVESTMENT BEHAVIOR
 INVESTOR SENTIMENT, MANAGERIAL OVERCONFIDENCE, AND CORPORATE INVESTMENT BEHAVIOR You Haixia Nanjing University of Aeronautics and Astronautics, China ABSTRACT In this paper, the nonferrous metals industry
Journal Of Financial And Strategic Decisions Volume 7 Number 1 Spring 1994 INSTITUTIONAL INVESTMENT ACROSS MARKET ANOMALIES. Thomas M.
 Journal Of Financial And Strategic Decisions Volume 7 Number 1 Spring 1994 INSTITUTIONAL INVESTMENT ACROSS MARKET ANOMALIES Thomas M. Krueger * Abstract If a small firm effect exists, one would expect
Differential Pricing Effects of Volatility on Individual Equity Options
 Differential Pricing Effects of Volatility on Individual Equity Options Mobina Shafaati Abstract This study analyzes the impact of volatility on the prices of individual equity options. Using the daily
WORKING PAPER MASSACHUSETTS
 BASEMENT HD28.M414 no. Ibll- Dewey ALFRED P. WORKING PAPER SLOAN SCHOOL OF MANAGEMENT Corporate Investments In Common Stock by Wayne H. Mikkelson University of Oregon Richard S. Ruback Massachusetts
DIVIDEND POLICY AND THE LIFE CYCLE HYPOTHESIS: EVIDENCE FROM TAIWAN
 The International Journal of Business and Finance Research Volume 5 Number 1 2011 DIVIDEND POLICY AND THE LIFE CYCLE HYPOTHESIS: EVIDENCE FROM TAIWAN Ming-Hui Wang, Taiwan University of Science and Technology
Investor Behavior and the Timing of Secondary Equity Offerings
 Investor Behavior and the Timing of Secondary Equity Offerings Dalia Marciukaityte College of Administration and Business Louisiana Tech University P.O. Box 10318 Ruston, LA 71272 E-mail: DMarciuk@cab.latech.edu
Comparison of OLS and LAD regression techniques for estimating beta
 Comparison of OLS and LAD regression techniques for estimating beta 26 June 2013 Contents 1. Preparation of this report... 1 2. Executive summary... 2 3. Issue and evaluation approach... 4 4. Data... 6
MERGER ANNOUNCEMENTS AND MARKET EFFICIENCY: DO MARKETS PREDICT SYNERGETIC GAINS FROM MERGERS PROPERLY?
 MERGER ANNOUNCEMENTS AND MARKET EFFICIENCY: DO MARKETS PREDICT SYNERGETIC GAINS FROM MERGERS PROPERLY? ALOVSAT MUSLUMOV Department of Management, Dogus University. Acıbadem 81010, Istanbul / TURKEY Tel:
Portfolio Rebalancing:
 Portfolio Rebalancing: A Guide For Institutional Investors May 2012 PREPARED BY Nat Kellogg, CFA Associate Director of Research Eric Przybylinski, CAIA Senior Research Analyst Abstract Failure to rebalance
Firm R&D Strategies Impact of Corporate Governance
 Firm R&D Strategies Impact of Corporate Governance Manohar Singh The Pennsylvania State University- Abington Reporting a positive relationship between institutional ownership on one hand and capital expenditures
Discussion of Value Investing: The Use of Historical Financial Statement Information to Separate Winners from Losers
 Discussion of Value Investing: The Use of Historical Financial Statement Information to Separate Winners from Losers Wayne Guay The Wharton School University of Pennsylvania 2400 Steinberg-Dietrich Hall
Change in systematic trading behavior and the cross-section of stock returns during the global financial crisis: Fear or Greed?
 Change in systematic trading behavior and the cross-section of stock returns during the global financial crisis: Fear or Greed? P. Joakim Westerholm 1, Annica Rose and Henry Leung University of Sydney
Financial Analysts Herding Behavior in a Fluctuating Macro-economy
 Financial Analysts Herding Behavior in a Fluctuating Macro-economy GUSTAV KÖLBY & JOHAN WIDÉN Stockholm School of Economics May 2017 ABSTRACT Financial analysts make forecasts that are either herded or
Does Informed Options Trading Prior to Innovation Grants. Announcements Reveal the Quality of Patents?
 Does Informed Options Trading Prior to Innovation Grants Announcements Reveal the Quality of Patents? Pei-Fang Hsieh and Zih-Ying Lin* Abstract This study examines informed options trading prior to innovation
The WACC Fallacy: The Real Effects of Using a Unique Discount Rate
 11-222 Research Group: Finance in Toulouse February, 2011 The WACC Fallacy: The Real Effects of Using a Unique Discount Rate PHILIPP KRUGER, AUGUSTIN LANDIER AND DAVID THESMAR The WACC Fallacy: The Real
CEO Optimism and Incentive Compensation
 CEO Optimism and Incentive Compensation Clemens A. Otto London Business School November 15, 2011 JOB MARKET PAPER Abstract I study the relationship between CEO optimism and optimal compensation contracts
SCIENCE ARTS AND COMMERCE
 INTERNATIONAL JOURNAL OF SCIENCE ARTS AND COMMERCE EFFECT OF CHIEF EXECUTIVE OFFICER OVER CONFIDENCE ON DIVIDEND POLICY OF COMMERCIAL BANKS IN KENYA ** Dr. Ogilo Fredrick, ** Arwa Ahmed Hassan *Lecturer,
Reading the Tea Leaves: Model Uncertainty, Robust Foreca. Forecasts, and the Autocorrelation of Analysts Forecast Errors
 Reading the Tea Leaves: Model Uncertainty, Robust Forecasts, and the Autocorrelation of Analysts Forecast Errors December 1, 2016 Table of Contents Introduction Autocorrelation Puzzle Hansen-Sargent Autocorrelation
Paying for Financial Flexibility: A Natural Experiment in China
 Paying for Financial Flexibility: A Natural Experiment in China Zhiqiang Wang Weiting Zhang School of Management, Xiamen University ; Development Research Center, Shanghai Stock Exchange wtzhang@sse.com.cn
MAGNT Research Report (ISSN ) Vol.6(1). PP , 2019
 Vol.6(1). PP , 2019") Does the Overconfidence Bias Explain the Return Volatility in the Saudi Arabia Stock Market? Majid Ibrahim AlSaggaf Department of Finance and Insurance, College of Business, University of Jeddah, Saudi
Does the Overconfidence Bias Explain the Return Volatility in the Saudi Arabia Stock Market? Majid Ibrahim AlSaggaf Department of Finance and Insurance, College of Business, University of Jeddah, Saudi
CORPORATE ANNOUNCEMENTS OF EARNINGS AND STOCK PRICE BEHAVIOR: EMPIRICAL EVIDENCE
 CORPORATE ANNOUNCEMENTS OF EARNINGS AND STOCK PRICE BEHAVIOR: EMPIRICAL EVIDENCE By Ms Swati Goyal & Dr. Harpreet kaur ABSTRACT: This paper empirically examines whether earnings reports possess informational
Managerial Overconfidence, Moral Hazard Problems, and
 Managerial Overconfidence, Moral Hazard Problems, and Excessive Life-cycle Debt Sensitivity. Richard Fairchild, School of Management, University of Bath, UK March 27 th, 2009 Abstract We analyse the effects
Corporate cash shortfalls and financing decisions
 Corporate cash shortfalls and financing decisions Rongbing Huang and Jay R. Ritter December 5, 2015 Abstract Immediate cash needs are the primary motive for debt issuances and a highly important motive
Effect of Earnings Growth Strategy on Earnings Response Coefficient and Earnings Sustainability
 European Online Journal of Natural and Social Sciences 2015; www.european-science.com Vol.4, No.1 Special Issue on New Dimensions in Economics, Accounting and Management ISSN 1805-3602 Effect of Earnings
Accepted Manuscript. New product strategies and firm performance: CEO optimism. Sheng-Syan Chen, Chih-Yen Lin, Yun-Ching Tsai
 Accepted Manuscript New product strategies and firm performance: CEO optimism Sheng-Syan Chen, Chih-Yen Lin, Yun-Ching Tsai PII: S1059-0560(16)30259-3 DOI: 10.1016/j.iref.2018.01.021 Reference: REVECO
Further Test on Stock Liquidity Risk With a Relative Measure
 International Journal of Education and Research Vol. 1 No. 3 March 2013 Further Test on Stock Liquidity Risk With a Relative Measure David Oima* David Sande** Benjamin Ombok*** Abstract Negative relationship
Financial Advisors: A Case of Babysitters?
 Financial Advisors: A Case of Babysitters? Andreas Hackethal Goethe University Frankfurt Michael Haliassos Goethe University Frankfurt, CFS, CEPR Tullio Jappelli University of Naples, CSEF, CEPR Motivation
Is the treatment of intergovernmental aid symmetric?
 Applied Economics Letters, 2009, 16, 331 335 Is the treatment of intergovernmental aid symmetric? Steven C. Deller a, * and Craig Maher b a Department of Agricultural and Applied Economics, University
Irrational people and rational needs for optimal pension plans
 Gordana Drobnjak CFA MBA Executive Director Republic of Srpska Pension reserve fund management company Irrational people and rational needs for optimal pension plans CEE Pension Funds Conference & Awards
Analyst Characteristics and the Timing of Forecast Revision
 Analyst Characteristics and the Timing of Forecast Revision YONGTAE KIM* Leavey School of Business Santa Clara University Santa Clara, CA 95053-0380 MINSUP SONG Sogang Business School Sogang University
The Effect of CEO Conservatism on Mergers and Acquisitions Decisions. Dongnyoung Kim 1 9/21/2014
 The Effect of CEO Conservatism on Mergers and Acquisitions Decisions Dongnyoung Kim 1 9/21/2014 Abstract We examine the link between CEOs political ideology conservatism and their firms investment decisions.
Managerial compensation and the threat of takeover
 Journal of Financial Economics 47 (1998) 219 239 Managerial compensation and the threat of takeover Anup Agrawal*, Charles R. Knoeber College of Management, North Carolina State University, Raleigh, NC
The Efficient Market Hypothesis
 Efficient Market Hypothesis (EMH) 11-2 The Efficient Market Hypothesis Maurice Kendall (1953) found no predictable pattern in stock prices. Prices are as likely to go up as to go down on any particular