Investor Presentation October Tom Reeg President and CFO
|
|
|
- Matthew Snow
- 6 years ago
- Views:
Transcription


1 Investor Presentation October 2017 Tom Reeg President and CFO
2 Forward Looking Statements Forward-Looking Statements This presentation includes forward-looking statements within the meaning of Section 27A of the Securities Act of 1933, as amended, and Section 21E of the Securities Exchange Act of 1934, as amended. Forward-looking statements include statements regarding our strategies, objectives and plans for future development or acquisitions of properties or operations, as well as expectations, future operating results and other information that is not historical information. When used in this presentation, the terms or phrases such as anticipates, believes, projects, plans, intends, expects, might, may, estimates, could, should, would, will likely continue, and variations of such words or similar expressions are intended to identify forward-looking statements. Although our expectations, beliefs and projections are expressed in good faith and with what we believe is a reasonable basis, there can be no assurance that these expectations, beliefs and projections will be realized. There are a number of risks and uncertainties that could cause our actual results to differ materially from those expressed in the forward-looking statements which are included elsewhere in this presentation. Such risks, uncertainties and other important factors include, but are not limited to: Eldorado s ability to promptly and effectively integrate the business of Eldorado and Isle and realize synergies resulting from the combined operations; our substantial indebtedness and the impact of such obligations on our operations and liquidity; competition; sensitivity of our operations to reductions in discretionary consumer spending and changes in general economic and market conditions; governmental regulations and increases in gaming taxes and fees in jurisdictions in which we operate; and other risks and uncertainties described in our reports on Form 10-K, Form 10-Q and Form 8-K. In light of these and other risks, uncertainties and assumptions, the forward-looking events discussed in this presentation might not occur. These forward-looking statements speak only as of the date of this presentation, even if subsequently made available on our website or otherwise, and we do not intend to update publicly any forward-looking statement to reflect events or circumstances that occur after the date on which the statement is made, except as may be required by law. Non-GAAP Measures Adjusted EBITDA, a non GAAP financial measure, has been presented as a supplemental disclosure because it is a widely used measure of performance and basis for valuation of companies in our industry and we believe that this non GAAP supplemental information will be helpful in understanding the Company s ongoing operating results. Adjusted EBITDA represents operating income (loss) before depreciation and amortization, stock based compensation, transaction expenses, S-1 expenses, severance expenses and other, which includes equity in income (loss) of unconsolidated affiliates, (gain) loss on the sale or disposal of property, and other regulatory gaming assessments, including the impact of the change in regulatory reporting requirements, to the extent that such items existed in the periods presented. Adjusted EBITDA is not a measure of performance or liquidity calculated in accordance with U.S. GAAP, is unaudited and should not be considered an alternative to, or more meaningful than, net income (loss) as an indicator of our operating performance. Uses of cash flows that are not reflected in Adjusted EBITDA include capital expenditures, interest payments, income taxes, debt principal repayments and certain regulatory gaming assessments, which can be significant. As a result, Adjusted EBITDA should not be considered as a measure of our liquidity. Other companies that provide EBITDA information may calculate EBITDA differently than we do. The definition of Adjusted EBITDA may not be the same as the definitions used in any of our debt agreements. 2
3 Overview 3
4 Key Investment Highlights High quality gaming assets Geographic diversification in attractive markets Strong financial profile Disciplined acquisition and strategic capex Management team with deep gaming industry experience Best-in-class properties located in significant regional gaming markets Pro forma for ISLE acquisition, Eldorado s portfolio comprises gaming properties 1 with approximately 20,000 slot machines and 550 table and poker games Over 6,500 hotel rooms across properties 1 Properties in 15 regional sub-markets pro forma for ISLE acquisition transaction Each market features stable tax and regulatory environments With the ISLE acquisition, Eldorado has achieved significant scale as a regional gaming owner/operator Improved margins pro forma for ISLE acquisition, and potential to further improve through achievable cost synergies and operational improvements Eldorado has effected three major acquisitions since 2014 Testament to management s ability to source transactions and derive synergies from removal of redundant expenses and operational improvement Disciplined capital structure management Ongoing revenue increasing enhancements across a number of properties Executive team has on average 30+ years of industry experience 1) Inclusive of Lake Charles. In August 2016, Isle of Capri agreed to sell Isle of Capri Casino Hotel Lake Charles, a transaction the Company expects to complete in 2017, subject to Louisiana Gaming Board approval and other customary closing conditions. 4
 Cash and cash equivalents of $126.2 million 3 Total debt outstanding of $2.")
 and repay borrowings under term loan facility and related accrued interest")

5 Premier regional gaming operator 20 1 properties in 10 states Approximately 20,000 slot machines and VLTs 550 table games Over 6,500 hotel rooms LTM 6/30/17 combined financials 2 Combined Net revenue of $1.7 billion Combined Adjusted EBITDA of $395 million Balance sheet (as of June 30, 2017) Cash and cash equivalents of $126.2 million 3 Total debt outstanding of $2.3 billion Company Overview On 9/11/17, announced and priced offering of additional $500 million in aggregate principle amount of 6% senior notes due 2025 at issue price equal to 105.5% Proceeds of offering used to repay all outstanding borrowings under revolving credit facility ($78 million as of 9/8/17) and repay borrowings under term loan facility and related accrued interest 1) Inclusive of Lake Charles. In August 2016, Isle of Capri agreed to sell Isle of Capri Casino Hotel Lake Charles, a transaction the Company expects to complete in 2017, subject to Louisiana Gaming Board approval and other customary closing conditions. 2) LTM 6/30/17 Combined Net revenue and Combined Adjusted EBITDA, include results of operations for Isle for the ten month period ended April 30, 2017, the day before ERI acquired Isle on May 1, Combined Adjusted EBITDA also includes $35mm of estimated synergies from the ISLE acquisition. An estimated $30mm run-rate out of $35mm (or $5mm) of announced annual synergies have been realized in the first two months since consolidation (5/1/17 through 6/30/17). The remaining $5mm of run-rate synergies expected to be realized in H The Isle figures included for periods preceding the date that ERI acquired Isle are based on Isle s unaudited internal financial statements for periods corresponding to ERI s fiscal quarters and have not been reviewed by ERI s auditors. Such figures and the combined presentation including periods prior to the date of acquisition do not conform to GAAP or the Securities and Exchange Commission rules for pro forma presentation. 3) Includes restricted cash. 5


6 Timeline Eldorado founded by Donald Carano and Jerry Poncia; Eldorado Hotel and Casino opens Enters into JV with MGM Resorts to build Silver Legacy Acquires Shreveport Casino Acquires MTR Gaming Group in transaction that doubles size of company Acquires remaining 50% interest in Silver Legacy and all of the assets of Circus Circus Reno Acquires Isle of Capri Casinos


7 Diversified Geographic Presence Portfolio Highlights 20 properties ~20,000 slot machines 550 table games Over 6,500 hotel rooms LAKE CHARLES NOTE: In August 2016, Isle of Capri agreed to sell Isle of Capri Casino Hotel Lake Charles, a transaction the Company expects to complete in 2017, subject to Louisiana Gaming Board approval and other customary closing conditions. 7
8 Combined Company has Comparable Operating Metrics with Potential for Further Improvement Combined LTM Net Revenue ($mm) Combined LTM Adjusted EBITDA ($mm) $2,292 $568 $1,696 $1,445 $1,313 $396 $395 2 $365 $ Combined LTM Adjusted EBITDA Margin Combined LTM Adjusted Property-Level EBITDA by region 27.4% 27.3% 24.8% 23.3% % South 21.9% Midwest 31.8% 1 Source: Company filings, reported as of 6/30/2017 1) RRR adjusted to exclude management fee business revenue and EBITDA; assumes all corporate expenses are allocated to Las Vegas operations segment 2) LTM 6/30/17 Combined Net revenue and Combined Adjusted EBITDA, include results of operations for Isle for the ten month period ended April 30, 2017, the day before ERI acquired Isle on May 1, Combined Adjusted EBITDA also includes $35mm of estimated synergies from the ISLE acquisition. An estimated $30mm run-rate out of $35mm (or $5mm) of announced annual synergies have been realized in the first two months since consolidation (5/1/17 through 6/30/17). The remaining $5mm of run-rate synergies expected to be realized in H The Isle figures included for periods preceding the date that ERI acquired Isle are based on Isle s unaudited internal financial statements for periods corresponding to ERI s fiscal quarters and have not been reviewed by ERI s auditors. Such figures and the combined presentation including periods prior to the date of acquisition do not conform to GAAP or the Securities and Exchange Commission rules for pro forma presentation. West 23.1% East 23.2% $400mm LTM 2Q 17 Adj. Property EBITDA 2 8
9 Disciplined Acquisition Strategy Build scale through strategic, cash flow accretive acquisitions MTR (2014) Silver Legacy and Circus Circus Reno (2015) Isle of Capri (2017) Integrate properties and extract meaningful synergies MTR LTM Adjusted EBITDA multiple reduced to mid-5.0x from 7.0x at purchase Silver Legacy and Circus Circus Reno LTM Adjusted EBITDA multiple reduced to 4.9x from 6.4x at purchase Isle of Capri Sellers multiple of 8.8x based on Isle standalone LTM 7/24/16 EBITDA of $194mm Identified $35mm in annual run-rate cost synergies in year 1 Buyers multiple of 7.4x pro forma for estimated cost synergies De-lever Prioritized use of free cash flow Provides company with ability to pursue additional M&A opportunities 9
10 Isle of Capri Acquisition Update Synergy realization focused on: Corporate cost savings (elimination of duplicative functions) Property level cost savings (efficiencies in food and beverage purchasing, marketing rationalization and SG&A reductions) Share best practices across companies to drive operational enhancements Identified $35 million in annual run-rate cost synergies in year 1 Nearly $20 million of annualized synergies realized on day 1 Company has realized more than $30 million of run-rate synergies through June 30, 2017 and expects to surpass the $35 million of previously identified synergies in the second half of the year Potential for further revenue and profitability upside 10
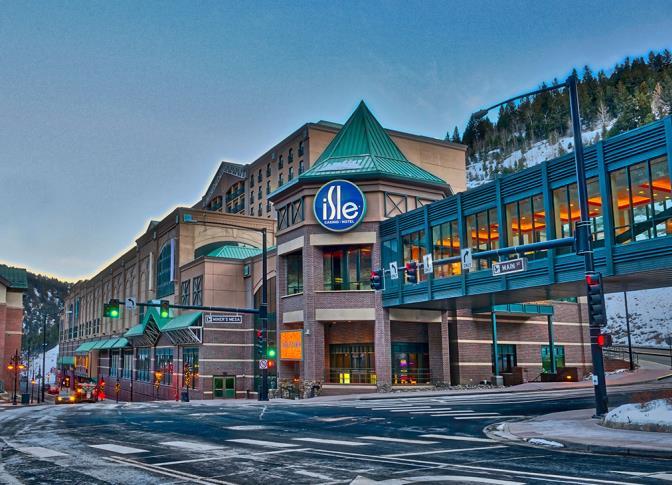
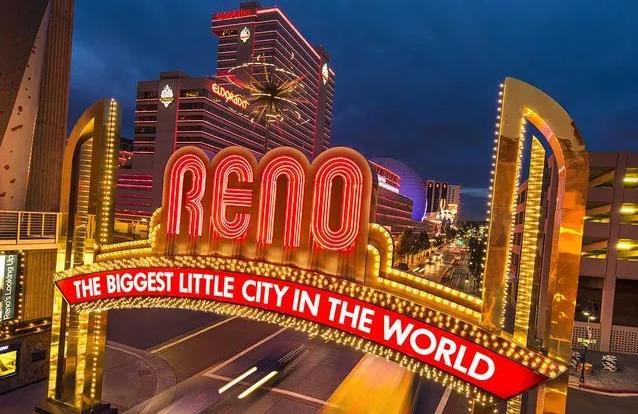
11 Ongoing Enhancements Across Portfolio Focused on continuous re-investment across the property portfolio Current $50mm cap-ex plan across the Reno Tri-Property complex Isle of Capri Food and beverage product across the Isle portfolio is very fresh Black Hawk capital spending in the next months includes casino and public space improvements as well as room renovations Pompano represents the largest potential target of re-investment; Company currently evaluating plans for the property 11
12 Financial Overview 12
13 Financial Policy Balance sheet management Maintain significant liquidity to operate existing properties and pursue expansion opportunities that meet the Company s risk-adjusted return thresholds Limit near-term debt maturities Track record of using free cash flow to pay down debt in the absence of transactions Investment and expansion criteria Continued reinvestment in existing properties to refresh and/or expand amenities Prudent use of capital for potential opportunistic development and acquisition opportunities Near-term focus will be on integration of Isle Free cash flow and leverage Cash from operations used for debt repayment, accretive investments Continue disciplined maintenance and investment capital spending Target long-term leverage below 5x General Maintain broad and expedient access to the capital markets Maintain an open and active dialogue with rating agencies 13
14 Recent Developments and 2Q 2017 Update On May 1, 2017, the Company completed its acquisition of Isle of Capri Casinos, Inc. pursuant to the Agreement and Plan of Merger (the Merger Agreement ) dated as of September 19, 2016 with Isle of Capri Casinos, Inc., a Delaware corporation ( Isle or Isle of Capri ) As of August 1, the Company has executed on $30mm run-rate of its year 1 expected synergies of $35mm Eldorado expects the $134.5 million sale of Isle of Capri Hotel Lake Charles to close later in 2017, subject to regulatory approval, and the Company intends to allocate all of the net proceeds from the sale to debt reduction The operations of Lake Charles has been classified as discontinued operations and as assets held for sale for all periods presented. Solid LTM 2Q 2017 performance with positive momentum in 3Q Q 2017 pro forma combined adjusted EBITDA increased 7.8% year-over-year 2Q 2017 pro forma combined adjusted EBITDA margin increased 230 basis points in the quarter to 23.4% Combined Net Revenue ($ million) 1 Combined Adj. EBITDA ($ million) 1 Combined Adj. EBITDA Margin (%) 1 $438 $427 $93 $ % 21.2% 2Q16 2Q17 2Q16 NOTE: In August 2016, Isle of Capri agreed to sell Isle of Capri Casino Hotel Lake Charles, a transaction the Company expects to complete in 2017, subject to Louisiana Gaming Board approval and other customary closing conditions. As a result the operations of Lake Charles have been classified as discontinued operations. In October 2016, Isle of Capri agreed to sell Lady Luck Marquette to Casino Queen in Swansea, IL. The transaction closed on March 13, ) Figures include results of operations of Isle for the one month ended April 30, 2017, the day before ERI acquired Isle on May 1, Such figures are based on Isle s unaudited internal financial statements for periods corresponding to ERI s fiscal quarters and have not been reviewed by ERI s auditors. Such figures and the combined presentation including periods prior to the date of acquisition do not conform to GAAP or the Securities and Exchange Commission rules for pro forma presentation. 2Q17 2Q16 2Q17 14

15 Appendix 15


16 West Region LTM pro-forma Revenue of $432.2 million LTM pro-forma Adjusted EBITDA of $92.3 million Adjusted EBITDA margin of 21.4% Eldorado Reno Circus Circus Reno Silver Legacy Reno Isle Casino Hotel Black Hawk Lady Luck Casino Black Hawk 814-room hotel Connected via enclosed skywalk to Silver Legacy and Circus Reno 1,142 slot machines 46 table games 11 table poker room 1,571-room hotel Connected via enclosed skywalk to Eldorado Reno and Silver Legacy 695 slot machines 27 table games 1,711-room hotel Connected via enclosed skywalk to Eldorado Reno and Circus Reno 1,212 slot machines 63 table games 238-room hotel Sits on approximately 10- acre site 1,086 slot machines 25 table games 9 table poker room 164-room hotel Sits across intersection from Isle Casino Hotel 455 slot machines 10 table games 5 poker tables 16


17 Midwest Region LTM pro-forma Revenue of $414.8 million LTM pro-forma Adjusted EBITDA of $127.6 million Adjusted EBITDA margin of 30.8% Boonville Cape Girardeau Caruthersville Kansas City Bettendorf Waterloo 140-room hotel 914 slot machines 20 table games 930 slot machines 22 table games 4 poker tables 557 slot machines 9 table games 977 slot machines 18 table games 509-room hotel with 2 towers 969 slot machines 19 table games 195-room hotel 948 slot machines 25 table games 17


18 East Region LTM pro-forma Revenue of $473.2 million LTM pro-forma Adjusted EBITDA of $92.6 million Adjusted EBITDA margin of 19.6% Presque Isle Scioto Downs Mountaineer Nemacolin 1,594 slot machines 32 table games 7 table poker room Live thoroughbred horse racing 118-room third party hotel 2,206 video lottery terminals Live harness racing 354-room hotel 1,510 slot machines 36 table games 10 table poker room Live thoroughbred horse racing Located on 2,000-acre Nemacolin Woodlands Resort 597 slot machines 29 table games 18


19 South Region LTM pro-forma Revenue of $376.1 million LTM pro-forma Adjusted EBITDA of $87.6 million Adjusted EBITDA margin of 23.3% Lula Vicksburg Pompano Eldorado Shreveport 451 rooms spread between two on-site hotels 28-space RV park 885 slot machines 21 table games 89-room hotel 613 slot machines 7 table games 1,446 slot machines 42 table poker room Live harness racing 403-room, all suite hotel 1,387 slot machines 52 table games 8 table poker room 19
20 ($ in thousands) Reconciliation of Operating Income (Loss) to Adjusted EBITDA Three Months Ended June 30, 2017 Operating Income (Loss) Depreciation and Amortization Stock-Based Compensation Transaction Expenses Severance Adjusted Expense Other (3) EBITDA West $16,468 $6,576 $52 $ - $36 $(27) $23,105 Midwest 15,408 4, ,468 South 11,069 4, ,774 East 18,153 8, ,541 Corporate (93,214) 432 1,123 85, (22) (5,917) Total (excluding pre-acquisition) $(32,116) $24,909 $1,305 $85,464 $362 $47 $79,971 West $2,709 $925 $2 $ - $- $4 $3,640 Midwest 10,637 2, ,686 South 3,943 1, ,425 East (197) Corporate (2,550) (22) (1,729) Total (pre-acquisition) (1) $14,542 $4,703 $484 $286 $5 $44 $20,064 West $19,177 $7,501 $54 $- $36 $(23) $26,745 Midwest 26,045 6, ,154 South 15,012 6, ,199 East 17,956 8, ,583 Corporate (95,764) 528 1,584 87, (44) (7,646) Total (including pre-acquisition) (2) $(17,574) $29,612 $1,789 $87,750 $367 $91 $100,035 1) Figures are for Isle for the one month ended April 30, 2017, the day before the Company acquired Isle on May 1, The Company reports its financial results on a calendar fiscal year. Prior to the Company s acquisition of Isle, Isle s fiscal year typically ended on the last Sunday in April. Isle s fiscal 2017 and 2016 were 52-week years, which commenced on April 25, 2016 and April 27, 2015, respectively. Such figures were prepared by the Company to reflect Isles unaudited consolidated historical net revenues and Adjusted EBITDA for periods corresponding to the Company s fiscal quarterly calendar. Such figures are based on the unaudited internal financial statements and have not been reviewed by the Company s auditors and do not conform to GAAP. 2) Total figures for 2016 and 2017 include combined results of operations for Isle and the Company for periods preceding the date that the Company acquired Isle. Such presentation does not conform with GAAP or the Securities and Exchange Commission rules for proforma presentation; however, we believe that the additional financial information will be helpful to investors in comparing current results with results of prior periods. This is non-gaap data and should not be considered a substitute for data prepared in accordance with GAAP, but should be viewed in addition to the results of operations reported by the Company. 3) Other is comprised of (gain) loss on the sale or disposal of property, equity in loss of unconsolidated affiliate and other regulatory gaming assessments. Effective January 1, 2016, the Ohio Lottery Commission enacted a regulatory change which resulted in the establishment of a $1.0 million progressive slot liability and a corresponding decrease in net slot win during the first quarter of The changes are non-cash and related primarily to prior years. 20
21 ($ in thousands) Reconciliation of Operating Income (Loss) to Adjusted EBITDA Three Months Ended June 30, 2016 Operating Income (Loss) Depreciation and Amortization Stock-Based Compensation Transaction Expenses Severance Adjusted Expense Other (3) EBITDA West $13,655 $5,576 $- $ - $- $214 $18,915 Midwest South 5,541 1, (49) 7,456 East 14,934 8, ,039 Corporate (4,475) (49) (3,758) Total (excluding pre-acquisition) $29,655 $15,583 $579 $56 $17 $762 $46,652 West $6,163 $2,122 $12 $ - $- $- $8,297 Midwest 20,387 29, ,224 South 10,131 4, ,343 East (1,215) 1, (124) Corporate (8,464) 344 1, (6,623) Total (pre-acquisition) (1) $27,002 $16,981 $1,388 $- $- $746 $46,117 West $19,818 $7,168 $12 $- $- $214 $27,212 Midwest 20,387 9, ,224 South 15,672 6, (49) 21,799 East 13,719 9, ,915 Corporate (12,939) 458 1, (10,381) Total (including pre-acquisition) (2) $56,657 $32,564 $1,967 $56 $17 $1,508 $92,769 1) Figures are for Isle for the three months ended June 30, Such figures were prepared by the Company to reflect Isle s unaudited consolidated historical net revenues, operating income and Adjusted EBITDA for periods corresponding to the Company s fiscal quarterly calendar. Such figures are based on the unaudited internal financial statements and have not been reviewed by the Company s auditors and do not conform to GAAP. 2) Total figures for 2016 and 2017 include combined results of operations for Isle and the Company for periods preceding the date that the Company acquired Isle. Such presentation does not conform with GAAP or the Securities and Exchange Commission rules for proforma presentation; however, we believe that the additional financial information will be helpful to investors in comparing current results with results of prior periods. This is non-gaap data and should not be considered a substitute for data prepared in accordance with GAAP, but should be viewed in addition to the results of operations reported by the Company. 3) Other is comprised of (gain) loss on the sale or disposal of property, equity in loss of unconsolidated affiliate and other regulatory gaming assessments. Effective January 1, 2016, the Ohio Lottery Commission enacted a regulatory change which resulted in the establishment of a $1.0 million progressive slot liability and a corresponding decrease in net slot win during the first quarter of The changes are non-cash and related primarily to prior years. 21
22 ($ in thousands) Reconciliation of Operating Income (Loss) to Adjusted EBITDA Six Months Ended June 30, 2017 Operating Income (Loss) Depreciation and Amortization Stock-Based Compensation Transaction Expenses Severance Adjusted Expense Other (3) EBITDA West $17,994 $11,219 $52 $ - $196 $(27) $29,434 Midwest 15,408 4, ,468 South 16,987 6, ,624 East 33,195 17, ,619 Corporate (101,551) 581 2,856 87, (22) (10,769) Total (excluding pre-acquisition) $(17,967) $40,513 $3,038 $87,078 $511 $203 $113,376 West $9,525 $3,694 $8 $ - $- $4 $13,231 Midwest 34,819 11, ,856 South 19,165 5, ,918 East (1,072) (120) Corporate (8,811) 371 1, (22) (5,996) Total (pre-acquisition) (1) $53,626 $22,663 $1,716 $286 $554 $44 $78,889 West $27,519 $14,913 $60 $- $196 $(23) $42,665 Midwest 50,227 16, ,324 South 36,152 12, ,542 East 32,123 18, ,499 Corporate (110,362) 952 4,487 87, (44) (16,765) Total (including pre-acquisition) (2) $35,659 $63,176 $4,754 $87,364 $1,065 $247 $192,265 1) Figures are for Isle for the six months ended June 30, Such figures were prepared by the Company to reflect Isle s unaudited consolidated historical net revenues, operating income and Adjusted EBITDA for periods corresponding to the Company s fiscal quarterly calendar. Such figures are based on the unaudited internal financial statements and have not been reviewed by the Company s auditors and do not conform to GAAP. 2) Total figures for 2016 and 2017 include combined results of operations for Isle and the Company for periods preceding the date that the Company acquired Isle. Such presentation does not conform with GAAP or the Securities and Exchange Commission rules for proforma presentation; however, we believe that the additional financial information will be helpful to investors in comparing current results with results of prior periods. This is non-gaap data and should not be considered a substitute for data prepared in accordance with GAAP, but should be viewed in addition to the results of operations reported by the Company. 3) Other is comprised of (gain) loss on the sale or disposal of property, equity in loss of unconsolidated affiliate and other regulatory gaming assessments. Effective January 1, 2016, the Ohio Lottery Commission enacted a regulatory change which resulted in the establishment of a $1.0 million progressive slot liability and a corresponding decrease in net slot win during the first quarter of The changes are non-cash and related primarily to prior years. 22
23 ($ in thousands) Reconciliation of Operating Income (Loss) to Adjusted EBITDA Six Months Ended June 30, 2016 Operating Income (Loss) Depreciation and Amortization Stock-Based Compensation Transaction Expenses (3) Severance Adjusted Expense Other (4) EBITDA West $19,219 $10,509 $- $ - $- $180 $29,908 Midwest South 12,043 3, (50) 15,903 East 28,665 17, ,136 46,944 Corporate (12,010) 225 2, ,461 (49) (7,766) Total (excluding pre-acquisition) $47,917 $31,787 $2,033 $574 $1,461 $1,217 $84,989 West $13,109 $4,292 $26 $ - $- $- $17,427 Midwest 42,867 18, ,636 South 26,179 8, ,483 East (2,543) 2, (376) Corporate (15,520) 796 1, (11,996) Total (pre-acquisition) (1) $64,092 $34,487 $2,020 $- $- $1,575 $102,174 West $32,328 $14,801 $26 $- $- $180 $47,335 Midwest 42,867 18, ,636 South 38,222 12, (50) 50,386 East 26,122 19, ,136 46,568 Corporate (27,530) 1,021 3, , (19,762) Total (including pre-acquisition) (2) $112,009 $66,274 $4,053 $574 $1,461 $2,792 $187,163 1) Figures are for Isle for the six months ended June 30, Such figures were prepared by the Company to reflect Isle s unaudited consolidated historical net revenues, operating income and Adjusted EBITDA for periods corresponding to the Company s fiscal quarterly calendar. Such figures are based on the unaudited internal financial statements and have not been reviewed by the Company s auditors and do not conform to GAAP. 2) Total figures for 2016 and 2017 include combined results of operations for Isle and the Company for periods preceding the date that the Company acquired Isle. Such presentation does not conform with GAAP or the Securities and Exchange Commission rules for proforma presentation; however, we believe that the additional financial information will be helpful to investors in comparing current results with results of prior periods. This is non-gaap data and should not be considered a substitute for data prepared in accordance with GAAP, but should be viewed in addition to the results of operations reported by the Company. 3) Transaction expenses for the six months ended June 30, 2017 represent acquisition costs related to the Isle Acquisition. Transaction expenses for the six months ended June 30, 2016 represent acquisition costs related to the Reno Acquisition and includes a credit of $2.0 thousand related to S-1 offering costs. 4) Other is comprised of (gain) loss on the sale or disposal of property, equity in loss of unconsolidated affiliate and other regulatory gaming assessments. Effective January 1, 2016, the Ohio Lottery Commission enacted a regulatory change which resulted in the establishment of a $1.0 million progressive slot liability and a corresponding decrease in net slot win during the first quarter of The changes are non-cash and related primarily to prior years. 23
24 ($ in thousands) Reconciliation of Operating Income (Loss) to Adjusted EBITDA LTM as of June 30, 2017 Operating Income (Loss) Depreciation and Amortization Stock-Based Compensation Transaction Expenses (3) Severance Adjusted Expense Other (4) EBITDA West $40,394 $20,930 $52 $- $426 $56 $61,858 Midwest 15,408 4, ,468 South 28,322 10, ,919 East 58,140 34, ,509 Corporate (119,031) 837 4,164 95, (28) (18,083) Total (excluding pre-acquisition) $23,233 $72,175 $4,346 $95,686 $1,046 $185 $196,671 West $22,098 $8,303 $20 $- $- $4 $30,425 Midwest 76,217 31, (923) 107,124 South 34,451 14, ,715 East (3,216) 2, (866) Corporate (27,504) 894 4,443 4, (22) (17,502) Total (pre-acquisition) (1) $102,046 $57,408 $4,658 $4,138 $554 ($908) $167,896 West $62,492 $29,233 $72 $- $426 $60 $92,283 Midwest 91,625 36, (916) 127,592 South 62,773 24, ,634 East 54,924 37, ,643 Corporate (146,535) 1,731 8,607 99, (50) (35,585) Total (incl. pre-acquisition) (2) $125,279 $129,583 $9,004 $99,824 $1,600 ($723) $364,567 1) Figures are for Isle for the period July 1, 2016 to April 30, 2017, the day before the Company acquired Isle on May 1, Such figures were prepared by the Company to reflect Isle s unaudited consolidated historical net revenues, operating income and Adjusted EBITDA for periods corresponding to the Company s fiscal quarterly calendar. Such figures are based on the unaudited internal financial statements and have not been reviewed by the Company s auditors and do not conform to GAAP. 2) Total figures for the LTM period ended June 30, 2017, include the combined results of operations for Isle and the Company for periods preceding the date that the Company acquired Isle. Such presentation does not conform with GAAP or the Securities and Exchange Commission rules for pro forma presentation; however, we believe that the additional financial information will be helpful to investors in comparing current results with results of prior periods. This is non-gaap data and should not be considered a substitute for data prepared in accordance with GAAP, but should be viewed in addition to the results of operations reported by the Company. 3) Transaction expenses primarily represent acquisition costs related to the Isle Acquisition. 4) Other is comprised of (gain) loss on the sale or disposal of property, equity in loss of unconsolidated affiliate, preopening, and other regulatory gaming assessments. 24
EX a _1ex99d1.htm EX-99.1 Exhibit 99.1
 EX-99.1 2 a16-17637_1ex99d1.htm EX-99.1 Exhibit 99.1 ISLE OF CAPRI CASINOS, INC. ANNOUNCES FISCAL 2017 FIRST QUARTER RESULTS SAINT LOUIS, MO August 30, Isle of Capri Casinos, Inc. (NASDAQ: ISLE) (the Company
EX a _1ex99d1.htm EX-99.1
 EX-99.1 2 a16-13308_1ex99d1.htm EX-99.1 Exhibit 99.1 ISLE OF CAPRI CASINOS, INC. ANNOUNCES FISCAL 2016 FOURTH QUARTER AND YEAR RESULTS SAINT LOUIS, MO June 14, 2016 Isle of Capri Casinos, Inc. (NASDAQ:
Investor Relations Presentation. Summer 2012
 Investor Relations Presentation Summer 2012 1 Safe Harbor In addition to historical facts or statements of current condition, this presentation contains forward-looking statements within the meaning of
Global Gaming Operators
 19 June 2017 North American Research PRICE TARGETS Raising price target on ERI to $25 (from $23) - Reiterate Buy Raising price target on MCRI to $32 (from $31) - Reiterate Hold KEY TAKEAWAYS Reno local
Isle of Capri Casinos Inc. Rating: Buy
 GAMING Adam Steinberg, CFA 212-218-3756 asteinberg@morganjoseph.com Initiating Coverage January 9, 2006 Key Metrics ISLE - NASDAQ $24.88 Pricing Date 01/06/2006 Price Target $29.00 52-Week Range $31.39-$19.09
Boyd Gaming Acquisition of Valley Forge Casino Resort December 20, 2017
 Boyd Gaming Acquisition of Valley Forge Casino Resort December 20, 2017 Transaction Overview Boyd expands into Pennsylvania, the second largest commercial gaming state in U.S. Including the Pinnacle assets
Merger of Lakes Entertainment and Golden Gaming. January 28, 2015
 Merger of Lakes Entertainment and Gaming January 28, 2015 Safe Harbor / Non-GAAP Financial Disclosures Forward-Looking Statements This presentation includes forward-looking statements within the meaning
Boyd Gaming s Acquisition of Peninsula Gaming
 1 Boyd Gaming s Acquisition of Peninsula Gaming Delivering Growth and Financial Strength May 16, 2012 2 Transformative Transaction Expands Scale, Diversifies Company, Strengthens Financial Profile High
Gaming Investment Forum October 2012
 Gaming Investment Forum October 2012 Safe Harbor/Non-GAAP Financial Disclosures All statements included in this presentation, other than historical information or statements of historical fact, are forward-looking
Sale of Real Estate to Gaming and Leisure Properties, Inc. July 21, 2015
 Sale of Real Estate to Gaming and Leisure Properties, Inc. July 21, 2015 Disclaimer Forward Looking Statements All statements included in this presentation, other than historical information or statements
Saul V. Reibstein Chief Financial Officer
 Saul V. Reibstein Chief Financial Officer 2015 Leveraged Finance Conference December 4, 2015 Safe Harbor In addition to historical facts or statements of current conditions, this presentation contains
GOLDEN ENTERTAINMENT REPORTS 2018 FIRST QUARTER REVENUE OF $214.8 MILLION, NET INCOME OF $3.9 MILLION AND ADJUSTED EBITDA OF $45.
 GOLDEN ENTERTAINMENT REPORTS 2018 FIRST QUARTER REVENUE OF $214.8 MILLION, NET INCOME OF $3.9 MILLION AND ADJUSTED EBITDA OF $45.9 MILLION LAS VEGAS May 9, 2018 Golden Entertainment, Inc. (NASDAQ:GDEN)
J.P. Morgan SMid Cap Conference November 2011
 J.P. Morgan SMid Cap Conference November 2011 Safe Harbor/Non-GAAP Financial Disclosures All statements included in this presentation, other than historical information or statements of historical fact,
WYNN RESORTS CEO UPDATE MARCH 7, 2018
 WYNN RESORTS CEO UPDATE MARCH 7, 2018 FORWARD-LOOKING STATEMENTS This presentation contains forward-looking statements regarding operating trends, future results of operations and the completion of new
Boyd Gaming Acquisition of Pinnacle Entertainment Assets December 18, 2017
 Boyd Gaming Acquisition of Pinnacle Entertainment Assets December 18, 2017 Unique Opportunity to Enhance Shareholder Value Four high quality, well maintained assets in attractive markets Transaction Overview
THIRD QUARTER 2017 EARNINGS
 MGM Resorts International THIRD QUARTER 2017 EARNINGS Investor Presentation November 8, 2017 Forward-Looking Statements Statements in this presentation that are not historical facts are forward-looking
GOLDEN ENTERTAINMENT REPORTS 2018 THIRD QUARTER RESULTS
 GOLDEN ENTERTAINMENT REPORTS 2018 THIRD QUARTER RESULTS Third Quarter Highlights: - Strong Laughlin and Las Vegas Locals Property Performance - Stratosphere Renovations and Capital Plan on Schedule and
Telsey Advisory Group Fall 2011 Consumer Conference September 2011
 Telsey Advisory Group Fall 2011 Consumer Conference September 2011 Safe Harbor/Non-GAAP Financial Disclosures All statements included in this presentation, other than historical information or statements
GOLDEN ENTERTAINMENT REPORTS 2018 FOURTH QUARTER RESULTS
 GOLDEN ENTERTAINMENT REPORTS 2018 FOURTH QUARTER RESULTS Fourth Quarter and Recent Highlights: The Strat Renovations Remain on Budget Completed Acquisition of Colorado Belle and Edgewater in Laughlin Six
Note Important Disclosures on Pages 5-6. Note Analyst Certification on Page 5.
 COMPANY UPDATE / ESTIMATE CHANGE Key Metrics CHDN - NASDAQ (as of 4/26/18) $274.85 Price Target N/A 52-Week Range $162.25 - $285.70 Shares Outstanding (mm) (basic) 14.4 Market Cap. ($mm) $3,958 3-Mo. Average
Las Vegas Operations. Wynn Palace Project in Macau
 Wynn Resorts, Limited Reports Second Quarter 2016 Results LAS VEGAS--(BUSINESS WIRE)--Jul. 28, 2016-- Wynn Resorts, Limited (Nasdaq: WYNN) today reported financial results for the second quarter ended
Penn National Gaming, Inc. Margin Improvement Initiatives
 Penn National Gaming, Inc. Margin Improvement Initiatives Safe Harbor Forward-Looking Statements This presentation contains forward-looking statements within the meaning of the Private Securities Litigation
Wynn Resorts, Limited Reports Third Quarter 2013 Results
 IMMEDIATE RELEASE Wynn Resorts, Limited Reports Third Quarter 2013 Results LAS VEGAS, October 24, 2013 -- Wynn Resorts, Limited (Nasdaq: WYNN) today reported financial results for the third quarter ended
Churchill Downs Incorporated Reports 2018 Fourth Quarter and Full Year Results
 Churchill Downs Incorporated Reports 2018 Fourth Quarter and Full Year Results February 27, 2019 LOUISVILLE, Ky., Feb. 27, 2019 (GLOBE NEWSWIRE) -- Churchill Downs Incorporated (Nasdaq: CHDN) ("CDI" or
UNITED STATES SECURITIES AND EXCHANGE COMMISSION FORM 10-K ISLE OF CAPRI CASINOS, INC.
 (Mark One) UNITED STATES SECURITIES AND EXCHANGE COMMISSION Washington, D.C. 20549 FORM 10-K ANNUAL REPORT PURSUANT TO SECTION 13 OR 15(d) OF THE SECURITIES EXCHANGE ACT OF 1934 For the fiscal year ended
INVESTOR PRESENTATION
 INVESTOR PRESENTATION December 2013 MGAM SAFE HARBOR STATEMENT In addition to historical facts or statements of current conditions, this presentation contains forward-looking statements that are intended
HARRAH S LAS VEGAS TRANSACTION OVERVIEW
 HARRAH S LAS VEGAS TRANSACTION OVERVIEW DISCLAIMERS Forward-Looking Statements Certain statements in this presentation and discussed at investor meetings which this presentation accompanies that are not
MGM RESORTS INTERNATIONAL REPORTS FOURTH QUARTER AND FULL YEAR FINANCIAL AND OPERATING RESULTS. Announces 8% Increase to Quarterly Cash Dividend
 Exhibit 99.1 MGM RESORTS INTERNATIONAL REPORTS FOURTH QUARTER AND FULL YEAR FINANCIAL AND OPERATING RESULTS Announces 8% Increase to Quarterly Cash Dividend Las Vegas, Nevada, February 13, 2019 MGM Resorts
TAG s 8th Annual Spring Consumer Conference. Saul V. Reibstein Chief Financial Officer
 TAG s 8th Annual Spring Consumer Conference Saul V. Reibstein Chief Financial Officer March 22, 2016 Safe Harbor In addition to historical facts or statements of current conditions, this presentation contains
GOLDEN ENTERTAINMENT REPORTS RECORD 2017 FOURTH QUARTER NET REVENUE OF $184.3 MILLION, NET LOSS OF $13.4 MILLION AND ADJUSTED EBITDA OF $29.
 GOLDEN ENTERTAINMENT REPORTS RECORD 2017 FOURTH QUARTER NET REVENUE OF $184.3 MILLION, NET LOSS OF $13.4 MILLION AND ADJUSTED EBITDA OF $29.0 MILLION LAS VEGAS March 15, 2018 Golden Entertainment, Inc.
June Quarter Preview: Casino Operators Still Challenged. Investment Highlights: Companies Featured Buy. Hold. Industry Update.
 GAMING Justin T. Sebastiano (212) 218-3857 jsebastiano@morganjoseph.com Industry Update July 17, 2008 Companies Featured Buy Full House Resorts, Inc. (FLL - $1.75 - AMEX) EPS ($) 0.02 0.09 0.23 P/E 87.5x
MGM Resorts International Reports Third Quarter Financial And Operating Results
 NEWS RELEASE MGM Resorts International Reports Third Quarter Financial And Operating Results 10/30/2018 LAS VEGAS, Oct. 30, 2018 /PRNewswire/ -- MGM Resorts International (NYSE: MGM) ("MGM Resorts" or
AFFINITY GAMING ANNOUNCES THREE AND TWELVE MONTHS RESULTS FOR THE PERIOD ENDED DECEMBER 31, 2011
 AFFINITY GAMING ANNOUNCES THREE AND TWELVE MONTHS RESULTS FOR THE PERIOD ENDED DECEMBER 31, 2011 Las Vegas, NV April 3, 2012 Affinity Gaming, LLC (the Company ) today announced results for the three and
Gaming and Leisure Properties, Inc.
 Gaming and Leisure Properties, Inc. February 25, 2014 1 Gaming & Leisure Properties Inc. Safe Harbor In addition to historical facts or statements of current conditions, this presentation contains forward-looking
PENN NATIONAL GAMING. Jefferies Gaming, Lodging, Media & Entertainment Conference
 PENN NATIONAL GAMING Jefferies Gaming, Lodging, Media & Entertainment Conference SAFE HARBOR In addition to historical facts or statements of current conditions, this presentation contains forward-looking
PENN NATIONAL GAMING. JPMorgan Gaming, Lodging & Restaurant Conference
 PENN NATIONAL GAMING JPMorgan Gaming, Lodging & Restaurant Conference SAFE HARBOR In addition to historical facts or statements of current conditions, this presentation contains forward-looking statements
Churchill Downs Incorporated Reports 2018 Third Quarter Results
 Churchill Downs Incorporated Reports 2018 Third Quarter Results October 31, 2018 LOUISVILLE, Ky., Oct. 31, 2018 (GLOBE NEWSWIRE) -- Churchill Downs Incorporated (Nasdaq: CHDN) ("CDI" or the "Company")
Q Earnings Report. Sabre Corporation August 4, 2015
 Q2 2015 Earnings Report Sabre Corporation August 4, 2015 1 Forward-looking Statements Forward Looking Statements Certain statements herein are forward-looking statements about trends, future events, uncertainties
MGM RESORTS INTERNATIONAL REPORTS FIRST QUARTER FINANCIAL AND OPERATING RESULTS
 Exhibit 99.1 MGM RESORTS INTERNATIONAL REPORTS FIRST QUARTER FINANCIAL AND OPERATING RESULTS CityCenter announces agreement to sell Mandarin Oriental Las Vegas for approximately $214 million Las Vegas,
MOHEGAN GAMING & ENTERTAINMENT ANNOUNCES SECOND QUARTER FISCAL 2018 OPERATING RESULTS
 MOHEGAN GAMING & ENTERTAINMENT ANNOUNCES SECOND QUARTER FISCAL 2018 OPERATING RESULTS Uncasville, Connecticut, May 3, 2018 Mohegan Gaming & Entertainment, or MGE, the owner and operator of Mohegan Sun
Investor Update November 2018 CAESARS ENTERTAINMENT CORPORATION
 Investor Update November 2018 CORPORATION Forward Looking Statements Certain information in this presentation constitutes forward-looking information within the meaning of the Private Securities Litigation
Investor Presentation. May 2016
 Investor Presentation May 2016 Forward Looking Statements and Financial Information Forward-Looking Statements This presentation includes forward-looking statements regarding future events and future results
Safe Harbor Statement
 January 3, 2018 Safe Harbor Statement Statements in this presentation that are not historical, are forward-looking statements made pursuant to the safe harbor provisions of the Private Securities Litigation
INVESTOR PRESENTATION CAESARS ENTERTAINMENT
 INVESTOR PRESENTATION CAESARS ENTERTAINMENT SAFE HARBOR STATEMENT Disclaimer Certain information in this presentation and discussed at the conference at which these materials will be presented constitutes
Q Results Presentation
 Q3 2018 Results Presentation 1 This presentation contains statements that constitute forward-looking statements which involve risks and uncertainties, including such risks and uncertainties detailed in
Penn National Gaming to Acquire Pinnacle Entertainment
 Penn National Gaming to Acquire Pinnacle Entertainment Pinnacle Shareholders to Receive $20.00 Per Share in Cash and 0.42 Shares of Penn National Common Stock for Each Pinnacle Share in Transaction Valued
Click to edit Master title style
 NASDAQ: CNSL CONSOLIDATED COMMUNICATIONS INVESTOR PRESENTATION April 2018 SAFE HARBOR The Securities and Exchange Commission ( SEC ) encourages companies to disclose forward-looking information so that
Investor Update March 2018
 Investor Update March 2018 Forward-looking Statements / Regulation G This presentation may contain statements that are "forward-looking statements" within the meaning of the safe harbor provisions of the
1Q 2017 EARNINGS PRESENTATION MAY 10, 2017
 1Q 2017 EARNINGS PRESENTATION MAY 10, 2017 Real Industry, Inc. 17 State Street, Suite 3811, New York, NY 10004 www.realindustryinc.com Real Alloy, Inc. 3700 Park East Dr., Suite 300, Beachwood, OH 44122
Investor Presentation
 Investor Presentation March 2017 Forward-Looking Statements Statements in this presentation that are not historical facts are "forward-looking" statements and "safe harbor statements" within the meaning
Q4 and Full Year 2017 Financial Results. February 16, 2018
 Q4 and Full Year 2017 Financial Results February 16, 2018 Safe Harbor Language and Reconciliation of Non-GAAP Measures This presentation contains certain forward-looking statements within the meaning of
Investor Presentation. Results of operations For the period ended September 30, 2017
 Investor Presentation Results of operations For the period ended September 30, 2017 Disclaimer Forward-Looking Statements; Non-GAAP Financial Measures Throughout this presentation we make forward-looking
Wynn Resorts, Limited Reports Third Quarter 2017 Results
 IMMEDIATE RELEASE Wynn Resorts, Limited Reports Third Quarter 2017 Results LAS VEGAS, October 26, 2017 Wynn Resorts, Limited (Nasdaq: WYNN) today reported financial results for the third quarter ended
Colony NorthStar Credit Real Estate, Inc. Supplemental Financial Report First Quarter 2018 May 8, 2018
 Colony NorthStar Credit Real Estate, Inc. Supplemental Financial Report First Quarter 2018 May 8, 2018 Cautionary Statement Regarding Forward-Looking Statements This presentation may contain forward-looking
First Quarter 2017 Results. May 2, 2017
 First Quarter 2017 Results May 2, 2017 Cautionary Statement Regarding Forward-Looking Statements This quarterly presentation includes forward-looking statements within the meaning of Section 27A of the
Caesars Entertainment Reports Strong Financial Results for the Third Quarter of 2017
 Exhibit 99.1 Contact: Media Investors Stephen Cohen Joyce Arpin (347) 489-6602 (702) 880-4707 Caesars Entertainment Reports Strong Financial Results for the Third Quarter of 2017 LAS VEGAS, November 1,
4Q & FY 2017 Earnings
 4Q & FY 2017 Earnings C A E S A R S E N T E R T A I N M E N T C O R P O R A T I O N M A R C H 7, 2 0 1 8 1 Forward Looking Statements Certain information in this presentation and discussed on the conference
Las Vegas Sands Reports Fourth Quarter 2017 Results. For the Quarter Ended December 31, 2017 (Compared to the Quarter Ended December 31, 2016)
") Exhibit 99.1 Las Vegas Sands Reports Fourth Quarter 2017 Results For the Quarter Ended December 31, 2017 (Compared to the Quarter Ended December 31, 2016) - Consolidated Net Revenue Increased 11.7% to
Exhibit 99.1 Las Vegas Sands Reports Fourth Quarter 2017 Results For the Quarter Ended December 31, 2017 (Compared to the Quarter Ended December 31, 2016) - Consolidated Net Revenue Increased 11.7% to
JEFFERIES GAMING, LODGING, MEDIA & ENTERTAINMENT CONFERENCE WYNN LAS VEGAS HOTEL May 8 10, 2006
 JEFFERIES GAMING, LODGING, MEDIA & ENTERTAINMENT CONFERENCE WYNN LAS VEGAS HOTEL May 8 10, 2006 Safe Harbor Statement All statements contained in this presentation that are not historical facts are based
NEWS RELEASE INTERNATIONAL GAME TECHNOLOGY PLC REPORTS SECOND QUARTER 2015 RESULTS
 NEWS RELEASE INTERNATIONAL GAME TECHNOLOGY PLC REPORTS SECOND QUARTER 2015 RESULTS Adjusted EBITDA of $427 million and adjusted earnings per share of $0.35; GAAP earnings per share of ($0.59) Pro forma
Merger of EMBARQ. October 27, 2008
 Merger of CenturyTel and EMBARQ October 27, 2008 1 Safe Harbor Language Included in our presentation are certain estimates and other forward-looking statements. They are subject to uncertainties that could
Supplemental Financial Report Second Quarter August 7, 2018
 Supplemental Financial Report Second Quarter 2018 August 7, 2018 1 CAUTIONARY STATEMENT REGARDING FORWARD-LOOKING STATEMENTS This presentation may contain forward-looking statements within the meaning
M G M R E S O R T S I N T E R N A T I O N A L SUPPLEMENTAL SLIDES REVENUE RECOGNITION
 M G M R E S O R T S I N T E R N A T I O N A L SUPPLEMENTAL SLIDES REVENUE RECOGNITION 2018 M GM RESORTS INTERNATIONAL N E W R E V E N U E R E C O G N I T I O N A C C O U N T I N G S T A N D A R D As disclosed
Acquisition of. February 23, 2017
 Acquisition of February 23, 2017 Safe Harbor Certain statements in this presentation may constitute forward-looking statements within the meaning of the Private Securities Litigation Reform Act of 1995,
Quarterly Investor Presentation. First Quarter 2017
 Quarterly Investor Presentation First Quarter 2017 Forward Looking Statements This presentation contains statements about future events and expectations that constitute forward looking statements. These
Goldman Sachs 2012 Leveraged Finance Healthcare Conference MATTHEW WALSH SVP FINANCE & CFO
 Goldman Sachs 2012 Leveraged Finance Healthcare Conference MATTHEW WALSH SVP FINANCE & CFO 05.01.2012 Forward Looking Statements This presentation contains both historical and forward-looking statements.
BORGATA HOTEL CASINO & SPA QUARTERLY REPORT
 BORGATA HOTEL CASINO & SPA QUARTERLY REPORT FOR THE QUARTER ENDED SEPTEMBER 30, 2011 SUBMITTED TO THE DIVISION OF GAMING ENFORCEMENT OF THE STATE OF NEW JERSEY OFFICE OF FINANCIAL INVESTIGATIONS REPORTING
Driven to Create Value Goldman Sachs 2017 Global Energy Conference January 2017
 Driven to Create Value Goldman Sachs 2017 Global Energy Conference January 2017 2015 Corporation. All Rights Reserved. Forward Looking Statements On November 17, 2016, we announced our plans to acquire
Las Vegas Sands Reports All-Time Record Quarterly Results. For the quarter ended March 31, 2013 compared to the quarter ended March 31, 2012:
 Press Release Las Vegas Sands Reports All-Time Record Quarterly Results For the quarter ended 2013 compared to the quarter ended 2012: Net Revenue Increased 19.5% to a Record $3.30 Billion Consolidated
Caesars Entertainment Reports Strong Financial Results for the Third Quarter of 2017
 November 1, 2017 Caesars Entertainment Reports Strong Financial Results for the Third Quarter of 2017 LAS VEGAS, Nov. 1, 2017 /PRNewswire/ -- Caesars Entertainment Corporation (NASDAQ: CZR) ("CEC") today
MGM Resorts International (Exact name of registrant as specified in its charter)
") UNITED STATES SECURITIES AND EXCHANGE COMMISSION Washington, D.C. 20549 FORM 8-K CURRENT REPORT PURSUANT TO SECTION 13 OR 15(d) OF THE SECURITIES EXCHANGE ACT OF 1934 Date of report (Date of earliest event
UNITED STATES SECURITIES AND EXCHANGE COMMISSION Washington, D.C. 20549 FORM 8-K CURRENT REPORT PURSUANT TO SECTION 13 OR 15(d) OF THE SECURITIES EXCHANGE ACT OF 1934 Date of report (Date of earliest event
MYERS INDUSTRIES, INC. MARCH 9, 2017 FOURTH QUARTER & FULL YEAR EARNINGS PRESENTATION
 MYERS INDUSTRIES, INC. MARCH 9, 2017 FOURTH QUARTER & FULL YEAR EARNINGS PRESENTATION SAFE HARBOR STATEMENT Statements in this presentation concerning the Company s goals, strategies, and expectations
Deutsche Bank Leveraged Finance Conference September 2014
 Deutsche Bank Leveraged Finance Conference September 2014 Forward Looking Statements This presentation contains forward-looking statements regarding operating trends, future results of operations and the
MOHEGAN GAMING & ENTERTAINMENT ANNOUNCES FOURTH QUARTER AND FISCAL YEAR 2018 OPERATING RESULTS
 MOHEGAN GAMING & ENTERTAINMENT ANNOUNCES FOURTH QUARTER AND FISCAL YEAR 2018 OPERATING RESULTS Uncasville, Connecticut, December 6, 2018 Mohegan Gaming & Entertainment ( MGE or the Company ), a master
Las Vegas Sands Reports Fourth Quarter and Full Year 2016 Results
 Press Release Las Vegas Sands Reports Fourth Quarter and Full Year 2016 Results For the Quarter Ended December 31, 2016 (Compared to the Quarter Ended December 31, 2015) Consolidated Net Revenue Increased
Virtu Financial Agrees to Acquire KCG Holdings Creating the Leading Global Electronic Market Making and Agency Execution Firm
 Virtu Financial Agrees to Acquire KCG Holdings Creating the Leading Global Electronic Market Making and Agency Execution Firm April 20, 2017 Disclaimer CAUTIONARY STATEMENT REGARDING FORWARD LOOKING STATEMENTS
I N V E S T O R P R E S E N TAT I O N N O V E M B E R U P D AT E A STRATEGY OF DYNAMIC GROWTH
 I N V E S T O R P R E S E N TAT I O N N O V E M B E R 2 0 1 7 U P D AT E A STRATEGY OF DYNAMIC GROWTH FORWARD-LOOKING STATEMENTS Certain statements in this Investor Presentation may be regarded as "forward-looking
Third Quarter Presentation
 Third Quarter Presentation November 6, 2018 Presented by: Jerry Volas, CEO Robert Buck, President & COO John Peterson, CFO SAFE HARBOR Statements contained in this presentation that are not historical
Empire Resorts, Inc.
 Empire Resorts, Inc. May 18, 2017 Forward looking statements This presentation contains forward-looking statements. These statements include statements about our plans, strategies, financial performance,
Las Vegas Sands Corp. Reports Third Quarter 2009 Results
 Press Release Las Vegas Sands Corp. Reports Third Quarter 2009 Results Consolidated Adjusted Property EBITDAR Increases 11.7 percent to $272.3 Million on Net Revenue Increase of 3.2 percent Venetian Macao
OMEGA HEALTHCARE INVESTORS, INC. FUNDS FROM OPERATIONS Unaudited (In thousands, except per share amounts)
") OMEGA HEALTHCARE INVESTORS, INC. FUNDS FROM OPERATIONS (In thousands, except per share amounts) Net income... $ 68,157 Add back loss from real estate dispositions... 622 Sub-total... $ 68,779 Elimination
OMEGA HEALTHCARE INVESTORS, INC. FUNDS FROM OPERATIONS (In thousands, except per share amounts) Net income... $ 68,157 Add back loss from real estate dispositions... 622 Sub-total... $ 68,779 Elimination
Building a Platform for Growth. December 2016
 Building a Platform for Growth December 2016 Forward Looking Statements This presentation includes forward-looking statements about the plans, strategies, objectives, goals or expectations of SpartanNash
Service Solutions Divestiture. January 24, 2012
 Service Solutions Divestiture January 24, 2012 January 2012 1 1 Certain statements contained in this presentation that are not historical facts, including any statements as to future market conditions,
Table 4.4 States with Gaming
 Table 4.4 States with Gaming Commercial Native Horse Dog State Casinos American Racetracks Racetracks Total Alabama - - - 3 3 Arizona - 20 3 3 26 Arkansas - - 1 1 2 California - 44 15-59 Colorado 41 2
Investor Update. First Quarter 2015
 Investor Update First Quarter 2015 May 5, 2015 Safe Harbor Statement Forward-Looking Language This report contains forward-looking statements, related to future, not past, events. Forward-looking statements
Daseke, Inc. Q Earnings Presentation
 Daseke, Inc. Q2 2018 Earnings Presentation August 9, 2018 Important Disclaimers Forward-Looking Statements This presentation includes forward-looking statements within the meaning of the safe harbor provisions
INVESTOR PRESENTATION RESULTS OF OPERATIONS FOR THE PERIOD ENDED JUNE 30, 2018
 INVESTOR PRESENTATION RESULTS OF OPERATIONS FOR THE PERIOD ENDED JUNE 30, 2018 Disclaimer Forward-Looking Statements; Non-GAAP Financial Measures This presentation contains forward-looking statements within
Hexion Inc. Announces Fourth Quarter and Fiscal Year 2017 Results
 Hexion Inc. 180 East Broad Street Columbus, OH 43215 hexion.com NEWS RELEASE FOR IMMEDIATE RELEASE Hexion Inc. Announces Fourth Quarter and Fiscal Year 2017 Results Fourth Quarter 2017 Highlights Net sales
DUKE REALTY CORPORATION AGREEMENTS TO SELL MEDICAL OFFICE BUSINESS AND PORTFOLIO MAY 1, 2017
 DUKE REALTY CORPORATION AGREEMENTS TO SELL MEDICAL OFFICE BUSINESS AND PORTFOLIO MAY 1, 2017 RELIABLE. ANSWERS. 33 Logistics Park 1610 Lehigh Valley, PA Forward-Looking Statement This slide presentation
FINANCIAL OVERVIEW AL M I S T Y S Y N
 FINANCIAL OVERVIEW AL MISTYSYN SENIOR VICE PRESIDENT, FINANCE & CHIEF FINANCIAL OFFICER Forward-Looking Statement The presentations today will contain certain forward-looking statements," within the meaning
In June 2017, the Company opened the casino in the Hilton Warsaw Hotel and Conference Centre in Warsaw, Poland.
 PRESS RELEASE August 7, 2017 Century Casinos, Inc. Announces Second Quarter 2017 Results Colorado Springs, Colorado August 7, 2017 Century Casinos, Inc. (NASDAQ Capital Market : CNTY) today announced its
Consolidated Communications Investor Presentation. August 2018
 Consolidated Communications Investor Presentation August 2018 Safe Harbor The Securities and Exchange Commission ( SEC ) encourages companies to disclose forward-looking information so that investors can
Acquisition of. June 20, 2016
 Acquisition of June 20, 2016 Safe Harbor Certain statements in this presentation may constitute forward-looking statements within the meaning of the Private Securities Litigation Reform Act of 1995, as
2017 Portfolio Enhancements
 2017 Portfolio Enhancements October 2017 Hyatt Regency Scottsdale Resort & Spa at Gainey Ranch Scottsdale, AZ Royal Palms Resort & Spa Phoenix, AZ The Ritz-Carlton Pentagon City Arlington, VA Hyatt Regency
NEWS RELEASE INTERNATIONAL GAME TECHNOLOGY PLC REPORTS SECOND QUARTER 2018 RESULTS
 NEWS RELEASE INTERNATIONAL GAME TECHNOLOGY PLC REPORTS SECOND QUARTER 2018 RESULTS Adjusted EBITDA outlook confirmed at $1,700 - $1,780 million, despite approximately $26 million of negative currency translation,
istar Annual Report 2016
 istar Annual Report 2016 Annual Report 2016 2016 was a year of tangible progress for istar. The company set out to grow its earnings, capture unrecognized value and build a foundation for improved shareholder
CPI Card Group Inc. Reports Fourth Quarter and Full Year 2015 Results
 CPI Card Group Inc. Reports Fourth Quarter and Full Year 2015 Results Fourth Quarter Net Sales of $93.6 million and Pro Forma Adjusted Diluted EPS of $0.16 Initiates Quarterly Dividend Announces 2016 Financial
Forward-Looking Statements
 Sagicor Transaction 2018 Forward-Looking Statements This presentation may contain forward-looking statements within the meaning of Section 27A of the Securities Act of 1933 and Section 21E of the Securities
Acquisition of Tribune Media Company. Enhancing Nexstar s Position as North America s Leading Local Media Company
 Acquisition of Tribune Media Company Enhancing Nexstar s Position as North America s Leading Local Media Company D e c e m b e r 3, 2018 Disclaimer Forward-Looking Statements This Presentation includes
 PRESS RELEASE View printer-friendly version