2014 F-22 Raptor Fighter Jet
|
|
|
- Cecil Park
- 6 years ago
- Views:
Transcription


1 NOVEMBER 10th, 2014


2 1903-Wright Brothers 1917-First Metal Plane 2014 F-22 Raptor Fighter Jet st Jet Engine st plane nearly undetectable by radar

3 Marcellus Shale/Utica NG production from Pennsylvania to West Virginia exceeded 16 billion cubic feet per day in September 2014 Accounts for approximately 40% of US shale-gas production EIA projects gas is on track to supply entire winter for PA and six other states in next several years Rising production has outpaced growth resulting in many expansion projects If Marcellus were a country it would be ranked in the top 5 in the world in gas and oil production Maykuth, Andrew. Marcellus gas production up tenfold in five years. 7 Aug Online. Internet:
4

5 August outlook raises the projection for total marketed production in 2014 by 800 million cubic feet a day to 73.9 EIA production survey indicates strong growth in lower 48 states with continued gains Marcellus Shale/Utica has contributed to lower natural gas prices in the northeast New infrastructure is proposed to take gas to markets in all directions "U.S. Oil & Gas Production Still Rising. The American Oil & Gas Reporter. Sept. 2014: 44-48
6


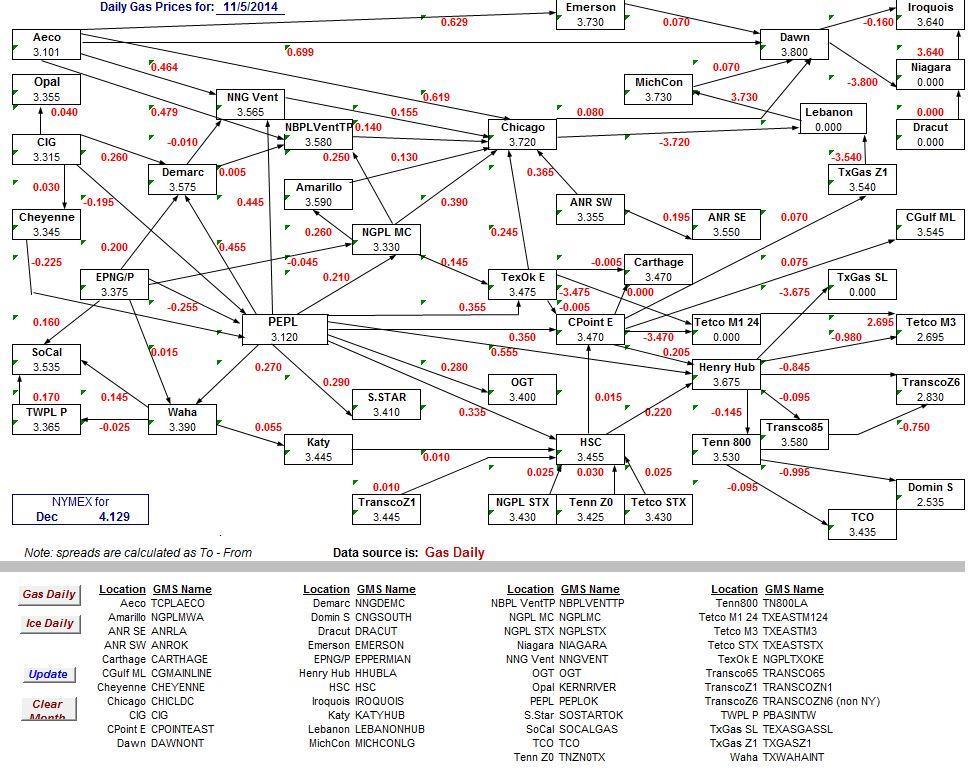
7 This map shows NG flows and production changes along pipeline corridors from 2012 to Green arrows represent an increase from 2012, orange arrows represent a decline from Circles represent increases at shale gas production areas. Gas located in the Northeast corridor is often a cheaper source of NG for major Northeast demand centers.
 dlord. \"What drives natural gas prices.\" 20 Sept.")
8 Huge supplies of newly drilled gas are being made available due to technological advances The impact of all this on the price of natural gas is somewhat predictable More supply and relatively flat demand have meant lower prices For historical perspective NYMEX Henry Hub ping-ponged between $2.00 and $6.00 per MMBTU in the shale era ( ) dlord. "What drives natural gas prices." 20 Sept Online. Internet:
9 Example: Dominion South hub is a key transporter in southwest Pennsylvania Average of 1.65BCF/day currently, up from 290,000 in 2009 The switch reflects the boom in shale gas production, and growing recognition that pricing all U.S. gas at a single hub no longer makes sense The industry is struggling to build new pipelines and infrastructure quick enough to even out price differences in regions like the Northeast DiSavino, Scott. "Henry Hub, king of U.S. natural gas trade, losing crown to Marcellus." 25 Sept Online. Internet:
10 MORE PIPES COULD NARROW SPREAD Gas prices in the Northeast are lower than gas from the Gulf Coast, this crossover point has occurred since the fall of 2011, in August of 2013 it really hit home with DTI Basis going negative Next day gas at Dominion South went from 21 cents per MMBtu over Henry Hub during summer of 2009 to $1.90 under Henry Hub in the summer of 2014 Next day Dominion South, hit a 13 year low of $1.72 per MMBtu to average $2.66 this summer (2014), the lowest since 2001 Current winter 2014/2015 basis trading at summer 2015 prices This has not been the historical norm DiSavino, Scott. "Henry Hub, king of U.S. natural gas trade, losing crown to Marcellus." 25 Sept Online. Internet:
11
12 Inside FERC, Gas Market Report - Selected Pipelines, History of Index Prices MMBtu (FOM spot prices, delivered to pipeline, dry) Columbia Gas Transmission Corp. (Appalachia) Index/Basis Differential (BD) Jan Feb Mar Apr May Jun Jul Aug Sep Oct Nov Dec Avg $ 7.42 $ 8.29 $ 9.38 $ $ $ $ $ 9.63 $ 8.59 $ 7.68 $ 6.74 $ 7.13 $ $ 6.44 $ 4.85 $ 4.32 $ 3.87 $ 3.58 $ 3.66 $ 4.10 $ 3.48 $ 2.91 $ 3.77 $ 4.47 $ 4.66 $ $ 6.05 $ 5.53 $ 5.00 $ 3.99 $ 4.40 $ 4.31 $ 4.85 $ 4.91 $ 3.70 $ 3.91 $ 3.36 $ 4.41 $ $ 4.38 $ 4.47 $ 3.90 $ 4.36 $ 4.50 $ 4.46 $ 4.48 $ 4.45 $ 3.90 $ 3.77 $ 3.56 $ 3.41 $ $ 3.11 $ 2.66 $ 2.45 $ 2.19 $ 2.07 $ 2.43 $ 2.75 $ 3.01 $ 2.58 $ 3.01 $ 3.50 $ 3.76 $ BD $ $ (0.018) $ $ (0.001) $ $ $ (0.024) $ 0 $ (0.054) $ (0.013) $ $ $ 3.33 $ 3.23 $ 3.47 $ 4.03 $ 4.19 $ 4.19 $ 3.67 $ 3.44 $ 3.52 $ 3.45 $ 3.51 $ 3.75 $ BD $ (0.024) $ $ $ $ $ $ (0.037) $ (0.019) $ (0.047) $ $ $ (0.068) 2014 $ 4.23 $ 5.61 $ 4.92 $ 4.49 $ 4.72 $ 4.58 $ 4.33 $ 3.76 $ 3.94 $ BD $ (0.177) $ $ $ (0.094) $ (0.075) $ (0.039) $ (0.070) $ (0.048) $ (0.017) Dominion Transmission Inc. (Appalachia) Index/Basis Differential (BD) Jan Feb Mar Apr May Jun Jul Aug Sep Oct Nov Dec Avg $ 7.73 $ 8.53 $ 9.45 $ $ $ $ $ 9.87 $ 8.67 $ 7.60 $ 6.83 $ 7.45 $ $ 6.61 $ 5.03 $ 4.44 $ 3.94 $ 3.65 $ 3.78 $ 4.18 $ 3.57 $ 2.93 $ 3.78 $ 4.57 $ 4.75 $ $ 6.21 $ 5.57 $ 5.10 $ 4.03 $ 4.46 $ 4.35 $ 4.87 $ 4.94 $ 3.70 $ 3.91 $ 3.42 $ 4.48 $ $ 4.57 $ 4.52 $ 3.93 $ 4.46 $ 4.56 $ 4.48 $ 4.49 $ 4.49 $ 3.90 $ 3.84 $ 3.61 $ 3.53 $ $ 3.16 $ 2.64 $ 2.47 $ 2.20 $ 2.07 $ 2.44 $ 2.74 $ 2.99 $ 2.52 $ 2.96 $ 3.47 $ 3.77 $ BD $ $ (0.038) $ $ $ $ $ (0.034) $ (0.020) $ (0.114) $ (0.063) $ (0.011) $ $ 3.22 $ 3.13 $ $ 3.41 $ 4.03 $ 4.10 $ 3.43 $ 2.95 $ 3.17 $ 3.25 $ 3.24 $ 3.31 $ BD $ (0.134) $ (0.096) $ 0 $ (0.566) $ (0.122) $ (0.048) $ (0.277) $ (0.509) $ (0.397) $ (0.248) $ (0.256) $ (0.508) 2014 $ 3.46 $ 5.36 $ 4.57 $ 4.20 $ 4.01 $ 3.31 $ 2.88 $ 2.40 $ 2.05 $ BD $ (0.947) $ (0.197) $ (0.285) $ (0.384) $ (0.785) $ (1.309) $ (1.520) $ (1.408) $ (1.907) Texas Eastern M2 Receipts / Basis Differential (BD) Jan Feb Mar Apr May Jun Jul Aug Sep Oct Nov Dec Avg $2.94 $3.48 $ BD $(0.083) $ $ $3.37 $ 3.24 $ 3.44 $ 3.97 $ 4.10 $ 4.05 $ 3.50 $ 3.13 $ 3.22 $ 3.27 $ 3.22 $ 3.43 $ BD $ $ $ $ (0.006) $ (0.052) $ (0.098) $(0.207) $ (0.329) $(0.347) $(0.228) $ (0.276) $(0.388) 2014 $ 3.89 $ 5.56 $ 4.71 $ 4.20 $ 3.87 $ 3.17 $ 2.90 $ 2.42 $ 2.03 $ BD $ (0.517) $ $ (0.145) $ (0.384) $ (0.925) $ (1.449) $(1.500) $ (1.388) $(1.927)
13 ACTUAL BASIS CONTRACT PRICES Effective for Regional Hospitals in Pennsylvania served via National Fuel Gas Distribution Multiple Accounts seasonal Load Factor ~ 3:1 TERM November 2008 April 2009 May 2009 June 2009 July 2009 June 2010 July 2010 October 2010 November 2010 March 2011 April 2011 June 2011 July 2011 June 2012 July 2012 June 2013 July 2013 June 2014 July 2014 June 2017 BASIS $0.816 $0.425 $0.775 $0.290 $0.690 $0.290 $0.456 $0.180 ($0.300) ($1.043)
14 DELIVERED END USER PRICE TO National Fuel Gas Distribution Load Factor (LF) 12 Month Forward NYMEX Daily settlement on 15-Oct-2014 = Current DTI 100% LF =($1.389) NFG Supply Corp. (NFGS) = $2.401 NFGS Fuel & Shrink 1.40% = $0.034 NFGS EFT Unit Transport Rate = NFG Distribution Corp. PA = $2.582
15 DELIVERED END USER PRICE TO National Fuel Gas Distribution Load Factor (LF) 12 Month Forward NYMEX Daily settlement on 15-Oct-2014 = $3.810 Current DTI 50% LF =($1.382) NFG Supply Corp. (NFGS) = $2.428 NFGS Fuel & Shrink 1.40% = $0.034 NFGS EFT Unit Transport Rate = END USER NFG Distribution Corp. PA = $2.609
16 A decade ago The Gulf of Mexico produced about 20 percent of all U.S. natural gas Appalachia accounted for.07 percent of U.S. production Much of which flowed through Henry Hub Five years ago Marcellus/Utica barely produced 2 billion cubic of gas per day U.S. shale gas and a combination of fracing and horizontal drilling technologies has brought massive volumes of gas inexpensively out of once ignored fields Today Marcellus/Utica accounts for approximately 17.1 BCF/day, which equates to about 19 percent of the nations supply The Gulf of Mexico now only produces 4 percent of the nations total The Marcellus/Utica production increased 845percent in 5 years, this is totally unprecedented in any basin in the history of the world DiSavino, Scott. "Henry Hub, king of U.S. natural gas trade, losing crown to Marcellus." 25 Sept Online. Internet:
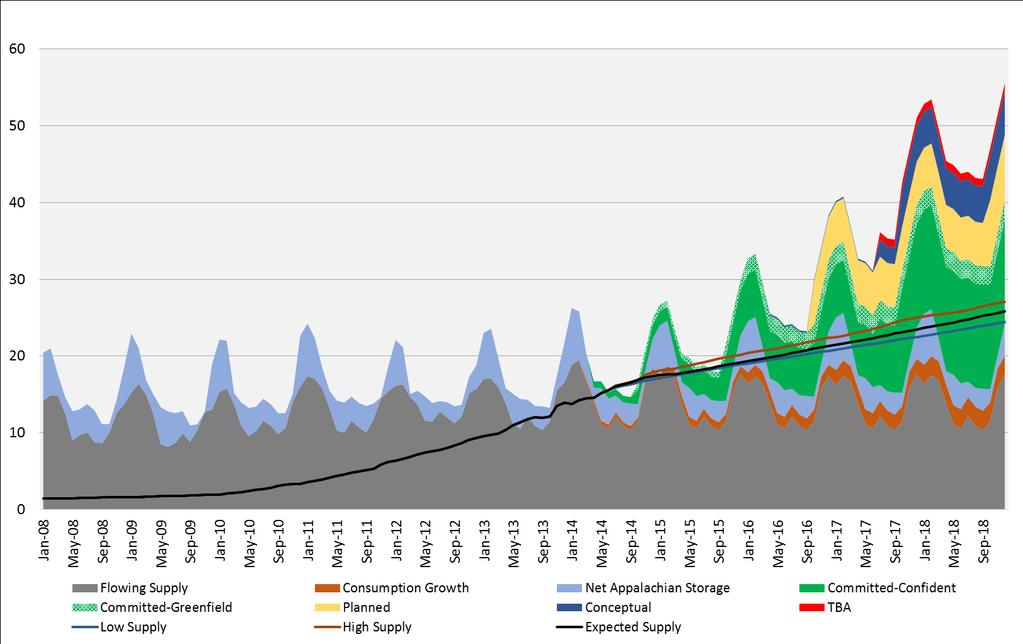
17 Between now and 2016, more than 20 Bcf/d of new capacity is expected in the Appalachian basin This could potentially double the production flowing out the Northeast shale's
18 New Pipelines Since 2010 As of September 2014 Cost Miles Additional Capacity $3.158 Billion Applied for $1.666 Billion 390 miles 6,584 MMbtu/d 140 miles 2,100 MMbtu/d Filed $908 Million 1,586 miles 8,887 MMbtu/d Announced $1.921 Billion Totals $7.653 Billion 155 miles 3,222 MMbtu/d 2271 miles 20,793 MMBtu/d Completion Presently completed

19
20 Storage Because of the uneven demand between winter and summer as mentioned previously Gas goes into storage Then sells at advantageous pricing Distribution Natural gas has to be moved from where it comes out of the ground to where it is going Requires pipes There are over 310,000 miles of pipelines Building and maintaining underground pipelines is expensive and companies that own them charge producers to use them dlord. "What drives natural gas prices." 20 Sept Online. Internet:
21 Production Steeply Inclining Marcellus/Utica production 2216 drilled wells waiting to turn-on, that's the equivalent of about 6.5Bcf/day waiting to go to Appalachian markets Timing Demand is highest in the winter It typically exceeds supply during the heating months in the northeast and Midwest Summer months Demand is lower than supply But changing due to power load demands dlord. "What drives natural gas prices." 20 Sept Online. Internet:
22
23
24 Natural Gas Price. 4 Sept Online. Internet: Sept
25 Texas and Pennsylvania are over a thousand miles apart Both are home to two of the largest natural gas fields Barnett Shale and Marcellus/Utica Shale Gas Extraction for both is the same However both have geologically and economical differences Locations and sizes are different Barnett Shale covers 34 million acres Marcellus Shale is beneath almost 118 million acres 4 times the size of Barnett Shale Include the Utica expected range, and Appalachia it is 8-10 times the size of the Barnett This does not include other known shale plays above/below Marcellus/Utica that are just now being tested and could double or triple that size The Marcellus/Utica could potentially be times the size of the Barnett PPI Energy and chemical team. "The effects of shale gas production on natural gas prices. U.S. Bureau of Labor Statistics May 2013 Online. Internet:
26 PPI Energy and chemical team. "The effects of shale gas production on natural gas prices. U.S. Bureau of Labor Statistics May 2013 Online. Internet:
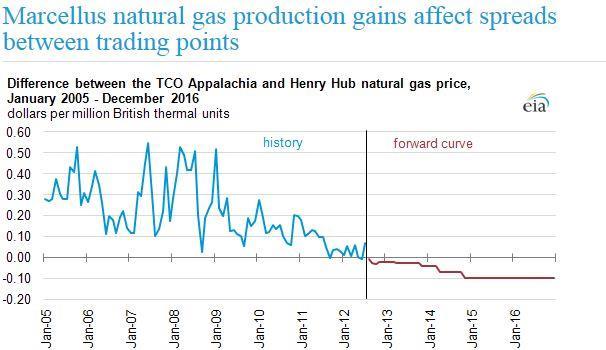
27 The Producer Price Index (PPI) for natural gas, measured on an annual average basis, fell 56.8 percent between 2007 and 2012 because of shale gas production Improved technological advances contributed to this increase by increasing gas production by 25 percent Shale gas has only been a key player in domestic gas production for a few years It has only been tracked since 2007 Energy Information Administration (EIA) finds it difficult to precisely quantify the effects that shale production has had on natural gas prices, but Appalachian basis has been very negatively affected PPI Energy and chemical team. "The effects of shale gas production on natural gas prices. U.S. Bureau of Labor Statistics May 2013 Online. Internet:
28 Data indicates that increasingly higher gas prices in the first half of 2008 brought additional shale gas to the market When gas prices peaked in 2008 drilling activity hit an all time high Oversupply eventually took place EIA explains the increased natural gas supply tends to dampen prices. In turn, lower prices can erode incentive for drilling, which eventually results in decreased production. This has NOT happened in Appalachia PPI Energy and chemical team. "The effects of shale gas production on natural gas prices. U.S. Bureau of Labor Statistics May 2013 Online. Internet:
29 In September 2008, gas rig count in Appalachia peaked at 115 rigs; by September 2014, the rig count fell to 55 rigs The New York Mercantile (NYMEX) natural gas futures closing price hit $8.39 on August 27, 2008 Then plummeted to $2.07 by May 2012 A decrease of 75.3 percent Current prices are well below their 2008 peak Producers have cut back on new drilling production to avoid over production Despite a drilling slowdown overall production has continued to rise due to technological advances PPI Energy and chemical team. "The effects of shale gas production on natural gas prices. U.S. Bureau of Labor Statistics May 2013 Online. Internet:

30 PPI Energy and chemical team. "The effects of shale gas production on natural gas prices. U.S. Bureau of Labor Statistics May 2013 Online. Internet:

31 Possible Saving Grace Positive Note In terms of Demand, domestic consumption has increased 9.4 percent between 2008 and 2012 due to the increased demand from the electric power sector Electric power rose 37 percent between Majority of electric power is generated from coal and natural gas With the price of natural gas falling to that of coal, the electric power generation increased natural gas consumption and reduced coal consumption PPI Energy and chemical team. "The effects of shale gas production on natural gas prices. U.S. Bureau of Labor Statistics May 2013 Online. Internet:

32 Possible Saving Grace Projected low natural gas prices make it very attractive fuel for generating capacity In some areas, natural gas accounts for 35 percent of total electricity generation, while coal accounts for 32 percent PJM estimates that an additional 6-7 Bcf of gas will be needed by 2020 to replace retired coal facilities PPI Energy and chemical team. "The effects of shale gas production on natural gas prices. U.S. Bureau of Labor Statistics May 2013 Online. Internet:


33 Possible Saving Grace In the AEO2014 Reference case, the United States becomes a net exporter of LNG in 2016, and becomes an overall net exporter of natural gas in 2018, 2 years earlier than is AEO2013 U.S. exports of LNG from new liquefaction capacity are expected to surpass 2 Tcf by 2020 and increase to 3.5 Tcf in 2029 Net pipeline imports from Canada fall steadily until 2033 and increase through 2040 PPI Energy and chemical team. "The effects of shale gas production on natural gas prices. U.S. Bureau of Labor Statistics May 2013 Online. Internet:

34 AEO2014 Early Release Overview. Online Internet:
35 Total electricity consumption in the AEO2014 reference case, including purchase from electric power producers and on-site generation Grows from 3,826 billion kwh in 2012 to 4,954 billion kwh in 2040 An average annual rate of 0.9 percent or 23% increase KWh = Mcf/gas AEO2014 Early Release Overview. Online Internet:
36 The LDC side may be one of the few safe havens conventional producers have Typically the LDC s have accepted local supplies as the backbone of their system supply LDC s have provided a price premium history, this may not totally be true now, but still holds better value LDC s do accept Shale volumes in their system to some degree but conventional producers still have a very positive affect on the system supply Producers typically do not have to pay for Firm Transportation on the LDC s On the Interstate side conventional producers are competing with shale producers for markets, transportation space and pricing AEO2014 Early Release Overview. Online Internet:

37 AEO2014 early release report Stronger near-term price growth will be followed by a lagged increase in supply from producers eventually causing lower settle prices in 2020 After 2020, increases in natural gas spot prices will be determined by continued but slower growth in U.S. demand and net exports Regional spot price projections throughout the U.S. follow the same general pattern at the Henry Hub spot price The average lower 48 spot price will increase at a slower rate than the Henry Hub spot price due to regional production growth outside areas serving the Henry Hub AEO2014 Early Release Overview. Online Internet:

38 $8.00 $6.00 $4.00 $ $ Pricing over the next 26 years U.S. Energy Information Administration/Annual Energy Outlook 2014 Early Release Overview AEO2014 Early Release Overview. Online Internet:
39 *12 trillion cubic feet = 12,100 BCF Natural gas consumption. Online Internet:

40
41 Producers need to work together Maximize existing assets Pool gas, pool acreage (deep & shallow) and purchase firm transportation on interstate pipeline as a block Where is traditional Upper Devonian gas needed in the future? CNG for fuel Diversity within Energy business Secure own burner tips
Oil, Gas and Power Prices Have Fallen and Can t Get Up Implications for the Power Industry Municipal Power & Utilities Assembly
 Oil, Gas and Power Prices Have Fallen and Can t Get Up Implications for the Power Industry Municipal Power & Utilities Assembly Mike Zenker, Managing Director of Research NextEra Energy Resources September
Platt s NGL Forum NGL Supply Outlook
 Platt s NGL Forum NGL Supply Outlook September 26, 2011 Anne B. Keller Midstream Energy Group, Inc. abk@midstreamenergygroup.com NGL Supply Update Updated Map N American Shales Plenty of opportunity to
Valuing Oil & Gas Reserves (Part I) Impact and History of Oil & Gas Prices
 Impact and History of Oil & Gas Prices") Valuing Oil & Gas Reserves (Part I) Impact and History of Oil & Gas Prices Don Erickson, ASA Mercer Capital // www.mercercapital.com February 2018 2018 Mercer Capital // All rights reserved Introduction
Valuing Oil & Gas Reserves (Part I) Impact and History of Oil & Gas Prices Don Erickson, ASA Mercer Capital // www.mercercapital.com February 2018 2018 Mercer Capital // All rights reserved Introduction
Second Quarter 2016 Earnings Call Presentation August 3, 2016
 Second Quarter 216 Earnings Call Presentation August 3, 216 FORWARD-LOOKING STATEMENTS This presentation contains forward-looking statements. All statements, other than statements of historical facts,
Monthly Performance update for Financial Professionals November, 2018
 Monthly Performance update for Financial Professionals November, 2018 For Financial Professional Use Only. Not For Use with s. Performance of prior partnerships is not indicative of future results. Monthly
SaskEnergy Commodity Rate 2011 Review and Natural Gas Market Update
 SaskEnergy Commodity Rate 2011 Review and Natural Gas Market Update The following is a discussion of how SaskEnergy sets its commodity rate, the status of the natural gas marketplace and the Corporation
Partnership Profile. June 2017
 Partnership Profile June 2017 Forward-Looking Information and Non-GAAP Measures This presentation may contain forward-looking statements within the meaning of securities laws. Forward-looking statements
Looking Ahead on Oil & Gas
 Looking Ahead on Oil & Gas Art Berman NACE Investor Speaker Luncheon Palm Beach Gardens, Florida March 16, 217 Slide 1 Oil Prices Fell Below $5 Floor Last Week: Deflation of the OPEC Expectation Premium
NYMEX Nov natural gas futures soar to $3.057/MMBtu on first day of trading on bullish injection. Projects, an Industrial Info News Alert
 Sep-17 Oct-17 Nov-17 Dec-17 Jan-18 Feb-18 Mar-18 Apr-18 May-18 Jun-18 Jul-18 Aug-18 Sep-18 8: 8:45 9:3 1:15 11: 11:45 12:3 13:15 14: 3.15 3.1 3.5 3. 2.95 2.9 Prior Day s NYMEX Oct-18 Contract (CT) NYMEX
2008 Second Quarter Results
 20 Second Quarter Results August 8, 20 Power to Perform Forward-Looking Statements This presentation contains forward-looking statements that may be identified by words like forecast, estimated, expected
Monthly Broker Webinar. November 12, 2014
 Monthly Broker Webinar November 12, 2014 Monthly Broker Webinar Winter Weather Outlook Commodities Market Update Strategic Recommendations Winter Weather Outlook Beau Gjerdingen, Senior Meteorologist 3
ONTARIO ENERGY REPORT Q3 2018
 ONTARIO ENERGY REPORT Q3 JULY SEPTEMBER OIL AND NATURAL GAS Regular Gasoline and Diesel Provincial Retail Prices ($/L) Regular Gasoline $1.3 Diesel $1.9 Source: Ministry of Energy, Northern Development
'New Day' For Jordan Cove LNG, Says Colorado Producer. U.S. natural gas prices rise as winter stocks look tight
 S E P T E M B E R 2 8, 2 1 7 Prior Day s NYMEX Oct-17 Contract (CT) 3. 2.99 2.98 2.97 2.96 2.95 2.94 2.93 2.92 2.91 2.9 8: 8:45 9:3 1:15 11: 11:45 12:3 13:15 Sep-16 Oct-16 Nov-16 Dec-16 Jan-17 Feb-17 Mar-17
Partnership Profile. December 2017
 Partnership Profile December 2017 Forward-Looking Information and Non-GAAP Measures This presentation may contain forward-looking statements within the meaning of securities laws. Forward-looking statements
M A N I T O B A ) Order No. 147/09 ) THE PUBLIC UTILITIES BOARD ACT ) October 29, 2009
 Order No. 147/09 ) THE PUBLIC UTILITIES BOARD ACT ) October 29, 2009") M A N I T O B A ) ) THE PUBLIC UTILITIES BOARD ACT ) BEFORE: Graham Lane, CA, Chairman Leonard Evans, LLD, Member Monica Girouard, CGA, Member CENTRA GAS MANITOBA INC.: PRIMARY GAS RATES, EFFECTIVE NOVEMBER
M A N I T O B A ) ) THE PUBLIC UTILITIES BOARD ACT ) BEFORE: Graham Lane, CA, Chairman Leonard Evans, LLD, Member Monica Girouard, CGA, Member CENTRA GAS MANITOBA INC.: PRIMARY GAS RATES, EFFECTIVE NOVEMBER
SOUTHWESTERN ENERGY ANNOUNCES 2015 FINANCIAL AND OPERATING RESULTS
 NEWS RELEASE SOUTHWESTERN ENERGY ANNOUNCES 2015 FINANCIAL AND OPERATING RESULTS Houston, Texas February 25, 2016...Southwestern Energy Company (NYSE: SWN) today announced its financial and operating results
The U.S. Natural Gas Market in Focus
 The U.S. Natural Gas Market in Focus Current and Projected Supply and Demand Conditions for Flame 212 April 17, 212 Amsterdam, The Netherlands by Howard Gruenspecht, Acting Administrator U.S. Energy Information
NYMEX December gas settles at $2.928/MMBtu on changing
 Nov-16 Dec-16 Jan-17 Feb-17 Mar-17 Apr-17 May-17 Jun-17 Jul-17 Aug-17 Sep-17 Oct-17 Nov-17 8: 8:45 9:3 1:15 11: 11:45 12:3 13:15 14: N O V E M B E R 2 8, 2 1 7 Prior Day s NYMEX Dec-17 Contract (CT) 2.95
PTXP Update: Operations and Events
 Investor Presentation August 2016 Disclaimer Forward-Looking Statements This presentation includes forward-looking statements. Forward-looking statements give our current expectations, contain projections
The Outlook for Canada s Oil and Gas Sector. Calgary Real Estate Forum October 21, 2009
 The Outlook for Canada s Oil and Gas Sector Calgary Real Estate Forum October 21, 2009 Canada s Oil and Gas Impact on Alberta The oil and natural gas continues to drive almost ½ of the Alberta economy
Impact Fee Update and 2018 Outlook
 Impact Fee Update and 2018 Outlook Introduction Pennsylvania imposes an annual impact fee on unconventional (i.e., shale) natural gas wells that were drilled or operating in the previous calendar year.
Antero Resources Announces 2015 Capital Budget and Guidance
 NEWS RELEASE Antero Resources Announces 2015 Capital Budget and Guidance 1/20/2015 DENVER, Jan. 20, 2015 /PRNewswire/ -- Antero Resources Corporation (NYSE: AR) ("Antero" or the "Company") today announced
Plunging Crude Prices: Impact on U.S. and State Economies
 Plunging Crude Prices: Impact on U.S. and State Economies Mine Yücel Senior Vice President and Director of Research August 7, 215 Oil and gas prices plunge Nominal price, $, weekly 16 14 12 Oil Price 1
Spot AECO $Cdn/GJ. 1 2 Daily Index Values; Rolling 12-Month History. $US/$Cdn $0.85 $0.80 $0.75
 April, Chart Watch ARC Energy Charts Visit for more information on this publication and the Institute 17 19 9 3 Crude oil stocks are at a deficit to the -yr avg YTD US refinery utilization is well above
Single-family home sales and construction are not expected to regain 2005 peaks
 Single-family home sales and construction are not expected to regain 25 peaks Millions of units 8. 7. 6. 5. Housing starts (right axis) 4. Home sales (left axis) 3. 2. 1. 198 1985 199 1995 2 25 21 215
First Quarter 2016 Earnings Call Presentation April 28, 2016
 First Quarter 2016 Earnings Call Presentation April 28, 2016 FORWARD-LOOKING STATEMENTS This presentation contains forward-looking statements within the meaning of Section 27A of the Securities Act of
Antero Resources Reports Third Quarter 2013 Financial and Operational Results
 Antero Resources Reports Third Quarter 2013 Financial and Operational Results Highlights: Net daily production averaged 566 MMcfe/d, a 25% increase over second quarter 2013 and a 128% increase over third
Gas/Electric Partnership Conference Gas Pipelines and Storage Investment Outlook January 31, 2018
 Gas/Electric Partnership Conference Gas Pipelines and Storage Investment Outlook January 31, 2018 Photo of Wilson Compressor Station, part of the Coastal Bend Header Project Gregg Philbrick Director, System
DRILLING AND MORE OPEC, FLARING, OFFSHORE. FundamentalEdge Report July learn more at drillinginfo.com
 OPEC, FLARING, OFFSHORE DRILLING AND MORE FundamentalEdge Report July 2018 learn more at drillinginfo.com Contents INTRODUCTION 3 OPEC QUOTAS AND CRUDE OIL UPDATE 4 NATURAL GAS FLARING: TX AND ND CASE
Midstream Development in the Marcellus. March 2011
 + Midstream Development in the Marcellus March 2011 + Introduction Rich Marcellus Market for NGLs Ethane Options Caiman Energy Experience Execution Expansion Key Takeaways + Marcellus Overview: Rich Acreage
CONSOL Energy Inc. (CNX-NYSE)
") March 17, 2015 CONSOL Energy Inc. (CNX-NYSE) Current Recommendation NEUTRAL Prior Recommendation Underperform Date of Last Change 08/20/2013 Current Price (03/16/15) $27.02 Target Price $28.00 SUMMARY
March 17, 2015 CONSOL Energy Inc. (CNX-NYSE) Current Recommendation NEUTRAL Prior Recommendation Underperform Date of Last Change 08/20/2013 Current Price (03/16/15) $27.02 Target Price $28.00 SUMMARY
Spot AECO $Cdn/GJ. 1 2 Daily Index Values; Rolling 12-Month History. Indexed to 12 Months Ago. $US/$Cdn $0.85 $0.80 $0.75
 July 1, Chart Watch ARC Energy Charts Visit for more information on this publication and the Institute 1 3 Bank of Canada raises rates to 1.% WCS differential narrows due to supply outages US crude stocks
Oil & Gas Sector January 8, 2018
 Oil & Gas Sector January 8, 218 Weekly Canadian Natural Gas Supplement With the warm up in Alberta and what appears to be the worst of the cold weather in the eastern half of North America starting to
Antero Resources Reports Third Quarter 2013 Financial and Operational Results
 Antero Resources Reports Third Quarter 2013 Financial and Operational Results DENVER, Nov. 6, 2013 /PRNewswire/ -- (Logo: http://photos.prnewswire.com/prnh/20131101/la09101logo) Highlights: Net daily production
Spot AECO $Cdn/GJ. 1 2 Daily Index Values; Rolling 12-Month History. Indexed to 12 Months Ago 150. $US/$Cdn $0.85 $0.80 $0.75
 October, 1 Chart Watch 1 A new NAFTA (USMCA) was announced ARC Energy Charts 1 Cenovus signed a rail deal to the US Gulf Coast US oil production grew MB/d in July Visit for more information on this publication
Partnership Profile. February 2018
 Partnership Profile February 2018 Forward-Looking Information and Non-GAAP Measures This presentation may contain forward-looking statements within the meaning of securities laws. Forward-looking statements
Spot AECO $Cdn/GJ. 1 2 Daily Index Values; Rolling 12-Month History. Indexed to 12 Months Ago. $US/$Cdn $0.85 $0.80 $0.75
 January, 1 Chart Watch Canadian oil differentials remain very narrow ARC Energy Charts 1 Cdn crude exports by rail hit 33 kb/d in Nov US crude inventories rose by MMB Visit for more information on this
BOK Financial: Commodity Hedging Energy Hedging / A Trader s View
 BOK Financial: Commodity Hedging Energy Hedging / A Trader s View February 23, 2017 Energy Finance Overview and expertise Offices in Dallas, Denver, Houston, Oklahoma City and Tulsa 100+ years in Energy
Rice Midstream Partners First Quarter 2016 Supplemental Slides May 4,
 Rice Midstream Partners First Quarter 2016 Supplemental Slides May 4, 2016 1 www.ricemidstream.com RMP: High Growth MLP in Prolific Appalachian Basin TOP-TIER GROWTH DRIVEN BY ACTIVE CUSTOMERS Strategically
Palm Beach, Fla. January 12-13, Evercore ISI Utility CEO Conference
 Palm Beach, Fla. January 12-13, 2017 Evercore ISI Utility CEO Conference Forward-Looking Statements Statements contained in this presentation that include company expectations or predictions should be
Thursday, June 20, :06 AM ET Gas pipelines assemble to deliver Northeast from supply woes
 Thursday, June 20, 2013 8:06 AM ET Gas pipelines assemble to deliver Northeast from supply woes By Sean Sullivan Pipeline companies said they are ready to build projects to help increase the flow of natural
SOUTHWESTERN ENERGY ANNOUNCES SECOND QUARTER 2017 FINANCIAL AND OPERATING RESULTS
 NEWS RELEASE SOUTHWESTERN ENERGY ANNOUNCES SECOND QUARTER 2017 FINANCIAL AND OPERATING RESULTS Houston, Texas August 3, 2017...Southwestern Energy Company (NYSE: SWN) today announced its financial and
Nonfarm Payroll Employment
 PRESIDENT'S REPORT TO THE BOARD OF DIRECTORS, FEDERAL RESERVE BANK OF BOSTON Current Economic Developments - June 10, 2004 Data released since your last Directors' meeting show the economy continues to
Energy Ventures Analysis 1901 N. Moore St. Arlington, VA (703)
") T H E I M P A C T O F E A R L Y C O A L R E T I R E M E N T S O N K E Y P O W E R M A R K E T S Prepared for: National Mining Association Washington, DC May 2014 Energy Ventures Analysis 1901 N. Moore
T H E I M P A C T O F E A R L Y C O A L R E T I R E M E N T S O N K E Y P O W E R M A R K E T S Prepared for: National Mining Association Washington, DC May 2014 Energy Ventures Analysis 1901 N. Moore
EQT CORPORATION 10,500,000 shares
 PROSPECTUS SUPPLEMENT (To Prospectus dated October 17, 2013) 19FEB200914483069 EQT CORPORATION 10,500,000 shares Common stock We are offering to sell 10,500,000 shares of our common stock through this
LATEST DEVELOPMENTS: THE ROLE OF NATURAL GAS AND OIL IN AMERICA S ENERGY FUTURE. Rayola Dougher API Senior Economic Advisor
 LATEST DEVELOPMENTS: THE ROLE OF NATURAL GAS AND OIL IN AMERICA S ENERGY FUTURE Rayola Dougher API Senior Economic Advisor Oil & Natural Gas Industry: The Backbone of the American Economy Supports more
Spot AECO $Cdn/GJ. 1 2 Daily Index Values; Rolling 12-Month History. Indexed to 12 Months Ago. 75 Sep-17 Nov-17 Jan-18 Mar-18 May-18 Jul-18 Sep-18
 September 1, Chart Watch The comments are no longer included in the charts. 11 17 WTI to Edm. Par differential widens to over $1 Bitumen production hit a record high in July US crude stocks down by MMB
BP's oil output drops 5% on year in Q1, offset by natural gas surge Natural gas liquids pipeline approved for northwest N.D.
 Apr-17 May-17 Jun-17 Jul-17 Aug-17 Sep-17 Oct-17 Nov-17 Dec-17 Jan-18 Feb-18 Mar-18 Apr-18 8: 8:45 9:3 1:15 11: 11:45 12:3 13:15 14: Prior Day s NYMEX May-18 Contract (CT) 2.78 2.77 2.76 2.74 2.73 2.72
Utica Midstream Conference June 7, Blue Racer Midstream
 Utica Midstream Conference June 7, 2017 Blue Racer Midstream Blue Racer Midstream, LLC. Nature of Information Presented: The following information has been prepared by Blue Racer Midstream, LLC to provide
Spot AECO $Cdn/GJ á á á. 1 2 Daily Index Values; Rolling 12-Month History. Indexed to 12 Months Ago. $US/$Cdn $0.
 Chart Watch WTI hit a high since November on Friday 3 Edmonton butane prices remain depressed AECO prices are strong on cold local weather Visit for more information on this publication and the Institute
Helmerich & Payne, Inc.
 Helmerich & Payne, Inc. Lehman Brothers CEO Energy/Power Conference September 7, 2006 Investor Relations Contacts: Doug Fears CFO, 918.588.5208, doug.fears@hpinc.com Juan Pablo Tardio Manager, Investor
The Term Structure of Natural Gas and its Effect on Domestic Coal
 The Term Structure of Natural Gas and its Effect on Domestic Coal Houston Joe Graham Vice President, Americas Natural Gas, Electricity And Environmental Markets April 2016 London Houston Washington New
Can LOOP Ever Be a Gulf Coast Cushing? Part 2 Searching for a sour crude benchmark.
 ? Can LOOP Ever Be a Gulf Coast Cushing? Part 2 Searching for a sour crude benchmark. Morningstar Commodities Research 10 April 2017 Sandy Fielden Director, Oil and Products Research +1 512 431-8044 sandy.fielden@morningstar.com
ST98: 2017 ALBERTA S ENERGY RESERVES & SUPPLY/DEMAND OUTLOOK. Executive Summary.
 ST98: 2017 ALBERTA S ENERGY RESERVES & SUPPLY/DEMAND OUTLOOK Executive Summary ST98 www.aer.ca Executive SummARY The Alberta Energy Regulator (AER) ensures the safe, however, will depend on the level
Antero Resources Reports Second Quarter 2013 Financial Results, Utica First Production and Well Rates
 Antero Resources Reports Second Quarter 2013 Financial Results, Utica First Production and Well Rates Highlights: Net daily production averaged 458 MMcfe/d, up 115% over second quarter 2012 production
NGL s Markets Beyond Mont Belvieu
 NGL s Markets Beyond Mont Belvieu NGEAO - Tulsa May 2012 Anne B. Keller Aerial View of Mont Belvieu, TX Midstream Energy Group, Inc. 2012 All rights reserved Midstream Energy Group Who We Are Midstream
National Fuel Gas Supply Corporation & Empire Pipeline. Marcellus Driven Infrastructure Projects
 National Fuel Gas Supply Corporation & Empire Pipeline Marcellus Driven Infrastructure Projects Greg Maliken Sr. Manager - Facility Planning Interstate Marketing Department Safe Harbor for Forward Looking
2014 FINANCIAL SUMMARY
 2014 FINANCIAL SUMMARY In 2014, we continued to build on our track record of strong operational performance. 13 % Growth in annual average production per share 12 % Increase in funds flow per share 6 %
Spot AECO $Cdn/GJ. á á. 1 2 Daily Index Values; Rolling 12-Month History. $US/$Cdn $0.85 $0.80 $0.75
 April 3, Chart Watch ARC Energy Charts Visit for more information on this publication and the Institute 1 1 1 3 3 US oil production hit a record high in Feb OPEC production is well below its quota The
Moving Marcellus Gas to Market
 Moving Marcellus Gas to Market National Fuel Gas Supply Corporation Empire Pipeline, Inc. Jeffrey Schauger GeneralManager Interstate Marketing 1 National Fuel Gas Company Safe Harbor For Forward Looking
3. TREASURY AND COMMODITIES GROUP
 3. TREASURY AND COMMODITIES GROUP Andrew Downe Group Head Macquarie Group Limited Operational Briefing 5 February 2009 Presentation to Investors and Analysts Volumes are beginning to trend downwards Activity
SOUTHWESTERN ENERGY ANNOUNCES SECOND QUARTER 2012 FINANCIAL AND OPERATING RESULTS
 NEWS RELEASE SOUTHWESTERN ENERGY ANNOUNCES SECOND QUARTER 2012 FINANCIAL AND OPERATING RESULTS Houston, Texas August 2, 2012...Southwestern Energy Company (NYSE: SWN) today announced its financial and
BMO Capital Markets 2010 Utilities and Pipelines Day November 30,
 BMO Capital Markets 2010 Utilities and Pipelines Day November 30, 2010 www.sug.com Forward Looking Information This presentation contains forward-looking statements within the meaning of Section 27A of
Energy and commodity price benchmarking and market insights
 Energy and commodity price benchmarking and market insights London, Houston, Washington, New York, Portland, Calgary, Santiago, Bogota, Rio de Janeiro, Singapore, Beijing, Tokyo, Sydney, Dubai, Moscow,
Third Quarter 2016 Earnings Call Presentation October 27, 2016
 Third Quarter 2016 Earnings Call Presentation October 27, 2016 FORWARD-LOOKING STATEMENTS This presentation contains forward-looking statements within the meaning of Section 27A of the Securities Act of
Deutsche Bank 2008 Energy & Utilities Conference. Fred Fowler President and CEO
 Deutsche Bank 2008 Energy & Utilities Conference Fred Fowler President and CEO May 28-29, 2008 Safe Harbor Statement Some of the statements in this document concerning future company performance will be
Spot AECO $Cdn/GJ. 1 2 Daily Index Values; Rolling 12-Month History. Indexed to 12 Months Ago. ~$1.5 trillion of its market capitalization.
 August, Chart Watch ARC Energy Charts 1 13 19 Shanghai index has lost $ trillion since Jan Global oil market balanced in H1 - IEA US refinery utilization rates highest since 1999 Visit for more information
Forward Looking Statements
 November 6, 2009 Forward Looking Statements This document contains forward looking statements. All statements other than statements of historical facts included in this document, including but not limited
Dairy Outlook. August By Jim Dunn Professor of Agricultural Economics, Penn State University. Market Psychology
 Dairy Outlook August 2014 By Jim Dunn Professor of Agricultural Economics, Penn State University Market Psychology The prices of all dairy products have been mixed since last month. The CME block cheese
Markets Have De-Valued Oil Prices: How Long Will It Last?
 Markets Have De-Valued Oil Prices: How Long Will It Last? Art Berman MacroVoices September 2, 218 Slide 1 Comparative inventory: The most important approach to oil & gas price formation Ivnetories of Crude
BULLISH O C T O B E R 1,
 Sep-17 Oct-17 Nov-17 Dec-17 Jan-18 Feb-18 Mar-18 Apr-18 May-18 Jun-18 Jul-18 Aug-18 Sep-18 8: 8:45 9:3 1:15 11: 11:45 12:3 13:15 14: 3.4 3.3 3.2 3.1 2.99 2.98 2.97 2.96 2.95 Prior Day s NYMEX NOV-18 Contract
The U.S. Petroleum Renaissance: What Does it All Mean?
 The U.S. Petroleum Renaissance: What Does it All Mean? Lucian Pugliaresi, President Energy Policy Research Foundation, Inc. (EPRINC) 33 RD Alaska Resources Development Conference Anchorage, Alaska November
Spot AECO $Cdn/GJ á. 1 2 Daily Index Values; Rolling 12-Month History. his plan of $500 billion in tariffs on Chinese imports.
 July 3, Chart Watch ARC Energy Charts Visit for more information on this publication and the Institute 1 1 7 Shanghai Index down by % since May WTI remained volatile over the past week US crude oil production
THE ECONOMIC IMPACT OF THE HORIZONTAL WELL SEVERANCE TAX INVESTMENT INCENTIVE PREPARED BY LOREN C. SCOTT & ASSOCIATES
 THE ECONOMIC IMPACT OF THE HORIZONTAL WELL SEVERANCE TAX INVESTMENT INCENTIVE PREPARED BY LOREN C. SCOTT & ASSOCIATES 743 Woodview Court Baton Rouge, LA 70810 (225) 751-1707 www.lorencscottassociates.com
2012 Wells Fargo Securities Research & Economics 11 th Annual Pipeline, MLP & Energy Symposium. December 4, 2012
 2012 Wells Fargo Securities Research & Economics 11 th Annual Pipeline, MLP & Energy Symposium December 4, 2012 Risks and Forward-Looking Statements This presentation includes forward-looking statements
Morgan Keegan MLP Conference May 18 th, 2010
 Morgan Keegan MLP Conference May 18 th, 2010 1 Forward Looking Statements This presentation contains forward looking statements within the meaning of the federal securities laws. Forward looking statements
Shale: Transforming US Energy. The Thinking Man s Approach. Advances in technology spurred significant shale production
 Shale: Transforming US Energy Over the past few years, there has been a transformation in the North American energy industry, thanks to the production of shale oil and gas. New technology has not only
SOUTHWESTERN ENERGY ANNOUNCES THIRD QUARTER 2018 RESULTS. Operational outperformance captures increasing value from high quality liquids portfolio
 NEWS RELEASE SOUTHWESTERN ENERGY ANNOUNCES THIRD QUARTER 2018 RESULTS Operational outperformance captures increasing value from high quality liquids portfolio Spring, Texas October 25, 2018...Southwestern
Emerging Trends in the Energy Industry. Paul Horak Partner, Audit and Enterprise Risk Services Deloitte & Touche LLP
 Emerging Trends in the Energy Industry Paul Horak Partner, Audit and Enterprise Risk Services Deloitte & Touche LLP August 2016 Agenda Introduction Drilling and Production Trends Crude Oil and Refined
Investor Relations Presentation
 Investor Relations Presentation EQT Midstream Partners-EQT GP Holdings June 2017 1 Cautionary Statements Disclosures in this presentation contain certain forward-looking statements. Statements that do
Providing Pennsylvania Energy and Pennsylvania Jobs for 100 years
 Providing Pennsylvania Energy and Pennsylvania Jobs for 100 years The following is a brief overview of Seneca Resources operations in the Appalachian Basin Seneca Resources East Division Payouts by Fiscal
SOUTHWESTERN ENERGY ANNOUNCES SECOND QUARTER 2014 FINANCIAL AND OPERATING RESULTS
 NEWS RELEASE SOUTHWESTERN ENERGY ANNOUNCES SECOND QUARTER 2014 FINANCIAL AND OPERATING RESULTS Houston, Texas July 31, 2014...Southwestern Energy Company (NYSE: SWN) today announced its financial and operating
New York City March 2, Morgan Stanley MLP/Diversified Natural Gas, Utilities & Clean Tech Conference
 New York City March 2, 2017 Morgan Stanley MLP/Diversified Natural Gas, Utilities & Clean Tech Conference Forward-Looking Statements Statements contained in this presentation that include company expectations
Spot AECO $Cdn/GJ. á á. 1 2 Daily Index Values; Rolling 12-Month History. Indexed to 12 Months Ago. $US/$Cdn $0.85 $0.80 $0.75
 November 1, 1 Chart Watch WCS fell to a record low of $13./B on Thurs 1 TCPL: KXL approval deficiencies manageable WTI short contracts have surged since August Visit for more information on this publication
Spot AECO $Cdn/GJ. 1 2 Daily Index Values; Rolling 12-Month History. Indexed to 12 Months Ago. $US/$Cdn $0.85 $0.80 $0.75
 August 13, Chart Watch ARC Energy Charts 11 1 Canadian production down by MB/d in June Saudi continues to supply oil to Canada OECD stocks are 3 MMB below the year avg. Visit for more information on this
October 22, 2007 VIA HAND DELIVERY & ELECTRONIC MAIL
 Laura S. Olton General Counsel Rhode Island October 22, 2007 VIA HAND DELIVERY & ELECTRONIC MAIL Luly E. Massaro, Commission Clerk Rhode Island Public Utilities Commission 89 Jefferson Boulevard Warwick,
Offshore Oil & Gas: Is Newfoundland & Labrador Getting its Fair Share?
 Offshore Oil & Gas: Is Newfoundland & Labrador Getting its Fair Share? Brian Maynard, Vice-President, CAPP Harris Centre of Regional Policy and Development St. John s, NL November 15, 2006 Canadian Association
Founders Investment Banking June 2013 Oil & Gas Newsletter
 Founders Investment Banking June 2013 Oil & Gas Newsletter Professionals: Duane P. Donner, II Managing Partner ddonner@foundersib.com Joe H. Brady, III Vice President jbrady@foundersib.com Patrick L. Bradley
Atlas Pipeline Partners, L.P.
 Atlas Pipeline Partners, L.P. NYSE: APL 6 th Annual Wachovia Pipeline & MLP Symposium New York, NY December 6, 2007 1 Safe Harbor Statement THE WORDS BELIEVES, ANTICIPATES, EXPECTS AND SIMILAR EXPRESSIONS
Dominion Resources Inc. (D-NYSE)
") January 29, 2010 Dominion Resources Inc. (D-NYSE) Current Recommendation Prior Recommendation UNDERPERFORM Date of Last Change 03/18/2004 Current Price (01/28/10) $37.60 Target Price $39.00 NEUTRAL SUMMARY
January 29, 2010 Dominion Resources Inc. (D-NYSE) Current Recommendation Prior Recommendation UNDERPERFORM Date of Last Change 03/18/2004 Current Price (01/28/10) $37.60 Target Price $39.00 NEUTRAL SUMMARY
2015 Jefferies Energy Conference Pete Bowden Global Head of Midstream Energy Investment Banking November Jefferies LLC Member SIPC
 2015 Jefferies Energy Conference Pete Bowden Global Head of Midstream Energy Investment Banking November 2015 Jefferies LLC Member SIPC Current Macro Environment 1 Production / Consumption (MMBbl/d) Stock
Tortoise Talk. Energy update
 Tortoise Talk Energy update First quarter 2018 Tortoise Talk First Quarter 2018 The broad energy market had a volatile start to the year with strong performance in January that turned sharply negative
Spot AECO $Cdn/GJ. 1 2 Daily Index Values; Rolling 12-Month History. $US/$Cdn $0.85 $0.80 $0.75
 April 1, Chart Watch ARC Energy Charts Visit for more information on this publication and the Institute 1 The Canadian Dollar has rallied in recent weeks WTI hit a multi-year high on Mideast tensions Heavy
Historical Pricing PJM COMED, Around the Clock. Cal '15 Cal '16 Cal '17 Cal '18 Cal '19 Cal '20 Cal '21 Cal '22
 $50 Historical Pricing PJM COMED, Around the Clock $48 $46 $44 $42 $40 $38 $36 $34 $32 $30 $28 $26 Cal '15 Cal '16 Cal '17 Cal '18 Cal '19 Cal '20 Cal '21 Cal '22 The information presented above was gathered
Dahlman Rose Global Metals, Mining & Materials Conference CONSOL Energy Inc. William J. Lyons, EVP and CFO
 Dahlman Rose Global Metals, Mining & Materials Conference CONSOL Energy Inc. William J. Lyons, EVP and CFO Cautionary Language This presentation contains statements, estimates and projections which are
INDEPENDENT FISCAL OFFICE
 INDEPENDENT FISCAL OFFICE Matthew Knittel, Director Testimony Before the Senate Environmental Resources and Energy Committee and the Senate Finance Committee June 1, 2015 Chairmen Yaw and Yudichak, Chairmen
Atlantic Sunrise Coming On Line U.S. Power and Gas Weekly
 ? Atlantic Sunrise Coming On Line U.S. Power and Gas Weekly Morningstar Commodities Research 6 September 2018 Matthew Hong Director of Research, Power and Gas +1 312 244-7649 matthew.hong@morningstar.com
Auscap Long Short Australian Equities Fund Newsletter August 2015
 Auscap Asset Management Limited Disclaimer: This newsletter contains performance figures and information in relation to the from inception of the Fund. The actual performance for your account will be provided
Spot AECO $Cdn/GJ. 1 2 Daily Index Values; Rolling 12-Month History. Indexed to 12 Months Ago. $US/$Cdn $0.85 $0.80 $0.75
 Chart Watch WTI surged to near -month high on Monday 13 OPEC production fell below in March US waivers on Iran export sanctions to go to Visit for more information on this publication and the Institute
N e w s R e l e a s e
 N e w s R e l e a s e Chesapeake Energy Corporation P. O. Box 18496 Oklahoma City, OK 73154 FOR IMMEDIATE RELEASE OCTOBER 3, 2005 INVESTOR CONTACT: JEFFREY L. MOBLEY, CFA VICE PRESIDENT- INVESTOR RELATIONS