INTERIM PRESIDENT HANS NORÉN PRESENTS THE REPORT
|
|
|
- Loraine Cox
- 6 years ago
- Views:
Transcription
 Full year 2013 Total income, SEK mill. 127.9 137.3 543.4 EBITDA, SEK mill. 51.")
1 INTERIM report 1 January 31 March 2013 Operating result of SEK 15.7 million Improved income for vessels on the spot market Strongest product tanker market since 2008 Quarter 1 (Jan Mar) Full year 2013 Total income, SEK mill EBITDA, SEK mill Operating result before impairment, SEK mill Impairment, SEK mill Operating result after impairment, SEK mill Result after tax, SEK mill Result per share, SEK EBITDA, USD mill Available liquid funds 1), SEK mill ) Including unutilised available credit facilities. PRESIDENT HANS NORÉN PRESENTS THE REPORT By scanning in the QR code on the left, you can watch President Hans Norén present the report for Q on your mobile.

2 CONCORDIA MARITIME IN 60 SECONDS Concordia Maritime is an international tanker shipping company. Our focus is on cost-effective and safe transportation of refined petroleum products and vegetable oils. The company s B shares were admitted to trading on Nasdaq OMX Stockholm in CONTENTS President s overview 3 Business activities 4 Freight market development 6 Financial summary 7 Other information 9 Financial statements 11 OUR BUSINESS CONCEPT To provide our customers with safe and cost-efficient tanker transportation based on innovation and performance. OUR VISION To be our customers first choice for safe, innovative and efficient tanker transportation, which will result in good profitability, steady growth and financial stability. OUR CUSTOMERS Our customers include some of the world s largest oil and energy companies. Customer relations are characterised by partnership, cooperation and a long-term perspective. WHAT WE TRANSPORT Our main focus is on the transportation of refined petroleum products and vegetable oils. As a complement to this focus, we are also active in the transportation of crude oil. BUSINESS MODEL Our business and income model consists of providing vessels to customers in need of safe and cost-efficient transportation of oil and petroleum products. Income is generated mainly by chartering out vessels (spot market or time charters), profitsharing clauses in charters and the sale of ships. STRATEGY To continue to develop our position as a partner of choice in the transportation of refined petroleum products and vegetable oils. To continue to identify the market s need for efficient transportation and to develop vessels and logistics solutions based on transport economy, flexibility and a welldeveloped safety and environmental philosophy. To utilise our financial position to do new business with the right timing. To continue to take advantage of the unique competence existing in the Stena Sphere with respect to market knowhow, shipbuilding and ship operation. FINANCIAL OBJECTIVES Growth, at least 10% per year while maintaining profitability Profitability, at least12% return on equity Equity ratio, at least 50% over a business cycle 2 CONCORDIA MARITIME INTERIM REPORT JANUARY MARCH 2013
 million, corresponding to USD 8.0 (9.2) million. The market developed positively during the quarter.")
3 PRESIDENT S OVERVIEW Concordia Maritime reported a result after tax of SEK 7.6 (20.6) million for the first quarter of Cash flow from operations (EBITDA) amounted to SEK 51.2 (61.8) million, corresponding to USD 8.0 (9.2) million. The market developed positively during the quarter. The strengthening of the product tanker market we saw at the end of the previous year continued in the first quarter, and in February freight rates on the open market, according to Fearnley s statistics, reached approx. USD 19,000 per day. On average, freight rates were approx. USD 17,000 per day for the entire quarter, compared with USD 11,000 per day for the first quarter of. In fact, despite a certain weakening in March, this was the strongest quarter since the end of However, we should not draw too many conclusions from the trend during the last few months. Although it is an emphatic improvement compared with the last three or four years, whether the increase has a real foundation is not clear. It may be partly due to factors such as seasonal variations. However, over the full year, we stand by our assessment of a gradual strengthening in the product tanker market, and that 2013 will be one or two notches better than. Successful charters Our vessels that were employed on the open market in the first quarter had an average income of approx. USD 16,000 per day. The improvement compared with previous quarters was partly due to the stronger market. But we have also had some well timed charters on longer voyages when we have been able to take advantage of the P-MAX vessels facility to carry up to 30 percent more cargo with essentially the same fuel consumption as standard tonnage. In addition to being commercially successful, these transactions also show clearly the P-MAX vessels potential for cost-effective transportation of petroleum products. Income for our vessels on fixed charters remained at just over USD 20,000 per day. In fact, despite a certain weakening in March, this was the strongest quarter since the end of Stena Paris redelivered Operationally, this was a good quarter, with all ships operating well and without any incidents or accidents on board. We took redelivery of another vessel from a time charter. The vessel in question was Stena Paris and she went straight into employment on the open market. Stena Primorsk returned to her time charter following repair work. Six of our ten P-MAX tankers are now employed on the open market. It is worth mentioning that we do not have any scheduled drydocking involving lost income days in Our suezmax tanker Stena Supreme, which is employed on the open market through Stena Sonangol Suezmax Pool, generated income of approx. USD 17,000 per day during the quarter. The pool continues to do a good job in a challenging market. There were expectations that the suezmax market would strengthen somewhat in the beginning of the year, but these expectations did not materialise. The market is consequently expected to remain weak in CONCORDIA MARITIME INTERIM REPORT 2013 JANUARY MARCH 3
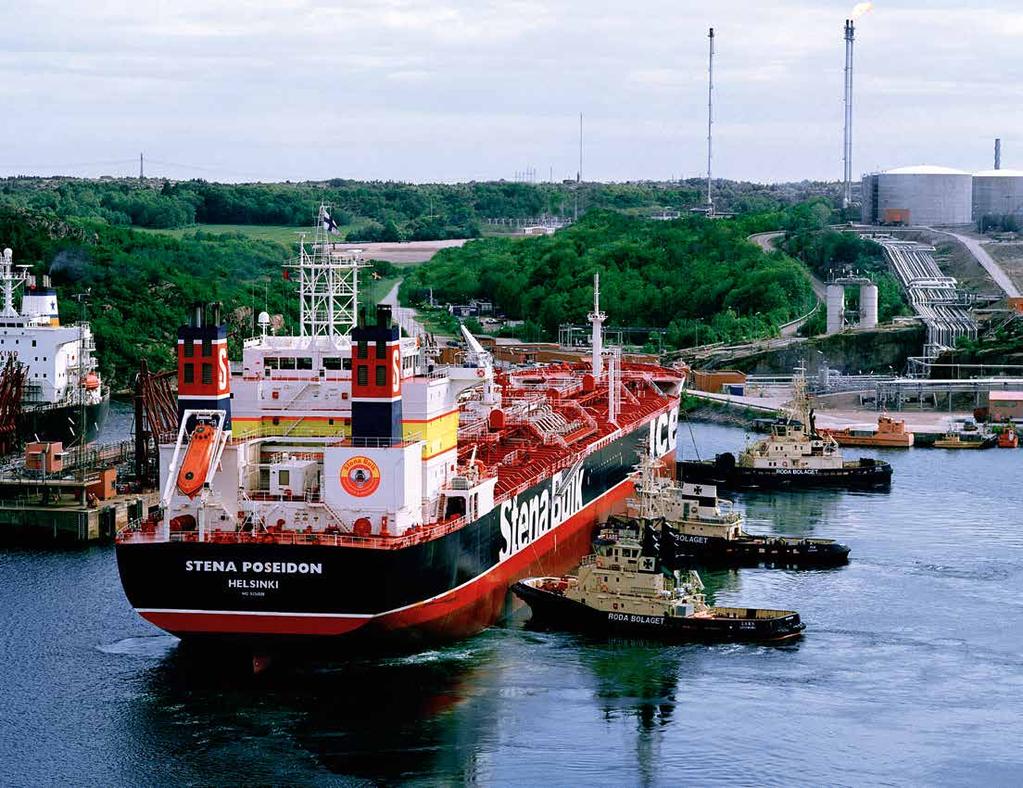
4 BUSINESS ACTIVITIES Our fleet consists of 13 safe, efficient and, above all, flexible vessels; half of our ten P-MAX tankers have been upgraded to enable them to transport vegetable oils. All the vessels operated well and without incidents during the quarter. P-MAX Stena Paris completed her time charter in February, which meant that six of the ten P-MAX tankers were employed on the open market as per March 31st. Stena Primorsk was back in operation during the quarter after undergoing repairs. We do not have any scheduled drydocking for our vessels in Panamax The two Panamax vessels that we own in a joint venture with Neste Shipping, Stena Poseidon and Palva, operated according to plan in their respective charters during the quarter. Suezmax Our suezmax tanker Stena Supreme is still employed on the open market via Stena Sonangol Suezmax Pool, which is controlled by Stena Bulk and the Angolan state oil company Sonangol. The pool, which consists of some 30 modern, efficient suezmax tankers, continues to do a good job in the weak suezmax market. Newbuilding program In June, Concordia Maritime started a newbuilding program consisting of two 50,000 dwt product tankers. The vessels are part of a series being designed with Stena Bulk and Stena Weco, and are being developed in collaboration between Stena Teknik and Guangzhou Shipyard International. The concept is called IMO2MAX, which indicates that they are IMO 2 vessels. The vessels are largely self-designed and have a new hull line, special propellers and a very fuel-efficient main engine. When the tankers are delivered, they will be among the most sophisticated in the market and at the forefront in terms of both energy efficiency and cargo flexibility. The project work for the vessels is proceeding according to plan. Contract portfolio P-MAX Stena Premium Stena Penguin Stena Polaris Stena Progress Stena Perros Stena President Stena Performance Stena Primorsk Stena Provence Stena Paris Panamax Stena Poseidon Palva Suezmax Stena Supreme IMO2MAX IMO2MAX 1 IMO2MAX Contracted Employment on the open market Vessel's delivery date 4 CONCORDIA MARITIME INTERIM REPORT JANUARY MARCH 2013
 Operating result after impairment, SEK mill. 15.7 24.6 333.5 Result after tax, SEK mill. 7.6 20.6 356.0 Available liquid funds, including unutilised credit facilities, SEK mill. 427.0 642.6 484.")
5 BUSINESS ACTIVITIES, CONTD. Key ratios Full Quarter 1 year 2013 EBITDA, SEK mill Operating result before impairment, SEK mill Impairment, SEK mill ) Operating result after impairment, SEK mill Result after tax, SEK mill Available liquid funds, including unutilised credit facilities, SEK mill Result per share after tax, SEK EBITDA per share, SEK Dividend per share, SEK ) Equity per share, SEK Equity ratio, % Growth in equity, % Return on equity, % ) The impairment loss of USD 60 million was defined using the average rate of 6.85 SEK/USD at 30 June and corresponds to SEK million. 2) Refers to dividend per share in May. Product fleet s average freight rate per vessel and day USD per day 20,000 15,000 10,000 5,000 0 Apr May June July Aug Sep Oct Nov Dec Jan Feb Mar Concordia Maritime s income, time charter (base rate + profit-sharing) Concordia Maritime s income, spot Market, time charter (3 years) Market, spot The chart illustrates development of the spot and time charter markets and Concordia Maritime s income for vessels employed in these two markets. The company s income is depicted by green and red lines. EBITDA per quarter USD millions Q Q4 Q3 Q2 Q1 Q Q Q P-MAX, timecharter 1) ) 7.0 5) 6.3 5) ) 8.3 P-MAX, spot 2, Panamax Suezmax Admin. and other ) Total 8.0 2) 8.0 2) 7.8 2) 8.7 2) 9.2 2) ) 0% of accumulated income is attributable to profit sharing. 2) The company reports depreciation of drydock as an operating cost. This amounts to SEK 4.3 million for Q ) Includes one-time payment of USD 2.3 million for redelivery of Stena Provence. 4) Includes one-time payment of USD 1.9 million on conclusion of insurance case relating to V-MAX tanker. 5) For quarter 4,, includes insurance payment of USD 0.2 million. One-time payment of USD 1.0 million (Q2 and Q3 ) and USD 0.3 million (Q4 ) for redelivery of Stena Primorsk and Stena President.
 Spot Time charter Product tankers USD millions 55 Product tankers (MR) Market growth was strong in the early part of")
6 FREIGHT MARKET DEVELOPMENT Product tankers (MR) 1) Suezmax 1) USD per day 18,000 Q2 Q3 Q4 Q USD/day 25,000 15,000 12,000 6,000 5,000 AprMay JuneJuly Aug Sep Oct Nov Dec Jan Feb Mar Spot Time charter 0 Apr May June July Aug Sep Oct Nov Dec Jan Feb Mar NEWBUILDING PRICES 2) Spot Time charter Product tankers USD millions 55 Product tankers (MR) Market growth was strong in the early part of the quarter and freight rates were at their highest levels since December The strengthening of the market is largely due to increased activity in the Atlantic following high demand in Europe, which has resulted in large flows from the United States to Europe. Another contributory factor was the winter season, which not surprisingly increased demand for refined petroleum products. Average rates on the spot market during the quarter were just over USD 17,000 per day. Suezmax The suezmax market remained weak during the quarter. Average freight rates were approx. USD 13,000 per day, and although the level was somewhat better than in the previous two quarters, it was almost half as low as in the first quarter of. Newbuilding prices Newbuilding prices for ships have shown a downward trend in recent years, and looking over the past decade, the trend is even clearer. At the end of the first quarter of 2013, newbuilding prices for both product tankers (approx. USD 33 million) and suezmax tankers (approx. USD 56 million) were at their lowest level in ten years Suezmax USD millions Q Q1 1) The charts show the average value per month on a strictly round trip basis. Source: Fearnleys 2) The charts show the value at the end of each period. Source: Clarkson 6 CONCORDIA MARITIME INTERIM REPORT JANUARY MARCH 2013

7 Financial summary Equity Equity per share was SEK (36.77). Changes in translation and hedging reserves The parent company s functional currency is SEK, although the majority of the transactions in the Group are in USD. The Group s result is generated in USD, which means the result in SEK is a direct function of the SEK/USD exchange rate trend. In August, the Board of Concordia Maritime decided to terminate the equity hedge that amounted to approx. 50 percent of equity in foreign subsidiaries (corresponding to USD 125 million). The accumulated exchange differences including the effects of forward contracts, which are recognised in equity, amounted to SEK 33.1 (41.4) million. The changes are recognised in equity through OCI. The company has entered into interest rate swaps totalling USD 140 million to protect itself against interest rate fluctuations. They are structured in such a way as to cover approx. 60 percent of anticipated future borrowing within existing credit facilities and expire in At the end of the first quarter, the value of these contracts was SEK 33.7 ( 46.9) million, which is recognised in the hedging reserve through OCI. Since 2011, financial investments in NOK have been hedged by NOK/USD foreign exchange forward contracts in order to make them currency-neutral. Hedging was previously used, with the change in value of the forward contract being recognised in the hedging reserve through OCI. In the fourth quarter of, the Group stopped using hedge accounting for currency risks, and the changes in value of the forward contracts are now recognised in the income statement. At the end of the period, the total hedging reserve stood at SEK 33.7 ( 48.5) million. Investments Investments during the period January to March amounted to SEK 3.8 (11.7) million and relate to advance payments for two tankers, with delivery of the first scheduled for the end of The Group s total income and earnings Quarter 1 Full year SEK millions 2013 Net sales Operating result before impairment Operating result after impairment Result after financial net Result per share after tax, SEK Liquidity and financial position SEK millions 31 March March Available liquid funds 1) Interest-bearing liabilities 1, ,698.6 Equity 1, ,754.8 Equity ratio, % ) Includes unutilised available credit facilities.

8 FINANCIAL SUMMARY, CONTD. Impairment The Group s assets are assessed on a six-monthly basis to determine whether there is any indication of impairment. The fleet is defined as a cash-generating unit, and an impairment loss is recognised when the carrying amount of an asset or cash generating unit exceeds its recoverable amount. An impairment loss of USD 60 million (SEK million) was recognised for the fleet on 30 June, and was based on an overall assessment of future earnings, newbuilding prices and average values from three independent ship brokers. Impairment testing of the asset values at 31 December did not indicate any impairment. Seasonal variations The fact that six of our total fleet of 13 vessels were chartered out on fixed contracts partly counteracts the seasonal variations that can otherwise occur in tanker shipping. Parent The parent company s total income for the first quarter amounted to SEK 0 (0) million. Intragroup invoicing represented SEK 0 (0) million of this amount. The parent company s result after financial items for the first quarter amounted to SEK 7.9 (29.7) million. The parent company s available liquid funds amounted to SEK 1,695.1 (1,880.1) million, which includes receivables from Group companies in the cash pool and unutilised credit facilities. Events after the reporting date The time charter for Stena Primorsk entered into in November has been prematurely terminated. With effect from 12 April, Concordia Maritime has seven P-MAX vessels on the open market. Employees and option programs The number of employees in the Group at 31 March 2013 is 391 (380), 385 (374) of whom are seagoing employees. There are no option programs in place. Financial investments The bond portfolio is classified under available-for-sale financial assets and is recognised at market value in OCI. At the end of the quarter, bonds were owned in Teekay Offshore, Teekay LNG, Rabobank, Golden Close Maritime, Kungsleden Fastigheter, Wind Acquisition, Bonheur and Svensk Exportkredit. The total value of the bond portfolio was USD 14.5 (15.4) million. Total short-term investments corresponded to SEK 94.2 (102.1) million. Exchange differences in other comprehensive income SEK millions Exchange differences Q1 Exchange rate SEK/USD As a result of SEK/USD exchange rate movements in, the company s profit in SEK has changed, while profit in USD remains unchanged. SEK CONCORDIA MARITIME INTERIM REPORT JANUARY MARCH 2013
9 OTHER INFORMATION Related party transactions Concordia Maritime has a small internal organisation, and purchases services from related-party companies in Stena Sphere, which include Stena Bulk. The latter company conducts tanker business which competes with Concordia Maritime in some respects. Accordingly, there is an agreement, entered into many years ago, which regulates the r elationship between the two companies with respect to new business. Under the terms of this agreement, Concordia Maritime has the right to opt for 0, 50 or 100 percent participation in each new transaction. At the beginning of April 2011, Stena Bulk started a joint venture together with the Danish company Weco, resulting in a newly established company, Stena Weco. Stena Weco specialises mainly in the transportation of vegetable oils. Under a new agreement with Stena Bulk, Concordia Maritime is entitled to the financial result arising from vessels that may from time to time be chartered in by Stena Weco for a period of more than one year, should Concordia Maritime decide to participate in such charters. Other business generated by Stena Weco is not available to Concordia Maritime. Stena Teknik Newbuilding and conversion projects, R&D and procurement stenateknik.com Concordia Maritime Stena Bulk Stena Weco Chartering and commercial operation stenabulk.com stenaweco.com Northern Marine Management Operation, manning and maintenance nmm-stena.com Flexible and safe transportation with good transport economy Concordia Maritime purchases services on a regular basis from the Stena Sphere in the following areas: Vessel charter. Payment is based on a commission of 1.25 percent on freight rates. Commission on the purchase and sale of vessels. Payment is based on a commission of 1 percent. Operation and manning of the Group s vessels, also referred to as ship management. Payment is based on a fixed price per year and vessel. Purchases of bunker oil. Payment is based on a fixed commission per ton purchased. Administration, marketing, insurance, technical monitoring and development of Concordia Maritime s fleet. Payment is based on a fixed price per month and vessel. With regard to technical consulting services for newbuild projects, an hourly rate is applied on a cost-plus basis, which is then charged to the project. Office rent and office services. A fixed annual price is charged. All related party transactions are conducted on commercial terms and at market-related prices. Risks and uncertainties Concordia Maritime is exposed to various types of risks. The main market-related factors affecting the company include the general economy, freight rates, oil prices and political factors. Risks related to operational activities include ship management, insurance and employees. Concordia Maritime is also exposed to credit and financial risks. The management and the board work actively to minimise risk exposure and to minimise the consequences and effects of a risk nevertheless materialising. Further information can be found in the annual report. Type of risk 1. Corporate risks A Brand 2. Market-related risks 3. Operational risks B Employees C Liquidity D Financing risk A Economic trend B Freight rates C Oil price D Political risk E War and instability A Ship operation and insurance B Environment 4. Credit risks A Counterparty risks customer Impact Very large Large Medium Small Negligible A Improbable Unlikely Probability B Counterparty risks shipyards and partners A B C A D B B D Possible A C B E Likely Probable CONCORDIA MARITIME INTERIM REPORT 2013 JANUARY MARCH 9
10
11 Group INCOME STATEMENT, OTHER COMPREHENSIVE INCOME AND PER-SHARE DATA SEK millions Quarter Quarter 1 Full year CONSOLIDATED INCOME STATEMENT Average exchange rate SEK/USD Time charter income Spot charter income Total income Operating costs, ships Seagoing personnel costs Other external costs Personnel expenses Depreciation Total operating costs Operating result before impairment Impairment ) Operating result after impairment Interest and similar income Interest and similar expense Financial net Result after net financial items Tax Net result after tax Other comprehensive income Items that have been, or can be, transferred to result for the period Translation differences Equity hedging Available-for-sale financial assets Cash flow hedges, currency-related Cash flow hedges, interest-related Tax attributable to items that have been, or can be, transferred to result for the period Comprehensive income for the period Per-share data, SEK Number of shares 47,729,798 47,729,798 47,729,798 Result per share, before/after dilution Equity per share, SEK ) The impairment loss of USD 60 million was defined using the average rate of 6.85 SEK/USD at 30 June and corresponds to SEK million. CONCORDIA MARITIME INTERIM REPORT 2013 JANUARY MARCH 11

12 GROUP CONDENSED BALANCE SHEET SEK millions 31 Mar Mar 31 Dec Closing exchange rate SEK/USD Assets Ships and equipment 3, , ,064.5 Ships under construction Financial assets Total non-current assets 3, , ,112.5 Current receivables Short-term investments Cash and bank balances Total current assets Total assets 3, , ,480.7 Equity and liabilities Equity 1, , ,330.8 Non-current liabilities 1, , ,979.6 Current liabilities Total equity and liabilities 3, , ,480.7 CHANGES IN EQUITY SEK millions Share capital Other paid-in capital Translation reserve Hedging reserve Fair value reserve Retained earnings Total Changes Jan Mar 2013 Opening balance ,330.8 Comprehensive income for the period Dividends Closing balance ,343.1 Changes Jan Mar Opening balance , ,777.6 Comprehensive income for the period Dividends Closing balance , , CONCORDIA MARITIME INTERIM REPORT JANUARY MARCH 2013

13 GROUP CONDENSED CASH FLOW STATEMENT SEK millions Quarter Quarter 1 Full year Operating activities Result after net financial items Adjustments: Depreciation Result, sale of non-current assets Result, sale of securities Other items Cash flow from operating activities before changes in working capital Changes in working capital Cash flow from operating activities Investing activities Sale of non-current assets Investment in non-current assets Investment in financial assets Sale of financial assets Cash flow from investing activities Financing activities New loans 0.0 1, Amortisation of loans 3.2 2, Dividend to shareholders 47.7 Cash flow from financing activities Cash flow for the period Balance at beginning of period (Note 1) Exchange differences (Note 2) Balance at end of period (Note 1) Note 1. Balance consists of cash, bank balances and credit facility Note 2. Exchange differences attributable to: Cash and cash equivalents at beginning of year Cash flow for the period
14 QUARTERLY OVERVIEW SEK millions Quarter Quarter 4 Quarter 3 Quarter 2 Quarter 1 Quarter Quarter Quarter Profit/ loss items Total income Operating costs excluding impairment Operating result (EBIT) of which profit/loss on ship sales Financial net Result after financial items Net result after tax Cash flow from operating activities EBITDA Balance-sheet items Ships (number) 3,028.2 (12) 3,064.5 (12) 3,105.1 (12) 3,287.5 (12) 3,130.4 (11) 3,291.1 (11) 3,295.0 (11) 3,066.8 (11) Ships under construction (number) 50.5 (2) 48.0 (2) 46.6 (2) (1) (1) (1) 87.5 (1) Liquid funds incl. investments Other assets Interest-bearing liabilities 1, , , , , , , ,619.8 Other liabilities and provisions Equity 1, , , , , , , ,639.9 Total assets 3, , , , , , , ,418.6 Key ratios, % Equity ratio Return on total capital Return on capital employed Return on equity Operating margin Share data Total income Operating costs excluding impairment Operating result before impairment Financial net Net result after tax Cash flow EBITDA Equity Please note that there has been no dilution effect since Definitions: see page CONCORDIA MARITIME INTERIM REPORT JANUARY MARCH 2013
15 PARENT COMPANY CONDENSED INCOME STATEMENT AND BALANCE SHEET SEK millions Quarter Quarter 1 Net sales Other external costs Personnel expenses Operating result Other interest and similar income Interest and similar expense Result after financial items Tax Result for the period The Concordia Maritime Group applies International Financial Reporting Standards (IFRS) as adopted by the EU. The Group applies the same accounting policies and calculation methods in the quarterly reports as in the annual report for, in addition to those described in this report. The Group s interim report has been prepared in accordance with IAS 34. The report for the Parent Company has been prepared in accordance with the Swedish Annual Accounts Act and RFR recommendations. This report gives a true and fair view of the operations, financial position and performance of the Parent Company and Group, and describes significant risks and uncertainties to which the Group is exposed. This report has not been reviewed by the company s auditors. SEK millions 31/03/ /03/ Assets Ships and equipment Financial assets Investments in Group companies Total non-current assets Current receivables Short-term investments Short-term receivables, Group companies 1, ) 1, ) Cash and bank balances ) ) Total current assets 1, ,375.7 Total assets 2, ,156.7 Equity and liabilities Equity Non-current liabilities 1, ,504.4 Current liabilities Total equity and liabilities 2, ,156.7 Pledged assets Contingent liabilities 1) 1) With effect from January 2013, the cash pool is classified into cash and bank balances, and short-term receivables from Group companies. The parent company previously classified the entire cash pool holding as cash and bank balances. Comparative figures have also been declassified accordingly. 2) The parent company has also provided a guarantee for a subsidiary, which relates to vessel financing. Gothenburg, 23 April 2013 Concordia Maritime AB (publ) Hans Norén President CONCORDIA MARITIME INTERIM REPORT 2013 JANUARY MARCH 15
16 ACCOUNTING POLICIES This interim financial report in summary for the Group has been prepared in accordance with IAS 34 Interim Financial Reporting and relevant provisions of the Swedish Annual Accounts Act. The interim report for the parent company has been prepared in accordance with chapter 9 of the Swedish Annual Accounts Act. For the Group and parent company, the same accounting principles and computation methods have been applied as in the most recent annual report. DEFINITIONS Cash flow from operating activities Result after net financial items plus depreciation minus tax paid (cash flow before change in working capital and investments and before effect of ship sales). Return on total capital Result after net financial items plus financial expenses as a percentage of average total assets. The information in this report is information that Concordia Maritime is required to disclose in accordance with the Swedish Securities Market Act and/or the Swedish Financial Instruments Trading Act. The information was made public on the date of the AGM, 23 April 2013, at approx. 2 p.m. INFORMATION AND CONTACT Reports and information Q2 Interim Report August 2013 Q3 Interim Report November 2013 Return on capital employed Result after net financial items plus financial expenses as a percentage of average capital employed. Capital employed refers to total assets minus non-interest-bearing liabilities,including deferred tax liability. Return on equity Result for the year as a percentage of average equity. Equity ratio Equity as a percentage of total assets. Spot charter (open market) Hiring of vessels on a voyage-by-voyage basis. Time charter Hiring of vessels for a specified period at a fixed rate. Hans Norén, President or hans.noren@ concordiamaritime.com Anna Forshamn, CFO or anna.forshamn@ concordiamaritime.com Concordia Maritime Gothenburg, Sweden Tel Reg. no CONCORDIA MARITIME INTERIM REPORT JANUARY MARCH 2013
Weak market during the quarter Stena Primorsk chartered out to new customer Another P-MAX tanker, Stena President, converted to IMO 3
 INTERIM REPORT 1 JANUARY 30 SEPTEMBER 2012 Weak market during the quarter Stena Primorsk chartered out to new customer Another P-MAX tanker, Stena President, converted to IMO 3 Quarter 3 (Jul Sep) 9 months
INTERIM REPORT 1 JANUARY 30 SEPTEMBER 2013
 INTERIM REPORT 1 JANUARY 30 SEPTEMBER 2013 Q3 freight rates for vessels on the open market slightly better than in Q2 Nine of the fleet s 13 vessels employed on the open market P-MAX through the Northeast
INTERIM REPORT 1 JANUARY 31 MARCH 2014
 INTERIM REPORT 1 JANUARY 31 MARCH 2014 Profit for the quarter good start to the year New chartering strategy beginning to produce results Total and Shell contracts delivered Agreement for the sale of two
INTERIM REPORT 1 JANUARY 30 SEPTEMBER 2014
 INTERIM REPORT 1 JANUARY 30 SEPTEMBER Market stronger than in previous quarter, but still weak Loss of SEK 27.0 million for the quarter Profit expected for the full year Quarter 3 (Jul Sep) 9 months (Jan
YEAR-END REPORT 1 JANUARY 31 DECEMBER 2013
 YEAR-END REPORT 1 JANUARY 31 DECEMBER Weaker market than expected during the year, particularly in the last quarter New agreements signed with Total and Shell after the end of the period The Board will
INTERIM REPORT 1 January 31 March 2015
 INTERIM REPORT 1 January 31 March 2015 Strong start to the year the market has turned Result before tax SEK 28.1 (10.2) million EBITDA SEK 82.2 (51.7) million AFTER THE END OF THE REPORTING PERIOD Renewal
INTERIM REPORT 1 January 30 June 2015
 INTERIM REPORT 1 January 30 June 2015 Result before tax, Q2: SEK 44.0 (42.1) million 6 months: SEK 72.2 (52.3) million EBITDA, Q2: SEK 99.5 (86.5) million 6 months: SEK 181.7 (138.2) million Average income
YEAR-END REPORT 1 January 31 December 2015
 YEAR-END REPORT 1 January 31 December Total income, Q4: SEK 217.6 (125.7) million Full year : SEK 810.0 (531.2) million Result before tax, Q4: SEK 49.8 ( 12.7) million Full year : SEK 174.3 (16.5) million
Concordia Maritime. interim report 1 january 31 march 2008
 Concordia Maritime Net sales: SEK 132.7 (118.1) million Profit after tax: SEK 20.4 million (5.2) million Profit per share after tax: SEK 0.43 (0.11) EBITDA of USD 6.6 (2.0) million, an increase of approx.
INTERIM REPORT 1 January 31 March 2016
 INTERIM REPORT 1 January 31 March 2016 Total income 1), Q1: SEK 263.6 (255.5) million Full year 2015: SEK 1,086.6 (907.6) million Result before tax, Q1: SEK 33.4 (28.1) million Full year 2015: 174.3 (16.5)
INTERIM REPORT 1 January 30 June 2016
 INTERIM REPORT 1 January 30 June Total income 1), Q2: SEK 280.8 (285.6) million : SEK 544.4 (546.6) million EBITDA, Q2: SEK 57.2 (105.2) million : SEK 160.6 (192.5) million Result before tax, Q2: SEK 12.4
INTERIM REPORT 1 January 30 September 2016
 INTERIM REPORT 1 January 30 September Total income 1), Q3: SEK 215.3 (287.6) million : SEK 759.7 (834.0) million EBITDA, Q3: SEK 50.9 (114.0) million : SEK 211.4 (306.6) million Result before tax, Q3:
Challenging tanker market continues
 INTERIM REPORT, 1 JANUARY 31 MARCH 2018 Challenging tanker market continues Total income, Q1: SEK 199.6 (233.0) million EBITDA, Q1: SEK 7.0 (29.3) million Result before tax, Q1: SEK 38.7 ( 41.2) million
Interim report, 1 January 30 June 2017
 Interim report, 1 January 30 June 2017 Total income 1) Q2: SEK 211.1 (280.8) million 6 months: SEK 436.0 (544.4) million Result after tax Q2: SEK 43.9 (12.4) million 6 months: SEK 85.1 (45.8) million EBITDA
Year-end report 1 January 31 December 2017
 Year-end report 1 January 31 December 2017 Total income 1), Q4: SEK 193.8 (278.5) million Full year 2017: SEK 827.5 (1038.2) million EBITDA, Q4: SEK 10.1 (108.4) million Full year 2017: SEK 51.3 (319.9)
Weak tanker market awaits turnaround
 Stena Perros in the Panama Canal. INTERIM REPORT, 1 JANUARY 30 JUNE Weak tanker market awaits turnaround Total income Q2: SEK 227.0 (211.1) million HY1: SEK 426.6 (436.0) million EBITDA Q2: SEK 9.3 (10.0)
DELIVERY OF TWO IMOIIMAX VESSELS ANNUAL REPORT 2015 BEST NICHE INCREASED SHARE OF YEAR TRADES SINCE 2001
 DELIVERY OF TWO IMOIIMAX VESSELS ANNUAL REPORT 2015 BEST YEAR SINCE 2001 INCREASED SHARE OF NICHE TRADES CONTENTS BUSINESS ACTIVITIES The year in brief 1 CEO s overview 2 IMOIIMAX: A fleet in renewal 4
CONCORDIA MARITIME AB (PUBL) Capital Link London Conference October 2015
 Capital Link London Conference October 2015") CONCORDIA MARITIME AB (PUBL) Capital Link London Conference October 2015 Kim Ullman, CEO Ola Helgesson, CFO Vision and business concept Concordia Maritime is an international shipping company Founded
CONCORDIA MARITIME AB (PUBL) Capital Link London Conference October 2015 Kim Ullman, CEO Ola Helgesson, CFO Vision and business concept Concordia Maritime is an international shipping company Founded
The result before taxes amounts to SEK (892) million for the three month period ended 31 March 2018,
 million for the three month period ended 31 March 2018,") STENA AB (publ.) Interim Report for the three-month period 1 January 31 March 2018 Highlights: The result before taxes amounts to SEK (892) million for the three month period ended 31 March 2018, compared
STENA AB (publ.) Interim Report for the three-month period 1 January 31 March 2018 Highlights: The result before taxes amounts to SEK (892) million for the three month period ended 31 March 2018, compared
Interim Report First quarter 2018
 Interim Report First quarter DAMPSKIBSSELSKABET NORDEN A/S 52, STRANDVEJEN, DK-2900 HELLERUP, DENMARK WWW.DS-NORDEN.COM CVR NUMBER 67758919 1/24 INTERIM REPORT First quarter Results Markets Performance
Interim Report Second quarter of 2018
 Interim Report Second quarter of DAMPSKIBSSELSKABET NORDEN A/S 52, STRANDVEJEN, DK-2900 HELLERUP, DENMARK WWW.DS-NORDEN.COM CVR NUMBER 67758919 1/25 INTERIM REPORT Second quarter of Results Markets Performance
Interim report - third quarter 2007
 OMX Nordic Exchange Copenhagen A/S Nikolaj Plads 6 1067 Copenhagen K Announcement no. 39 29 November 2007 Interim report - third quarter 2007 The first three quarters - highlights The profit for the third
RIDGEBURY CRUDE TANKERS LLC 33 Riverside Ave Westport CT 06880
 RIDGEBURY CRUDE TANKERS LLC 33 Riverside Ave Westport CT 06880 QUARTERLY REPORT (UNAUDITED) June 30, 2015 Westport, Connecticut, August 20, 2015 Ridgebury Crude Tankers LLC ( RCT or Ridgebury Crude ) is
PRESENTATION OF NORDEN
 PRESENTATION OF NORDEN Jyske Bank Company Day 27 November 214 CFO Michael Tønnes Jørgensen Presentation of NORDEN 1 AGENDA NORDEN at a glance Group highlights Financials Dry Cargo Tankers 214 expectations
ANNOUNCEMENT NO TO THE COPENHAGEN STOCK EXCHANGE
 ANNOUNCEMENT NO. 13 2003 TO THE COPENHAGEN STOCK EXCHANGE 21 November 2003 TORM - Interim report for the first nine months of 2003 maintains expectations for 2003 Net profit for the first nine months of
NORDEN RESULTS. Third quarter of Hellerup, Denmark. 12 November Our business is global tramp shipping
 NORDEN RESULTS Third quarter of 214 Hellerup, Denmark 12 November 214 NORDEN Third quarter of 214 results 1 AGENDA Group highlights Financials Dry Cargo Tankers 214 expectations Q & A NORDEN Third quarter
INTERIM REPORT 1 JANUARY 31 MARCH 2015
 INTERIM REPORT 1 JANUARY 31 MARCH 2015 Quarterly period January-March, continuing Reported revenue, earnings, cash flow and financial ratios relate to continuing, and do not include Poolia UK. Revenue
Q Results August 29, 2012
 Q2 2012 Results August 29, 2012 Forward looking statements MATTERS DISCUSSED IN THIS DOCUMENT MAY CONSTITUTE FORWARD-LOOKING STATEMENTS. THE PRIVATE SECURITIES LITIGATION REFORM ACT OF 1995 PROVIDES SAFE
INTERIM REPORT 1 JANUARY 30 SEPTEMBER 2013
 INTERIM REPORT 1 JANUARY 30 SEPTEMBER 2013 Quarterly period July-September Poolia's revenue amounted to SEK 178.2 (217.8) million, a decline of 18.2% (18.5% in local currency). Operating profit/loss was
INTERIM REPORT 1 JANUARY 31 MARCH 2017
 INTERIM REPORT 1 JANUARY 31 MARCH 2017 Quarterly period January-March Reported revenue, earnings, cash flow and financial ratios relate to continuing operations, and do not include Poolia UK. Poolia s
Interim financial report for the period 1 January to 30 September 2010
 Page 1 of 7 Interim financial report for the period 1 January to 30 September Highlights EBITDA was MUSD 5.2 for the first nine months, adjusted for the share options programme of MUSD 7.6. The result
Net interest-bearing debt amounted to USD 1,871 million in the first quarter of 2013, compared to USD 1,868 million as at 31 December 2012.
 Interim report for the first quarter 2013 In the first quarter of 2013, TORM realized a positive EBITDA of USD 36 million and a loss before tax of USD 16 million. The seasonally strong first quarter in
INTERIM REPORT 1 JANUARY 31 MARCH 2012
 INTERIM REPORT 1 JANUARY 31 MARCH 2012 Quarterly period January-March Poolia's operating income amounted to SEK 276.7 (283.6), million, which is a decline of -2.4%, (-2.6% in local currency). Operating
NORDEN RESULTS. First quarter of Hellerup, Denmark. 13 May Our business is global tramp shipping. NORDEN - First quarter of 2014 results 1
 NORDEN RESULTS First quarter of 214 Hellerup, Denmark 13 May 214 NORDEN - First quarter of 214 results 1 AGENDA Group highlights Financial Dry Cargo Tankers 214 expectations Q & A NORDEN - First quarter
TORM REPORTS NINE MONTHS RESULTS IN LINE WITH EXPECTATIONS AND MAINTAINS OUTLOOK FOR THE YEAR.
 3. quarter 2002 A/S Dampskibsselskabet TORM Marina Park Sundkrogsgade 10 DK-2100 Copenhagen Ø Denmark Tel: +45 39 17 92 00 Fax: +45 39 17 93 93 Telex: 22315 TORM DK E-mail: Website: Comtext: mail@torm.dk
The cash flow from operating activities for the first quarter of 2010 was USD 21 million.
 TORM posted a profit before tax of USD 3 million in the first quarter of 2010 under continued difficult market conditions. During the first quarter of 2010, the winter market and the increased industry
FINAL HALF YEAR RESULTS 2015
 20 AUGUST 8 a.m. CET FINAL HALF YEAR RESULTS HIGHLIGHTS Interim dividend of USD 0.62 (to be paid in September) Adding the USD 0.25 already paid in May, brings the total dividend paid in under the new dividend
INTERIM REPORT January 1 September 30, 2018 Published November 30, 2018
 INTERIM REPORT January 1 September 30, 2018 Published November 30, 2018 Continued strong revenue growth and the delivery of the second B737-800 Next Generation Freighter highlighted the third quarter,
PAO SOVCOMFLOT CONDENSED CONSOLIDATED INTERIM FINANCIAL STATEMENTS (UNAUDITED) 30 June 2018
 30 June 2018") PAO SOVCOMFLOT CONDENSED CONSOLIDATED INTERIM FINANCIAL STATEMENTS (UNAUDITED) 30 June 2018 1 Contents Consolidated Income Statement 2 Consolidated Statement of Comprehensive Income 3 Consolidated Statement
PAO SOVCOMFLOT CONDENSED CONSOLIDATED INTERIM FINANCIAL STATEMENTS (UNAUDITED) 30 June 2018 1 Contents Consolidated Income Statement 2 Consolidated Statement of Comprehensive Income 3 Consolidated Statement
Interim Report Third quarter of 2018
 Interim Report Third quarter of NORD COLORADO, built Supramax vessel calling Melbourne, Australia DAMPSKIBSSELSKABET NORDEN A/S 52, STRANDVEJEN, DK-2900 HELLERUP, DENMARK WWW.DS-NORDEN.COM CVR NUMBER 67758919
First quarter of 2016
 ANNOUNCEMENT NO. 11 4 MAY INTERIM REPORT First quarter of Adjusted result for the period : USD -5 million. ( Results for the period adjusted for Profits from the sale of vessels etc. and Fair value adjustment
INTERIM REPORT JAN - MAR 2018
 M INTERIM REPORT JAN - MAR 2018 JANUARY - MARCH Net sales increased by 12% to SEK 23.6m (21.1). Adjusted for currency exchange rate effects the increase was 20% Operating profit increased to SEK 1.8m (-4.9).
Contact A/S Dampskibsselskabet TORM Tel.:
 FIRST QUARTER REPORT 2006 THE RESULT WAS BETTER THAN EXPECTED Profit before tax for the first quarter of 2006 was USD 59.3 mill. (DKK 368.3 mill.). The result was better than expected. Expectations for
TORM A/S first quarter 2016 report
 TORM A/S first quarter 2016 report The EBITDA for the first quarter of 2016 was USD 70m (2015, same period, pro forma: USD 77m) 1. The profit before tax for the first quarter of 2016 was USD 31m (2015,
Interim report January - March First quarter. The group in brief
 Interim report January - March 2017 First quarter Net sales increased by 105% to MSEK 21.1 (10.3) Operating profit declined to MSEK -4.9 (-3.3). Adjusted operating profit* increased to MSEK 1.6 (-3.3)
FOURTH QUARTER AND FINANCIAL YEAR 2002 RESULTS
 FRONTLINE LTD. FOURTH QUARTER AND FINANCIAL YEAR RESULTS Frontline Ltd. reports earnings before interest, tax, depreciation, and amortisation including earnings from associated companies (EBITDA) of $105.3
PAO SOVCOMFLOT CONDENSED CONSOLIDATED INTERIM FINANCIAL STATEMENTS (UNAUDITED) 30 September 2017
 30 September 2017") PAO SOVCOMFLOT CONDENSED CONSOLIDATED INTERIM FINANCIAL STATEMENTS (UNAUDITED) 30 September 2017 1 Contents Condensed Consolidated Income Statement 2 Condensed Consolidated Statement of Comprehensive Income
PAO SOVCOMFLOT CONDENSED CONSOLIDATED INTERIM FINANCIAL STATEMENTS (UNAUDITED) 30 September 2017 1 Contents Condensed Consolidated Income Statement 2 Condensed Consolidated Statement of Comprehensive Income
INTERIM RESULTS FOR THE HALF YEAR ENDED 30 JUNE 2018
 INTERIM RESULTS FOR THE HALF YEAR ENDED 30 JUNE TORM INTERIM RESULTS FOR THE HALF YEAR ENDED 30 JUNE 331 HIGHLIGHTS Despite healthy end-user consumption, the product tanker market remained under pressure
NORDEN RESULTS. Q2 report. Copenhagen, Denmark 15 August Q2 REPORT 2018 CUSTODIANS OF SMARTER GLOBAL TRADE
 NORDEN RESULTS Q2 report Copenhagen, Denmark 15 August 218 1 Q2 REPORT 218 CUSTODIANS OF SMARTER GLOBAL TRADE AGENDA Business update Dry Cargo Q2 update Market outlook Tankers Q2 update Market outlook
Interim Report for Duni AB (publ) 1 January 31 December 2010 (compared with the same period of the previous year)
 1 January 31 December 2010 (compared with the same period of the previous year)") Interim Report for Duni AB (publ) 1 January 31 (compared with the same period of the previous year) 16 February 2011 Improved operating margin of 14.8% for the quarter 1 January 31 Net sales amounted to
Interim Report for Duni AB (publ) 1 January 31 (compared with the same period of the previous year) 16 February 2011 Improved operating margin of 14.8% for the quarter 1 January 31 Net sales amounted to
HUFVUDSTADEN Interim Report January September 2013
 3 HUFVUDSTADEN Interim Report January 2013 Interim Report January 2013 GROUP RESULTS Gross profit from property management increased by 6 per cent and amounted to SEK 851 million (800), which can be attributed
Interim report first half-year 2009
 NASDAQ OMX Copenhagen A/S Nikolaj Plads 6 DK-1067 Copenhagen K Announcement no. 26 19 August 2009 Interim report first half-year 2009 First half-year highlights The profit for the first half-year of 2009
Interim Report BE Group AB (publ) 2017 Malmö, October 24, Strongly improved underlying operating result
 2017 Malmö, October 24, Strongly improved underlying operating result") BE Q3 Interim Report BE Group AB (publ) Malmö, October 24, Strongly improved underlying operating result THIRD QUARTER Net sales increased by 9 percent to SEK 968 M (892), excluding operations under restructuring,
BE Q3 Interim Report BE Group AB (publ) Malmö, October 24, Strongly improved underlying operating result THIRD QUARTER Net sales increased by 9 percent to SEK 968 M (892), excluding operations under restructuring,
Teekay Tankers. Q Earnings Presentation. February 21, 2019
 Teekay Tankers Q4 2018 Earnings Presentation February 21, 2019 Forward Looking Statement This presentation contains forward-looking statements (as defined in Section 21E of the Securities Exchange Act
Third quarter of 2016
 ANNOUNCEMENT NO. 22 9 NOVEMBER INTERIM REPORT Third quarter of Adjusted result for the period* : USD -12 million ( : USD 18 million). EBIT : USD -13 million (USD 21 million), of which vessel sales make
STENA AB (publ.) Interim Report for the nine-month period 1 January 30 September 2017
 Interim Report for the nine-month period 1 January 30 September 2017") STENA AB (publ.) Interim Report for the nine-month period 1 January 30 September 2017 Highlights: Income before taxes amounts to SEK 1,112 million for the nine month period ended 30 September 2017, compared
STENA AB (publ.) Interim Report for the nine-month period 1 January 30 September 2017 Highlights: Income before taxes amounts to SEK 1,112 million for the nine month period ended 30 September 2017, compared
Investments and adaptations for the future one-off costs impacting the result
 Interim report January 1 September 30, 2017 Odd Molly International AB (publ) Stockholm, Sweden, October 24, 2017 Investments and adaptations for the future one-off costs impacting the result JULY 1 SEPTEMBER
A.P. Møller - Mærsk A/S
 A.P. Møller - Mærsk A/S Interim Management Statement Conference call 9.3 am CET Webcast available at www.maersk.com PAGE 1 Forward-looking statements The presentation contains forward-looking statements.
NYSE: GNRT. Gener8 Maritime. Gener8 Maritime, Inc. Earnings Presentation Second Quarter 2017
 Gener8 Maritime Gener8 Maritime, Inc. Earnings Presentation Second Quarter 2017 August 1, 2017 Safe Harbor Under the Private Securities Litigation Reform Act of 1995 This presentation contains forward-looking
Clas Ohlson: Year-end report 1 May April 2013
 Clas Ohlson: Year-end report 1 May 2012 30 April 2013 Fourth quarter * Sales totalled SEK 1,274 M (1,272). In local currencies, growth was 3%. * Operating loss of SEK 19 M reported (profit: 10). * Loss
NORDEN RESULTS. Annual Report Copenhagen, Denmark 14 March Annual report 2017 CUSTODIANS OF SMARTER GLOBAL TRADE
 NORDEN RESULTS Annual Report 217 Copenhagen, Denmark 14 March 218 1 Annual report 217 CUSTODIANS OF SMARTER GLOBAL TRADE AGENDA The NORDEN DNA Business update Market Review Latest developments Outlook
was RESULTS Q May 30, 2018
 was RESULTS Q1-2018 May 30, 2018 FORWARD-LOOKING STATEMENTS Matters discussed in this presentation may constitute forward-looking statements. The Private Securities Litigation Reform Act of 1995 provides
BW LPG Limited con. Condensed Consolidated Interim Financial Information Q3 2017
 Q2 BW LPG Limited con Condensed Consolidated Interim Financial Information This report is not for release, publication or distribution (directly or indirectly) in or to the United States, Canada, Australia
Interim report January-March 2012
 Interim report January-March 2012 PERIOD 1 JANUARY - 31 MARCH 2012 Net sales SEK 28.1 million (29.4 million) INCOME STATEMENT SUMMARY PERIOD 1 OCTOBER - 31 DECEMBER 2011 Net sales SEK 34.5 million (28.7
INTERIM REPORT 1 JANUARY 31 MARCH 2018
 INTERIM REPORT 1 JANUARY 31 MARCH 2018 Quarterly period January-March Poolia s revenue amounted to SEK 200.4 (199.2) million. Operating profit amounted to SEK 4.8 (7.0) million, with an operating margin
NORDEN RESULTS. Annual Report Copenhagen, Denmark. 1 March 2017 NORDEN ANNUAL REPORT 2016 RESULTS 1. Custodians of smarter global trade
 NORDEN RESULTS Annual Report 216 Copenhagen, Denmark 1 March 217 NORDEN ANNUAL REPORT 216 RESULTS 1 AGENDA Group highlights Financials Dry Cargo Tankers 217 expectations Q & A NORDEN ANNUAL REPORT 216
ANNOUNCEMENT NO TORM results for first half 2004
 ANNOUNCEMENT NO. 10-2004 TORM results for first half 2004 12 August 2004 First half 2004 profits better than expected expectations for 2004 profit before tax and value adjustment on NORDEN shares increased
STENA AB (publ.) Interim Report for the nine-month period 1 January 30 September 2018
 Interim Report for the nine-month period 1 January 30 September 2018") STENA AB (publ.) Interim Report for the nine-month period 1 January 30 September 2018 Highlights: Income before taxes amounts to SEK 1,076 million for the nine month period ended 30 September 2018, compared
STENA AB (publ.) Interim Report for the nine-month period 1 January 30 September 2018 Highlights: Income before taxes amounts to SEK 1,076 million for the nine month period ended 30 September 2018, compared
STENA AB (publ.) Interim Report for the three-month period 1 January 31 March Highlights:
 Interim Report for the three-month period 1 January 31 March Highlights:") STENA AB (publ.) Interim Report for the three-month period 1 January 31 March 2013 Highlights: First quarter 2013 result before tax MSEK 121 vs MSEK (190) in Q1 2012 Consolidated EBITDA increased by MSEK
STENA AB (publ.) Interim Report for the three-month period 1 January 31 March 2013 Highlights: First quarter 2013 result before tax MSEK 121 vs MSEK (190) in Q1 2012 Consolidated EBITDA increased by MSEK
INTERIM REPORT MARCH 2008 AUGUST
 CONCORDIA BUS GROUP Concordia Bus AB, (Publ), 556576-4569 Registered office: Stockholm INTERIM REPORT MARCH 2008 AUGUST 2008 1 av 13 Concordia Bus AB (publ) reg. no. 556576-4569 Interim report for the
Second quarter and first half-year of 2017
 Jan-16 Mar-16 May-16 Jul-16 Sep-16 Nov-16 Jan-17 Mar-17 May-17 Jul-17 ANNOUNCEMENT NO. 7 17 AUGUST INTERIM REPORT Second quarter and first half-year of Results Adjusted result for : USD -3 million ( :
Interim Report for Duni AB (publ) 1 January 30 June 2009
 1 January 30 June 2009") Interim Report for Duni AB (publ) 1 January 30 2009 (compared with the same period of the previous year) 29 July 2009 Strong cash flow and stable profitability 1 January 30 2009 Net sales increased by
Interim Report for Duni AB (publ) 1 January 30 2009 (compared with the same period of the previous year) 29 July 2009 Strong cash flow and stable profitability 1 January 30 2009 Net sales increased by
Interim Report for First Quarter 2015
 Interim Report for First Quarter First quarter The quarter began with weak order intake, which gradually improved. Order intake was 10 percent lower than in the strong first quarter of Sales volumes were
IINO KAIUN KAISHA, LTD. (IINO LINES)
") Consolidated Financial Results For the Three Months Ended June 30, 2014- under Japanese GAAP IINO KAIUN KAISHA, LTD. (IINO LINES) Stock code: 9119 URL: http://www.iino.co.jp/kaiun/english/ Representative:
Consolidated Financial Results For the Three Months Ended June 30, 2014- under Japanese GAAP IINO KAIUN KAISHA, LTD. (IINO LINES) Stock code: 9119 URL: http://www.iino.co.jp/kaiun/english/ Representative:
Strong performance online, tougher in brickand-mortar
 Interim report January 1 June 30, 2017 Odd Molly International AB (publ) Stockholm, Sweden August 16, 2017 Strong performance online, tougher in brickand-mortar stores APRIL 1 JUNE 30, 2017 Total operating
Interim report January March 2018
 Interim report January March 218 Strong growth and stable margin First quarter 218 Net sales rose by percent to SEK 945 million (815). Organic growth was 9 percent. Order intake was in line with net sales.
TORM plc interim results for the half-year ended 30 June 2017
 TORM plc interim results for the half-year ended 30 June 2017 I am satisfied that we have been able to deliver a profit for the first six months of 2017 despite a difficult product tanker market. Over
1 January 31 december Year-End Report - Cabonline Group Holding
 1 January 31 december 2017 Year-End Report - Cabonline Group Holding October-December 2017 January-December 2017 Net sales amounted to SEK 1,560 million (1,531) EBITDA before non-recurring items amounted
Teekay s Fourth Quarter and Fiscal 2008 Earnings Presentation
 T E E K A Y C O R P O R A T I O N Teekay s Fourth Quarter and Fiscal 2008 Earnings Presentation June 4, 2009 www.teekay.com Forward Looking Statements This release contains forward-looking statements (as
EURONAV ANNOUNCES THIRD QUARTER RESULTS 2017
 Tuesday 31 October 8 a.m. CET EURONAV ANNOUNCES THIRD QUARTER RESULTS HIGHLIGHTS Challenging freight market throughout quarter toughest since Q3 2013 Oversupply of tonnage and new vessel deliveries the
Conference call Presentation of Q results 1 March 2012
 Conference call Presentation of Q4 11 results 1 March 12 Safe Harbour Statement Matters discussed in this presentation may constitute forward-looking statements. Such statements reflect TORM's current
BW LPG Limited. Condensed Consolidated Interim Financial Information Q1 2015
 Condensed Consolidated Interim Financial Information HIGHLIGHTS Q1 Time Charter Equivalent (TCE) earnings were US$130.6 million in, compared with US$100.4 million in Q1 2014. VLGC TCE rates averaged US$41,300/day
Frontline Ltd. Interim Report April - June 2003
 Frontline Ltd. Interim Report April - June SECOND QUARTER AND SIX MONTH RESULTS Frontline Board is pleased to announce a second consecutive quarter of strong earnings. Frontline Ltd. reports net operating
Interim report January-March 2011
 Interim report January-March 2011 PERIOD 1 JANUARY - 31 MARCH 2011 Net sales SEK 29.4 million (31.4 million) System income SEK 27.6 million (26.3 million) PERIOD 1 JANUARY - 31 DECEMBER 20 - Net sales
Teleconference Q results
 Teleconference Q4 21 results 1 Highlights Q4 21 Result Q4 loss before tax of USD 37m, before USD 35m impairment charge and USD 16m vessel sale adjustment Full year 21 loss before tax of USD 85m, before
NYSE: GNRT. Gener8 Maritime. Gener8 Maritime, Inc. Earnings Presentation Third Quarter 2017
 Gener8 Maritime Gener8 Maritime, Inc. Earnings Presentation Third Quarter 2017 November 9, 2017 Safe Harbor Under the Private Securities Litigation Reform Act of 1995 This presentation contains forward-looking
Notice on Forward Looking Statements
 1 1 Notice on Forward Looking Statements This presentation contains certain forward-looking statements (as such term is defined in Section 21E of the Securities Exchange Act of 1934, as amended), which
TEEKAY TANKERS LTD. 4th Floor, Belvedere Building, 69 Pitts Bay Road Hamilton, HM 08, Bermuda EARNINGS RELEASE
 TEEKAY TANKERS LTD. 4th Floor, Belvedere Building, 69 Pitts Bay Road Hamilton, HM 08, Bermuda EARNINGS RELEASE TEEKAY TANKERS LTD. REPORTS FIRST QUARTER 2013 RESULTS Highlights Reported first quarter 2013
HIGHLIGHTS 1ST QUARTER 2002
 1. quarter 2002 A/S Dampskibsselskabet TORM Marina Park Sundkrogsgade 10 DK-2100 Copenhagen Ø Denmark Tel: +45 39 17 92 00 Fax: +45 39 17 93 93 Telex: 22315 TORM DK E-mail: Website: Comtext: mail@torm.dk
The completion of a restructuring agreement is a prerequisite for TORM s continued operation.
 Second quarter report 2012 TORM recognized a loss before tax of USD 59 million in the second quarter of 2012 before special items of USD -73 million. The financial results in the second quarter of 2012
ARDMORE SHIPPING CORPORATION Second Quarter 2014 Earnings Presentation. July 29, 2014
 ARDMORE SHIPPING CORPORATION Second Quarter 2014 Earnings Presentation July 29, 2014 Disclaimer This presentation contains certain statements that may be deemed to be forward-looking statements within
Second quarter and first half-year of 2016
 ANNOUNCEMENT NO. 19 17 AUGUST INTERIM REPORT Second quarter and first half-year of Adjusted result for the period* : USD -4 million ( : USD 29 million). H1 : USD -9 million. EBIT : USD -34 million (USD
Interim Report for the period 1 January 31 March 2010
 Interim Report for the period 1 January 31 March 2010 Net sales for the period totalled TSEK 14,293 (438). Operating result before depreciation (EBITDA) totalled TSEK 4,146 (-4,872). Operating result (EBIT)
NYNAS INTERIM REPORT JANUARY JUNE SEK million
 Q 2 INTERIM REPORT 1 JANUARY 30 JUNE 2015 Nynas AB (Publ.), corporate re.no 556029-2509, parent company for Nynas. Nynas is a leading international group specialised in naphthenic specialty oils and bitumen.
TEEKAY TANKERS LTD. 4th Floor, Belvedere Building, 69 Pitts Bay Road Hamilton, HM 08, Bermuda EARNINGS RELEASE
 TEEKAY TANKERS LTD. 4th Floor, Belvedere Building, 69 Pitts Bay Road Hamilton, HM 08, Bermuda EARNINGS RELEASE TEEKAY TANKERS LTD. REPORTS THIRD QUARTER RESULTS Highlights Declared a cash dividend of $0.03
Q1 Q Q3 Q EUR million Jan-Mar 2018 Jan-Mar 2017 Change, % EUR million Jan-Dec 2017
 Stockholm, Sweden, 4 May Eltel Group Interim report January March January March Group net sales decreased 10.5% to EUR 266.6 million (297.8), mainly as a result of divestments and on-going discontinuation
Interim report - first half 2005
 Copenhagen Stock Exchange Nikolaj Plads 6 1067 Copenhagen K Announcement No. 21 23 August 2005 Interim report - first half 2005 First half 2005 - highlights In the first half-year, the profit for the period
TEEKAY SHIPPING CORPORATION Bayside House, Bayside Executive Park, West Bay Street & Blake Road P.O. Box AP-59212, Nassau, Bahamas EARNINGS RELEASE
 Bayside House, Bayside Executive Park, West Bay Street & Blake Road P.O. Box AP-59212, Nassau, Bahamas EARNINGS RELEASE TEEKAY REPORTS FOURTH QUARTER AND ANNUAL RESULTS Highlights Reported fourth quarter
Interim financial report - first quarter of 2013
 PRESS RELEASE 16 May 2013 Interim financial report - first quarter of 2013 Challenging shipping markets prevail The world economic and political uncertainty and the tough business environment for international
NYNAS INTERIM REPORT JANUARY SEPTEMBER JANUARY 30 SEPTEMBER 2015
 Q 3 INTERIM REPORT 1 JANUARY 30 SEPTEMBER Nynas AB (Publ.), corporate reg.no 556029-2509, parent company for Nynas. Nynas is a leading international group specialised in naphthenic specialty oils and bitumen.