Investor Presentation 4Q16
|
|
|
- Rebecca Day
- 6 years ago
- Views:
Transcription


1 Investor Presentation 4Q16


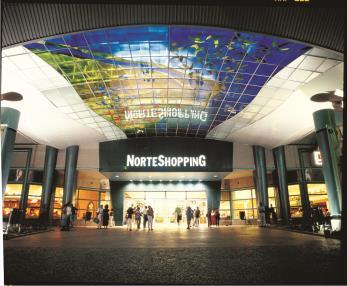
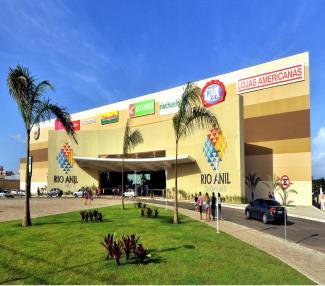
2 1 Who we are? Largest mall company in Latin America The only shopping mall company in Brazil with nationwide presence Portfolio with 44 regional malls, almost 8% of the total malls in Brazil Largest landlord in Brazil with over 9,000 tenants, which represents almost 10% of the total number of stores in Brazil Current Owned GLA will grow 10.5% with the development projects by the end of 2021* Total Sales reached R$21.8 billion in 2016, 14% of the total sales in Brazil Plaza Niterói Shopping Tijuca Norte Shopping Shopping Villa Lobos * Growth considering the pipeline disclosed in the last Earnings Release.
; Center Uberlândia (MG); Rio Anil (MA). SP/Midwest Region 31.")
3 2 BRMALLS Presence High quality potfolio, with large presence and regional scale MG/NE/North Region 26.1% of the company s NOI; 15 shopping centers in operation, including: Recife (PE); Center Uberlândia (MG); Rio Anil (MA). SP/Midwest Region 31.3% of the company s NOI; 14 shopping centers in operation, including: Villa Lobos (SP); Tamboré (SP); Campo Grande (MS). RJ/ES/South Region 42.6% of the company s NOI; 15 shopping centers in operation, including: NorteShopping (RJ); Plaza Niterói (RJ); Catuaí Londrina (PR).

4 3 Strength and Resiliency Brands (% of Base Rent) Segment (% of Satellites GLA) Brand 1 1.3% Women s Apparel Restaurant 6.6% 5.7% Brand 2 1.2% Fast-Food 4.9% Brand 3 1.1% Men s Apparel Shoes 4.4% 4.0% Brand 4 1.1% Mobile Store 2.8% Brand 5 1.0% Eletronics Cosmetics 2.5% 2.0% * Updated in jan/17.

5 4 BRMALLS Timeline ( ) NOI CAGR : +32.8% Adjusted EBITDA CAGR: +33.2% Total GLA Growth: % IPO R$657.1M Follow-On Follow-On Follow-On R$ 454.3M R$ 731.0M R$ 664.5M 6 shopping centers # Shoppings Total GLA (thousand m²) 23 Aquisitions 4 Aquisitions 1 Aquisition 3 Aquisitions 4 Aquisitions 4 Aquisitions 1 Greenfield 2 Greenfields 2 Greenfields 3 Greenfields 1 Greenfield 1 Greenfield m² m² 4 Expansions 2 Expansions 2 Expansions 2 Expansions 4 Expansions 3 Expansions 1 Asset Sale (*) 1 Asset Sale (*) 5 Assets Sale (*) m² 1,032.7 m² 1,197.1 m² 1,433.5 m² 1,620.6 m² 1,668.0 m² 1,691.0 m² m² m² m² m² m² m² m² 3 Expansions 1 Expansion 3 Assets Sale (*) 45 1,638.1 m² m² 45 1,645.7 m² +7.6 m² Note: Total GLA owned in thousand sqm. (*) Considering asset sales and acquisitions only of the malls in which the company divested its entire interest or added one more shopping center to the portfolio.
6 5 Largest and Best Company in the Sector BR MALLS is THE LARGEST shopping mall company in Latin America Current Total GLA (in thousand sqm) Total Sales 2016 (R$ million) 1, ,798 13,726 12,719 Current # of Malls EBITDA¹ 2016 (R$ million) 44 1, ¹ EBITDA disclosed by the companies
7 6 Largest and Best Company in the Sector THE FASTEST GROWING company in the sector with more than twice the average of our competitors Owned GLA CAGR - ( ) Net Revenues CAGR - ( ) 25.2% 10.7% 10.6% 31.1% 20.0% 16.1% Total GLA CAGR - ( ) 21.4% Adjusted EBITDA CAGR - ( ) 33.2% 7.8% 7.6% 21.9% 19.0%


8 7 Largest and Best Company in the Sector BRMALLS became THE MOST EFFICIENT player in the sector with the better margins EBITDA Margin ¹ Avg Historical EBITDA Margin BRMALLS BRMALLS Historical Average 79.0% NOI Margin ¹ Avg Historical NOI Margin BRMALLS 90.9% 2 BRMALLS Historical Average Note: ¹ Shopping Centers margins considering the last 3 years average. ² Iguatemi does not disclose NOI. Margin estimated by sell-side analysts in march/2017.
 ¹ Corporate Governance 2.")

9 8 Largest and Best Company in the Sector BRMALLS is the company in the sector with the HIGHEST CORPORATE GOVERNANCE STANDARDS and free-float Average Daily Traded Volume (R$ million) ¹ Corporate Governance 2.7x the average ADTV of peers Full Corporation Corporate Governance: Novo Mercado No shareholders agreement and only one class of share Key employees aligned via stock option program Independent Board and Governance Committees BRMALLS Indexes BRMALLS Weight BRMALLS ranking # IBOVESPA IBRX50 ICO2 IBX IGC ITAG MLC IMOB MSCI BRAZIL 0.73% 0.75% 0.77% 0.66% 1.00% 0.89% 0.71% 20.10% 0.81% ¹Source: Bloomberg: 30 days median Updated March, 10th, 2017


10 9 Largest and Best Company in the Sector Currently trading at a significant spread over interest rates % 5.3% 0.7 p.p 4.6% 5.3% 1.8 p.p Nota: Yield FFO Ajustado = FFO Ajustado 24M Fwd / Enterprise Value Source: Bloomberg, December, 30 th, 2016
11 10 Largest and Best Company in the Sector... and at a large discount... Price +48.9% +47.8% +13.8% NAV Historical High Consensus* Last Price Updated March, 21st, PS: Consensus considers updates by sell-side analysts in NAV = fair value of investment properties of current malls net debt minority interest/ Number of Shares
12 11 Largest and Best Company in the Sector trading at multiples below historical average. P/FFO EV/EBITDA BRMALLS Historical Average BRMALLS Standard Deviation Source: J.P Morgan EBITDA and AFFO 2yr fwd


13 12 Growth Drivers: Acquisition Unique turnaround track record NOI of Acquisitions since 2006 (R$ mm) Acutal / Projected NOI 28.5% 22.7% 22.6% 18.8% 4.5% Projected Actual 21.5% Case Studies of Major Acquisitions (NOI Evolution R$ mm) Plaza Niterói Shopping Estação Campinas Shopping Shopping Tamboré % % % % Acquisition Price R$ MM Acquisition Price R$ MM Acquisition Price R$ MM Acquisition Price R$ MM

 * Brazil")

14 13 Growth Drivers: Acquisition We still see a great opportunity for acquisitions in Brazil. Market Share Ownership of Brazilian Shopping Malls Market Share (% of owned GLA in 2016) * Brazil Total GLA in 2016: 15,237 thousand sqm *Top 4 mall Players: BRMALLS, Multiplan, Aliansce and Iguatemi. Source: ABRASCE


15 Expansion Greenfield 14 Growth Drivers: Development (Projects Delivered) 2008/ Total 10 projects 21 projects Owned GLA ( 000 sqm)
 308.6 Pipeline (Owned GLA) 100.1 +10.5% of the Owned GLA Capex (R$ mm) 1,862.0 233.4¹ 142.7 147.6¹ 189.4¹ 271.8¹ 2,846.")
16 15 Growth Drivers: Development Solid development history and the largest pipeline of greenfield and expansions projects of the industry Owned GLA (in thousand sqm) Already developed (Owned GLA) Pipeline (Owned GLA) % of the Owned GLA Capex (R$ mm) 1, ¹ ¹ 189.4¹ 271.8¹ 2,846.9 ¹ Considers only CAPEX of announced projects


")
 GDP(%)")

17 16 Growth Drivers: Organic Growth Solid Growth in the last 10 years Same Store Sales Annual Growth (%) Quarterly Growth (%) Same Store Rent Same Store Sales (%) GDP(%) Annual Growth (%) Quarterly Growth (%) Same Store Rent (%)
18 17 Strength and Resiliency BRMALLS SHOPPING CENTERS RESILIENCE Retail Sales Y.o.Y. Growth/Shoppings/BRMALLS Market Share BRMALLS: % 14.9% 13.8% Shopping Centers historically outperform retail sector *Source: Shopping Center Sales ABRASCE; Retail Sales - IBGE


19 18 Financial Highlights Net Revenues CAGR - ( ) Gross Revenues Breakdown (4Q16) CAGR 31.1%


")
20 19 Largest and Best Company in the Sector With a strong and consistent growth of the main metrics NOI (R$ million) Adjusted EBITDA (R$ million) CAGR 32.7% CAGR 33.2%


 -")
21 20 Capital Structure 4Q16 Debt Index (% of the gross debt) Cash R$383.2 million Average Yield 102.9% Gross Debt Average Debt Duration R$4.8 billion 11.3 years Average Debt Cost 11.0% Net Debt Net Debt / Annualized Adjusted EBITDA Net Debt / Annualized Adjusted EBITDA (ex-perps) R$4.4 billion 3.7x 2.7x Rating Moody s: Fitch: Aa2 / Ba2 AA+ / BB+ Debt Amortization Schedule (R$ million) - Adjusted Financial Information 1, and onwards* *Including the Perpetual Bond
22 21 Stabilized Result Full Year 2016 (R$ MM) Stabilized Result (R$ MM) Net Revenues R$ 1,370 (1) Discounts: +37MM (2) Vacancy: +16MM R$ 1, % Adjusted EBITDA R$ 1,016 (1) PDA: +80MM R$ 1, % Adjusted EBITDA Margin 74.2% 80.8% +660bps AFFO R$ 299 (3) Financial Result: +77MM (4) Taxes: +48MM R$ % AFFO Margin 21.8% 39.2% +1740bps Total of R$259 million Note: (1) Full Year 2016 vs. historical average % over net revenues (2) Full Year 2016 vs. stabilized occupancy of 97,5% (3) Financial result upside based on estimates for the main indexes (Brazilian Central Bank FOCUS Report, March, 2017) (4) Tax upside based on Corporate restructuring Project estimates
23 22 Appendix
24 23 Income Class Pyramid Evolution Population Distribution by Income Class (millions of people) Growth +7m Growth +11m Growth +29m Growth +18m A Class: over R$9,050 B Class: R$6,941 R$9,050 C Class: R$1,610 R$6,941 D Class: R$1,008 R$1,610 E Class: under R$1,008 A & B Class C Class D & E Class Source: Political Sciences Center at FGV-Rio
 & Asian Crisis (1997) Russian Crisis (1998) & Real Depreciation (1999) 2002 Crisis Lula Election Subprime Crisis (2008-09) European Crisis (2011-12) Car Wash Crisis (2014-16)")
25 24 Shopping Mall: A Safe Harbor Sales Performance in the Shopping Mall Sector since1995 Average Inflation ( ): +6.6% Average GDP Growth ( ): +2.3% Sales CAGR ( ): +14.0% Mexican Crisis (1994) & Asian Crisis (1997) Russian Crisis (1998) & Real Depreciation (1999) 2002 Crisis Lula Election Subprime Crisis ( ) European Crisis ( ) Car Wash Crisis ( ) Avg. GDP Growth (95-97): 2.9% Avg. GDP Growth (98-00): 1.8% Avg. GDP Growth (03-05): 3.0% Avg. GDP Growth (08-09): 3.2% Avg. GDP Growth (11-12): 2.5% Avg. GDP Growth (14-16): -2.4% Avg. Inflation (95-97): 7.4% Avg. Inflation (98-00): 5.5% Avg. Inflation (03-05): 7.5% Avg. Inflation (08-09): 5.1% Avg. Inflation (11-12): 5.8% Avg. Inflation (14-16): 7.1% Avg. Interest Rate (95-97): 35.5% Avg. Interest Rate (98-00): 21.3% Avg. Interest Rate (03-05): 17.4% Avg. Interest Rate (08-09):11.2% Avg. Interest Rate (11-12): 9.1% Avg. Interest Rate (14-16): 14.2% Sales Growth CAGR (95-97): 18.3% Sales Growth CAGR (98-00): 20% Sales Growth CAGR (03-05): 12.4% Sales Growth (08-09): 14.6% Sales Growth (11-12): 10.6% Sales Growth (14-16): 5.4% Source: IPEA Data e ABRASCE
26 25 IBOVESPA vs. GDP YoY (%) Jan/91 - Jul/97: 6 years and 5 months Jul/97 - Out/02: 5 years and 3 months Out/02 - Mar/10: 7 years and 5 months Mar/10 - Today 8.0% % 4.0% 5.9% 4.2% 3.7% 4.5% 5.3% 6.1% 4.8% 6.5% 5.3% 5.8% 2.0% 0.0% -2.0% 2.5% 2.1% 2.2% 2.1% 2.3% 2.1% 0.7% 0.9% 0.1% % -1.4% -4.0% -3.7% -3.6% -6.0% 0.0 GDP numbers from 2014 onwards consider new methodology (comparable value for 2014 was -0.25%)
 Highest weight of the sector on Ibovespa Index (0.73%) Net Debt / EBITDA 3.")
27 26 BRMALLS and Long Term Interest Rates Historical Stock Price vs. Fwd Real Rate LTM Performance Correlation w/ Fwd Interest Rates Highest Liquidity in the Sector (2.7x Avg Peers) BRML3 22.4% -82% PEERS¹ 26.2% -30% Fwd Interest Rate -57.5% Largest Foreign Shareholder Base (~75%) Highest weight of the sector on Ibovespa Index (0.73%) Net Debt / EBITDA 3.7x 1- MULT3, IGTA3 e ALSC3 Updated on March, 24 th, 2017
28 27 BRMALLS vs. International Peers EV/EBITDA 2017E vs. International Peers 12.9x 15.5x 13.7x 10.7x 18.0x 13.9x 9.9x 25.4x 20.7x 17.6x 22.5x 20.8x 15.1x 25.0x 22.1x 23.3x 13.2x 22.1x 22.2x 24.8x Updated in march/2017 Source for International Peers: Bloomberg Source for national Peers: sell-side analysts estimates
 % of Retail Sales")

29 28 Shopping Mall Industry Brazilian Mall industry offers strong potential for growth and expansion GLA per 1,000 inhabitants (sqm) % of Retail Sales in Shopping Malls USA Canada Australia South Africal France Mexico Brazil Canada USA South Australia France Mexico Brazil Africal Source: Abrasce, 2015

30 29 IR Contacts Frederico Villa CFO Telefone: Derek Tang IR Manager Telefone: Renato Campos Specialist Telefone: Guilherme Lahr Specialist Telefone:
31 30 Disclaimer The material that follows is a presentation of general background information about BR Malls Participações S.A. and its consolidated subsidiaries ( BR Malls" or the "Company") as of the date of the presentation. It is information in summary form and does not purport to be complete and is not intended to be relied upon as advice to potential investors. You should consult the offering memorandum for complete information about the transaction and base your investment decision on such offering memorandum. No representations or warranties, express or implied, are made as to, and no reliance should be placed on, the accuracy, fairness or completeness of the information presented or contained in this presentation. Neither the Company nor any of its affiliates, advisers or representatives, accepts any responsibility whatsoever for any loss or damage arising from any information presented or contained in this presentation. The information presented orcontained in this presentation iscurrent asof the date hereof and is subject to change without notice and its accuracy isnot guaranteed. Neither the Company nor any of its affiliates, advisers or representatives make any undertaking to update any such information subsequent to the date hereof. This presentation should not be construed as legal, tax, investment or other advice. Certain data in this presentation was obtained from various external data sources, and the Company has not verified such data with independent sources. Accordingly, the Company makes no representations as to the accuracy or completeness of that data, and such data involves risks and uncertainties and is subject to change based on various factors. This presentation is strictly confidential and may not be disclosed to any other person. This presentation contains forward-looking statements. Such statements are not statements of historical facts, and reflect the beliefs and expectations of BR Malls management. The words "anticipates", "wishes", "expects", "estimates", "intends", "forecasts", "plans", "predicts", "projects", "targets" and similar words are intended to identify these statements. Although the Company believes that expectations and assumptions reflected in the forward-looking statements are reasonable based on information currently available to the Company's management, the Company cannot guarantee future results or events. You are cautioned not to rely on forward-looking statements as actual results could differ materially from those expressed or implied in the forwardlooking statements. Securities may not be offered or sold in the United States unless they are registered or exempt from registration under the U.S. Securities Act of 1933, as amended (the Securities Act ). Any offering of securities to be made will be made solely by means of an offering circular. This presentation does not constitute an offer, or invitation, or solicitation of an offer, to subscribe for or purchase any securities, and neither any part of this presentation nor any information or statement contained therein shall form the basis of or be relied upon in connection with any contract or commitment whatsoever. Any decision to purchase securities in any offering of securities of the Company should be made solely on the basis of the information contained in the offering document which may be published or distributed in due course in connection with any offering of securities of the Company, if any. This presentation is being made only to investors that, by means of their attendance at this presentation, represent to the underwriters and the agents that they are Qualified Institutional Buyers as that term is defined in the Securities Act.
Investor Presentation 3Q16
 Investor Presentation 3Q16 Who are we? Largest mall company in Latin America The most efficient company with the best margins The only shopping mall company in Brazil with nationwide presence Portfolio
3Q2017 INSTITUTIONAL PRESENTATION
 Institutional Presentation 3rd QUARTER 2017 SHOPPING CAMPO GRANDE - MS 0 Overview Company Highlights LARGEST mall company in Latin America Nationwide presence covering all 5 regions of Brazil Active portfolio
1Q2018 INSTITUTIONAL PRESENTATION
 1 ST QUARTER 2018 SHOPPING ESTAÇÃO - PR 0 INDEX 1. OVERVIEW 2. WHY INVEST IN BRMALLS? 3. PORTFOLIO MANAGEMENT 4. ACHIEVEMENTS 5. FINANCIAL HIGHLIGHTS 6. APPENDIX 2 8 17 23 29 32 1 1. OVERVIEW SHOPPING
1Q17. Earnings Release. Investor Relations: Frederico Villa CFO and IRO. 1Q17 Conference Call: Intern. English. Derek Tang Manager
 Earnings Release 1Q17 Investor Relations: Frederico Villa CFO and IRO Derek Tang Manager Renato Campos Specialist Guilherme Lahr Specialist Antonio Velloso Intern ri@brmalls.com.br Tel: +55 21 3138-9900
1Q17. BH Shopping, Belo Horizonte
 BH Shopping, Belo Horizonte Discussion Material May, 2017 Disclaimer This document may contain prospective statements, which are subject to risks and uncertainties as they were based on expectations of
Discussion Material November, ParkShoppingSãoCaetano São Caetano (SP) 1
 1") Discussion Material November, 2017 ParkShoppingSãoCaetano São Caetano (SP) 1 Disclaimer This document may contain prospective statements, which are subject to risks and uncertainties as they were based
Discussion Material November, 2017 ParkShoppingSãoCaetano São Caetano (SP) 1 Disclaimer This document may contain prospective statements, which are subject to risks and uncertainties as they were based
Discussion Material October, 2017
 Discussion Material October, 2017 ParkShoppingCanoas Parque Getúlio Vargas, Canoas (RS) 1 Disclaimer This document may contain prospective statements, which are subject to risks and uncertainties as they
4Q16. Discussion Material
 Discussion Material - 2016 March, 2017 Disclaimer This document may contain prospective statements, which are subject to risks and uncertainties as they were based on expectations of the Company s management
EARNINGS RELEASE 2 nd QUARTER 2017 SHOPPING TAMBORÉ - SP
 2 Mudanças na Companhia Governance & Management New CEO; New Chief Officers of Operations, Development and Human Resources New Audit & Risk and Human Resources Committees Long Term Incentive Plan: Performance
Earnings Release 2Q13
 Resultados do 1º trimestre de 2012 Earnings Release 2Q13 Investor Relations: Leandro Lopes CFO and IRO Derek Tang Manager Eduardo Siqueira Coordinator Juliana Lamberts Trainee ri@brmalls.com.br Tel: +55
Fixed Income November, ParkShoppingSãoCaetano São Caetano (SP) 1
 1") Fixed Income November, 2017 ParkShoppingSãoCaetano São Caetano (SP) 1 Disclaimer This document may contain prospective statements, which are subject to risks and uncertainties as they were based on expectations
Fixed Income November, 2017 ParkShoppingSãoCaetano São Caetano (SP) 1 Disclaimer This document may contain prospective statements, which are subject to risks and uncertainties as they were based on expectations
1Q15. Earnings Release. Investor Relations: Frederico Villa CFO and IRO. 1Q15 Conference Call: English. Derek Tang Manager
 Earnings Release 1Q15 Investor Relations: Frederico Villa CFO and IRO Derek Tang Manager Camilla Daher Coordinator Renato Campos Specialist Fernanda Sallum Intern ri@brmalls.com.br Tel: +55 21 3138-9900
Institutional Presentation. Institutional Presentation 3Q
 Index 1. OVERVIEW 2. WHY INVEST IN brmalls? 3. PORTFOLIO MANAGEMENT 4. RECENT EVENTS 5. FINANCIAL HIGHLIGHTS 6. APPENDIX 2 8 19 26 32 35 1 Overview 2 Company highlights Plaza Niterói - RJ LARGEST mall
Earnings Release 3Q13
 Resultados do 1º trimestre de 2012 Earnings Release 3Q13 Investor Relations: Leandro Lopes CFO and IRO Derek Tang Manager Eduardo Siqueira Coordinator Juliana Lamberts Trainee ri@brmalls.com.br Tel: +55
Earnings Release 4Q12
 Resultados do 1º trimestre de 2012 Earnings Release 4Q12 Investor Relations: Leandro Lopes CFO and IRO Derek Tang Manager Eduardo Siqueira Coordinator Juliana Lamberts Trainee ri@brmalls.com.br Tel: +55
Localiza Rent a Car S.A.
 Localiza Rent a Car S.A. Confins airport branch Belo Horizonte 24h reservation 0800 979 2000 www.localiza.com 1 Integrated business platform 28,080 cars 172 agencies 1.2 million clients 16,600 cars 405
Discussion Material November Q16
 Discussion Material November 2016 Disclaimer This document may contain prospective statements, which are subject to risks and uncertainties as they were based on expectations of the Company s management
Renato Rique Renato Botelho Mauro Junqueira Aliansce opp ing Centers Tel.: +55 (21) ri.aliansce.com.
 ri.aliansce.com.") Aliansce Shopping Centers 4Q16 Results Renato Rique President Renato Botelho CFO Mauro Junqueira CIO IR Contacts Phone: +55 (21) 2176-7272 E-mail: ri@aliansce.com.br ir.aliansce.com.br Eduardo Prado IRO
Aliansce Shopping Centers 4Q16 Results Renato Rique President Renato Botelho CFO Mauro Junqueira CIO IR Contacts Phone: +55 (21) 2176-7272 E-mail: ri@aliansce.com.br ir.aliansce.com.br Eduardo Prado IRO
CORPORATE PRESENTATION. March 2017
 CORPORATE PRESENTATION March 2017 InRetail Overview Multi-format retailer with exclusive focus in Peru Leading positions in its 3 segments #1 supermarket chain #1 pharmacy chain #1 shopping center operator
COMPANY PRESENTATION. June 2008
 COMPANY PRESENTATION June 2008 Disclaimer This document may contain prospective statements. which are subject to risks and uncertainties. as they were based on expectations of the Company s management
CORPORATE PRESENTATION
 CORPORATE PRESENTATION 2017 InRetail Overview Multi-format retailer with exclusive focus in Peru Leading positions in its 3 segments #1 supermarket chain #1 pharmacy chain #1 shopping center operator Controlled
EARNINGS PRESENTATION Q3 15. November 2015
 EARNINGS PRESENTATION November 2015 1 2 CONSOLIDATED RESULTS RESULTs BY SEGMENT 3 FINANCIAL ratios 1 CONSOLIDATED RESULTS consolidated financial highlights Million Soles (S/. mm) Highlights Revenues 11.8%
1Q17 EARNINGS RELEASE
 1Q17 EARNINGS RELEASE INVESTOR RELATIONS Carlos Alberto Correa CFO and Investor Relations Officer Murilo Hyai Senior Investor Relations Manager Eduardo Oliveira Investor Relations Specialist Website: ir.sonaesierra.com.br
EARNINGS CONFERENCE CALL
 EARNINGS CONFERENCE CALL AUGUST 15, 2017 INVESTOR RELATIONS Disclaimer This material is a presentation of general information about Marfrig Global Foods S.A. and its consolidated subsidiaries (jointly
ATRIUM COMPANY PRESENTATION
 ATRIUM COMPANY PRESENTATION THE LEADING OWNER & MANAGER OF CENTRAL EASTERN EUROPEAN SHOPPING CENTRES 1H2016 ATRIUM LEADING OWNER & MANAGER OF CEE SHOPPING CENTRES A UNIQUE INVESTMENT OPPORTUNITY Strong
1Q2015 IFRS CONSOLIDATED FINANCIAL RESULTS
 Q5 IFRS CONSOLIDATED FINANCIAL RESULTS AUGUST, 5 Alexander Ivannikov Head of the Department Q5 IFRS CONSOLIDATED FINANCIAL RESULTS DISCLAIMERS This presentation has been prepared by PJSC Gazprom (the Company
New growth cycle and value innovation. May, 2013
 New growth cycle and value innovation May, 2013 Disclaimer The information contained herein has been prepared by Odontoprev S.A. ( OdontoPrev or the Company ) and this material does not constitute offering
2Q2015 IFRS CONSOLIDATED FINANCIAL RESULTS
 Q5 IFRS CONSOLIDATED FINANCIAL RESULTS SEPTEMBER, 5 Alexander Ivannikov Head of the Department Q5 IFRS CONSOLIDATED FINANCIAL RESULTS DISCLAIMERS This presentation has been prepared by PJSC Gazprom (the
AGENDA 3 OTHER FINANCIAL RESULTS Q2 18 CONSOLIDATED RESULTS RESULTS BY SEGMENT
 August 2018 AGENDA 1 Q2 18 CONSOLIDATED RESULTS 2 RESULTS BY SEGMENT 3 OTHER FINANCIAL RESULTS 1 Q2 18 CONSOLIDATED RESULTS Q2 18 CONSOLIDATED FINANCIAL RESULTS Million Soles (S/ mm) Highlights Revenues
June IMC: Merger with Sapore
 June 2018 IMC: Merger with Sapore Disclaimer The material that follows is a presentation of general background information about International Meal Company Alimentação S.A. ( IMC or the Company ) as of
Marisa at a Glance. Largest women fashion and underwear retailer in Brazil. Focus on the middle class. 63 years of track record.
 Institutional Presentation May 2012 Marisa at a Glance 63 years of track record Financial services platform Focus on the middle class Largest women fashion and underwear retailer in Brazil Multiformat
Earnings Conference Call OPÇÕES 2Q16
 Earnings Conference Call OPÇÕES 2Q16 Agenda 2Q16 Highlights Expansions and Relevant Events Ongoing Projects Results 2Q16 Highlights (1/2) Total Sales were R$ 3.1 billion in 2Q16, a 13,2% increase versus
Cyrela Commercial Properties S.A. Empreendimentos e Participações
 Cyrela Commercial Properties S.A. Empreendimentos e Participações (A free translation of the original reporting Portuguese as published in Brazil containing Financial Statement prepared in accordance with
INSTITUTIONAL PRESENTATION 3Q18. p. 1
 INSTITUTIONAL PRESENTATION 3Q18 p. 1 Market under transformation and with high growth potential Company ready to capture increase in profitability PROFITABILITY Scale business with high dilution potencial
Results 3Q17 FLRY3. October 2017
 Results 3Q17 FLRY3 October 2017 Disclosure This presentation may contain forward-looking statements. Such statements are not statements of historical facts and reflect the beliefs and expectations of the
KION Q3 UPDATE CALL Gordon Riske, CEO Thomas Toepfer, CFO Wiesbaden, 14 November 2013
 KION Q3 UPDATE CALL 2013 Gordon Riske, CEO Thomas Toepfer, CFO Wiesbaden, 14 November 2013 AGENDA 1 Highlights 2013 Gordon Riske 2 Financial Update Thomas Toepfer 3 Outlook Gordon Riske 14 November 2013
CORPORATE PRESENTATION
 CORPORATE PRESENTATION 2018 InRetail Overview Peruvian multi-format retailer, also present in Ecuador, Colombia and Bolivia through the pharma business Leading positions in Peru in its 3 segments #1 supermarket
Earnings Presentation Q2 14
 Earnings Presentation Q2 14 August 13, 2014 This material was prepared solely for informational purposes and is not to be construed as a solicitation or an offer to buy or sell any securities. This presentation
Latin American Quarterly Outlook JULY 2011
 Latin American Quarterly Outlook JULY 2011 LATIN AMERICA Real Estate Outlook Key Economic Themes Almost three years after the peak of the global crisis, Latin America has two contrasting stories: Mexico
Earnings Conference Call OPÇÕES 1Q16
 Earnings Conference Call OPÇÕES 1Q16 Agenda 1Q16 Highlights Expansions and Relevant Events Ongoing Projects Results 1Q16 Highlights (1/2) EBITDA reached R$ 129 million in 1Q16, a 25.7% increase when compared
CORPORATE PRESENTATION
 CORPORATE PRESENTATION 2018 InRetail Overview Peruvian multi-format retailer, with presence in the Andean region through the pharma business Leading positions in Peru in its 3 segments #1 supermarket chain
SulAmérica. Brazil 2008 UBS Pactual Ninth Annual CEO Conference February 19, 2008
 SulAmérica Brazil 2008 UBS Pactual Ninth Annual CEO Conference February 19, 2008 Disclaimer The material that follows is a presentation of general background information about Sul América S.A. ( SulAmérica
CORPORATE PRESENTATION
 CORPORATE PRESENTATION 2018 InRetail Overview Peruvian multi-format retailer, with presence in the Andean region through the pharma business Leading positions in Peru in its 3 segments #1 food retail chain
ATRIUM COMPANY PRESENTATION
 ATRIUM COMPANY PRESENTATION THE LEADING OWNER & MANAGER OF CENTRAL EASTERN EUROPEAN SHOPPING CENTRES August 2017 ATRIUM LEADING OWNER & MANAGER OF CEE SHOPPING CENTRES Strong management team with a proven
Earnings Presentation Q1 2015
 Earnings Presentation Q1 2015 May, 2015 This material was prepared solely for informational purposes and is not to be construed as a solicitation or an offer to buy or sell any securities. This presentation
Q Results presentation
 Q1 2016 Results presentation 12 May 2016 1 Disclaimer This presentation (the "Presentation") has been prepared and is issued by, and is the sole responsibility of Telepizza Group, S.A. ( Telepizza" or
2014 IFRS CONSOLIDATED FINANCIAL RESULTS
 24 IFRS CONSOLIDATED FINANCIAL RESULTS APRIL 29, 25 Alexander Ivannikov First Deputy CFO 24 IFRS CONSOLIDATED FINANCIAL RESULTS 2 DISCLAIMERS This presentation has been prepared by JSC Gazprom (the Company
Brookfield Infrastructure Partners. Investor Update October 2016
 Brookfield Infrastructure Partners Investor Update October 2016 Brookfield Infrastructure is one of the largest globally diversified owners and operators of infrastructure assets in the world BROOKFIELD
3Q16 results FLRY3. October 2016
 results FLRY3 October 2016 Disclosure This presentation may contain forward-looking statements. Such statements are not statements of historical facts and reflect the beliefs and expectations of the Company
Euskaltel 1H15 update and R Cable transaction. 28 July 2015
 Euskaltel 1H15 update and R Cable transaction 28 July 2015 0 Strong momentum across our residential KPIs Inflexion point in Residential subs Residential subs (1) ( 000) 3P & 4P % of total subs Annual churn
PROTELINDO PT. SARANA MENARA NUSANTARA, Tbk. (TOWR) Indonesia s Premier Tower Company 2Q 2014 Results Presentation
 Indonesia s Premier Tower Company 2Q 2014 Results Presentation") PROTELINDO PT. SARANA MENARA NUSANTARA, Tbk. (TOWR) Indonesia s Premier Tower Company 2Q 2014 Results Presentation Disclaimer These materials have been prepared by PT Sarana Menara Nusantara, Tbk. (the
PROTELINDO PT. SARANA MENARA NUSANTARA, Tbk. (TOWR) Indonesia s Premier Tower Company 2Q 2014 Results Presentation Disclaimer These materials have been prepared by PT Sarana Menara Nusantara, Tbk. (the
VITRO Conglomerates. Quarterly Report July 29, VITRO Market Outperformer 12M FWD Price Target P$73.0
 Quarterly Report VITRO Market Outperformer 12M FWD Price Target P$73.0 Price 61.1 12M Price Range 36.3/ 66.7 Shares Outstanding (Mill) 483.6 Market Cap (Mill) 1,564 Float 20% Net Debt ( Mill) -424 EV Adj.
COMPANY PRESENTATION. November 2018 ATRIUM PROMENADA WARSAW
 COMPANY PRESENTATION November 2018 ATRIUM PROMENADA WARSAW ATRIUM A UNIQUE INVESTMENT OPPORTUNITY Dominant, high quality urban assets in Poland and Czech In Oct. 2018, Atrium acquired Wars Sawa Junior
EARNINGS RELEASE INVESTOR RELATIONS CONFERENCE CALLS. Carlos Alberto Correa CFO and Investor Relations Officer. English
 EARNINGS RELEASE 2Q15 INVESTOR RELATIONS Carlos Alberto Correa CFO and Investor Relations Officer Murilo Hyai Investor Relations Manager Eduardo Oliveira Investor Relations Analyst Website: ir.sonaesierra.com.br
Earnings Presentation Fourth Quarter
 Earnings Presentation Fourth Quarter 2015 Highlights of the period 1 Segment Overview Balance Sheet Financials Q&A 2 3 3 Agenda Fourth Quarter Highlights Robust financials exiting 2015 Strong financials
March FIBRA Prologis. Citi Latin America Conference. New York. Prologis Park Apodaca Building 3, Monterrey
 March 2018 FIBRA Prologis Citi Latin America Conference New York Prologis Park Apodaca Building 3, Monterrey Forward-Looking Statements / Non Solicitation This presentation includes certain terms and non-ifrs
Business Evolution January September BUSINESS PERFORMANCE January September 2017
 BUSINESS PERFORMANCE January September 2017 1 Disclaimer This presentation, which is personal to the recipient, has been prepared and produced by Bolsas y Mercados Españoles, Sociedad Holding de Mercados
Successful Strategy Performance reflects balanced portfolio structure. August, 2013
 Successful Strategy Performance reflects balanced portfolio structure August, 2013 Disclaimer Some statements and estimates in this material may represent expectations about future events or results that
CITYCON CAPITAL MARKETS DAY 16 MAY 2017, ISO OMENA CFO, EERO SIHVONEN
 STRONG FINANCING FUNDAMENTALS CITYCON CAPITAL MARKETS DAY 16 MAY 2017, ISO OMENA CFO, EERO SIHVONEN MAIN FINANCING TARGETS Loan to Value 40-45% 47.1% Average maturity of loan portfolio > 5 yrs 5.2 Debt
Institutional Presentation 3Q14
 Institutional Presentation 3Q14 1 I. GENERAL OVERVIEW II. BUSINESS ENVIRONMENT III. 3Q14 RESULTS IV. GROWTH OPPORTUNITIES 2 Cetip s Timeline 1986 Cetip starts its operations 1994 Beginning of OTC Derivatives
Conference Call 2Q10 Results
 Conference Call 2Q10 Results In Portuguese with simultaneous translation in English Time: 12:00 pm (US-ET) / 1:00 pm (Brazil) Access in English: +1 (786) 924 6977 Access in Portuguese: +55 (11) 4688 6361
Leadership in the Sector (Gross Revenue R$ millions) 3Q07. Quality Shoppings (Same Store Rent/m²) 3Q07. High Returns
 3Q07. Quality Shoppings (Same Store Rent/m²) 3Q07. High Returns") Company Presentation November 2007 Disclaimer This document may contain prospective statements. which are subject to risks and uncertainties. as they were based on expectations of the Company s management
Company Presentation November 2007 Disclaimer This document may contain prospective statements. which are subject to risks and uncertainties. as they were based on expectations of the Company s management
Valid reports Net Revenue of R$412.1 million in 3Q17, down 3.2% from 3Q16 and up 5.2% from 2Q17.
 Valid reports Net Revenue of R$412.1 million in, down 3.2% from and up 5.2% from 2Q17. Rio de Janeiro, November 8 th 2017 Valid (B 3 : VLID3 - ON) announces today its results for the third quarter of 2017
Multiplan Empreendimentos Imobiliários S.A.
 Multiplan Empreendimentos Imobiliários S.A. KPDS 157671 Contents Performance review 3 Independent auditors' report on quarterly information 47 Balance sheets 50 Statements of income 54 Statements of comprehensive
Multiplan Empreendimentos Imobiliários S.A.
 Quarterly Information - ITR June 30, 2014 (A free translation of the original report issued in Portuguese as published in Brazil containing financial statements prepared in accordance with accounting practices
Financial Statements - Company and Consolidated BR Malls Participações S.A.
 Management Comments Despite the challenging macroeconomic scenario in 2014, we managed to end the year in line with our expectations. The World Cup event holidays on the second and third quarter, as well
Consolidated Net Revenue from Products
 2 Disclaimer This presentation contains forward-looking statements relating to the prospects of the business. estimates for operating and financial results. and those related to growth outlook of Guararapes-Riachuelo.
Conference Call 3Q10 Results
 Conference Call 3Q10 Results In Portuguese with simultaneous translation in English Time: 11:00 am (US-ET)/ 1:00 pm (Brazil) Access in English: +1 (786) 9246977 Access in Portuguese: +55 (11) 46886361
Positive Free Cash Flow of R$39 million in 3Q16
 3Q16 Earnings Release Positive Free Cash Flow of R$39 million in 3Q16 São Paulo, November 10, 2016 Marfrig Global Foods S.A. Marfrig (BM&FBovespa Novo Mercado: MRFG3 and Level 1 ADR: MRTTY) announces today
Highlights SONAE SIERRA BRASIL ANNOUNCES ADJUSTED EBITDA OF R$41.9 MILLION IN 1Q12, A 10.4% INCREASE OVER 1Q11. Investors Relations
 1Q12 Earnings Release Investors Relations Carlos Alberto Correa Investors Relations Officer Murilo Hyai Investors Relations Manager Eduardo Pinotti de Oliveira Investor Relations Analyst Website: www.sonaesierrabrasil.com.br/ri
TRANSACTION. April 9th, 2018
 TRANSACTION + April 9th, 2018 1 REDIRECTING THE GROWTH STRATEGY OF ITS DIVISIONS: - BEEF CORE BUSINESS WE HAVE TWO PROJECTS (1ST HALF 2018) I. AQUISITION OF MAJORITY STAKE AT NATIONAL BEEF, ADDING TO THE
Results 2Q17 FLRY3. July 2017
 Results 2Q17 FLRY3 July 2017 Disclosure This presentation may contain forward-looking statements. Such statements are not statements of historical facts and reflect the beliefs and expectations of the
IMPORTANT INFORMATION
 INSTITUTIONAL PRESENTATION Dec/2013 IMPORTANT INFORMATION This document contains forward-looking information to take into account regarding the business prospects, operational and financial results estimates
Now, I will turn the conference over to Mr. Eduardo Prado, who will start the presentation. Mr. Prado, you may begin the conference.
 Operator: Good morning ladies and gentlemen. At this time we would like to welcome everyone to the Aliansce s 2Q16 earnings conference call. Today with us, we have Mr. Eduardo Prado, IRO, Mr. Renato Botelho,
Investor Update. August 2016
 Investor Update August 2016 Safe Harbor This presentation contains certain statements that are the Company s and Management s hopes, intentions, beliefs, expectations, or projections of the future and
Earnings Presentation FIRST QUARTER 2016
 Earnings Presentation FIRST QUARTER 2016 Agenda 1 Highlights of the period 2 Consolidated overview 3 Overview by Business Units 4 Overview by Country 5 Balance Sheet Financials 6 Q&A First Quarter Highlights
Corporate presentation May 2017 FLRY3
 Corporate presentation May 2017 FLRY3 Agenda Overview and Strategy Financial Performance Healthcare Sector in Brazil Expansion Plan Ownership Structure and Governance 2 Agenda Overview and Strategy Financial
2015 and 4Q15 Results FLRY3. March 2016
 2015 and Results FLRY3 March 2016 Disclosure This presentation may contain forward-looking statements. Such statements are not statements of historical facts and reflect the beliefs and expectations of
Brasil Brokers Earnings Presentation 4Q16 March, 2017
 Brasil Brokers Earnings Presentation 4Q16 March, 2017 Overview 03 Results 08 2 New Executives CEO Mr. Claudio Hermolin has an executive career built by working in large companies in the segments of construction,
2Q17 Conference Call
 2Q17 Conference Call 1 Highlights & Portfolio 2Q17 Highlights BR Properties registered Adjusted Net Income (FFO) of R$20.9 million, with 20% margin BR Properties registered in 2Q17 net revenues of R$104.7
1Q2016 IFRS CONSOLIDATED FINANCIAL RESULTS
 Q6 IFRS CONSOLIDATED FINANCIAL RESULTS AUGUST, 6 Alexander Ivannikov Head of the Department Q6 IFRS CONSOLIDATED FINANCIAL RESULTS DISCLAIMERS This presentation has been prepared by PJSC Gazprom (the Company
4Q17 Earnings Conference Call. March 8, 2018
 4Q17 Earnings Conference Call March 8, 2018 Disclaimer This presentation includes forward-looking statements. We have based these forward-looking statements largely on our current beliefs, expectations
3Q14 RESULTS. Conference Call November 10, 2014
 3Q14 RESULTS Conference Call November 10, 2014 Safe-Harbor Statement We make forward-looking statements that are subject to risks and uncertainties. These statements are based on the beliefs and assumptions
Investor Update 3Q10
 Investor Update 3Q10 SULAMÉRICA AT A GLANCE Largest independent Brazilian insurance group Solid reputation and widely-recognized brandname Multiline insurance business supported by high-quality products
2014 Results. 18 February 2015 Madrid
 2014 Results 18 February 2015 Madrid Disclaimer/Notice to Recipients This presentation contains forward-looking statements and information relating to Abertis Infraestructuras, S.A. ( Abertis ) and its
Multiplan. Equity Research. Buying Barra and Morumbi at very attractive terms
 ing Barra and Morumbi at very attractive terms R$496mn to buy minorities at BarraShopping and MorumbiShopping Last night, Multiplan announced the acquisition of 10.3% of BarraShopping, in Rio (~8,000m²
REITS 101 AN INTRODUCTION TO REAL ESTATE INVESTMENT TRUSTS
 REITS 101 AN INTRODUCTION TO REAL ESTATE INVESTMENT TRUSTS A Real Opportunity While they have been around for over fifty years, real estate investment trusts (REITs) have been slow to move into the mainstream.
May FIBRA Prologis. Credit Suisse Mexico Investment Ideas Conference. Prologis Park Apodaca, Monterrey
 May 2018 FIBRA Prologis Credit Suisse Mexico Investment Ideas Conference Prologis Park Apodaca, Monterrey Forward-Looking Statements / Non Solicitation This presentation includes certain terms and non-ifrs
Quality assets. Selective and profitable growth. Self-funding business model
 This presentation has been prepared by EDP Renováveis, S.A. (the "Company") solely for use at the presentation to be made on May 6 th, 2015. By attending the meeting where this presentation is made, or
Investor Presentation DBS Group Holdings Ltd November 2017
 Investor Presentation DBS Group Holdings Ltd November 2017 Disclaimer: The information contained in this document is intended only for use during the presentation and should not be disseminated or distributed
IIIQ 2018 Conference Call May 9, Alejandro Elsztain, CEO Daniel Elsztain, COO Matías Gaivironsky, CFO 1
 IIIQ 2018 Conference Call May 9, 2018 Hosted by: Alejandro Elsztain, CEO Daniel Elsztain, COO Matías Gaivironsky, CFO 1 Main Events for 9M FY 2018 Rental Operating Figures Shopping malls sales grew by
Investor Presentation
 Investor Presentation 3Q10 Growth for the next 115 years SULAMÉRICA TODAY A Unique Kind of Insurance Company Ranking as independent pure play Brazilian insurance company not owned by a bank #1 Ranking
KION UPDATE CALL Q Gordon Riske, CEO Thomas Toepfer, CFO Wiesbaden, 7 May 2015
 KION UPDATE CALL 2015 Gordon Riske, CEO Thomas Toepfer, CFO Wiesbaden, 7 May 2015 AGENDA 1 Highlights Gordon Riske 2 Market update Gordon Riske 3 Financial update Thomas Toepfer 4 Outlook Gordon Riske
EAST BALT BAKERIES July 2017 ACQUISITION
 EAST BALT BAKERIES July 2017 ACQUISITION E AST BA LT AT A G L A N C E Leading foodservice-focused company that supplies baked goods to Quick Service Restaurants ( QSR ) across the world Operates 21 bakeries
Institutional Presentation. March
 Institutional Presentation March 2013 Marisa at a glance Largest women fashion and lingerie retailer in Brazil 64 years of track record Focus on the middle class National footprint 2 Multiformat store
Institutional Presentation
 Institutional Presentation SulAmérica and Industry SULAMÉRICA BUSINESS MODEL Largest independent Brazilian insurer Multiline model One-stop shop and strong product cross selling Disciplined underwriting,
Institutional Presentation. June/2016
 V2 Institutional Presentation June/2016 Disclaimer This release contains forward-looking statements that are exclusively related to the prospects of the business, its operating and financial results, and
A Cushman & Wakefield Research Publication RETAIL BRAZIL 2015/2016
 MARKET POSITIONING RETAIL BRAZIL 1/16 SUMMARY ECONOMY RETAIL MARKET 4 MARKET OF SHOPPINGS CENTERS MAIN INCORPORATORS 8 FUTURE SCENARIO 9 Cushman & Wakefield South America Praça Prof. José Lannes, 4 4º
Corporate Presentation Cencosud. Fourth Quarter
 Corporate Presentation Cencosud 2015 Fourth Quarter Corporate Presentation www.cencosud.com 2 The information contained herein has been prepared by Cencosud S.A. ( Cencosud ) solely for informational purposes
2016 and 4Q16 Results FLRY3. March 2017
 2016 and Results FLRY3 March 2017 Disclosure This presentation may contain forward-looking statements. Such statements are not statements of historical facts and reflect the beliefs and expectations of