YEAR-END REPORT 2015 SEAMLESS DISTRIBUTION AB (publ)
|
|
|
- Kerrie Hall
- 5 years ago
- Views:
Transcription
1
2 YEAR-END REPORT 2015 SEAMLESS DISTRIBUTION AB (publ) January December Fourth quarter 2015 Net sales increased 83 % to SEK 78.9 million (43.2) Operating loss for the period SEK million (-51.3), a decrease of 36 percent Loss after financial items SEK million (-50.6) Loss after tax for the period SEK million (-50.8) Earnings per share SEK (-1.21) Full year Highlights Net sales increased 63 % to SEK million (170.8) Operating loss for the period amounted to (-165), a decrease of 29 percent The Transaction switch increased sales by 136% and received its largest order ever Cash flow from operating activities improved with 48 MSEK to (-147.3) 2
3 SIGNIFICANT EVENTS DURING THE PERIOD OCTOBER DECEMBER 2015 In December Seamless Distribution AB (publ) ( Seamless ) conducted a directed issue of shares of 31.8 MSEK. The number of shares and voting rights amount to As SEQR should fund for long term growth, Seamless intends to bring in a strategic equity partner as coinvestor in the subsidiary SEQR through a directed equity placement. Awaiting the completion of such transaction, in order to cover negative cash flow Seamless intends to, by means of the existing authorization from the general meeting, raise capital through a private placement of shares or convertibles in Seamless of approximately 25 MSEK. Seamless has secured a new order in Africa for its proprietary wireless POS terminal. The order is worth USD 2.4 million and is the latest in a series of orders that the Transaction Switch division has received during the third quarter in the rapidly growing African market. In total, Seamless has now received orders valued at USD 5.3 million in Africa. SIGNIFICANT EVENTS AFTER THE CLOSE OF THE REPORTING PERIOD Seamless partners with Express Money and enters the international money transfer market. Through Seamless mobile payment platform SEQR, Xpress Money and Seamless can offer its customers a convenient, safer and affordable way of sending money from one country to another, digitally. Seamless has received a new order from a leading African mobile operator in the Ivory Coast for the installation of its transaction switch. The order is initially valued at approximately USD 2 million. 3
4 CEO s COMMENT The development of the fourth quarter was very satisfactory both in terms of sales and earnings. All three business segments are showing strong growth. Two segments worth highlighting are Distribution and the Transaction Switch that often end up being overshadowed in relation to the attention we receive for our mobile payment solution SEQR. The business segment Transaction Switch provides international telecom companies with a wide range of mobile products as well as complete IT- and logistical solutions for the full supply chain for mobile payments. This business segment showed a record fast and profitable growth during the quarter. Sales increased a full 136 percent compared with the fourth quarter of the previous year. It is worth noting that 40 percent of the sales came from products launched in This is something that shows the business segment s ability to renew itself and adapt to the demands of the market since the Transaction Switch was introduced 15 years ago. This is today perhaps the market s strongest solution for managing the adding of funds to mobile prepaid accounts, and last year handled 3.7 billion transactions in 18 national markets to a total value of approximately 51 billion Swedish kronor (approx.usd 6 billion). We also see a very high growth rate for the business segment e-products/distribution, which handles the physical and electronic refill of credits to mobile prepaid accounts in Sweden, Latvia and as of 2015, also in Denmark. In the much important Swedish market, transaction volumes increased by about 50 percent in the fourth quarter compared with the same quarter of For the business segment SEQR, the growth rate was substantial during the quarter, with a twofold increase of the number of registered users and a 50 percent increase in the transaction volume. The net revenue is not increasing at the same pace as the transaction volume due to a number of business related causes. We do see a constant increase in usage and the ascendant trend in the increase of the number of transactions will have a strong impact on the revenue during The quarter was also characterized by a continued high level of activity in both affiliated retailers and product development, as well as the launches of new solutions. It is worth highlighting, that at the beginning of this year, SEQR-users will be able to pay through contactless technology at retailers who have terminals that support this technology regardless if the retailer has signed up with SEQR or not. Globally, there are already about 24 million POS terminals with this solution, and the number is increasing rapidly since the same technology is used for contactless cards. In summary, overall all three of our three business segments showed strong growth during 2015, with an increase of 63% on the revenue, and a 30% improvement on the result compared with Something that causes us to look forward to 2016 with great confidence a year that has the right preconditions for continued strong growth. Peter Fredell, CEO Seamless 4
5 BUSINESS SEGMENTS Net Sales, SEK thousand Growth, Net Sales compared to last year Oct-Dec Oct-Dec Full-Year Full-Year Oct-Dec Oct-Dec Full-Year Full-Year Transaction Switch % 15% 136% neg eproudcts/distribution % neg 46% 11% SEQR % neg neg neg Group functions Seamless group % neg 64% 6% Operating Result Operating Margin Oct-Dec Oct-Dec Full-Year Full-Year Oct-Dec Oct-Dec Full-Year Full-Year Transaction Switch % 60% 30% 26% eproducts/distr neg neg neg neg SEQR neg neg neg neg Group functions neg neg neg neg Seamless group neg neg neg neg Fourth quarter Net sales increased by 83 % to MSEK 78.9 (43.2) Operating loss MSEK (-51.3), an decrease of 39 percent Earnings per share SEK-0.80(-1.21) Transaction switch increase sales by 167% eproducts/distribution increased sales by 54% SEQR by 7% Full year summary Net sales increase by 64 % to MSEK (170.8) Operating loss for the full year MSEK (-165), an decrease by 29 percent. Transactionswitch increased net sales by 136 % eproducts/distribution net sales increased by 46% SEQR unchanged 5
6 Business Segment: Transaction Switch Seamless Distribution Systems, also referred to as the Transaction Switch, supplies the system for the management of the distribution network of primarily electronic adding of funds to prepaid value cards, along with other eproducts extending from gift cards to prepaid debit cards to mobile banking. The system increases the range of products the reseller has to offer, without taking up valuable shelf space, and facilitates a much more rapid distribution in the marketplace. The hub of the operations is the internally developed proprietary ERS 360 platform, which remains constantly under development in order to meet the needs from the market since its initial installation some 15 years ago. Our clients can be found all over the world, but are mainly in Africa and the Middle East, where telecommunications companies constitute our largest group of customers. Currently, the platform handles 3.7 billion transactions annually with a total value of 6 billion dollars (U.S.), divided among 18 markets. Earnings The Transaction Switch business segment has seen good profitability and during the quarter achieved record sales, with a growth of 136% (year-over-year comparison). 40% of the sales came from products that were new for New order bookings received were in line with our expectations, mainly driven by the renewal of support contracts for Most of the strategic project orders, driven by the business-critical importance that our system has in their operations, came largely in the form of a comprehensive reserve backup facility for one of our customers, a very significant amount. Meeting our cash flow needs during the quarter was challenging due to the many large orders we received within a short period of time which consisted primarily of hardware. We found ways to deal with this without it having any significant impact on either the delivery time or profitability. Given our amazing growth we naturally have had a greater need for working capital. The net earnings are affected by the fact that the quarter s revenue includes a large percentage of hardware, which has a lower gross margin than revenues from the sale of systems, which is reflected in the Q4 financial results. This year s exceptional growth affected our profitability partly due to increased staffing levels and partly due to the change in product mix. Activities and market prospects The product mix has been expanded and changed where the Seamless Wireless Point of Sale Terminal (WiPOS) is the single most significant development and complements the core business of system sales. WiPOS is an integral part of the ERS 360 transaction platform which is connected to the GSM network and allows the user the ability to print receipts and stored value vouchers to add funds to prepaid accounts/sims and other financial transactions. With an expanded technical capacity, we also manage a greater number of and more complex integrations. The result is a more business-critical system and tightly linked part of the carrier s sales process of talk time. A number of new products are in the planning stage and will be launched over the course of the coming year. Meanwhile, work continues with the packaging and standardizing of core components in order to enhance the speed and reduce costs in the delivery phase. In our service offering, as of January 1 it will include a dedicated 24/7 Network Operation Center that will increase the capacity to provide support to customers and also free up skilled resources to enable them to work with the new service products. The first quarter is normally weak in terms of sales after the spurt right before the year end. In the near term, we see however a positive 2016 and our order book filling to capacity during most of the quarter. After the extreme growth in 2015, one cannot expect the same proportional growth, but we expect that full year should show further growth. 6
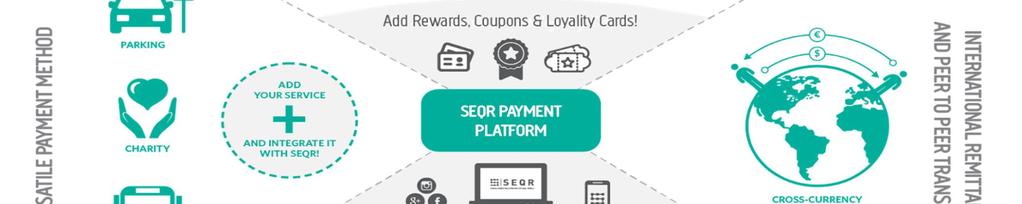
7 Total transactions growth - Transactions switch
8 Business Segment: eproducts/distribution Seamless eproducts Sweden (with its subsidiaries Seamless eproducts Latvia and Seamless eproducts Denmark) encompasses physical and electronic distribution of electronic products such as TopUp (adding funds/replenishment codes for mobile devices), electronic gift cards and prepaid phone cards via merchants, banking and digital channels. Seamless connects together all wireless carriers and banks so that the consumers will be able to add additional funds to their stored-value card or mobile wallet via the bank s channels: mobile device banking, Internet banking, and telephone banking. Globally, there are two distribution technologies for adding funds to mobile devices: evoucher* and Direct TopUp* - where Seamless offers both in one technical platform. Earnings The number of stores in the Swedish market with new contracts has continued to increase and during Q4 we saw an organic growth occurring. The transaction volume is more than 50% higher compared to Q4/2014, and the number of stores has more than doubled. The Danish subsidiary became fully operational back in Q1 and the establishment by Seamless distribution of eproducts is proceeding according to plan. Negotiations with several major chains are in progress and agreements were signed during the year with the consumer electronics chain Expert in Denmark among others. The customer migration, following the 2014 acquisition of Ingram Micro, began in 2015 and affected earnings positively by increasing the number of affiliated stores as well as transaction volume. The acquisition was made with a contingent-price provision and this acquisition has been a big success in terms of market penetration and has had a positive impact on both our balance sheet and profits. A number of renowned chains, as well as a significant number of independent stores, have become customers of Seamless. Activities and Market Outlook The joint cooperation with wireless carriers and banks in the Swedish market has expanded during the year with the inclusion of Danske Bank. The integration with Danske Bank has now been completed and sales in the bank s channels have commenced. Total volumes in the banking channel is stable. During Q3 and Q4, the transaction volumes in Latvia have stabilized and trended to a mildly positive growth. For Sweden and Denmark, for the coming quarters we project continued growth in transaction volumes and the number of contracted retailers, although at a slower pace than we have seen over past year. * evoucher where a voucher with a unique code is distributed electronically and where this voucher code is printed out from the reseller s card terminal or directly via the checkout register. * Direct TopUp where funds are added to the consumer s prepaid SIM via that the telephone number and the desired amount to be credited is stated. Adding funds to a pre-paid cellular phone account takes place directly at the wireless carrier and the consumer receives an SMS confirming the transaction. For merchants, eproducts provide the opportunity to increase sales and consumer inflows without the requirement of making a financial investment, and as well, it avoids tying up capital or the need to maintain an inventory where the products would take up valuable display space in the store. With the electronic distribution of these products, vouchers and stored value codes are delivered digitally, and the store does not incur any outlays until the product is sold. 8
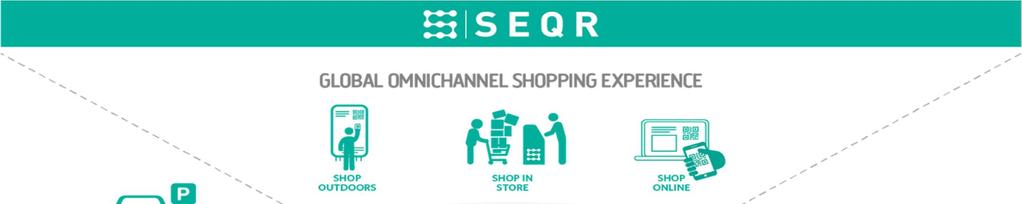
9 Business Segment: SEQR The SEQR business segment encompasses a payment platform with a financial ecosystem that among other things enables payments in physical checkouts, online and on mobile devices, money transfers between users domestically and internationally, as well as an advertising platform and sales channel. The technology is a development of the Transaction Switch platform and has operations in Sweden, Finland, Romania, Belgium, the Netherlands, Germany, Portugal, Spain, France, Italy, the USA and UK. Earnings Continued growth in downloads and transactions during the quarter resulted in a doubling of user registrations and a 50% growth in transaction volume. Transactions via Shop on the Spot increased by 300% in the quarter. The Shop on the Spot feature enables retailers to sell to the consumer regardless of media (for example from a newspaper, screen or outdoor advertising). Payment occurs via the SEQR App and the product is delivered to the selected address. In addition to the transaction costs, the purchases generate a channel margin of approx. 15% of the net sales which makes Shop on the Spot another revenue stream with great growth potential. Activities/market prospects During the reporting period, we announced the intention to launch in Q a Near Field Communication (NFC) solution (aka Contactless) in SEQR that will make it possible for users to make payments via terminals which have this technology even if the particular retailer has not yet signed an agreement with SEQR. In order to take advantage of all SEQR s value-added services, the retailer will need to integrate their POS system with SEQR, but users can start paying right away. Today there are about 24 million card terminals in the world that support NFC. The new function International Remittance & Payment was launched during the quarter as an integral part of the SEQR App. SEQR users can now pay with SEQR in all countries where SEQR is live, as well as transfer money internationally between SEQR users and receive money in their local currency. SEQR offers the least expensive and simplest way to send money internationally, in a market which in 2014 had a volume of about 600 billion dollars (U.S.). The cost for remittance services averaged 8 percent globally. The efforts to obtain money transmittance licenses for all states in the United States is progressing. In November we signed an agreement with the payment solutions company Dwolla. The agreement enables a U.S. launch of Peer-to-Peer, which will take place during the first quarter of The function is an important part of the offering and with growth potential. In December, SEPA was launched in Finland, and our users now have the opportunity to link SEQR directly to their bank account. During the period, agreements were signed with several large and important partners such as Jysk (Finland), Dirk Supermarkets (the Netherlands), Webhallen (Sweden), Sound Leisure (UK), Almeda 467 (Portugal), Esse Parking (Portugal), Pontus Group (Sweden), and Convoi Exceptionel (Belgium), where the latter means that SEQR is the only alternative to cash for payments. The launch of the restaurant Tidningshuset by Pontus in November was an instant success, where already during the first month 20% of all customers chose to pay for their lunch with SEQR. 9
10 10

11 SEQR - mobile ticketing service for Västtrafik* Transactions and registrations ( ) for SEQR's integrated mobile ticketing service for mass transportation system operator Västtrafik. *Västtrafik is the agency responsible for public transport services involving buses, ferries, trains, and the Göteborg tramway in the county of Västra Götaland, Sweden. 11
12 CONSOLIDATED Revenue Seamless revenues increased during the fourth quarter by 82 percent to SEK thousand (43 214). The sales are distributed between the various business segments, with 39 percent (27) from the Transaction Switch business segment, 58 percent (69) from the Distribution business segment, and 3 percent (4) from the SEQR business segment. Financial Result The consolidated operating loss amounted to SEK thousand ( ) in the fourth quarter. Financial items for the fourth quarter amounted to SEK -537 thousand (695). Earnings per share amounted to SEK (-1.21) SEK for the quarter. Personnel We had a total of 158 (166) employees at end of the quarter. In addition to this, Seamless has retained approximately 50 consultants primarily in India, Ghana and Pakistan. Investments During the quarter, investments have been made in a total amount of SEK thousand (6 515). Product development costs have been capitalized at a value of SEK thousand (5 869), while depreciation taken and amortization amounted to SEK thousand (-5 029). Cash flow and financial position Cash flow from operating activities amounted to SEK thousand ( ) for the fourth quarter. Bank deposits and cash equivalents at the end of the quarter amounted to SEK thousand ( ). The company needs a liquidity fund of 2 MSEK in the Swedish operations to maintain its money transmitter license from the Financial Supervisory Authority. Corresponding liquidity base for the US market is appr. $ 1 million when starting up the business. A total of appr MSEK. The Group has interest bearing liabilities in the form of leases for hardware amounting to SEK thousand (-2 030), divided between long-term debt of SEK -571 thousand (-423) and short-term debt of SEK -789 thousand (-912). An interest-bearing liability in the form of a convertible loan amounts to SEK 28 million with an annual interest rate of 7 percent. The interest during the third quarter amounted 502 thousand. The convertible loan will mature in 364 days after the date of issue, on July 16, The Company has no interest-bearing liabilities to banks or other credit institutions apart from the convertible loan. As SEQR should fund for long term growth, Seamless intends to bring in a strategic equity partner as coinvestor in the subsidiary SEQR by a directed equity placement. Awaiting the completion of such transaction, in order to cover negative cash flow Seamless has, by means of the existing authorization from the general meeting, raised capital by a private placement in Seamless of approximately 31.8 MSEK, during December month, and intends to raise appr 25 MSEK during the first quarter of Seamless has an equity ratio of 50 (74) percent. Acquisition of customers As of February 2015 customer lists were purchased. When the final settlement was signed the seller was obliged to repay the purchase price plus approximately SEK 600 thousands in accordance with the settlement agreement. The additional SEK 600 thousands is accounted for as Other Income. 12
13 PARENT COMPANY The parent company s net sales for the quarter amounted to SEK thousand (13 056) and net financial result amounted to a loss of SEK thousand ( ). Net gains/losses in the parent company from financial items amounted to SEK thousand ( ). A write-down of shares in subsidiaries have had a one-time effect of SEK -20,2 million and the parent company had bank deposits/cash on hand in the amount of SEK thousand (69 041). The parent company had 2 (4) employees at the close of the quarter. TRANSACTIONS WITH CLOSLEY RELATED PARTIES Seamless has not engaged in any transactions with closely related parties. OTHER Accounting Policies This quarterly report has been prepared in accordance with IAS 34, Interim Financial Reporting, which is consistent with Swedish law via the application of the Swedish Financial Reporting Board s Recommendation RFR 1, Supplementary Accounting Policies for Groups, and RFR 2, Accounting for Legal Entities, in regard to the parent company. The same accounting policies, definitions of key figures, and methods of computation have been applied as in the most recent annual report for both the Group and the Parent Company, unless otherwise noted below. Significant risks and uncertainties in the business activities Seamless business operations are affected by a number of external factors where various risk factors may have an impact on the Company. These risk factors may result in an impact on the Company s ability to achieve its business objectives or targets. Seamless is in need of additional liquidity. As SEQR should fund for long term growth, Seamless intends to bring in a strategic equity partner as co-investor in the subsidiary SEQR by a directed equity placement. Awaiting the completion of such transaction, in order to cover negative cash flow Seamless has, by means of the existing authorization from the general meeting, raised capital by a private placement in Seamless of approximately 31.8 MSEK, during December month, and intends to raise appr 25 MSEK during the first quarter of This report contains forward looking statements that are based on Seamless management s current expectations. Even though management believes that the expectations which are stated in such forwardlooking statements are reasonable, no assurance can be given that such expectations will prove correct. Accordingly, future results could materially differ from those stated or implied in the forward-looking information due to, among other things, changes in economic, market and competitive conditions, changes in the regulatory environment and other political or governmental measures, fluctuations in exchange rates, and other factors. For further reference, please refer to the statement in the latest Annual Report on its pages
14 FINANCIAL INFORMATION Group report over total earnings Oct-Dec Oct-Dec Full-Year Full-Year SEK thousand Net Sales Other operating income Material costs Other external costs Personnel costs Depreciation Other operating costs Operating result Financial net Profit before tax Income tax Loss for the period OTHER COMPREHENSIVE INCOME Currency translation differences Total comprehensive income attributable to parent company shareholders Consolidated Balance Sheet 31 Dec 31 Dec SEK thousand ASSETS Intangible assets of which goodwill of which capitalized development costs of which customer agreements of which other intangible assets Tangible fixed assets Deferred tax Other long-term receivables Inventories of finished goods Accounts receivables Other receivables Prepaid expenses and accrued income Cash and cash equivalents Total assets EQUITY AND LIABILITIES Equity Appropriation Other non-current liabilities Deferred tax liability Trade accounts payable Current tax liability Other current liabilities Accrued expenses and deferred income Total Equity and Liabilities
15 Consolidated statement of changes in equity, Oct-Dec Oct-Dec Full-Year Full-Year SEK thousand Balance at start of period Comprehensive income for the period New share issue Transaction costs Conducted new share issue Options program Share repurchase As per end of the period Consolidated statement of cash flows, Oct-Dec Oct-Dec Full-Year Full-Year SEK thousand Cash flow from operations before changes in working capital Change in working capital Cash flow from operating activities Cash flow from investing activities Cash flow from financing activities Cash flow during the period Cash and cash equivalents at beginning of period Exchange difference of cash and cash equivalents Cash and cash equivalents at end of period Key figures Oct-Dec Oct-Dec Full-Year Full-Year Return on equity neg neg neg neg Earnings per share, basic and diluted, SEK -0,80-1,21-2,84-3,94 Operating income, SEK thousand Growth Net sales (compared to the same period last year) 83% neg 64% 6% Operating margin neg neg neg neg Average number of shares, basic and diluted Liquidity 146% 248% 146% 248% Equity ratio 50% 74% 50% 74% Equity, SEK thousand Equity per share, SEK 2,25 4,54 2,25 4,54 Number of employees at end of period Parent company income statement Oct-Dec Oct-Dec Full-Year Full-Year SEK thousand Net sales Other operating income Operating expenses Operating result Net financial items Earnings before tax Income tax Income for the period
16 Parent company balance sheet 31 Dec 31 Dec SEK thousand ASSETS Fixed assets Total current assets Total Assets EQUITY AND LIABILITIES Equity Long-term liabilities Short-term liabilities Total equity and liabilities Pledged assets - - Contingent liabilities None None 16
17 SEAMLESS SHARE Jan-Dec 2015 Price trend full year (FY) % Price trend fourth quarter +4.43% Ticker symbol SEAM Market Cap (per 31 Dec) SEK million High SEK Low SEK 6.65 Total no of shares (per 31 Dec) FINANCIAL CALENDAR 17 Feb 2016 Year-End-Report Mar 2016 Annual report Apr 2016 Annual General Meeting in Stockholm 22 Apr 2016 Interim report Q1 15 July 2016 Interim report Q2 17 Nov 2016 Interim report Q3 ABOUT SEAMLESS Seamless is one of the world s largest suppliers of payment systems for mobile phones. Founded in 2001 and active in 35 countries, Seamless handles more than 3.7 billion transactions annually through active sales outlets. Seamless has three main business areas including the transaction switch, the technology provider for the distribution of e-products and the mobile payment platform SEQR. Seamless shares are traded on NASDAQ OMX Stockholm. The Seamless Year-end-report 2015 for the period October December 2015 has been approved for publication by the Board of Directors, by its decision on February 17, This financial report has not subjected to a review by the Company s auditors. CERTIFICATION The Board of Directors and the CEO for Seamless Distribution AB (publ) declare that the interim report gives a true and fair view of the Company and Group s business operations, financial position and financial results in terms of net profits/losses, and describes the principal risks and uncertainties that the Company, and the companies included in the Group, face. Stockholm February 17, 2016 Hein Pretorius Kristin Berdan Omar Cordes Chairman of the Board of Directors Member of the Board Member of the Board Peter Fredell Member of the Board/ Chief Executive Officer Robin Saunders Member of the Board Seamless Distribution AB (publ), Corporate identification no All information is published on immediately after public release. CONTACT DETAILS For further information, please contact: Peter Fredell, CEO Peter.fredell@seamless.se
Interim Report, Fourth Quarter 2017
 1 INTERIM REPORT, FOURTH QUARTER OF 2017 October December 2017 The numbers refer to the remaining operations Q4 marked the final period of major restructuring, cleaning up, and legacy issue resolution,
INTERIM REPORT, Third QUARTER OF 2017
 1 INTERIM REPORT, Third QUARTER OF 2017 July September 2017 The numbers refer to the remaining operations Net sales for the period SEK 31.5 million (37.8) Operating result for the period after nonrecurring
Clas Ohlson: Year-end report 1 May April 2013
 Clas Ohlson: Year-end report 1 May 2012 30 April 2013 Fourth quarter * Sales totalled SEK 1,274 M (1,272). In local currencies, growth was 3%. * Operating loss of SEK 19 M reported (profit: 10). * Loss
Interim report 1 May January 2014
 Interim report 1 May 2013 31 January 2014 Third quarter 2013/14 Sales increased by 3 % to 2,238 MSEK (2,169). In local currencies, the increase was 7 % Operating profit increased by 34 % to 330 MSEK (247)
Interim report. January - March First quarter January - March 2015
 Interim report January - March 2015 April 28, 2015 First quarter January - March 2015 Group net sales in the first quarter 2015 amounted to 144.2 MSEK (113.7), an increase by 26.8 percent compared to the
Operating profit increased by 34 percent to 50.0 MSEK (37.2). Result after tax increased by 36 percent to 51.4 MSEK (37.7).
. Result after tax increased by 36 percent to 51.4 MSEK (37.7).") Interim report January - June 2018 July 16, 2018 Record figures for sales as well as operating profit Second quarter, April - June 2018 Net sales amounted to 236.1 MSEK (196.3), which is an increase by
Interim report January - June 2018 July 16, 2018 Record figures for sales as well as operating profit Second quarter, April - June 2018 Net sales amounted to 236.1 MSEK (196.3), which is an increase by
equal to a 19 % (20) operating margin Order intake was SEK 336 m (328), corresponding to an increase of 3 %
 operating margin Order intake was SEK 336 m (328), corresponding to an increase of 3 %") Second quarter Net sales for the second quarter reached SEK 329 m (299), corresponding to an increase of 10 % Operating profit reached SEK 63 m (59) equal to a 19 % (20) operating margin Order intake was
Second quarter Net sales for the second quarter reached SEK 329 m (299), corresponding to an increase of 10 % Operating profit reached SEK 63 m (59) equal to a 19 % (20) operating margin Order intake was
hms networks JANUARY - DECEMBER 2013 Fourth quarter
 hms networks Y E A R - E N D R E P O R T 2 0 1 3 JANUARY - DECEMBER q Net sales for the full year reached SEK 501 m (382), corresponding to a 31 % increase. The revaluation of the Swedish currency had
Interim Report January - March 2014
 Interim Report January - March 214 Stable orders continue Pricer s solution synchronizes prices in-store and on-line Auchan Schiever Group upgrades hypermarkets Value SEK 1 M French retailer Coop Atlantique
hms networks JANUARY - DECEMBER 2014 Fourth quarter
 hms networks Y E A R - E N D R E P O R T 2 0 1 4 JANUARY - DECEMBER q Net sales for the full year increased by 18 % reaching SEK 589 m (501), corresponding to a 13 % increase in local currencies. The revaluation
H & M HENNES & MAURITZ AB FULL-YEAR REPORT
 H & M HENNES & MAURITZ AB FULL-YEAR REPORT 1 December 2008 30 November 2009 The H&M Group s sales excluding VAT for the financial year amounted to SEK 101,393 m (88,532), an increase of 15 percent. In
P R E S S R E L E A S E
 P R E S S R E L E A S E from ASSA ABLOY AB (publ) 27 April 2004 No. 5/04 ASSA ABLOY Q1: ORGANIC GROWTH AND IMPROVED MARGINS IN ALL DIVISIONS Sales in the first quarter increased organically by 3% to SEK
hms networks Fourth quarter Yearly Y E A R - E N D R E P O R T JANUARY - DECEMBER
 hms networks Y E A R - E N D R E P O R T 2 0 1 6 JANUARY - DECEMBER Yearly Net sales for the full year increased by 36 % reaching SEK 952 m (702), corresponding to a 34 % increase in local currencies.
Investments and adaptations for the future one-off costs impacting the result
 Interim report January 1 September 30, 2017 Odd Molly International AB (publ) Stockholm, Sweden, October 24, 2017 Investments and adaptations for the future one-off costs impacting the result JULY 1 SEPTEMBER
ENGLISH VERSION OF THE INTERIM REPORT PUBLISHED ON 29 APRIL 2009
 ENGLISH VERSION OF THE INTERIM REPORT PUBLISHED ON 29 APRIL 2009 MD and CEO Johan Eriksson comments on Poolia s interim report for 1 January 31 March 2009 Poolia posts a healthy report in a tough market
Year-end Report 2014 Sales trend up New strategy launched
 Year-end Report 2014 Sales trend up New strategy launched Fourth quarter 2014 Order intake unchanged at SEK 115 (114) million. Net sales increased by 14% to SEK 173 (152) million. NorgesGruppen has signed
Interim report. January - September Interim report for the period January - September Third quarter, July - September 2015
 Interim report January - September 2015 October 30, 2015 Interim report for the period January - September 2015 Third quarter, July - September 2015 Group net sales in the third quarter 2015 amounted to
Strong performance online, tougher in brickand-mortar
 Interim report January 1 June 30, 2017 Odd Molly International AB (publ) Stockholm, Sweden August 16, 2017 Strong performance online, tougher in brickand-mortar stores APRIL 1 JUNE 30, 2017 Total operating
Investments continue to deliver growth
 SEK million Interim report January 1 June 30, 2016 Odd Molly International AB (publ) Stockholm, Sweden, August 18, 2016 Investments continue to deliver growth JANUARY 1 JUNE 30, 2016 Total operating revenue
Adapting to meet the industry s challenges and opportunities
 Interim report January 1 March 31, 2018 Odd Molly International AB (publ) Stockholm, Sweden, May 4, 2018 Adapting to meet the industry s challenges and opportunities JANUARY 1 MARCH 31, 2018 Total operating
Interim report. January - September Interim report for the period January - September Third quarter July September 2014
 Interim report January - September 2014 October 30, 2014 Interim report for the period January - September 2014 Third quarter July September 2014 Group net sales in the third quarter 2014 amounted to 118.5
A summary overview of A few words from the Chairman 4 Business Segments 5 The Seamless Share 10
 TABLE OF CONTENTS A summary overview of 2016 2 A few words from the Chairman 4 Business Segments 5 The Seamless Share 10 Management Report 14 Corporate Governance Report 23 Proposed appropriation of net
Interim report January 1 March 31, 2008 for the Scribona Group
 SCRIBONA AB (publ), corporate identification no. 556079-1419 Interim report January 1 March 31, 2008 for the Scribona Group Solna, May 30, 2008 Q1 2008 Net sales for the first quarter reached SEK 1,903
ASSA ABLOY S INCREASED GROWTH DRIVEN BY GLOBAL TECHNOLOGIES
 17 August 2005 No 10/05 ASSA ABLOY S INCREASED GROWTH DRIVEN BY GLOBAL TECHNOLOGIES Sales for the second quarter of 2005 increased organically by 6% to SEK 6,984 M (6,533) Quarterly operating income is
First Quarter 2017 April 19, qlirogroup.com
 First Quarter 2017 April 19, 2017 BUSINESS UPDATE Marcus Lindqvist, CEO 2 Increased Gross Profit and Credit Market Licence Highlights Strategy Focus 1. E-commerce gross profit increased 15 per cent to
Operating profit increased by 44 percent to 27.2 MSEK (19.0). Result after tax increased by 52 percent to 27.7 MSEK (18.3).
. Result after tax increased by 52 percent to 27.7 MSEK (18.3).") Interim report January-September 2016 November 10, 2016 Third quarter Net sales amounted to 167.0 MSEK (149.7), an increase by 11.6 percent compared to the corresponding quarter last year. At comparable
Interim report January-September 2016 November 10, 2016 Third quarter Net sales amounted to 167.0 MSEK (149.7), an increase by 11.6 percent compared to the corresponding quarter last year. At comparable
12% 4.2% 4.0 SEK M. Q1 INTERIM REPORT January March Continued improved result, order intake stable but lower than last year s record quarter
 Stockholm February 10, 2017 Pricer AB (publ) corp. identity. No. 556427-7993 Q1 INTERIM REPORT January March 2017 12% Net sales growth 4.2% Operating margin 4.0 SEK M Profit for the period Continued improved
Interim Report. July September July- Sept. Sept
 Q3 Interim Report July September Doro AB Corporate Identity Number 556161-9429 18.2% Net sales growth 8.9% EBIT margin Growth in all markets and improved margins July September Net sales amounted to SEK
Interim Report. January September High sales growth continues with strengthened order book. July September January September 2015
 Q3 Interim Report January September Doro AB Corporate Identity Number 556161-9429 34.5% Net sales growth 6.7% EBIT margin High sales growth continues with strengthened order book July September Net sales
Yearly. Fourth quarter YEAR-END REPORT 2018 JANUARY - DECEMBER. Net sales for the fourth quarter reached SEK 363 m (301), corresponding to an
, corresponding to an") YEAR-END REPORT JANUARY - DECEMBER Fourth quarter Net sales for the fourth quarter reached SEK 363 m (301), corresponding to an increase of 20 %. Currency translations had a positive effect of SEK 21 m
YEAR-END REPORT JANUARY - DECEMBER Fourth quarter Net sales for the fourth quarter reached SEK 363 m (301), corresponding to an increase of 20 %. Currency translations had a positive effect of SEK 21 m
hms networks First quarter Last twelve months INTERIM REPORT 2017 JANUARY - MARCH
 hms networks INTERIM REPORT JANUARY - MARCH Last twelve months Net sales for the last twelve months amounted to SEK 1 030 m (732) corresponding to a 37 % increase in local currencies. The revaluation of
Year-end report. January-December President s comments. January - December. Fourth quarter
 Year-end report January-December Fourth quarter > Net sales increased during the fourth quarter by 7 percent to SEK 2,204 M (2,059). Net sales increased by 13 percent in local currencies > Operating profit
Interim report January March 2009
 Interim report January March 2009 Vitrolife AB (publ) Strong conclusion to a record quarter Sales increased by 22 percent to SEK 71.8 (58.7) million. Calculated in local currencies growth was 4 percent.
Knowit AB Interim Report
 ... Knowit AB Interim Report January march 2013... Highlights... Continued weak market Results and margin on par with the fourth quarter 2012 Strong growth in the public sector, but weaker in Finance and
Strong growth profitability doubled
 Year-end report January 1 December 31, 2016 Odd Molly International AB (publ) Stockholm, Sweden, February 16, 2017 Strong growth profitability doubled JANUARY 1 DECEMBER 31, 2016 Total operating revenue
Interim report 1 May October 2013
 Interim report 1 May 2013 31 October 2013 Second quarter 2013/14 Sales increased by 4 % to 1,678 MSEK (1,614). In local currencies, growth was up 6 % Operating profit increased by 23 % to 126 MSEK (102)
INTERIM REPORT 1 JANUARY 31 MARCH 2012
 INTERIM REPORT 1 JANUARY 31 MARCH 2012 Quarterly period January-March Poolia's operating income amounted to SEK 276.7 (283.6), million, which is a decline of -2.4%, (-2.6% in local currency). Operating
Managing cash in society.
 interim report January June 2012 Managing cash in society. Continued margin improvement January June 2012 Revenue during the period amounted to MSEK 5,720 MSEK (5,210). Real growth amounted to 6 percent
Cision reports solid incremental performance
 1 Cision AB (publ) Interim report January March 2012, April 24th, 2012 Cision reports solid incremental performance January March Total revenue SEK 245 million (248) Organic growth +4% ( 2%) Operating
Year-end report January 1 December 31, 2017
 Year-end report January 1 December 31, 2017 Odd Molly International AB (publ) Stockholm, Sweden, February 16, 2018 The industry is changing - and Odd Molly with it OCTOBER 1 DECEMBER 31, 2017 Total operating
Higher full-year sales weaker finish
 BJÖRN BORG AB YEAR-END REPORT JANUARY DECEMBER 2008 Higher full-year sales weaker finish Fourth quarter, October 1 December 31, 2008 Brand sales* decreased by 9 percent to SEK 594 million (651). The Group
Interim Report as of December 31, NorCell Sweden Holding 2 AB (publ) Group
 Group") Interim Report as of December 31, 2012 NorCell Sweden Holding 2 AB (publ) Group FOR IMMEDIATE RELEASE Date: February 20, 2013 Time: 9:30 CET IMPORTANT INFORMATION For investors and prospective investors
Interim Report as of December 31, 2012 NorCell Sweden Holding 2 AB (publ) Group FOR IMMEDIATE RELEASE Date: February 20, 2013 Time: 9:30 CET IMPORTANT INFORMATION For investors and prospective investors
H & M Hennes & Mauritz AB
 H & M Hennes & Mauritz AB Three-month report 1 December 2013 28 February 2014 First quarter The H&M Group s sales including VAT increased in local currencies by 12 percent during the first quarter. Converted
P R E S S R E L E A S E
 P R E S S R E L E A S E from ASSA ABLOY AB (publ) 9 August 2002 No. 11/02 INTERIM REPORT FOR THE SECOND QUARTER OF 2002 Sales increased 14% greater focus on organic growth Income before tax increased 26%
GUNNEBO INTERIM REPORT JANUARY JUNE 2015
 GUNNEBO INTERIM REPORT JANUARY JUNE 2015 Gothenburg, July 17, 2015 The CEO s comments on the second quarter Order intake increased organically by 14% during the second quarter. Several major orders were
Interim Report for Duni AB (publ) 1 January 31 December 2010 (compared with the same period of the previous year)
 1 January 31 December 2010 (compared with the same period of the previous year)") Interim Report for Duni AB (publ) 1 January 31 (compared with the same period of the previous year) 16 February 2011 Improved operating margin of 14.8% for the quarter 1 January 31 Net sales amounted to
Interim Report for Duni AB (publ) 1 January 31 (compared with the same period of the previous year) 16 February 2011 Improved operating margin of 14.8% for the quarter 1 January 31 Net sales amounted to
P R E S S R E L E A S E
 P R E S S R E L E A S E from ASSA ABLOY AB (publ) 6 February 2003 No. 03/03 REPORT FOR THE FOURTH QUARTER OF 2002 (YEAR-END REPORT) Sales increased 3% for the quarter, 12% in local currencies, 2% organic
HMS Networks AB (publ)
") HMS Networks AB (publ) January December 2010 Yearend report Yearend report 2010 Net sales increased by 41 % and profit after tax increased by 200% Net sales for the year increased to SEK 344.5 m (244.5),
HMS Networks AB (publ) January December 2010 Yearend report Yearend report 2010 Net sales increased by 41 % and profit after tax increased by 200% Net sales for the year increased to SEK 344.5 m (244.5),
Interim report. January September President s comments. The third quarter. January-September
 Interim report January September The third quarter > > Net sales increased by 30 percent during the third quarter to SEK 1,906 M (1,462). Net sales increased by 12 percent in local currencies > > Operating
P R E S S R E L E A S E
 P R E S S R E L E A S E from ASSA ABLOY AB (publ) May 4, 2001 no. 9/01 INTERIM REPORT JANUARY - MARCH 2001 Sales increased by 72% to SEK 5,104 M (2,976) Organic growth for comparable units was 4% Income
INTERIM REPORT, 1 JANUARY 30 JUNE 2011
 INTERIM REPORT, 1 JANUARY 3 JUNE 211 Quarterly period, April to June 211 Poolia revenues, excluding Dedicare, were MSEK 283.2 (252.5), an increase of 12%, which corresponds to 15% in local currency. Poolia
Key ratios Oct-Dec Oct-Dec Jan-Dec Jan-Dec
 Year End Report 2010 2010 Year End Report Net sales for 2010 amounted to MSEK 212 (206). Fourth quarter net sales were MSEK 59 (64). The gross margin for 2010 was 68% (69) and the gross profit was MSEK
H & M HENNES & MAURITZ AB NINE-MONTH REPORT
 H & M HENNES & MAURITZ AB NINE-MONTH REPORT 1 December 2007 31 August 2008 Sales excluding VAT for the H&M Group for the first nine months of the financial year amounted to SEK 62,222 m (55,529), an increase
Interim report. January - June Interim report for the period January - June Second quarter April - June 2013
 Interim report January - June 2013 August 15, 2013 Interim report for the period January - June 2013 Second quarter April - June 2013 Group net sales in the second quarter 2013 decreased by 4.9 percent
1 January 31 december Year-End Report - Cabonline Group Holding
 1 January 31 december 2017 Year-End Report - Cabonline Group Holding October-December 2017 January-December 2017 Net sales amounted to SEK 1,560 million (1,531) EBITDA before non-recurring items amounted
IAR Systems Group AB Interim report January-June IAR Systems Group AB Interim report January-March 2017
 IAR Systems Group AB Interim report January-June 217 IAR Systems Group AB Interim report January-March 217 IAR Systems Group AB Interim report January-June 217 Q1 Q2 Strong recovery in Asia and stable
P R E S S R E L E A S E
 P R E S S R E L E A S E from ASSA ABLOY AB (publ) 16 February 2005 No. 3/05 GOOD END TO A STRONG YEAR FOR ASSA ABLOY Sales for the fourth quarter increased organically by 4% to SEK 6,263 M (6,096) after
Interim Report January September 2015
 Interim Report January September 215 Net sales and operating profit at record high levels Third quarter 215 Order intake of SEK 119 (166) M, a decrease of 28 percent compared to last year Net sales of
ASSA ABLOY OFF TO AN EXCELLENT START
 25 April 2007 25 April 2007 no:08/07 ASSA ABLOY OFF TO AN EXCELLENT START Sales in the first quarter increased by 8% to SEK 8,227 M (7,653), with 8% organic growth, 6% acquired growth and exchange-rate
H & M HENNES & MAURITZ AB NINE-MONTH REPORT
 NINE-MONTH REPORT 2010 H & M HENNES & MAURITZ AB NINE-MONTH REPORT 1 December 2009 31 August 2010 NINE MONTHS The H&M Group s sales excluding VAT during the first nine months of the financial year amounted
H & M HENNES & MAURITZ AB THREE-MONTH REPORT
 H & M HENNES & MAURITZ AB THREE-MONTH REPORT 1 December 2007 29 February 2008 Sales excluding VAT for the H&M Group for the first three months of the financial year amounted to SEK 19,742 m (16,772), an
Year-end Report January 1 December 31, 2010
 Year-end Report January 1 December 31, 2010 Press release, February 14, 2011 Sales grew 22 percent in the fourth quarter with cash flow of SEK 103 m Highlights of the fourth quarter of 2010: Net sales
Interim report January - March First quarter. The group in brief
 Interim report January - March 2017 First quarter Net sales increased by 105% to MSEK 21.1 (10.3) Operating profit declined to MSEK -4.9 (-3.3). Adjusted operating profit* increased to MSEK 1.6 (-3.3)
H & M HENNES & MAURITZ AB THREE-MONTH REPORT
 THREE-MONTH REPORT 2010 H & M HENNES & MAURITZ AB THREE-MONTH REPORT 1 December 2009 28 February 2010 THE FIRST QUARTER The H&M Group s sales excluding VAT amounted to SEK 24,846 m (23,299), an increase
Good performance in a weak market
 1 7 February 2013 No. 2/13 Good performance in a weak market Fourth quarter Sales increased by 4% in the quarter, with 0% organic growth, and totaled SEK 12,239 M (11,744). Good growth in Americas and
2.3% Interim Report. January March Good growth supported by successful launch and sales ramp-up in USA and Canada
 Q1 Interim Report January March Doro AB Corporate Identity Number 556161-9429 22.3% Net sales growth 2.3% EBIT margin Good growth supported by successful launch and sales ramp-up in USA and Canada January
Summary of the third quarter and first nine months of 2017
 Interim Report January September 2017 Evolution Gaming Group AB (publ) Third quarter of 2017 (Q3 2016) Operating revenues increased by 56% to EUR 45.7 million (29.2) EBITDA increased by 103% to EUR 21.8
PRESS RELEASE Observer AB is quoted on the Attract 40 section of Stockholmsbörsen s O-list and has approximately 25,000 shareholders.
 PRESS RELEASE Observer AB is quoted on the Attract 40 section of Stockholmsbörsen s O-list and has approximately 25,000 shareholders. Observer AB (publ) Year-end report January December 2003 The Nordic
Interim report January 1 December 31, 2015 Further increase in sales and stronger profitability
 Odd Molly International AB (publ) Stockholm, Sweden, February 18, 2016 Interim report January 1 December 31, 2015 Further increase in sales and stronger profitability January 1 December 31, 2015 Net sales
Interim Report for Duni AB (publ) 1 January 30 June 2009
 1 January 30 June 2009") Interim Report for Duni AB (publ) 1 January 30 2009 (compared with the same period of the previous year) 29 July 2009 Strong cash flow and stable profitability 1 January 30 2009 Net sales increased by
Interim Report for Duni AB (publ) 1 January 30 2009 (compared with the same period of the previous year) 29 July 2009 Strong cash flow and stable profitability 1 January 30 2009 Net sales increased by
Group net sales increased by 12 percent to MSEK (107.2). At comparable exchange rates sales increased by 8 percent.
. At comparable exchange rates sales increased by 8 percent.") KSEK KSEK January - March 2012 April 26, 2012 First quarter 2012 Group net sales increased by 12 percent to 119.6 MSEK (107.2). At comparable exchange rates sales increased by 8 percent. The operating
KSEK KSEK January - March 2012 April 26, 2012 First quarter 2012 Group net sales increased by 12 percent to 119.6 MSEK (107.2). At comparable exchange rates sales increased by 8 percent. The operating
First quarter Δ. Sales, SEK M 15,891 18,142 14%
 Sales increased by 14% to SEK 18,142 M (15,891), with organic growth of 6% (3). Acquisitions contributed 3% Strong growth was shown by Global Technologies, Entrance Systems, Americas and EMEA, and good
NEW SPORTS APPAREL COLLECTION
 BJÖRN BORG AB INTERIM REPORT JANUARY - SEPTEMBER NEW SPORTS APPAREL COLLECTION JULY 1 SEPTEMBER 30, The Group s net sales amounted to SEK 180.0 million (191.4), a decrease of 6.0 percent. Excluding currency
H & M HENNES & MAURITZ AB FULL YEAR REPORT
 H & M HENNES & MAURITZ AB FULL YEAR REPORT 1 December 2005 30 November 2006 Sales for the H&M Group excluding VAT for the financial year amounted to SEK 68,400 m (61,262), an increase of 12 per cent. In
Interim report January March 2015
 Interim report January March Gross cash collections SEK 791m Portfolio acquisitions SEK 273m January March (compared with the first quarter ) Gross cash collections increased by 48 per cent to SEK 791m
SCANIA INTERIM REPORT JANUARY SEPTEMBER 2004
 1 November 2004 The first nine months of 2004 turned out well, and volume rose in practically all markets. The new truck range has been well received by customers and the trade press. The changeover of
Record profit and market growth
 1 28 July 2010 No. 13/10 Record profit and market growth Sales totaled SEK 9,356 M (8,899), an increase of 5%, made up of 2% organic growth, 8% acquired growth and exchange-rate effects of -5%. Growth
GUNNEBO INTERIM REPORT JANUARY - JUNE 2014
 GUNNEBO INTERIM REPORT JANUARY - JUNE 2014 Gothenburg July 16, 2014 CEO s comments for the second quarter During the second quarter, Group sales increased organically by 6% to MSEK 1,419. Growth was primarily
Interim Report for January-September 2015
 Interim Report for January-September ember Acquisition of Gatso Beheer BV forming Sensys Gatso Group effective from August 1 st, Net sales amounted to SEK 100.3 m (43.0) Order intake amounted to SEK 39.7
Press Release 20 October, 2017
 Press Release 20 October, 2017 Net sales increased 42.5 percent to SEK 102.0 (71.6) million (43.7 percent in local currencies) EBIT increased to SEK 40.0 (23.3) million The EBIT margin reached 39.2 (32.5)
+110% 7.6% SEK 27.4 M. Q3 INTERIM REPORT January September Record high net sales for an individual quarter and continued strong order intake
 Stockholm October 26, 2018 Pricer AB (publ) corp. identity. no. 556427-7993 Q3 INTERIM REPORT January September 2018 +110% Net sales increase for the quarter 7.6% Operating margin for the quarter SEK 27.4
H & M HENNES & MAURITZ AB FULL YEAR REPORT
 H & M HENNES & MAURITZ AB FULL YEAR REPORT 1 December 2006 30 November 2007 Sales excluding VAT for the H&M Group for the financial year amounted to SEK 78,346 m (68,400), an increase of 15 percent. In
Correction page 3: A strong quarter with record sales and earnings
 1 10 February 2012 No. 04/12 Correction page 3: A strong quarter with record sales and earnings Correction, under the headline FOURTH QUARTER the correct figure is: Exchange-rate effects had a negative
BJÖRN BORG AB YEAR END REPORT JANUARY DECEMBER Weak finish
 BJÖRN BORG AB YEAR END REPORT JANUARY DECEMBER 2013 Weak finish OCTOBER 1 DECEMBER 31, 2013 The Group s net sales decreased by 28 percent to SEK 100.3 million (138.7). The decrease was the same excluding
INTERIM REPORT JANUARY MARCH 2016
 G5 ENTERTAINMENT AB INTERIM REPORT JANUARY MARCH INTERIM REPORT JANUARY MARCH JANUARY MARCH Consolidated revenue for the period was SEK 101.2 M (97.6), an increase of 4 per cent compared to the same period
1 (19) Year-end report January December Tradedoubler year-end report January December 2016
 Year-end report January December Tradedoubler year-end report January December 2016") 1 (19) Year-end report January December 2016 Tradedoubler year-end report January December 2016 2 (19) Year-end report January December 2016 Improved financial performance THE FOURTH QUARTER OCTOBER -
1 (19) Year-end report January December 2016 Tradedoubler year-end report January December 2016 2 (19) Year-end report January December 2016 Improved financial performance THE FOURTH QUARTER OCTOBER -
Year-end report (1 Jan-31 Dec 2007) Continued improved results for Doro - Core business profitable and strong growth in Care Electronic
 Continued improved results for Doro - Core business profitable and strong growth in Care Electronic") Year-end report (1 Jan-31 Dec 2007) Continued improved results for Doro - Core business profitable and strong growth in Care Electronic Fourth quarter 2007 Sales amounted to SEK 114 million (SEK 121 m)
Year-end report (1 Jan-31 Dec 2007) Continued improved results for Doro - Core business profitable and strong growth in Care Electronic Fourth quarter 2007 Sales amounted to SEK 114 million (SEK 121 m)
FOOTWAY INTERIM REPORT H INTERIM REPORT JANUARY 1 JULY 30, 2017 FOOTWAY GROUP AB (PUBL)
") FOOTWAY INTERIM REPORT H1 2017 INTERIM REPORT JANUARY 1 JULY 30, 2017 FOOTWAY GROUP AB (PUBL) 0 FOOTWAY INTERIM REPORT H1 2017 Contents Footway facts 2 Comments on the first half of year 2017 3 Significant
FOOTWAY INTERIM REPORT H1 2017 INTERIM REPORT JANUARY 1 JULY 30, 2017 FOOTWAY GROUP AB (PUBL) 0 FOOTWAY INTERIM REPORT H1 2017 Contents Footway facts 2 Comments on the first half of year 2017 3 Significant
P R E S S R E L E A S E
 P R E S S R E L E A S E from ASSA ABLOY AB (publ) 2 November 2004 No. 12/04 ASSA ABLOY: CONTINUED STRONG ORGANIC GROWTH IN THE THIRD QUARTER Sales in the third quarter increased organically by 6% to SEK
Interim Report January September 2016
 Third Quarter - 20 Interim Report January September 20 The order intake was MSEK 3,438.2 (3,0.3), which is an increase of 11.3% after adjustment for currency effects of MSEK -3.1 and acquisitions of MSEK
First quarter of 2018 (Q1 2017) Events during the first quarter of Summary of the first quarter of 2018
 Events during the first quarter of Summary of the first quarter of 2018") Interim report January March 2018 Evolution Gaming Group AB (publ) First quarter of 2018 (Q1 2017) Operating revenues increased by 30% to EUR 51.6 MEUR (39.7) EBITDA increased by 29% to EUR 22.0 million
Interim report January March 2018 Evolution Gaming Group AB (publ) First quarter of 2018 (Q1 2017) Operating revenues increased by 30% to EUR 51.6 MEUR (39.7) EBITDA increased by 29% to EUR 22.0 million
INTERIM REPORT 1 JANUARY 31 MARCH 2017
 INTERIM REPORT 1 JANUARY 31 MARCH 2017 Quarterly period January-March Reported revenue, earnings, cash flow and financial ratios relate to continuing operations, and do not include Poolia UK. Poolia s
GUNNEBO INTERIM REPORT JANUARY-SEPTEMBER 2014
 Gothenburg, October 23, 2014 GUNNEBO INTERIM REPORT JANUARY-SEPTEMBER 2014 The CEO s comments on the third quarter During the quarter, order intake increased organically by 1% compared with last year.
Very strong license sales
 Interim Report JANUARY MARCH 214 Very strong license sales License revenue for January-March increased with 27 percent to SEK 53.4 (42.) million Sales for January-March increased with 9 percent to SEK
Interim Report January-September 2009
 Anoto Group Interim Report 20 Anoto Group AB is the company behind and world leading in the unique technology for digital pen and paper, which enables fast and reliable transmission of handwritten text
PRECISE BIOMETRICS INTERIM REPORT JANUARY-MARCH 2018
 Q1 PRECISE BIOMETRICS INTERIM REPORT JANUARY-MARCH 2018 CONTINUED EFFORTS ON NEW SENSOR TECHNOLOGIES INTERIM REPORT FOR THE PERIOD JANUARY TO MARCH 2018 FIRST QUARTER Net sales for the remaining operation
Opus Prodox AB (publ)
") CONVENIENCE TRANSLATION - THE SWEDISH VERSION SHALL PREVAIL This is a non-official translation of the Swedish original version which has been developed in-house. In case of differences between the English
CONVENIENCE TRANSLATION - THE SWEDISH VERSION SHALL PREVAIL This is a non-official translation of the Swedish original version which has been developed in-house. In case of differences between the English
Interim report January 1 March 31, 2016 More aggressive investments profitable growth
 Odd Molly International AB (publ) Stockholm, Sweden, April 19, 2016 Interim report January 1 March 31, 2016 More aggressive investments profitable growth January 1 March 31, 2016 Net sales amounted to
H & M HENNES & MAURITZ AB NINE-MONTH REPORT
 H & M HENNES & MAURITZ AB NINE-MONTH REPORT 1 December 2012 31 August 2013 NINE-MONTHS The H&M Group s sales including VAT increased in local currencies by 8 percent in the first nine months of the financial
customer cancellations
 Full-year report 1 January 31 December 2007 Securitas Direct AB Positive development for customer cancellations Customer cancellations totalled 11,667 in the fourth quarter Payback period for investments