Asia-Pacific Trade Briefs: Islamic Republic of Iran
|
|
|
- Winifred Virginia Robbins
- 5 years ago
- Views:
Transcription
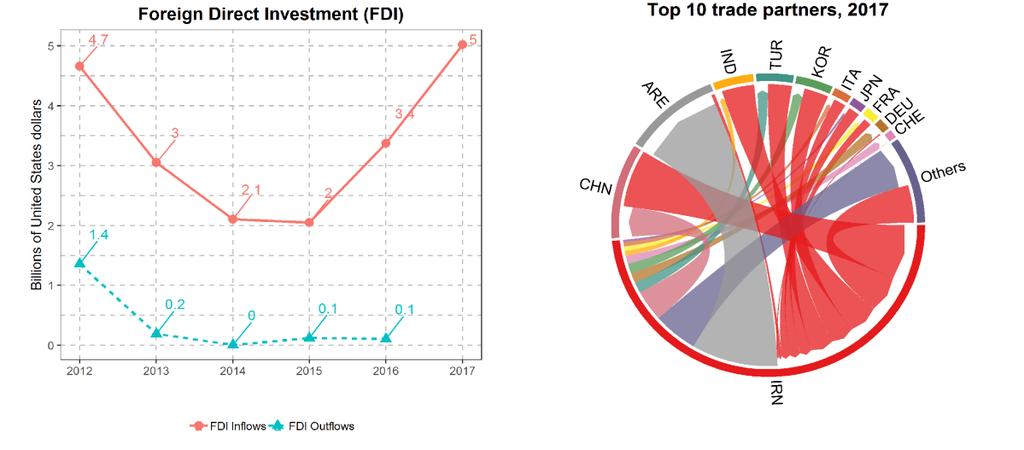
1 i Asia-Pacific Trade Briefs: Islamic Republic of Iran Merchandise Trade Islamic Republic of Iran has a trade-to-gdp ratio of 37.31%. Merchandise trade accounted for 84.8% of Islamic Republic of Iran's total trade in Islamic Republic of Iran's merchandise exports declined by 2.3% on average during , lower than the Asia-Pacific average of 0% during the same time period. In 2017, Islamic Republic of Iran's merchandise exports grew by 26%, while in the Asia-Pacific region they increased by 11.5% in the same year. Meanwhile, Islamic Republic of Iran's merchandise imports decreased by 3.5% on average during , and recorded an increase of 17.5% between 2016 and Services Trade In 2017, Islamic Republic of Iran's commercial services' shares of total exports and imports were 9.6% and 24.4%, respectively. Commercial services exports grew by 3.8% on average during , higher than the Asia-Pacific average of 3.2% during the same time period. Meanwhile, Islamic Republic of Iran's commercial services imports increased by 0.4% on average during the (Note: commercial services trade data for Islamic Republic of Iran for 2017 was not available at the time of writing this report, as such, 2016 data was used for exports and imports to come up with services trade shares and latest five-year average growth rates.) Foreign Direct Investment (FDI) Islamic Republic of Iran recorded an average annual FDI inflows growth of 1.5% from 2012 to 2017, significantly smaller than the Asia and the Pacific's 2.9% average annual FDI inflows growth. At the same time, Islamic Republic of Iran experienced an increase in FDI inflows by 48.8% in 2017.
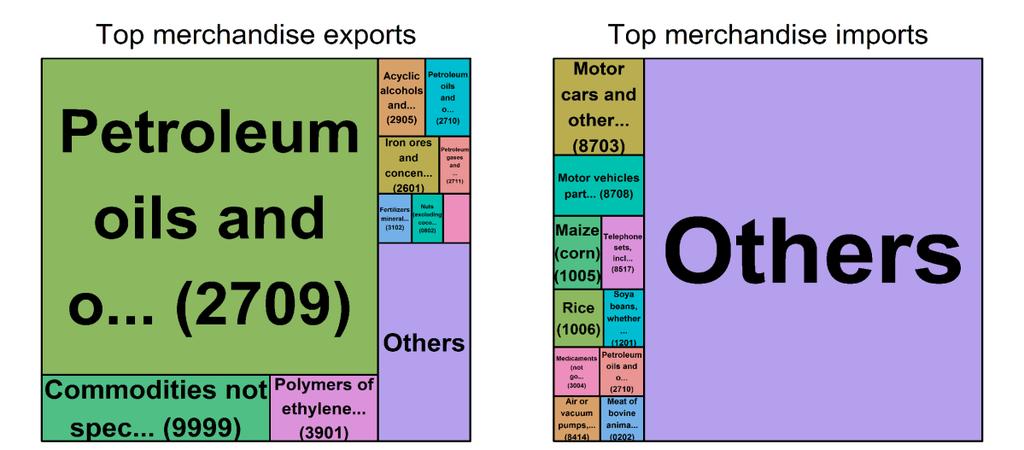
2 Top Trade Partners In 2017, the largest trade partner of Islamic Republic of Iran was China, representing 27.5% of its exports and 14.5% of its imports. 1.5% of Islamic Republic of Iran's exports and 39.4% of Islamic Republic of Iran's imports by value were traded with United Arab Emirates, its second largest trade partner. Other significant trade partners were India, Turkey, Republic of Korea, Italy, Japan, France, Germany, and Switzerland. Top Traded Products The largest product category exported by Islamic Republic of Iran in 2017 was "Petroleum oils and oils obtained from bituminous minerals; crude" (2709), with an export share of 64.8% of total exports, followed by the second most exported product category, "Commodities not specified according to kind" (9999), which accounted for 9.2% of Islamic Republic of Iran's total exports. In terms of imports, "Motor cars and other motor vehicles; principally designed for the transport of persons (other than those of heading no. 8702), including station wagons and racing cars" (8703) represented 5.3% of total imports, standing out the top imported product category. Meanwhile, "Motor vehicles; parts and accessories, of heading no to 8705" (8708) had a share of 9.2%, the second largest imported product category in Islamic Republic of Iran in (Note: mirror trade data was used to get top traded products for this year for Islamic Republic of Iran). Tariffs Islamic Republic of Iran is currently not a member of the WTO (but an observer), and as such no detailed tariff information notified to the WTO is available. Trade Costs Due to limited data availability, calculation of trade costs with major trading economies in the region is not possible, hence trade costs with major developed economies (Germany, Japan and the United States) are presented. Trade costs in Islamic Republic of Iran remained higher compared with the most efficient traders in Asia and the Pacific.
3
4 Trade Agreements Islamic Republic of Iran has 5 trade agreements in force, 1 signed agreements pending ratification, and 3 trade agreements under negotiation. Of the economy's total exports, 44.2% are directed to its trade agreement partners, while 14.7% of its total imports come from trade agreement partners. Title Status Year in force Share of total exports (%) Share of total imports (%) Global System of Trade Preferences (GSTP) in force Pakistan-Iran in force Economic Cooperation Organisation Trade Agreement (ECOTA) Group of 8 Preferential Trade Agreement (D-8 PTA) in force in force Turkey-Iran in force Sri Lanka-Iran signed NA Eurasian Economic Union (EAEU) - Iran under neg. NA Indonesia-Iran under neg. NA Trade Preferential System among the Organisation of the Islamic Conference (TPS/OIC) under neg. NA Sources: Total commercial services and merchandise trade data were accessed from the WTO statistics website. Bilateral trade data accessed through IMF Direction of Trade Statistics. Product-level data accessed through UN Comtrade database. Tariff data were accessed through the World Bank s WITS and WTO tariff databases. FDI data were accessed through UNCTAD statists portal. Trade-to-GDP ratio was calculated by summing commercial and merchandise exports and imports and dividing the sum by the latest GDP (current United States dollars), retrieved from the World Bank World Development indicators database. Trade costs data were based on the ESCAP-World Bank trade cost database.
5 Note: Data are based on economies for which data available only. For regional aggregates, latest data was used in lieu of latest missing values. Merchandise trade data follow the latest HS classification. Products are defined at the 4-digit level. Tariffs are simple average. Trade costs shown are tariff equivalents, calculated as trade-weighted average trade costs of economies with found developing economies in the region (China, India, Indonesia and Russian Federation), where data was available. Trade costs for East Asia-3 comprises China, Japan and the Republic of Korea; trade costs for European Union- 3 comprises Germany, France and the United Kingdom. Definitions: MFN bound tariff is the maximum most-favoured nation (MFN) tariff permitted under WTO obligations. MFN applied tariff is the tariff applied to imports among WTO members. The effectively applied rate is the ratio of collected import tariff revenue and value of imports. Binding coverage refers to the share of bound tariff lines in the total number of tariff lines. For more details contact escap-tiid@un.org.
Asia-Pacific Trade Briefs: Russian Federation
 i Asia-Pacific Trade Briefs: Russian Federation Merchandise Trade Russian Federation has a trade-to-gdp ratio of 46.6%. Merchandise trade accounted for 80.4% of Russian Federation's total trade in 2017.
Asia-Pacific Trade Briefs: Hong Kong, China
 i Asia-Pacific Trade Briefs: Hong Kong, China Merchandise Trade Hong Kong, China has a trade-to-gdp ratio of 386.95%. Merchandise trade accounted for 86.3% of Hong Kong, China's total trade in 2017. Hong
Note: G20 includes only the 19 member countries (excludes European Union).
.") Note: G20 includes only the 19 member countries (excludes European Union). (Per cent) Variable 2007 2008 2009 2010 2011 2012 2013 2014 2015* GDP 5.7 3.1 0.0 5.4 4.2 3.4 3.3 3.4 3.1 Trade 7.9 2.9-10.3 12.5
Note: G20 includes only the 19 member countries (excludes European Union). (Per cent) Variable 2007 2008 2009 2010 2011 2012 2013 2014 2015* GDP 5.7 3.1 0.0 5.4 4.2 3.4 3.3 3.4 3.1 Trade 7.9 2.9-10.3 12.5
COMCEC Trade OUTLOOK 2015
 COMCEC Trade OUTLOOK 2015 Trade Working Group 6 th Meeting September 17, 2015 Ankara, Turkey OUTLINE Recent Trends in Trade Between the OIC Member States and the World Recent Trends in Intra-OIC Trade
Session 8 Simple analytical method for identifying an offensive l when negotiating an FTA: An example of Sri Lanka-China FTA negotiations
 Session 8 Simple analytical method for identifying an offensive l when negotiating an FTA: An example of Sri Lanka-China FTA negotiations Dr Alexey Kravchenko Trade, Investment and Innovation Division
COMCEC STRATEGY. For Building an Interdependent Islamic World. COMCEC Trade OUTLOOK 2014
 COMCEC Trade OUTLOOK 2014 Trade Working Group 3 rd Meeting February 27 th, 2014 Ankara, Turkey OUTLINE Recent Trends and Patterns in Global Trade Trade Between the OIC Member States and the World Developments
E. TAKING ADVANTAGE OF REGIONAL TRADE AND INVESTMENT AGREEMENTS
 E. TAKING ADVANTAGE OF REGIONAL TRADE AND INVESTMENT AGREEMENTS 1. INTRODUCTION The year 2010 has seen some historical firsts in terms of preferential trade agreements (PTAs) in Asia. On the one hand,
Improving Regional Trade to Support Pakistan s Economic Growth 10th Annual Conference on Management of the Pakistan Economy
 Improving Regional Trade to Support Pakistan s Economic Growth 10th Annual Conference on Management of the Pakistan Economy Lahore School of Economics 26-27 March, 2014 Dr. Manzoor Ahmad mahmad@usaidpakistantrade.org
Online Free Services Available on the Portal
 Online Free Services Available on the Portal MFN/Preferential Tariff of over 50 Countries MFN/ Preferential Tariff and SPS-TBT of India Rules of Origin to get preferential access to targeted markets under
ARTNeT Capacity Building Workshop on Trade Research UN ESCAP WITS
 United Nations Conference on Trade and Development ARTNeT Capacity Building Workshop on Trade Research UN ESCAP WITS World Integrated Trade Solution Ralf Peters UNCTAD Bangkok, March 25 World Integrated
ANNUAL ECONOMIC REPORT AJMAN 2015
 ANNUAL ECONOMIC REPORT AJMAN C O N T E N T S Introduction Growth of the Global Economy Economic Growth in the United Arab Emirates Macro - Economic Growth in the Emirate of Ajman Gross Domestic Product
Financing for Development in Asia and the Pacific: Opportunities and Challenges
 Financing for Development in Asia and the Pacific: Opportunities and Challenges Dr. Shamshad Akhtar, Under-Secretary-General of the United Nations & Executive Secretary of The Economic and Social Commission
Trade trends and trade policy developments. Ian Ascough Head of Bilateral Trade Negotiations BIS/DfID Trade Policy Unit
 Trade trends and trade policy developments Ian Ascough Head of Bilateral Trade Negotiations BIS/DfID Trade Policy Unit The big picture UK earnings from exports of goods exceeded earnings from exports of
Mongolia Tax Profile. Produced in conjunction with the KPMG Asia Pacific Tax Centre. Updated: June 2015
 Mongolia Tax Profile Produced in conjunction with the KPMG Asia Pacific Tax Centre Updated: June 2015 Contents 1 Corporate Income Tax 1 2 Income Tax Treaties for the Avoidance of Double Taxation 6 3 Indirect
REGIONAL WORKSHOP ON Using Evidence-based Trade Policy for Achieving the Sustainable Development Goals in LDCS and LLDCS
 REGIONAL WORKSHOP ON Using Evidence-based Trade Policy for Achieving the Sustainable Development Goals in LDCS and LLDCS Session 3: Trade War and Potential Impact on LDCs Mia Mikic Director Trade, Investment
Exports to major trading partners and duties faced
 Sri Lanka Part A.1 Tariffs and imports: Summary and duty ranges Summary Total Ag Non-Ag WTO member since 1995 Simple average final bound 30.3 50.1 19.6 Binding coverage: Total 37.8 Simple average MFN applied
DG Trade Statistical Guide Trade
 DG Trade Statistical Guide 2016 Trade EUROPEAN COMMISSION DG Trade Chief Economist and Trade Analysis Statistics Sector E-mail: trade-statistics@ec.europa.eu EUROPEAN COMMISSION DG Trade Statistical Guide
Exports to major trading partners and duties faced
 European Communities Part A.1 Tariffs and imports: Summary and duty ranges Summary Total Ag Non-Ag WTO member since 1995 Simple average final bound 5.4 15.4 3.9 Binding coverage: Total 100 Simple average
Exports to major trading partners and duties faced
 Indonesia Part A.1 Tariffs and imports: Summary and duty ranges Summary Total Ag Non-Ag WTO member since 1995 Simple average final bound 37.1 47.0 35.6 Binding coverage: Total 96.6 Simple average MFN applied
India s Bilateral Trade in Services: Patterns, Determinants and Role of Trade in Goods
 India s Bilateral Trade in Services: Patterns, Determinants and Role of Trade in Goods Seema Sangita NCAER Mid Year Review November 1, 2014 Objectives The patterns of India s bilateral trade in services.
BULGARIAN TRADE WITH EU IN THE PERIOD JANUARY - MAY 2017 (PRELIMINARY DATA)
") BULGARIAN TRADE WITH EU IN THE PERIOD JANUARY - MAY 2017 (PRELIMINARY DATA) In the period January - May 2017 Bulgarian exports to the EU increased by 10.8% 2016 and added up to 13 283.0 Million BGN (Annex,
BULGARIAN TRADE WITH EU IN THE PERIOD JANUARY - MAY 2017 (PRELIMINARY DATA) In the period January - May 2017 Bulgarian exports to the EU increased by 10.8% 2016 and added up to 13 283.0 Million BGN (Annex,
BULGARIAN TRADE WITH EU IN THE PERIOD JANUARY - APRIL 2017 (PRELIMINARY DATA)
") BULGARIAN TRADE WITH EU IN THE PERIOD JANUARY - APRIL 2017 (PRELIMINARY DATA) In the period January - April 2017 Bulgarian exports to the EU increased by 8.6% 2016 and amounted to 10 418.6 Million BGN
BULGARIAN TRADE WITH EU IN THE PERIOD JANUARY - APRIL 2017 (PRELIMINARY DATA) In the period January - April 2017 Bulgarian exports to the EU increased by 8.6% 2016 and amounted to 10 418.6 Million BGN
Financing the MDG Gaps in the Asia-Pacific
 Financing the MDG Gaps in the Asia-Pacific Dr. Nagesh Kumar Chief Economist, ESCAP And Director, ESCAP Subregional Office for South and South-West Asia, New Delhi 1 2 Outline Closing the poverty gap: interactions
SINGAPORE - FINAL LIST OF MFN EXEMPTIONS (For the Second Package of Commitments) Countries to which the measure applies
 Countries to which the measure applies") All Sectors: Presence of: - unskilled and semi-skilled natural persons - skilled persons (include craftsmen skilled in a particular trade, but exclude specialists/professio nal personnel at management
All Sectors: Presence of: - unskilled and semi-skilled natural persons - skilled persons (include craftsmen skilled in a particular trade, but exclude specialists/professio nal personnel at management
Exports to major trading partners and duties faced
 Australia Part A.1 Tariffs and imports: Summary and duty ranges Summary Total Ag Non-Ag WTO member since 1995 Simple average final bound 9.9 3.4 11.0 Binding coverage: Total 97.0 Simple average MFN applied
Economic and Social Survey of Asia and the Pacific 2017 Governance and Fiscal Management
 Economic and Social Survey of Asia and the Pacific 217 Governance and Fiscal Management Launch and Panel Discussion on the UN Economic and Social Survey of Asia and the Pacific 217: Korean Perspective
San Francisco Retiree Health Care Trust Fund Education Materials on Public Equity
 M E K E T A I N V E S T M E N T G R O U P 5796 ARMADA DRIVE SUITE 110 CARLSBAD CA 92008 760 795 3450 fax 760 795 3445 www.meketagroup.com The Global Equity Opportunity Set MSCI All Country World 1 Index
Global Investments in R&D
 Fact Sheet No. 50 June 2018 FS/2018/SCI/50 Global Investments in R&D The UNESCO Institute for Statistics (UIS) is the statistical office of UNESCO and is the UN depository for global statistics in the
The international experience of economic sanctions: lessons for Russia
 The international experience of economic sanctions: lessons for Russia Alexander Knobel. XIX April International Academic Conference On Economic and Social Development National Research University Higher
India s International Trade & Investment
 India s International Trade & Investment July 2017 1 Structure of Presentation 1 Indian Economy: A Snapshot 2 Merchandise Trade: A Perspective 3 Services Trade: Recent Trends 4 India s Investment Flows
Analyzing the Benefits of Joining the Asia-Pacific Trade Agreement (APTA) for Malaysia, Thailand, and Vietnam
 for Malaysia, Thailand, and Vietnam") Analyzing the Benefits of Joining the Asia-Pacific Trade Agreement (APTA) for Malaysia, Thailand, and Vietnam Final Output (Output 1.4) Piriya Pholphirul* Graduate School of Development Economics National
Analyzing the Benefits of Joining the Asia-Pacific Trade Agreement (APTA) for Malaysia, Thailand, and Vietnam Final Output (Output 1.4) Piriya Pholphirul* Graduate School of Development Economics National
Asia-Pacific: Sustainable Development Financing Outreach. Asia-Pacific: Landscape & State of Sustainable Financing
 Asia-Pacific: Sustainable Development Financing Outreach Asia-Pacific: Landscape & State of Sustainable Financing Dr. Shamshad Akhtar, United Nations Under-Secretary-General & ESCAP Executive Secretary
2013Q3 Scissors and Similar Articles Produced by IAR Team Focus Technology Co., Ltd.
 2013Q3 Scissors and Similar Articles 2013.10 Produced by IAR Team Focus Technology Co., Ltd. Contents 1. China Scissors and Similar Articles Main Original Places of Exported Goods from Jan. to June in
TRADE IN GOODS OF BULGARIA WITH EU IN THE PERIOD JANUARY - JUNE 2018 (PRELIMINARY DATA)
") TRADE IN GOODS OF BULGARIA WITH EU IN THE PERIOD JANUARY - JUNE 2018 (PRELIMINARY DATA) In the period January - June 2018 the exports of goods from Bulgaria to the EU increased by 10.7% 2017 and amounted
TRADE IN GOODS OF BULGARIA WITH EU IN THE PERIOD JANUARY - JUNE 2018 (PRELIMINARY DATA) In the period January - June 2018 the exports of goods from Bulgaria to the EU increased by 10.7% 2017 and amounted
Vietnam. HSBC Global Connections Report. October 2013
 HSBC Global Connections Report October 2013 Vietnam The pick-up in GDP growth will be modest this year, with weak domestic demand and exports still dampening industrial confidence. A stronger recovery
Role of international trade rules in the current economic crisis
 Role of international trade rules in the current economic crisis E-Leader Conference Tallinn, 8 10 June, 2009 Ludmila Sterbova University of Economics Prague, Czech Republic Consequences of the crisis
Azerbaijan Definitions and sources of data
 Azerbaijan Definitions and sources of data Data on foreign direct investment (FDI) in Azerbaijan are reported by the National Bank of Azerbaijan. The Bank does not report FDI data by component (equity,
Updates and revisions of national SUTs for the November 2013 release of the WIOD
 Updates and revisions of national SUTs for the November 2013 release of the WIOD Edited by Marcel Timmer (University of Groningen) With contributions from: Abdul A. Erumban, Reitze Gouma and Gaaitzen J.
aid flows 13 flows (USD 000, 2009 constant)
") AIDFORTRADE AT A GLANCE 2011 Basic indicators Population (thousands, ) 1 6 320 GDP (millions current USD, ) 2 5 939 GDP real growth rate (annual %, ) 3 6.4 GDP per capita, PPP (current international dollars,
AIDFORTRADE AT A GLANCE 2011 Basic indicators Population (thousands, ) 1 6 320 GDP (millions current USD, ) 2 5 939 GDP real growth rate (annual %, ) 3 6.4 GDP per capita, PPP (current international dollars,
UK Trade in Numbers. February 2019
 UK Trade in Numbers February 2019 Disclaimer The figures used in this pocketbook are the latest at the time of publication. We include figures from monthly and quarterly publications, such as ONS Balance
National Export & Investment Agency KAZNEX INVEST Ministry of Investment and Development
 National Export & Investment Agency KAZNEX INVEST Ministry of Investment and Development Invest in Kazakhstan Basic Facts National Flag National Emblem Area: 2,724,000km 2 (1,051,742 sq.miles),9 th largest
EUROPEAN UNION SOUTH KOREA TRADE AND INVESTMENT 5 TH ANNIVERSARY OF THE FTA. Delegation of the European Union to the Republic of Korea
 EUROPEAN UNION SOUTH KOREA TRADE AND INVESTMENT 5 TH ANNIVERSARY OF THE FTA 2016 Delegation of the European Union to the Republic of Korea 16 th Floor, S-tower, 82 Saemunan-ro, Jongno-gu, Seoul, Korea
Double Tax Treaties. Necessity of Declaration on Tax Beneficial Ownership In case of capital gains tax. DTA Country Withholding Tax Rates (%)
") Double Tax Treaties DTA Country Withholding Tax Rates (%) Albania 0 0 5/10 1 No No No Armenia 5/10 9 0 5/10 1 Yes 2 No Yes Australia 10 0 15 No No No Austria 0 0 10 No No No Azerbaijan 8 0 8 Yes No Yes
Double Tax Treaties DTA Country Withholding Tax Rates (%) Albania 0 0 5/10 1 No No No Armenia 5/10 9 0 5/10 1 Yes 2 No Yes Australia 10 0 15 No No No Austria 0 0 10 No No No Azerbaijan 8 0 8 Yes No Yes
Session 5: In search of the meaningful market access what are the policy options for LDCs
 REGIONAL WORKSHOP ON LEAST DEVELOPED COUNTRIES AND LEVERAGING TRADE AS A MEANS OF IMPLEMENTATION FOR THE 2030 AGENDA Session 5: In search of the meaningful market access what are the policy options for
STATISTICS Last update: 03/07/2017
 STATISTICS 2012-2016 Last update: 03/07/2017 BU NEWS BUSINESS [USD, BILLIONS] New business by year, vs. total world exports 3,000 2,500 2,000 1,500 1,000 500 12,131 1,138 40 127 971 14,023 1,323 53 143
Have International Investment Agreements had an impact on Science, Technology, and Innovation in the Asia-Pacific region? Preliminary Analysis
 Have International Investment Agreements had an impact on Science, Technology, and Innovation in the Asia-Pacific region? Preliminary Analysis ACED 2016 ADB Conference on Economic Development in 2016 The
These figures are to be attached to Polterovich and Popov's paper.
 These figures are to be attached to Polterovich and Popov's paper. Fig. 3.1. Foreign Exchange Reserves as a % of GDP, Average Ratios for 19-99 Congo, Rep. US Mexico Russia (1993-99) India Brazil UK Pakistan
PART 1. recent trends and developments
 PART 1 recent trends and developments 1 REGIONAL OVERVIEW OF MERCHANDISE TRADE A. A RETURN TO TRADE CONTRACTION The sluggish growth in developed economies and uncertainty linked to the European economic
Imports. Exports. T135 Figure 18-1 U.S. Exports and Imports as Ratios of GDP, Ratio to GDP
 T135 Figure 18-1 U.S. Exports and Imports as Ratios of GDP, 1929 1998 0.14 0.12 Imports 0.10 Ratio to GDP 0.08 0.06 Exports 0.04 0.02 0.00 1930 1940 1950 1960 1970 1980 1990 1998 T136 Table 18-1 Ratios
Division on Investment and Enterprise
 Division on Investment and Enterprise Readers are encouraged to use the data in this publication for non-commercial purposes, provided acknowledgement is explicitly given to UNCTAD, together with the reference
World Steel Industry Development and Market Prospects 13 th International Market and Trade Conference
 World Steel Industry Development and Market Prospects 13 th International Market and Trade Conference Global Steel Industry in the post-crisis Period Global economic recovery continues to disappoint The
Number of smokers and overall smoking prevalence (for age 15+), 2013
, 2013") Number of Adult Smokers 15+ (Mil) Adult (15+) smoking prevalence (%) Country profile: Socio economic context Population, 2015 161.0 million Source: Population Division of the Department of Economic Adult
Number of Adult Smokers 15+ (Mil) Adult (15+) smoking prevalence (%) Country profile: Socio economic context Population, 2015 161.0 million Source: Population Division of the Department of Economic Adult
Sri Lanka WORLD TARIFF PROFILES 2008 COUNTRY PAGES. Sri Lanka. Tariffs and imports: Summary and duty ranges Summary
 Sri Lanka Sri Lanka Part A.1 Tariffs and imports: Summary and duty ranges Summary Total Ag Non-Ag WTO member since 1995 Simple average final bound 30.3 50.0 19.7 Binding coverage: Total 37.8 Simple average
EU-ASEAN cooperation - key trade and investment statistics
 EU-ASEAN cooperation - key trade and investment statistics Statistics Explained Data extracted in March and April 2017. Most recent data: Further Eurostat information, Database. No planned update This
Evidence Based Trade policy Making: Using statistical tools for policy making
 NATIONAL WORKSHOP ON TRADE POLICY CHOICES: ACCESSION TO WTO AND APTA 8-10 DECEMBER 2014, Bhutan Evidence Based Trade policy Making: Using statistical tools for policy making Witada Aunkoonwattaka (PhD)
Fight with the Resource curse : Mexico s success and Kazakhstan s challenges
 Fight with the Resource curse : Mexico s success and Kazakhstan s challenges Dmitry Rodin CEO, Advantage Kazakhstan Russian Economic Challenge Moscow March 23, 2017 Resource curse Resource curse (or paradox
G-20 Trade Aggregates Based on IMF s Balance of Payments Database
 Twenty-Eighth Meeting of the IMF Committee on Balance of Payments Statistics Rio de Janeiro, Brazil October 27 29, 2015 BOPCOM 15/22 G-20 Trade Aggregates Based on IMF s Balance of Payments Database Prepared
World Ceramic Tiles Forum The review of HS codes for ceramic tiles
 World Ceramic Tiles Forum The review of HS codes for ceramic tiles The review of HS codes for ceramic tiles I. Context II. III. The current situation Next steps i. Writing of explanatory notes ii. Transposing
TRADE IN GOODS OF BULGARIA WITH THIRD COUNTRIES IN THE PERIOD JANUARY - FEBRUARY 2019 (PRELIMINARY DATA)
") TRADE IN GOODS OF BULGARIA WITH THIRD COUNTRIES IN THE PERIOD JANUARY - FEBRUARY 2019 (PRELIMINARY DATA) In the period January - February 2019 the exports of goods from Bulgaria to third countries increased
TRADE IN GOODS OF BULGARIA WITH THIRD COUNTRIES IN THE PERIOD JANUARY - FEBRUARY 2019 (PRELIMINARY DATA) In the period January - February 2019 the exports of goods from Bulgaria to third countries increased
Key Issues in the Design of Capital Gains Tax Regimes: Taxing Non- Residents. 18 July 2014
 Key Issues in the Design of Capital Gains Tax Regimes: Taxing Non- Residents 18 July 2014 How do we tax non-residents on capital income? Domestic design issues Tax treaty issues Interrelationship between
Chapter 5 The Central Asian Republics
 Chapter 5 The Central Asian Republics By Ram Upendra Das Introduction Regional economic integration has gained prominence in recent years as a mechanism to achieve various objectives such as market access,
Tariffs and imports: Summary and duty ranges Summary
 Tanzania Tanzania Part A.1 Tariffs and imports: Summary and duty ranges Summary Total Ag Non-Ag WTO member since 1995 Simple average final bound 120.0 120.0 120.0 Binding coverage: Total 13.4 Simple average
Progress Towards Strong, Sustainable, and Balanced Growth. Figure 1: Recovery From Financial Crisis (100 = First Quarter of Real GDP contraction)
") Progress Towards Strong, Sustainable, and Balanced Growth Figure 1: Recovery From Financial Crisis ( = First Quarter of Real GDP contraction) 13 125 196-26 AE Recessions' Range*** 196-26 AE Recessions**
Progress Towards Strong, Sustainable, and Balanced Growth Figure 1: Recovery From Financial Crisis ( = First Quarter of Real GDP contraction) 13 125 196-26 AE Recessions' Range*** 196-26 AE Recessions**
Jong-Wha Lee. Chief Economist Economics and Research Department Asian Development Bank. Washington, DC April 19, 2010
 Asian Development Outlook 2010 Macroeconomic Policy Challenges Jong-Wha Lee Chief Economist Economics and Research Department Asian Development Bank Washington, DC April 19, 2010 Outline 1. Economic prospects
The European Union Trade Policy
 The European Union Trade Policy Content 1. The EU in world trade 2. EU trade policy Basic features 3. EU trade policy How it works 4. EU trade policy Competing in the world 5. A renewed strategy for Europe
KENYA: TRIST Brief. Prepared by Anneke Hamilton
 KENYA: TRIST Brief Prepared by Anneke Hamilton Overview Kenya is one of East Africa s main trade and finance centers. The agriculture sector plays an important role in the economy, employing over 75% of
1. Economy. Economic Aggregates. Merchandise Foreign Trade. Prices. Financial Statistics. Government Finance. Wages and Compensation
 12 Statistical Yearbook of Abu Dhabi 2016 1. Economy Economic Aggregates Merchandise Foreign Trade Prices Financial Statistics Government Finance Wages and Compensation Foreign Investment Statistical Yearbook
The effects of the financial crisis on developing countries mapping out the issues. By Julian Jessop
 The effects of the financial crisis on developing countries mapping out the issues By Julian Jessop 1. Plan of My Talk The outlook for advanced economies. Impact on developing countries. Some losers and
2014 Consumer Electronics
 2014 Consumer Electronics 2015.09. Catalog 1. China Consumer Electronics Industry Export Trend Analysis... 4 1.1. China Air Conditioner Export Trend Analysis, from Jan. to Dec. 2014...4 1.1.1. China Air
2. Mining equipment exports
 Raw Materials Scoreboard Mining equipment exports 2. Mining equipment exports Key points: The EU-28, China, Japan and the United States were net exporters of mining equipment over the 2011-2015 period.
UNITED NATIONS CONFERENCE ON TRADE AND DEVELOPMENT THE POTENTIAL FOR GSTP TRADE EXPANSION. Note prepared by the UNCTAD secretariat
 Distr. GENERAL UNCTAD/ITCD/TAB/1 27 April 1998 ENGLISH ONLY UNITED NATIONS CONFERENCE ON TRADE AND DEVELOPMENT THE POTENTIAL FOR GSTP TRADE EXPANSION Note prepared by the UNCTAD secretariat The designations
Business implications of the APTA membership for Myanmar
 Training on trade defense measures and other trade related issues 5 September 2014, Yangon, Myanmar Business implications of the APTA membership for Myanmar Jun Ho Shin Trade and Investment Division ESCAP
Introduction to FDI databases
 Introduction to FDI databases Third Asia-Pacific Trade and Investment Week Training on Evidence-based Policymaking in Trade and Investment Wednesday 20 November 2013, UNCC, Bangkok Outline International
ENHANCING THE CONTRIBUTION OF PREFERENTIAL TRADE AGREEMENTS TO INCLUSIVE AND EQUITABLE TRADE
 ENHANCING THE CONTRIBUTION OF PREFERENTIAL TRADE AGREEMENTS TO INCLUSIVE AND EQUITABLE TRADE Investment provisions in PTAs and how they contribute to inclusive trade Susan F. Stone Director, Trade, Investment
2013 Global Survey of Accounting Assumptions. for Defined Benefit Plans. Executive Summary
 2013 Global Survey of Accounting Assumptions for Defined Benefit Plans Executive Summary Executive Summary In broad terms, accounting standards aim to enable employers to approximate the cost of an employee
Others b Unemployed Unemployment rate percent
 POPULATION Total population thousand; as of 1 March 213.2 223.3 230.8 238.4 240.0 244.8 250.0 255.5 261.0 266.0 270.1 276.0 280.6 285.1 289.5 293.7 299.0 304.9 * 309.6 * Population density persons per
Exports to major trading partners and duties faced
 Malawi Part A.1 Tariffs and imports: Summary and duty ranges Summary Total Ag Non-Ag WTO member since 1995 Simple average final bound 75.9 121.3 42.4 Binding coverage: Total 31.2 Simple average MFN applied
An Overview of World Goods and Services Trade
 Appendix IV An Overview of World Goods and Services Trade An overview of the size and composition of U.S. and world trade is useful to provide perspective for the large U.S. trade and current account deficits
MDG 8: Develop a Global Partnership for Development
 124 Key Indicators for Asia and the Pacific 2014 MDG 8: Develop a Global Partnership for Development Millennium Development Goal (MDG) 8 has six targets. The first three are the focus of this section.
Foreign Investment Statistics
 2012-2013 Released Date: May 2015 Table of Contents Introduction....4 Key Points......5 Total Stock of Foreign Investment (FI) by Economic Activity....6 Foreign Direct Investment (FDI) by Economic Activity.......8
GLOBAL FDI OUTFLOWS CONTINUED TO RISE IN 2011 DESPITE ECONOMIC UNCERTAINTIES; HOWEVER PROSPECTS REMAIN GUARDED HIGHLIGHTS
 GLOBAL FDI OUTFLOWS CONTINUED TO RISE IN 211 DESPITE ECONOMIC UNCERTAINTIES; HOWEVER PROSPECTS REMAIN GUARDED No. 9 12 April 212 ADVANCE UNEDITED COPY HIGHLIGHTS Global foreign direct investment (FDI)
Progress towards Strong, Sustainable and Balanced Growth. Figure 1: Recovery from Financial Crisis (100 = First Quarter of Real GDP Contraction)
") Progress towards Strong, Sustainable and Balanced Growth Figure 1: Recovery from Financial Crisis (100 = First Quarter of Real GDP Contraction) Source: OECD May 2014 Forecast, Haver Analytics, Rogoff and
Progress towards Strong, Sustainable and Balanced Growth Figure 1: Recovery from Financial Crisis (100 = First Quarter of Real GDP Contraction) Source: OECD May 2014 Forecast, Haver Analytics, Rogoff and
A. Definitions and sources of data
 Poland A. Definitions and sources of data Data on foreign direct investment (FDI) in Poland are reported by the National Bank of Poland (NBP), the Polish Agency for Foreign Investment (PAIZ) and the Central
Actuarial Supply & Demand. By i.e. muhanna. i.e. muhanna Page 1 of
 By i.e. muhanna i.e. muhanna Page 1 of 8 040506 Additional Perspectives Measuring actuarial supply and demand in terms of GDP is indeed a valid basis for setting the actuarial density of a country and
The G20 Mexico Summit 2012 Key Issues for Asia-Pacific
 The G20 Mexico Summit 2012 Key Issues for Asia-Pacific Third ESCAP High-Level Consultation Bangkok, 23 May 2012 Dr. Nagesh Kumar Chief Economist, UN-ESCAP And Director, ESCAP SRO-SSWA 1 Outline Reviving
Fourteenth Report on G20 Investment Measures 1
 30 October 2015 Fourteenth Report on G20 Measures 1 As the global financial crisis broke seven years ago, G20 Leaders committed to resisting protectionism in all its forms at their 2008 Summit in Washington.
I. ECONOMIC ENVIRONMENT (1) MAJOR FEATURES OF THE ECONOMY
 MAJOR FEATURES OF THE ECONOMY") Oman WT/TPR/S/201 Page 1 I. ECONOMIC ENVIRONMENT (1) MAJOR FEATURES OF THE ECONOMY 1. The Sultanate of Oman borders Saudi Arabia to the west, the United Arab Emirates (UAE) to the north west, and Yemen
Oman WT/TPR/S/201 Page 1 I. ECONOMIC ENVIRONMENT (1) MAJOR FEATURES OF THE ECONOMY 1. The Sultanate of Oman borders Saudi Arabia to the west, the United Arab Emirates (UAE) to the north west, and Yemen
Session 6: Regionalism: reaping the opportunities and dealing with challenges
 REGIONAL WORKSHOP ON LEAST DEVELOPED COUNTRIES AND LEVERAGING TRADE AS A MEANS OF IMPLEMENTATION FOR THE 2030 AGENDA Session 6: Regionalism: reaping the opportunities and dealing with challenges 2-4 August
Recent developments in international trade and in the use of trade policy instruments
 Recent developments in international trade and in the use of trade policy instruments Short courses for Permanent Missions in Geneva Organised by the Division on Technology and Logistics Delivered by the
( ) Page: 1/43 MARKET ACCESS FOR PRODUCTS AND SERVICES OF EXPORT INTEREST TO LEAST DEVELOPED COUNTRIES NOTE BY THE SECRETARIAT 1
 Page: 1/43 MARKET ACCESS FOR PRODUCTS AND SERVICES OF EXPORT INTEREST TO LEAST DEVELOPED COUNTRIES NOTE BY THE SECRETARIAT 1") 19 September 2017 (17-4947) Page: 1/43 Sub-Committee on Least Developed Countries MARKET ACCESS FOR PRODUCTS AND SERVICES OF EXPORT INTEREST TO LEAST DEVELOPED COUNTRIES NOTE BY THE SECRETARIAT 1 Contents
19 September 2017 (17-4947) Page: 1/43 Sub-Committee on Least Developed Countries MARKET ACCESS FOR PRODUCTS AND SERVICES OF EXPORT INTEREST TO LEAST DEVELOPED COUNTRIES NOTE BY THE SECRETARIAT 1 Contents
( ) Page: 1/60 FACTUAL PRESENTATION FREE TRADE AGREEMENT BETWEEN THE ASSOCIATION OF SOUTHEAST ASIAN NATIONS (ASEAN) AND INDIA (GOODS)
 Page: 1/60 FACTUAL PRESENTATION FREE TRADE AGREEMENT BETWEEN THE ASSOCIATION OF SOUTHEAST ASIAN NATIONS (ASEAN) AND INDIA (GOODS)") WT/COTD/RTA/8/1 14 December 216 (16-6789) Page: 1/6 Committee on Trade and Development Dedicated Session on Regional Trade Agreements FACTUAL PRESENTATION FREE TRADE AGREEENT BETWEEN THE ASSOCIATION OF
WT/COTD/RTA/8/1 14 December 216 (16-6789) Page: 1/6 Committee on Trade and Development Dedicated Session on Regional Trade Agreements FACTUAL PRESENTATION FREE TRADE AGREEENT BETWEEN THE ASSOCIATION OF
No October 2013
 DEVELOPING AND TRANSITION ECONOMIES ABSORBED MORE THAN 60 PER CENT OF GLOBAL FDI INFLOWS A RECORD SHARE IN THE FIRST HALF OF 2013 EMBARGO The content of this Monitor must not be quoted or summarized in
Empirical Trade Analysis 1-1
 Empirical Trade Analysis?? 1-1 Dierk Herzer?? 1-2 Introduction This course examines empirical research methods on topics related to international trade and investment. We review the empirics of international
BY THE BLESSINGS OF THE ALMIGHTY GOD MINISTER OF FINANCE OF THE REPUBLIC OF INDONESIA,
 REGULATION OF THE MINISTER OF FINANCE OF THE REPUBLIC OF INDONESIA NUMBER 157/PMK.010/2015 ON IMPLEMENTATION OF INCOME TAX TREATMENT UNDER PROVISIONS OF TREATIES BY THE BLESSINGS OF THE ALMIGHTY GOD MINISTER
EXPLORING GROWTH OF TAKAFUL MARKET IN PAKISTAN. Muhammad Kashif Siddiqee, ACA Joint Director - SECP
 EXPLORING GROWTH OF TAKAFUL MARKET IN PAKISTAN Muhammad Kashif Siddiqee, ACA Joint Director - SECP 1 2 THE NEED FOR INSURANCE All humans and/or Organizations inevitably are exposed to various types of
Appendix A Gravity Model Assessment of the Impact of WTO Accession on Russian Trade
 Appendix A Gravity Model Assessment of the Impact of WTO Accession on Russian Trade To assess the quantitative impact of WTO accession on Russian trade, we draw on estimates for merchandise trade between
Opportunities For Growth In New Markets
 Page 1 / 22 Opportunities For Growth In New Markets Redefining Emerging Markets by Introduction of Iran March 2017 Page 2 / 22 CONTENTS What Makes us the Next BRICS Growth Sectors and Opportunities Page
Economy Report - China
 2005/FTA-RTA/WKSP/020 Economy Report - China Submitted by: Ms. Zhao Jie & Mr. Han Yi, China Workshop on Identifying and Addressing Possible Impacts of RTAs/FTAs Development on APEC Developing Member Economies
Qatar WORLD TARIFF PROFILES 2008 COUNTRY PAGES. Qatar. Tariffs and imports: Summary and duty ranges Summary
 Qatar Qatar Part A.1 Tariffs and imports: Summary and duty ranges Summary Total Ag Non-Ag WTO member since 1996 Simple average final bound 16.0 25.7 14.5 Binding coverage: Total 100 Simple average MFN
Reviewing the Importance. for Indonesia
 Review of Indonesian Economic Policies Reviewing the Importance of Free Trade Agreements for Indonesia Yose Rizal Damuri This policy brief is the result of an activity entitled Economic Policymaking in