The operating profit, excluding the revaluation of process inventory totalled SEK 1,257 m (374).
|
|
|
- Marian Sharp
- 5 years ago
- Views:
Transcription
. The free cash flow was SEK 1,557 m (920).")

1 The operating profit, excluding the revaluation of process inventory totalled SEK 1,257 m (374). The free cash flow was SEK 1,557 m (920). Improved market terms had a positive impact on the profit. Mines production was high, despite disruptions to production at Aitik. Maintenance shutdowns by Smelters completed according to plan.
2 Second quarter revenues totalled SEK 10,373 m (9,438). The increase was due to improved market terms and an increase in deliveries. The operating profit, excluding revaluation of process inventory, totalled SEK 1,257 m (374), corresponding to a substantial year on year improvement and to an increase of SEK 155 m in comparison with the previous quarter. Robust production by Mines, coupled with a strong performance by Smelters that was partly due to improvements in treatment charge terms, had a positive impact on the second quarter profit. Improvements in market terms also helped boost the profit. Planned maintenance shutdowns in Smelters impacted the profit to the tune of SEK -180 m (-120) and resulted both in a reduction in smelter production and increased costs. The increase in depreciation was due to a higher percentage of Aitik s production occurring in capital-intensive areas. The ramping up of production at Garpenberg and the acquisition of Kylylahti also contributed to the year on year increase in depreciation. The profit after financial items was SEK 1,028 m (385) and the net profit was SEK 810 m (296), corresponding to earnings per share of SEK 2.96 (1.08). The return on capital employed for the last 12 months totalled 12%.
3 The increase in free cash flow in comparison with the previous quarter was due to an increase in profit and a decrease in working capital tied up, primarily in the form of lower stock levels. Net financial items during the quarter totalled SEK -62 m (-93). The average interest level of loans was 1.5% (1.8). Boliden s net debt at the end of the quarter was SEK 7,022 m (8,863) and the net debt/equity ratio was 28% (39). The net debt was affected not only by the positive free cash flow and the reduction in Tara s pension liability, but also by the dividend of SEK 615 m (479) paid. The average term of total approved loan facilities at the period end was 2.9 years (3.9), and the average fixed interest term of utilised loans was 0.6 years (0.7). Boliden s current liquidity, in the form of liquid assets and unutilised binding credit facilities with a term of more than one year, totalled SEK 5,684 m (4,601) at the end of the second quarter. As previously announced during the quarter, the Junta de Andalucía (the local government in Andalucía) has sued Boliden s Spanish subsidiary, Apirsa S.L. (Apirsa), jointly and severally with its direct and indirect owners, Boliden BV and Boliden AB, for approximately EUR 89 m. The suit is in respect of and constitutes a continuation of the same claims as those submitted in the legal proceedings initiated by the Junta de Andalucía back in 2002 as part of the legal aftermath of the Los Frailes dam breach accident in Spain in The claim concerns the costs that the Junta de Andalucía alleges it incurred on Apirsa s behalf in conjunction with the clean-up after the dam breach. Apirsa, which was the owner and operator of the mine at the time of the accident, entered into insolvency proceedings back in Summonses have been served on Apirsa and, more recently, on Boliden AB, and Boliden BV is also expected to be served shortly. Apirsa and Boliden AB have contested the claims in their statements of defence, as will Boliden BV. Boliden is of the opinion that it will not suffer any significant financial harm as a result of the claims against the companies. For additional background on the matter, please see Boliden s Annual Reports (including Note 30 of the 2014 Annual Report) and Boliden s website,
4 The average price of zinc in USD was 6% higher than last year and 5% higher than the first quarter. The increases in SEK were 35% and 6%, respectively. Global metal demand increased, year on year, by just under 1%. Zinc continued to outperform other base metals in terms of price due, amongst other things, to the expectation that several existing mines will close and few new ones will open. Metal premiums were stable. Global smelter production increased by just over 6%, year on year, and slightly exceeded demand. Downturns in Europe, North America and China notwithstanding, global mined production increased by just under 5% during the quarter due to increased production in South America and a strong recovery in Indian production. Production of mined concentrate was on a par with demand by smelters. Spot market treatment charges remained unchanged at a level below that in the benchmark contracts. Contract treatment charges rose slightly from first quarter levels due to higher zinc prices. The average price of copper in USD fell by 11%, year on year, but was 4% higher than during the first quarter. The increases in SEK were 14% and 5%, respectively. Demand for copper increased by just under 2%, year on year. Copper is vulnerable to pricing pressure due to the opening of a number of large mines in recent years. Spot premiums remained on a par with those in the first quarter. Global smelter production continued to increase and was on a par with demand for copper. Disruptions to production at copper mines have put the brake on mined production in both 2014 as well as the first six months of 2015, and the anticipated increase in supply has consequently not materialised. The disruptions have continued into the second quarter of the year. Treatment charges were high, and in the run up to 2015, treatment charges in several benchmark contracts were raised to USD 107 (92) per tonne of concentrate in the expectation of an increase in mined concentrate supplies. Disruptions to production at mines, coupled with strong demand for concentrate from smelters in China, resulted in a certain amount of pressure on spot market treatment charges. 1 Data in the Market performance section was supplied by CRU Ltd in June/July 2015.
5 The average price of lead in USD fell by 7%, year on year, but rose by 8% in comparison with the first quarter. The price of lead in SEK rose by 18% and 9%, respectively. The growth in both demand for and production of lead was low in comparison with the previous year, and there was a balance between supply and demand. Mined production increased globally by 3%, year on year, and was on a par with the demand from smelters. The smelting and mining industries have agreed on smelting terms on a par with those of last year. The average price of gold and silver in USD were 7% and 16% lower, respectively, than during the second quarter of last year. The corresponding figures in SEK, however, were 18% and 7% higher, respectively. Gold and silver prices fell by 2% in USD and by 1% in SEK in comparison with the first quarter. Global supply of and demand for sulphuric acid were balanced. Demand continued to be healthy in Europe and prices remained unchanged from the first quarter.


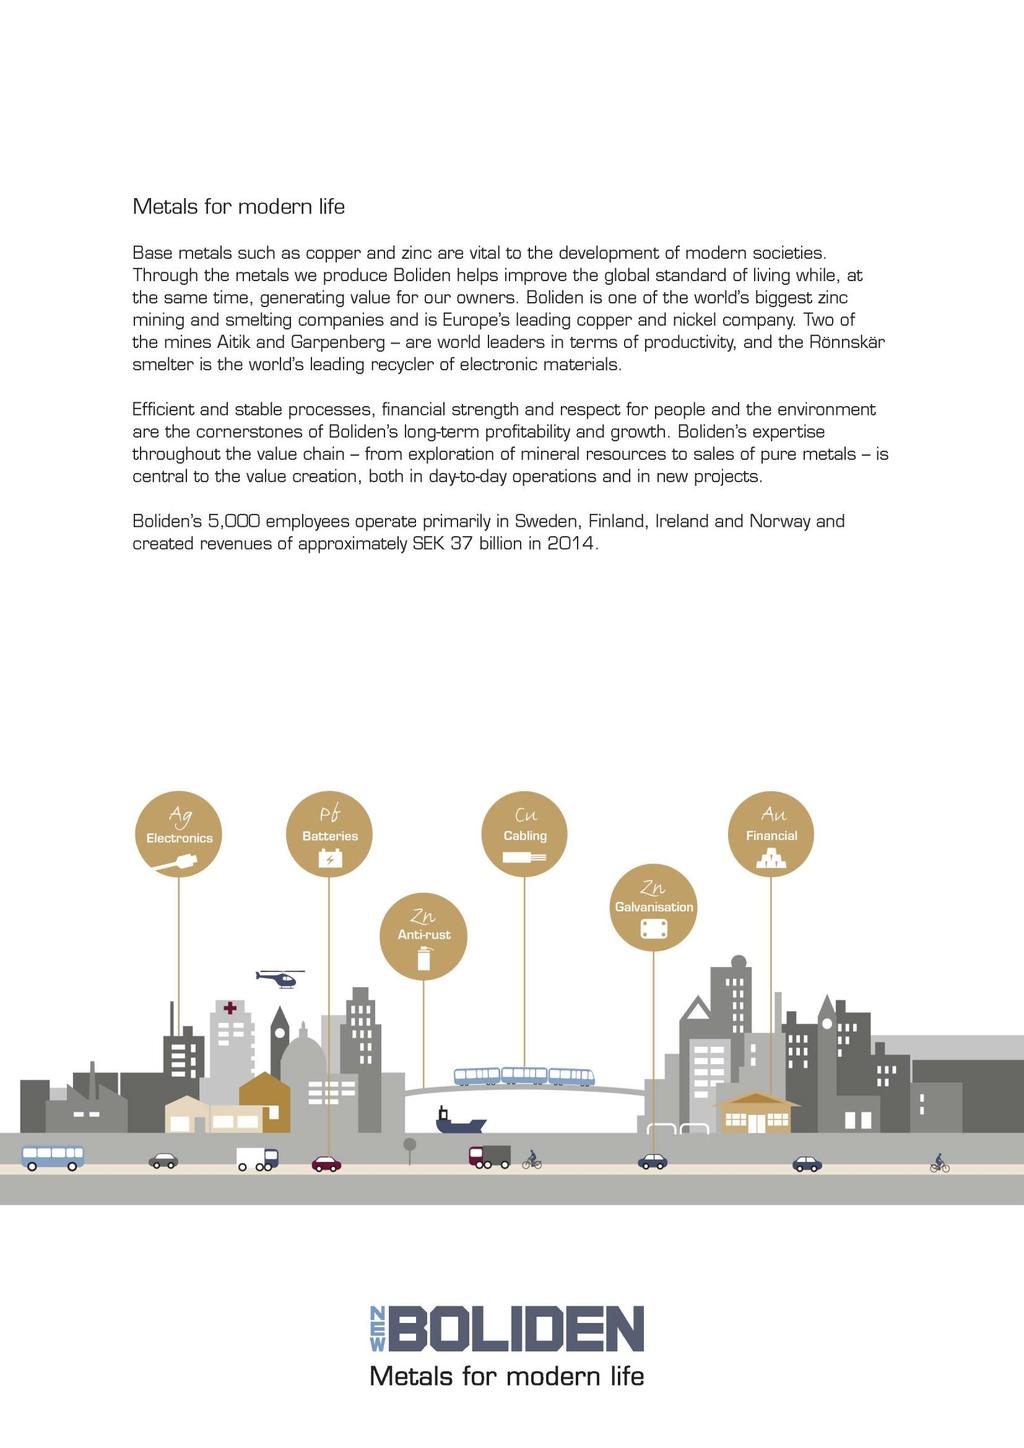
6 Boliden s Business Area Mines comprise five mining areas: Aitik, Boliden, Garpenberg, Kylylahti and Tara. The Business Area also includes exploration, technological development, environmental technology and mined concentrate sales. The majority of Mines sales are made to the Group s smelters on market terms. High production levels for metals in concentrate during the quarter, despite disruptions to production at Aitik. Improvements in market terms helped double the year on year operating profit. Good cost control. The doubling of the operating profit, year on year, was due to increased production of all metals in concentrate and to improvements in market terms. The increase in production at Garpenberg and the acquisition of Kylylahti also resulted in increases in both costs and depreciation. Higher treatment charges had a negative effect on the profit. Business Area Mines posted a substantial improvement in the operating profit in comparison with the previous quarter, primarily due to increased production of zinc, copper and silver in concentrate. Costs fell at the same time as exploration activities increased. The increase in depreciation was attributable to the fact that a higher percentage of Aitik s production occurred in capital-intensive areas. Improvements in metal prices were unable to compensate in full for a weaker USD and higher treatment charges.

7 Ore mixes with a high sulphur content and high oxide levels caused process disruptions in the concentrator at Aitik, which had a negative effect on milled tonnage volume and recovery levels. The milled tonnage volume was 9.5 Mtonnes. Copper recovery levels were on par with those in the previous quarter but were down on the previous year. The plans for 2015 and 2016 include continued production in areas where grades are slightly below the average for the mineral reserve as a whole. The milled tonnage volume for 2015 is expected to total 39 Mtonnes. The expansion project which will increase production to 45 Mtonnes/year in 2017 is proceeding according to plan. Milled tonnage volume increased in the Boliden Area, primarily due to a change in the ore mix that resulted in a greater quantity of easily milled ore being processed. The trend towards an increase in the production of zinc in concentrate and a lower percentage of copper in concentrate continued. The ramping up of production at Garpenberg continued according to plan and the milled tonnage volume increased during the quarter to 598 ktonnes, corresponding to an annual production rate of just under 2.4 Mtonnes. A higher milled tonnage volume was, however, unable to compensate for lower zinc grades, and production of zinc in concentrate consequently fell in comparison with the previous quarter. Production of silver in concentrate increased, however, due both to higher silver grades and to an increase in milled tonnage volume. The annual production rate is expected to total 2.5 Mtonnes by the end of 2015 for both milled tonnage volume and ore production. Kylylahti increased its production of all metals in concentrate in comparison with the previous quarter, due to higher milled tonnage volume, higher grades, and improved recovery levels. Production at Tara continued to be negatively affected by the changeover to deeper parts of the mine and by previous quarters delays in development work. Higher grade resulted in an increase in the production of zinc in concentrate in comparison with the previous quarter, while milled tonnage volume remained on par with the previous quarter.


8 Boliden s Business Area Smelters comprises the Kokkola and Odda zinc smelters, the Rönnskär and Harjavalta copper smelters, and the Bergsöe lead smelter. The Business Area also includes the recycling of metals from electronic scrap, etc., purchases of mined concentrate, and the sales of metals and by-products. Strong profits, despite large planned maintenance shutdowns. Improved prices and terms had a positive effect on the profits. Silver production levels at Kokkola s new silver extraction facility are close to plan. Business Area Smelters operating profit excluding revaluation of process inventory, more than trebled, year on year, but was lower than in the preceding quarter. This substantial year on year increase in profits was primarily due to a strong USD, improvements in treatment charge terms, and higher metal premiums. Maintenance shutdowns were carried out during the quarter and the effect on the profit totalled SEK -180 m (-120). The shutdowns, which were more comprehensive than those carried out last year, resulted in costs increasing. The positive volume effect was due to improved production at Odda. The reduction in the profit from the previous quarter was mainly due to the maintenance shutdowns carried out, resulting in increased costs and lower production at the copper smelters. The positive volume effect was due to improved silver production at Kokkola and to increased production at Odda. In addition, the profit was positively affected by higher metal prices that also yielded improved zinc treatment charges.


9 Rönnskär carried out planned maintenance shutdown and both feed as well as copper and precious metal production levels consequently fell. Improved raw material mix management enabled higher levels of electronic scrap recycling. The work on Rönnskär s action plan is proceeding according to plan. For further information, see the presentation material for the 2014 Capital Market Day. Harjavalta s copper process was stable, but the planned maintenance shutdown was more comprehensive than that carried out last year and resulted in reductions in both feed and production levels. The change in strategy for Harjavalta s nickel operations was implemented at the end of the second quarter, and as of the third quarter, the business will be on own books and not, as before, on a tolling basis. A planned maintenance shutdown was carried out at Kokkola, resulting in a fall in feed levels. Intermediate stocks were, however, built up ahead of the maintenance shutdown, and zinc production was consequently not affected to any significant degree by the shutdown. Production of and recovery level for silver at the new facility improved, and are now approaching planned levels. Process adjustments during the quarter improved the zinc recovery level from that of the previous quarter, and work continues with the aim of getting fully to grips with the process disruptions. Odda s feed and zinc production levels were high and stable. The expansion project that will increase production to 200 ktonnes/year is proceeding according to plan. Bergsöe s feed and lead alloy production levels were high and stable. The effect on the operating profit of maintenance shutdowns during the quarter was SEK -180 m (-120). Maintenance shutdowns will be carried out at Rönnskär and Bergsöe during the third quarter, while at Odda, they will be carried out during both the third and fourth quarters. The effect on the operating profit is estimated at SEK -80 m in the third quarter and SEK -30 m in the fourth quarter.
10 Sales for the first six months of the year totalled SEK 20,779 m (17,989), with the increase primarily due to an improvement in market terms. The operating profit, excluding revaluation of process inventory, totalled SEK 2,359 m (760). Increases in production by Mines, a stronger USD, improved treatment charge terms, and higher metal premiums accounted for the majority of the improvement in the operating profit. The increases in costs and depreciation were primarily due to the acquisition of Kylylahti and the start-up of the new facility at Garpenberg. Depreciation also increased due to the fact that a higher percentage of Aitik s production took place in capital-intensive areas. Planned maintenance shutdown impacted the profit to the tune of SEK -180 m (-120). Net financial items totalled SEK -121 m (-148) and the net profit was SEK 1,705 m (449). Earnings per share totalled SEK 6.23 (1.64). Investments during the first six months of the year totalled SEK 1,583 m (1,774).
11 Boliden works actively to be an industry leader in terms of environmental performance, efficiency, and responsibility. Seven Group-wide goals have been defined in order to steer the development within the field of sustainability. The results of Boliden s sustainability work during the second quarter of 2015 were characterised by: A continued high sick leave rate. A high accident frequency. Carbon dioxide intensity decreased. Boliden s responsibility being recognised by the FTSE4Good Index Series. ₂ The average number of Boliden employees (full-time equivalents) during the first six months of the year was 5,119 (5,033), of whom 3,119 (3,110) were employed in Sweden, 1,069 (974) in Finland, 600 (636) in Ireland, 311 (294) in Norway and 20 (19) in other countries. The increase in the number of employees is due to acquisitions and expansions. The sick leave rate at Boliden has increased in recent years. Boliden is working actively with rehabilitation and alternative employment programmes in order to reduce both short- and long-term sick leave rates. The accident frequency rate (the number of accidents per one million hours worked) continued high. A broad programme of behaviour-based safety work was launched during the quarter for operators and Boliden s 100 most senior managers. The safety work with contractors has been reinforced by means of training activities and improved contractual clarity. Boliden s operations at all of its facilities are subject to licensing requirements and are conducted in accordance with the applicable legislation in the various countries in which they operate. Emissions and discharges of metals to air and water have fallen during the second quarter from elevated levels in the autumn and winter as a result both of the smelters rectifying previous treatment problems (air) and of natural seasonal variations (water). Boliden works with systematic reviews of its energy consumption and other sources of carbon dioxide emissions in order to identify potential improvements and areas where efficiency could be improved. Boliden s work in this area focuses primarily on direct emissions from fuel and processes. The reduction in carbon dioxide intensity during the quarter was caused by a change in the mix primarily due to the increase in production at Garpenberg. ₂ The Boliden Area exceeded the threshold limits for arsenic, zinc and copper in outflow water from the Maurliden mine in April and May. Measures have been implemented to prevent any further exceeding of these limits. The environmental impact is adjudged to have been low.
12 The Parent Company, Boliden AB, conducts no operations and has no employees. The Income Statements and Balance Sheets for the Parent Company are presented on page 19. The Group s and the Parent Company s significant risks and uncertainty factors include market and external risks, financial risks, operational and commercial risks, and legal risks. The global economic climate in general, and global industrial production in particular, affect the demand for zinc, copper and other base metals. For further information on risks and risk management, please see Risk Management on pages of Boliden s Annual Report for The Company is of the opinion that no changes have occurred in this respect. The Consolidated Accounts have been prepared in accordance with the International Financial Reporting Standards (IFRS) approved by the EU, and with the Swedish Financial Reporting Board recommendation, RFR1, complementary accounting rules for Groups, which specifies the supplementary information required in addition to IFRS standards, pursuant to the provisions of the Swedish Annual Accounts Act. This Interim Report has been prepared for the Group in accordance with IAS 34, Interim Financial Reporting, and in accordance with the Swedish Annual Accounts Act, while the Parent Company accounts have been prepared in accordance with the Swedish Annual Accounts Act. The accounting principles and calculation methods applied and utilised have remained unchanged from those applied in the 2014 Annual Report. The undersigned declare that the Interim Report gives a true and fair overview of the Parent Company s and the Group s operations, positions and results, and describes the material risks and uncertainty factors faced by the Parent Company and the companies that make up the Group. Stockholm, 17 July 2015 Anders Ullberg Chairman of the Board Marie Berglund Member of the Board Staffan Bohman Member of the Board Tom Erixon Member of the Board Lennart Evrell Member of the Board, President & CEO Michael G:son Löw Member of the Board Elisabeth Nilsson Member of the Board Ulla Litzén Member of the Board Roland Antonsson Member of the Board, Employee Representative Marie Holmberg Member of the Board, Employee Representative Kenneth Ståhl Member of the Board, Employee Representative
13 We have reviewed the interim report for Boliden AB (publ) for the period January 1 - June 30, The Board of Directors and the President are responsible for the preparation and presentation of this interim report in accordance with IAS 34 and the Annual Accounts Act. Our responsibility is to express a conclusion on this interim report based on our review. We conducted our review in accordance with the International Standard on Review Engagements ISRE 2410, Review of Interim Financial Information Performed by the Independent Auditor of the Entity. A review consists of making inquiries, primarily of persons responsible for financial and accounting matters, and applying analytical and other review procedures. A review has a different focus and is substantially less in scope than an audit conducted in accordance with ISA and other generally accepted auditing practices. The procedures performed in a review do not enable us to obtain a level of assurance that would make us aware of all significant matters that might be identified in an audit. Therefore, the conclusion expressed based on a review does not give the same level of assurance as a conclusion expressed based on an audit. Based on our review, nothing has come to our attention that causes us to believe that the interim report is not, in all material respects, prepared for the Group in accordance with IAS 34 and the Annual Accounts Act, and for the Parent Company in accordance with the Annual Accounts Act. Stockholm, 17 July 2015 Deloitte AB Jan Berntsson Authorised Public Accountant


14 23 October 2015 The Interim Report for the third quarter of February 2016 Fourth quarter and Year-end Report for 2015
15
16
17
18
19 The fair value of derivatives is based on listed bid and ask prices on the closing day and on a discounting of estimated cash flows. Market prices for metals are taken from the trading location of metal derivatives, i.e. the London Metal Exchange (LME) and the London Bullion Market Association (LBMA). Discount rates are based on current market rates per currency and time to maturity for the financial instrument. Exchange rates are obtained from the Swedish Riksbank. When presenting the fair value of liabilities to credit institutions, the fair value is calculated as discounted agreed amortisations and interest payments at estimated market interest margins. On 30 June 2015, the interest terms of current loan agreements are adjudged to be on a par with market rates in the credit markets. The fair value consequently corresponds, in every significant respect, to the reported value. The reported value of accounts receivable and accounts payable is deemed to be the same as their fair value due to the short time to maturity, the fact that provisions are made for doubtful accounts receivable, and that any penalty interest will be debited. Boliden s financial instruments holdings, which are reported at fair value in the Balance Sheet, are all classified as level 2 items in the fair value hierarchy with the exception of a small amount of level 3 holdings in other shares and participations. See also under Accounting Principles in the Annual Report.
20 The following table contains an estimate of how changes in market terms affect the Group s operating profit (EBIT) over the next twelve-month period. The calculation is based on listings on 30 June 2015 and on Boliden s planned production volumes. The sensitivity analysis does not take into account the effects of metal price hedging, currency hedging, contracted TC/RC, or the revaluation of process inventory in the smelters. Boliden has historically had a natural hedge as a result of the negative correlation that has existed between currency on the one hand and prices and treatment charges on the other. This is illustrated in the following graphs which shows Boliden s total weighted price index together with a weighted currency index and a weighted metal price and TC index.
21 The following tables show Boliden s outstanding price and currency hedging contracts on 30 June The Boliden Group s production is otherwise fully exposed to market prices
22
23 ⁴ ⁴
24
25
26
27
28
The free cash flow was SEK -4,794 m (1,557). The cash flow includes the consideration for Kevitsa, which totalled just under SEK 6 billion.
. The cash flow includes the consideration for Kevitsa, which totalled just under SEK 6 billion.") The operating profit, excluding the revaluation of process inventory, fell to SEK 901 m (1,257), largely due to lower metal prices. The profit includes items affecting comparability and provisions for
The operating profit, excluding the revaluation of process inventory, fell to SEK 901 m (1,257), largely due to lower metal prices. The profit includes items affecting comparability and provisions for
The operating profit, excluding the revaluation of process inventory, totalled SEK 1,134 million (SEK 548 m).
.") The operating profit, excluding the revaluation of process inventory, totalled SEK 1,134 million (SEK 548 m). Record production levels at Harjavalta and Odda in 2014. Stronger USD compensated for lower
The operating profit, excluding the revaluation of process inventory, totalled SEK 1,134 million (SEK 548 m). Record production levels at Harjavalta and Odda in 2014. Stronger USD compensated for lower
The operating profit, excluding revaluation of process inventory, was SEK 2,020 m (1,744). High production levels at Aitik and Garpenberg.
. High production levels at Aitik and Garpenberg.") The operating profit, excluding revaluation of process inventory, was SEK 2,020 m (1,744). The free cash flow totalled SEK 822 m (1,715). High production levels at Aitik and Garpenberg. Smelters production
The operating profit, excluding revaluation of process inventory, was SEK 2,020 m (1,744). The free cash flow totalled SEK 822 m (1,715). High production levels at Aitik and Garpenberg. Smelters production
The free cash flow was negatively affected by high stock levels, and totalled SEK 91 m (953).
.") The operating profit, excluding revaluation of process inventory, increased to SEK 1,318 m (1,055). Improved metal prices had a positive effect on the profit. The free cash flow was negatively affected
The operating profit, excluding revaluation of process inventory, increased to SEK 1,318 m (1,055). Improved metal prices had a positive effect on the profit. The free cash flow was negatively affected
The operating profit, excluding the revaluation of process inventory, totalled SEK 711 million (SEK 603 m).
.") The operating profit, excluding the revaluation of process inventory, totalled SEK 711 million (SEK 603 m). Improvements in zinc prices and a weaker SEK had a positive impact on the profit. Copper concentrate
The operating profit, excluding the revaluation of process inventory, totalled SEK 711 million (SEK 603 m). Improvements in zinc prices and a weaker SEK had a positive impact on the profit. Copper concentrate
The operating profit, excluding revaluation of process inventory, totalled SEK 2,001 m (2,912). Stable production by Smelters.
. Stable production by Smelters.") The operating profit, excluding revaluation of process inventory, totalled SEK 2,001 m (2,912). The free cash flow totalled SEK 1,721 m (2,382). Stable production by Smelters. Stable mined production,
The operating profit, excluding revaluation of process inventory, totalled SEK 2,001 m (2,912). The free cash flow totalled SEK 1,721 m (2,382). Stable production by Smelters. Stable mined production,
The free cash flow totalled SEK 1,692 m (36). The operating profit, excluding revaluation of process inventory, increased to SEK 2,106 m (596).
. The operating profit, excluding revaluation of process inventory, increased to SEK 2,106 m (596).") The operating profit, excluding revaluation of process inventory, increased to SEK 2,106 m (596). Improved market terms and high production levels had a positive effect on the profit. The free cash flow
The operating profit, excluding revaluation of process inventory, increased to SEK 2,106 m (596). Improved market terms and high production levels had a positive effect on the profit. The free cash flow
High metal grades and increased smelter production
 26-10-2009 Interim Report Boliden AB (publ) Box 44, 101 20 Stockholm, Sweden Tel +46 8 610 15 00, Fax +46 8 31 55 45 www.boliden.com Corp. ID no. 556051-4142 Interim Report, January September 2009 High
Interim Report. Interim Report January June 2010 Increased mine production but higher costs Q2 2010
 19-07-2010 Interim Report Boliden AB (publ) Box 44, 101 20 Stockholm, Sweden Tel +46 8 610 15 00, Fax +46 8 31 55 45 www.boliden.com Corp. ID no. 556051-4142 Interim Report January June 2010 Increased
Full year Report. January December Lennart Evrell. Johan Fant. Bildplatshållare. President & CEO CFO
 Full year Report January December 2008 Bildplatshållare Lennart Evrell President & CEO Johan Fant CFO 1 2009-02-13 Fourth Quarter 2008 Market Lower demand for base metals Negative growth in mature regions
Currency conversion for comparison purposes only. An average rate of has been used for conversions to EUR. 2)
") 5 August 2004 Interim Report Boliden AB (publ) Investor Relations Box 44, S-101 20 Stockholm, Sweden Tel +46 8 610 15 00, Fax +46 8 31 55 45 www.boliden.se Reg. No 556051-4142 Interim Report, 1 st January
5 August 2004 Interim Report Boliden AB (publ) Investor Relations Box 44, S-101 20 Stockholm, Sweden Tel +46 8 610 15 00, Fax +46 8 31 55 45 www.boliden.se Reg. No 556051-4142 Interim Report, 1 st January
Interim report Q2 2014
 Interim report Q2 214 Lennart Evrell President & CEO Mikael Staffas CFO Summary Q2 214 Revenues 9 438 (8 35) MSEK EBIT ex PIR* 374 (37) MSEK EBIT 478 (-59) MSEK Free Cash Flow 92 (-1 477) MSEK MSEK 1 8
Interim Report January September 2011
 Interim Report January September 2 Lennart Evrell President & CEO Mikael Staffas CFO Summary Market Financial turmoil - low visibility Price drop end of period Low growth in construction and automotive
Interim Report January June 2010
 Interim Report January June 21 Lennart Evrell President & CEO Johan Fant CFO Second quarter 21 The Market Concerns over China price volatility Improving demand Metal prices down gold, silver up Tight concentrate
Interim report January June 2012
 Interim report January June 212 Lennart Evrell President & CEO Mikael Staffas CFO Q2 Summary Revenues 1,363 (9,896) MSEK EBIT excl. PIR* 931 (1,12) MSEK Operating profit MSEK 769 (1,134) Free Cash Flow
Boliden. Interim Report January - June Mines Smelters Zinc Copper. Boliden AB
 Boliden Interim Report January - June 2005 Mines Smelters Zinc Copper Boliden AB 1 Boliden AB 2 Continued strong growth in China lower growth rate in the rest of the world Global Q2 2005* - Cu-consumption
Interim report January March 2013
 Interim report January March 213 Lennart Evrell President & CEO Mikael Staffas CFO Summary Revenues 9,249 (1,321) MSEK EBIT ex PIR* 751 (1,258) MSEK EBIT 695 (1 54) MSEK Free Cash Flow -22 (888) MSEK Msek
Currency conversion for comparison purposes only. An average rate of has been used for conversions to EUR. 2)
") Interim Report Boliden AB (publ) Investor Relations Box 44, SE-101 20 Stockholm, Sweden Tel.: +46 8 610 15 00, Fax: +46 8 31 55 45 www.boliden.se Co. reg. no. 556051-4142 Interim Report, 1 st January 30
Interim Report Boliden AB (publ) Investor Relations Box 44, SE-101 20 Stockholm, Sweden Tel.: +46 8 610 15 00, Fax: +46 8 31 55 45 www.boliden.se Co. reg. no. 556051-4142 Interim Report, 1 st January 30
METALS FOR LONG-TERM VALUE CREATION
 METALS FOR LONG-TERM VALUE CREATION 217 ANNUAL REPORT THE YEAR IN BRIEF The year in brief Contents Highlights Introduction The year in brief B President s statement 2 Metals in society 4 About Boliden
METALS FOR A SUSTAINABLE SOCIETY
 METALS FOR A SUSTAINABLE SOCIETY Te Cu Zn Ag 218 Annual and Sustainability Report THE YEAR IN BRIEF The year in brief Contents Introduction The year in brief B President s statement 2 Metals in society
86 Boliden s Board of Directors 88 Boliden s Group Management
 Annual Report, 2008 2 This is Boliden 4 The President s Statement 6 Business Concept and Business Model 7 Goals and Goal Fulfilment 8 Strategies 9 Sustainable Development 11 Metal Markets and the Outside
Boliden. Full Year Report Mines Smelters Zinc Copper. Boliden AB 1 February 9, 2005
 Boliden AB 1 Boliden Full Year Report 2004 Mines Smelters Zinc Copper Boliden AB 2 Strong global financial recovery Growth 2004 Global - Cu consumption 7 % - Cu production 6 % - Zn consumption 7 % - Zn
Economic standard disclosures (GRI 200)
") standard disclosures (GRI 2) The locations of Boliden s operations are determined by the localisation of mineral resources and the ability to explore and expand operations in connection with them. Good
standard disclosures (GRI 2) The locations of Boliden s operations are determined by the localisation of mineral resources and the ability to explore and expand operations in connection with them. Good
BOLIDEN LIMITED REPORTS SECOND QUARTER 2001 RESULTS AND RECENT CORPORATE DEVELOPMENTS (All dollar amounts are in United States dollars)
") BOLIDEN LIMITED REPORTS SECOND QUARTER 2001 RESULTS AND RECENT CORPORATE DEVELOPMENTS (All dollar amounts are in United States dollars) Overview Improved year over year operating results Prospectus filed
BOLIDEN LIMITED REPORTS SECOND QUARTER 2001 RESULTS AND RECENT CORPORATE DEVELOPMENTS (All dollar amounts are in United States dollars) Overview Improved year over year operating results Prospectus filed
Boliden. Interim Report January - March Mines Smelters Zinc Copper. Boliden AB 1 May 4, 2006
 Boliden AB 1 Boliden Interim Report January - March 2006 Mines Smelters Zinc Copper Boliden AB 2 Continued strong growth in China lower growth rate in the rest of the world Global 2006 Q1* - Cu-consumption
BOLIDEN LIMITED REPORTS THIRD QUARTER 2001 RESULTS AND RECENT CORPORATE DEVELOPMENTS (All dollar amounts are in United States dollars)
") BOLIDEN LIMITED REPORTS THIRD QUARTER 2001 RESULTS AND RECENT CORPORATE DEVELOPMENTS (All dollar amounts are in United States dollars) Overview Continued lower metal prices and TCs/RCs combined with the
BOLIDEN LIMITED REPORTS THIRD QUARTER 2001 RESULTS AND RECENT CORPORATE DEVELOPMENTS (All dollar amounts are in United States dollars) Overview Continued lower metal prices and TCs/RCs combined with the
ANNUAL REPORT 2014 ANNUAL REPOR T 2014
 ANNUAL REPORT 2014 Content Boliden on the map Introduction Boliden 2014 1 Metals for modern life 2 President s Statement 4 The Boliden share 6 Aitik Strategy Market and pricing trends 10 Operations Income
Interim Report for Second Quarter 2012
 Interim Report for Second Quarter Second quarter Sales amounted to EUR 263 (307) million, a decrease of 14 percent compared to the second quarter of. Operating profit (EBIT) was EUR 19 (39) million, corresponding
Zn Cu Pb Au Ag SEK 1,200 M*
 ANNUAL REPORT 21 årsredovisning 21 hållbarhetsredovisning 21 CONTENTS Boliden in Brief 2 president s Statement 4 Boliden s Business Model 6 Boliden s outside World 8 Boliden s profi le 12 Boliden s Strategic
Prudent capital managment. Mikael Staffas, CFO Capital Markets Day 2014 November 10, 2014
 Prudent capital managment Mikael Staffas, CFO Capital Markets Day 2014 November 10, 2014 91 Prudent capital management Financial targets Investments Balance sheet strength Pay-out ratio Guidance Capex
Endomines AB (Publ) (Company registration no ) Interim report 1 January - 30 June 2017
 (Company registration no ) Interim report 1 January - 30 June 2017") Endomines AB (Publ) (Company registration no. 556694-2974) Interim report 1 January - 30 June 2017 This interim report is a translation from the Swedish original which was published on 18 August 2017.
Endomines AB (Publ) (Company registration no. 556694-2974) Interim report 1 January - 30 June 2017 This interim report is a translation from the Swedish original which was published on 18 August 2017.
Interim Report for First Quarter 2015
 Interim Report for First Quarter First quarter The quarter began with weak order intake, which gradually improved. Order intake was 10 percent lower than in the strong first quarter of Sales volumes were
After the close of the quarter The Board of Directors appointed Göran Bille as Acting President & Chief Executive Officer.
 ...Sales for the quarter started cautiously but gradually increased. Attractive campaigns and an efficient supply chain have contributed to fewer clearance sales and a sound gross margin... Read the full
NEWS RELEASE LUNDIN MINING THIRD QUARTER RESULTS
 Corporate Office 150 King Street West, Suite 1500 P.O. Box 38 Toronto, ON M5H 1J9 Phone: +1 416 342 5560 Fax: +1 416 348 0303 UK Office Hayworthe House, Market Place Haywards Heath, West Sussex RH16 1DB
Computers, mobile phones, cars, buildings, bridges. Metals form an important part of many of the things that we regard as necessary to make modern
 Annual Report 2004 Computers, mobile phones, cars, buildings, bridges. Metals form an important part of many of the things that we regard as necessary to make modern life work. Boliden s task is to meet
NEWS RELEASE Lundin Mining Second Quarter Results
 Corporate Office 150 King Street West, Suite 2200 P.O. Box 38 Toronto, ON M5H 1J9 Phone: +1 416 342 5560 Fax: +1 416 348 0303 NEWS RELEASE Lundin Mining Second Quarter Results Toronto, July 25, 2018 (TSX:
Shareholders who wish to participate in the Annual General Meeting
 Press Release 6/2019 Stockholm 27 March 2019 Annual General Meeting of Boliden AB (publ) The shareholders of Boliden AB (publ) (company registration number 556051-4142) are summoned to the Annual General
Interim Report Jan- Sept 2018
 Interim Report Jan- Sept JULY SEPTEMBER > Net sales increased 23 per cent to SEK 420.1 million (342.7). In USD, net sales increased 12 per cent. > Order intake increased 21 per cent to SEK 411.2 million
Scania Interim Report January June 2007
 26 July Scania Interim Report January June Scania reports strong volume and revenue growth Order bookings continue to be strong, up 39 percent in the first six months Sharp increase in earnings, operating
Lindab International AB (publ) Interim Report
 Interim Report") Lindab Interim Report January-September Lindab International AB (publ) Interim Report Third quarter Net sales increased by 2 percent to SEK 2,081 m (2,042), of which organic growth amounted to 2 percent.
Lindab Interim Report January-September Lindab International AB (publ) Interim Report Third quarter Net sales increased by 2 percent to SEK 2,081 m (2,042), of which organic growth amounted to 2 percent.
Company Release Fiscal Year 2016/17
 Company Release Fiscal Year 2016/17 October 1, 2016 to September 30, 2017 At a Glance Key Aurubis Group figures Q4 Fiscal year 2016/17 2015/16 Change 2016/17 2015/16 Change Revenues m 2,851 2,399 19 %
Quarterly Report First 9 Months 2017/18
 Quarterly Report First 9 Months 2017/18 October 1, 2017 to June 30, 2018 At a Glance Key Aurubis Group figures Operating Aurubis Group output/throughput 2017/18 20 Change 2017/18 20 Change Concentrate
Interim Report January September 2018
 Interim Report January September 2018 2 July September 2018 Revenue SEK 4,918 million (4,246). Real growth 8 percent (5) and organic growth 2 percent (3). Operating income (EBITA) 1) SEK 626 million (570)
NYNAS Interim report 1 january 30 June 2014
 NYNAS Interim report 1 january 30 June 2014 2 Interim report 1 january 30 June 2014Q2 Nynas AB (Publ.), corporate re. no 556029-2509, parent company for Nynas. Nynas is a leading international group specialised
Third-quarter earnings burdened by raw material-related losses. Group adjusted EBITDA at EUR 56 million
 1 (23) Contents Highlights in the third quarter of 2017... 2 Highlights during the first nine months of 2017... 2 Business and financial outlook for the fourth quarter of 2017... 3 CEO Roeland Baan...
Interim report 1 January 30 September 2016
 This English translation is for the information purposes only. In case of any discrepancies between this version and the Swedish, the Swedish version shall prevail. Interim report 1 January 30 September
Scania Interim Report January September 2013
 23 October 2013 Scania Interim Report January September 2013 Summary of the first nine months of 2013 Operating income fell to SEK 5,939 m. (6,135), and earnings per share fell to SEK 5.30 (5.94) Net sales
Managing cash in society.
 interim report January June 2012 Managing cash in society. Continued margin improvement January June 2012 Revenue during the period amounted to MSEK 5,720 MSEK (5,210). Real growth amounted to 6 percent
Interim report January-June 2016
 Interim report January-June 2016 Unchanged market conditions Net revenues amounted to MSEK 898 (927) for the second quarter and MSEK 1,800 (1,843) for the first half of the year. Profit after net financial
Strong online performance and increased margins
 Q3 THIRD QUARTER MARCH 1, 2016 MAY 31, 2016 Strong online performance and increased margins Summary of third quarter of 20 Third quarter Net sales for the quarter rose 3.6 per cent to SEK 1,989 million
INTERIM REPORT. 1 January 30 September THE INTERIM PERIOD THE THIRD QUARTER. Important events during the period
 INTERIM REPORT 1 January 30 September 2018 THE INTERIM PERIOD Net revenue totalled SEK 1,495 million (1,23 Operating profit amounted to SEK 173 million (166) Profit before tax amounted to SEK 162 million
EBITDA margin Earnings per share SEK Operating cash flow ,
 Q2 218 JANUARY 1 - JUNE 3, 218 (compared with the year-earlier period) Net sales increased 11% to SEK 9,7m (8,191). The growth was mainly related to higher prices, offset partly by lower pulp volumes.
NYNAS INTERIM REPORT JANUARY SEPTEMBER JANUARY 30 SEPTEMBER 2015
 Q 3 INTERIM REPORT 1 JANUARY 30 SEPTEMBER Nynas AB (Publ.), corporate reg.no 556029-2509, parent company for Nynas. Nynas is a leading international group specialised in naphthenic specialty oils and bitumen.
Interim report ICA AB January 1 September 30, 2007
 Interim report ICA AB January 1 September 30, 2007 INTERIM REPORT for the period January 1 September 30, 2007 Stockholm, November 13, 2007 Increased sales and improved operating income in the third quarter
Interim report January March 2018
 Interim report January March 218 Strong growth and stable margin First quarter 218 Net sales rose by percent to SEK 945 million (815). Organic growth was 9 percent. Order intake was in line with net sales.
EMPOWERING INNOVATION
 EMPOWERING INNOVATION INTERIM REPORT THIRD QUARTER 2017 This English translation is for information purposes only. In case of any discrepancies between this version and the Swedish, the Swedish version
NEWS RELEASE LUNDIN MINING SECOND QUARTER RESULTS
 Corporate Office 150 King Street West, Suite 1500 P.O. Box 38 Toronto, ON M5H 1J9 Phone: +1 416 342 5560 Fax: +1 416 348 0303 UK Office Hayworthe House, Market Place Haywards Heath, West Sussex RH16 1DB
Endomines AB (Publ) (Company registration no ) Interim report 1 January - 30 September 2017
 (Company registration no ) Interim report 1 January - 30 September 2017") Endomines AB (Publ) (Company registration no. 556694-2974) Interim report 1 January - 30 September 2017 This interim report is a translation from the Swedish original which was published on 9 November
Endomines AB (Publ) (Company registration no. 556694-2974) Interim report 1 January - 30 September 2017 This interim report is a translation from the Swedish original which was published on 9 November
Interim report Q3, July September 2017 Stockholm, 25 October 2017
 Interim report Q3, July September Stockholm, 25 October As of the second quarter of, Cloetta Italia S.r.l. is accounted for as discontinued operation. The comparative figures in the consolidated profit
NEWS RELEASE LUNDIN MINING FOURTH QUARTER AND FULL YEAR RESULTS
 Corporate Office 150 King Street West, Suite 1500 P.O. Box 38 Toronto, ON M5H 1J9 Phone: +1 416 342 5560 Fax: +1 416 348 0303 UK Office Hayworthe House, Market Place Haywards Heath, West Sussex RH16 1DB
Clas Ohlson: Year-end report 1 May April 2013
 Clas Ohlson: Year-end report 1 May 2012 30 April 2013 Fourth quarter * Sales totalled SEK 1,274 M (1,272). In local currencies, growth was 3%. * Operating loss of SEK 19 M reported (profit: 10). * Loss
Sandvik Q1. PRESS RELEASE 4 May 2010 Interim report first quarter 2010
 PRESS RELEASE 4 May 21 Interim report first quarter 21 CEO's comment: The recovery that began in the fourth quarter continued during the first quarter and demand for Sandvik s products grew in all business
Operating profit increased by 44 percent to 27.2 MSEK (19.0). Result after tax increased by 52 percent to 27.7 MSEK (18.3).
. Result after tax increased by 52 percent to 27.7 MSEK (18.3).") Interim report January-September 2016 November 10, 2016 Third quarter Net sales amounted to 167.0 MSEK (149.7), an increase by 11.6 percent compared to the corresponding quarter last year. At comparable
Interim report January-September 2016 November 10, 2016 Third quarter Net sales amounted to 167.0 MSEK (149.7), an increase by 11.6 percent compared to the corresponding quarter last year. At comparable
First nine months of Earnings after tax totaled SEK 134 m (179). Earnings per share amounted to SEK 5.97 (8.08).
. Earnings per share amounted to SEK 5.97 (8.08).") First nine months of 2007 First nine months of 2007 Sales amounted to SEK 5,985 m (5,993). Adjusted for currency exchange rates, sales rose 4%. Order intake totaled SEK 6,077 m (6,022). The increase was
First nine months of 2007 First nine months of 2007 Sales amounted to SEK 5,985 m (5,993). Adjusted for currency exchange rates, sales rose 4%. Order intake totaled SEK 6,077 m (6,022). The increase was
Year-end report 1 January 31 December SBAB Bank AB (publ)
") Year-end report 1 January 31 December SBAB Bank AB (publ) SBAB Bank s lending operations displayed stable development in and loan losses remained low. Deposits increased to SEK 8.8 billion at year-end.
Year-end report 1 January 31 December SBAB Bank AB (publ) SBAB Bank s lending operations displayed stable development in and loan losses remained low. Deposits increased to SEK 8.8 billion at year-end.
SEK 161m Operating profit. 6% Operating margin. SEK 138m Profit before tax. SEK 0.99 Earnings per share INTERIM REPORT JANUARY-SEPTEMBER 2012
 C INTERIM REPORT JANUARY-SEPTEMBER 2012 Q3 Q2, % Q3, %, % SEKm 2012 2012 2011 2012 2011 Net sales 2 628 2 440 8% 2 327 13% 7 359 7 257 1% EBITDA 323 314 3% 456-29% 929 1 367-32% Operating profit/loss 161
Press Release Details
 Press Release Details First Quantum Minerals Reports Second Quarter 06 Results 07/7/06 TORONTO, ONTARIO (Marketwired July 7, 06) (In United States dollars, except where noted otherwise) First Quantum Minerals
Interim Report 30 September 2011
 Interim Report 30 September 2011 Third quarter 2011 Net sales amounted to EUR 244 (204) million, an increase of 20 percent compared to third quarter 2010, of which volume growth accounted for 9 percentage
Scania Interim Report January September 2017
 30 October 2017 Scania Interim Report January September 2017 Summary of the first nine months of 2017 Operating income, excluding items affecting comparability, amounted to SEK 9,080 m. (7,492) Operating
EBITDA margin Earnings per share SEK Operating cash flow ,751 2,273
 Q4 218 FULL YEAR 218 (217) Net sales increased 13% to SEK 18,755m (16,664). Sales grew in all segments. EBITDA increased 44% to SEK 5,252m (3,648). The improvement in EBITDA was mainly related to higher
Holmen s interim report January June 2016
 Holmen s interim report January June 216 2-16 1-16 2-15 216 215 215 Net sales 3 937 3 828 4 139 7 765 8 293 16 14 Operating profit excl. items affecting comparability 483 58 435 1 63 831 1 7 Operating
Quarterly Report Three Months Ended March 31, 2013
 Quarterly Report Three Months Ended March 31, 2013 All amounts in US dollars unless indicated otherwise Management s Interim Discussion and Analysis The following is management s interim discussion and
Read the CEO statement on the next page. For further information and images
 The 2016/2017 financial year was yet another step towards KappAhl s financial targets to achieve an operating margin of 10 per cent and a sales increase of 4 per cent over a business cycle. Read the CEO
Scania Year-end Report January December 2016
 17 March 2017 Scania Year-end Report January December 2016 Summary of the full year 2016 Operating income excluding items affecting comparability rose by 6 percent to SEK 10,184 m. (9,641), resulting in
Interim report. January - September Interim report for the period January - September Third quarter, July - September 2015
 Interim report January - September 2015 October 30, 2015 Interim report for the period January - September 2015 Third quarter, July - September 2015 Group net sales in the third quarter 2015 amounted to
Management s Discussion and Analysis
 Management s Discussion and Analysis For the year ended December 31, 2015 This Management s Discussion and Analysis ( MD&A ) should be read in conjunction with the audited consolidated financial statements
The New Leader in Global Copper. October 31, Third Quarter 2013
 The New Leader in Global Copper October 31, 2013 Third Quarter 2013 Cautionary Note Regarding Forward-Looking Statement Certain statements and information herein, including all statements that are not
Read the full CEO statement on the next page.
 Sales for the quarter were marked by a more balanced offer in which both the Christmas trade and subsequent clearance sales had a good structure. Full-price sales at the start of the season were also satisfactory,
2016 Annual Filings. December 31, 2016
 2016 Annual Filings December 31, 2016 Management s Discussion and Analysis For the year ended December 31, 2016 This management s discussion and analysis ( MD&A ) has been prepared as of February 22,
Scania Year-end Report January-December 2017
 20 March 2018 Scania Year-end Report January-December 2017 Summary of the full year 2017 Operating income, excluding items affecting comparability, amounted to SEK 12,434 m. (10,124) Operating income,
Holmen s year-end report 2016
 Holmen s year-end report 216 Full Year 4-16 3-16 4-15 216 215 Net sales 3 937 3 81 3 689 15 513 16 14 Operating profit excl. items affecting comparability 579 52 376 2 162 1 7 Operating profit 579 52-555
sustainability report result gri appendix 2010
 sustainability report result gri appendix 2010 BOLIDEN IN BRIEF BOLIDEN IN BRIEF Boliden is a leading European metals company whose core competence is in the fields of exploration, mining, smelting and
Charlotte Högberg, Head Corporate Communications. Tel
 Effects of fewer visits to stores and tough competition contributed to a decrease in sales of 3.2 per cent (for the full year). At the same time, good cost control and intensive development work have meant
Länsförsäkringar Bank January March 2012
 23 APRIL Länsförsäkringar Bank January The period in brief, Group Operating profit increased 39% to SEK 131 M (94). Return on equity amounted to 6.2% (5.0). Net interest income increased 23% to SEK 482
Profit after tax for January June 2010 was SEK 312 million (January June 2009: SEK 501 million).
.") 2-1 1-1 2-9 21 29 29 Net turnover 4 227 4 4 4 496 8 628 9 25 18 71 Operating profit 268 32 372 588 787 1 62 Profit after tax 133 178 256 312 51 1 6 Earnings per share, SEK 1.6 2.1 3. 3.7 6. 12. Return
2-1 1-1 2-9 21 29 29 Net turnover 4 227 4 4 4 496 8 628 9 25 18 71 Operating profit 268 32 372 588 787 1 62 Profit after tax 133 178 256 312 51 1 6 Earnings per share, SEK 1.6 2.1 3. 3.7 6. 12. Return
SILVERCORP METALS INC.
 MANAGEMENT S DISCUSSION AND ANALYSIS (Expressed in thousands of US dollars, unless otherwise stated) Table of Contents 1. Core Business and Strategy... 2 2. Second Quarter of Fiscal Year 2015 Highlights...
30 OCTOBER Q Interim Management Statement
 30 OCTOBER 2018 Q3 2018 Interim Management Statement Important Notice This presentation has been prepared by the management of Nyrstar NV (the "Company"). It does not constitute or form part of, and should
2018 Second Interim Management Statement
 Regulated Information Inside Information Second Interim Management Statement 30 October at 07:00 CET HIGHLIGHTS: Group underlying EBITDA 1 of EUR 134 million for the first nine months of, a decrease of
SCANIA INTERIM REPORT JANUARY SEPTEMBER 2005
 1 November 2005 SCANIA INTERIM REPORT JANUARY SEPTEMBER 2005 Based on Scania s order bookings during the second and third quarter, and given the current production rate, our assessment is that this year
Company Release Fiscal Year 2014/15
 Company Release Fiscal Year October 1, 2014 to September 30, 2015 At a Glance Key Aurubis Group figures 4th quarter Fiscal year Change Change Revenues m 2,528 2,944-14 % 10,995 11,241-2 % Gross profit
High-quality aluminium coils of AMAG Austria Metall AG
 High-quality aluminium coils of AMAG Austria Metall AG Financial Report 1 st half year of 2015 2 AMAG Financial Report Key figures for the AMAG Group Key figures for the Group in EUR million Q2/2015 Q2/2014
Lindab International AB (publ) Year-End Report
 Year-End Report") Lindab International AB (publ) Year-End Report Fourth quarter Net sales increased to SEK 2,039 m (1,980), of which organic growth amounted to 1 percent. Operating profit amounted to SEK 112 m (124), excluding
Lindab International AB (publ) Year-End Report Fourth quarter Net sales increased to SEK 2,039 m (1,980), of which organic growth amounted to 1 percent. Operating profit amounted to SEK 112 m (124), excluding
Interim Report January June 2018
 Interim Report January e APRIL JUNE > Net sales increased by 11 per cent to SEK 415.8 million (376.1). In USD terms, net sales increased by 14 per cent. > Order intake increased by 11 per cent to SEK 409.6
INTERIM REPORT 1 JANUARY 30 SEPTEMBER 2013
 INTERIM REPORT 1 JANUARY 30 SEPTEMBER 2013 Quarterly period July-September Poolia's revenue amounted to SEK 178.2 (217.8) million, a decline of 18.2% (18.5% in local currency). Operating profit/loss was
Fredrik Börjesson. Stefan Hedelius
 15995949.1 Extraordinary General Meeting in Momentum Group AB (publ) on 28 November 2017. Account of the Board of Directors of Momentum Group AB (publ) in accordance with Chapter 19, Section 24, Paragraph
VBG GROUP INTERIM REPORT Q3JANUARY SEPTEMBER 2018
 VBG GROUP INTERIM REPORT JANUARY SEPTEMBER The VBG Group is an international industrial group with some 1,6 employees in 18 countries. The Parent Company VBG Group AB is a long-term owner that provides
Management s Discussion and Analysis For the year ended December 31, 2012
 Management s Discussion and Analysis For the year ended December 31, 2012 This management s discussion and analysis ( MD&A ) has been prepared as of February 21, 2013 and should be read in conjunction
Interim report 1 May October 2013
 Interim report 1 May 2013 31 October 2013 Second quarter 2013/14 Sales increased by 4 % to 1,678 MSEK (1,614). In local currencies, growth was up 6 % Operating profit increased by 23 % to 126 MSEK (102)
Very high profitability and solid financial position
 Nolato AB six-month interim report 215, page 1 of 16 Nolato AB (publ) six-month interim report 215 Very high profitability and solid financial position Second quarter of 215 in brief Sales rose by 33%
Interim report. January - September Interim report for the period January - September Third quarter July September 2014
 Interim report January - September 2014 October 30, 2014 Interim report for the period January - September 2014 Third quarter July September 2014 Group net sales in the third quarter 2014 amounted to 118.5