RESULTS FOR THE YEAR ENDED 30 JUNE Investor Presentation: 2 September 2015
|
|
|
- Mercy Golden
- 5 years ago
- Views:
Transcription
1 Investor Presentation: 2 September 2015

2 HIGHLIGHTS YEAR ENDED 30 JUNE 2015 Financial Highlights Up 20.1% Up 98.2% Up 335.2% Up 76.0% REVENUE R23.4bn EBITDA R m HEADLINE EARNINGS PER SHARE 112.2c CASH GENERATED R m Key Features Full year of TSB versus 6 months in 2014 TSB delivered solid performance Rainbow s results improved significantly Finalised long-term debt package Impaired Massingir project spend Structured business into new operating divisions Beyond delivering solid results, our recent acquisitions and restructuring of the business have led to a stronger, more diversified business that is geared for growth. 2


3 Salient features Strategic overview Financial review Operational reviews Prospects OUR JOURNEY SO FAR Platform for Growth Integrated Organisation Sharper Strategy 3
 (continuing operations) R2 224.0 R1 122.2 R1 434.6 R 445.")
4 Salient features Strategic overview Financial review Operational reviews Prospects PLATFORM FOR GROWTH Revenue (R billion) R 19.5 R22.4 R 23.4 R proforma* EBITDA (R million) (continuing operations) R R R R pro 2013 forma* proforma* 4


5 Salient features Strategic overview Financial review Operational reviews Prospects INTEGRATED ORGANISATION RCL FOODS Consumer Division Sugar & Milling Division Vector Logistics BUSINESS UNITS Chicken, Speciality, Grocery, Pies & Beverages, FoodSolutions BUSINESS UNITS Sugar, Milling and Baking, Animal Feed BUSINESS UNITS Logistics business responsible for Group-wide Route to Market WAREHOUSING DISTRIBUTION SUPPLY CHAIIN INTELLIGENCE SALES SOLUTIONS 5


6 Salient features Strategic overview Financial review Operational reviews Prospects SHARPER STRATEGY Passion, Ambition, Strategic Thrusts and Values Business Model 6


7 Salient features Strategic overview Financial review Operational reviews Prospects STRATEGIC THRUSTS Grow through Strong Brands Partner with Strategic Customers Extend our Leading Value Chain Inspire Great People Expand into Africa Drive Sustainable Business 7
8 Salient features Strategic overview Financial review Operational reviews Prospects 01 - GROW THROUGH STRONG BRANDS 2015 Achievements STRONG SHARE TURNAROUND Nola Mayonnaise Volume Share Rainbow s new business model is delivering more profitable, consistent results TSB production volumes grew to 702k tons, with strong Selati share performance 3MMA 14 3MMA 15 Nola, Yum Yum started to show signs of an encouraging share turnaround Yum Yum Peanut Butter Volume Share Investing R243 million in new UHT and Pet Food Plants MMA 14 3MMA 15 Source Aztec June

9 Salient features Strategic overview Financial review Operational reviews Prospects 02 - PARTNER WITH STRATEGIC CUSTOMERS 2015 Achievements R30 MILLON INVESTMENT INTO NEW SPECIALITY PLANT FOR WOOLWORTHS Rainbow s strong growth in QSR Introduced new categories into the QSR network Commissioned a fourth Speciality plant for Woolworths Build on existing Joint Business Partnerships 9
 2015 R115m Achieved Group sourcing savings of R115 million A new sales force, Vector Trade Marketing 2014 R103m Implemented Pieman's warehousing solution 2013")
10 Salient features Strategic overview Financial review Operational reviews Prospects 03 - EXTEND OUR LEADING VALUE CHAIN 2015 Achievements R115 MILLION SAVINGS FROM SOURCING IN 2015 Established Transformation Management Office (TMO) 2015 R115m Achieved Group sourcing savings of R115 million A new sales force, Vector Trade Marketing 2014 R103m Implemented Pieman's warehousing solution 2013 R99m 10

11 Salient features Strategic overview Financial review Operational reviews Prospects 04 - INSPIRE GREAT PEOPLE 2015 Achievements 4 STANDARDS OF LEADERSHIP New structure with three logical divisions New Standards of Leadership New Leadership Development Programmes New Performance Management Programmes 11
 Senn Foods Logistics (Botswana) delivered solid results Zam Chick delivered good results in Zambia Zamhatch investment in new breeding operation in Zambia well")
12 Salient features Strategic overview Financial review Operational reviews Prospects 05 - EXPAND INTO AFRICA 2015 Achievements A DEAL FOR A R50 MILLION INVESTMENT IN UGANDAN POULTRY PRODUCTION Acquired 33.5% of HMH, Uganda (post year-end) Senn Foods Logistics (Botswana) delivered solid results Zam Chick delivered good results in Zambia Zamhatch investment in new breeding operation in Zambia well advanced RSSC (Swaziland) sugar production has been positive 12

13 Salient features Strategic overview Financial review Operational reviews Prospects 06 - DRIVE SUSTAINABLE BUSINESS 2015 Achievements 37.7 GWh OF CO-GENERATED ELECTRICITY SUPPLIED TO GRID Generated GWh electricity a 10% increase over last year. Exported 37.7 Gwh electricity into grid. Produced litres of biofuel from poultry byproduct in a pilot bio-diesel plant, replacing litres of liquid burner fuel Installed real time water monitoring system in a poultry processing facility resulting in 15% reduction of potable water use. Sourced sugar cane from over individual farmers 13

14 Salient features Strategic overview Financial review Operational reviews Prospects KEY DELIVERABLES FOR Drive the new business model in Chicken 2. Drive Group synergies in Sugar, e.g. Sourcing, Route to Market 3. Implement turnaround plans for Milling & Baking, Pies and Speciality 4. Sharpen our strategic customer focus per category 5. Invest behind brands and systems to enable growth 6. Optimise resources and costs and drive synergies through TMO 7. Implement the next level of the new organisation 8. Continue with our expansion strategy (inc. Africa) 14
15 Salient features St rategic overview Financial r eview Operational reviews Prospects FINANCIAL SUMMARY YEAR ENDED 30 JUNE 2015 Statutory Year ended 30 June 15 Restated Pro forma Year ended 30 June 14 % var Restated Year ended 30 June 14 Revenue Rm EBITDA Rm EBITDA margin % EBIT Rm Effective tax rate (excluding JV s & associates) % (4.6) (12.2) Headline earnings - continuing operations Rm (332.6) Cash generated by operations Rm Net cash and investment in money market Rm Headline earnings per share - continuing operations Cents (47.7) Capex spend Rm Total dividend Cents NAV per share Cents Pre-IAS 39 EBITDA Rm EBITDA margin %
16 Salient features St rategic overview Financial r eview Operational reviews Prospects OPERATING ENVIRONMENT General economic environment in South Africa remains challenged Labour unrest High unemployment is a risk to growth objectives and economic stability Depreciating currency (R/US$ exchange rate depreciated 14.1% during the 2015 financial year) Pedestrian growth of the SA economy Electricity supply constraints All adding pressure on already stretched consumers Relief expected from reductions in fuel price Improved supply/demand balance in chicken and sugar markets 16
17 Salient features St rategic overview Financial r eview Operational reviews Prospects RESULTS WATERFALL Reconciliation waterfall of EBITDA to headline earnings for year ended 30 June 2015 R million EBITDA Depreciation, amortisation and impairments Net finance cost Taxation Share of profit from JVs & associates Minority interest from continuing operations Headline adjustment: impairments Other headline adjustments Headline earnings from continuing operations 17
18 Salient features St rategic overview Financial r eview Operational reviews Prospects KEY FINANCIAL ISSUES Details of term-funded debt package During the year under review the R4.5 billion bridging loan was replaced with a longer term funding structure across 3, 4 and 5 year terms Given the current growth trajectory and significant capital expenditure, flexibility within the funding package is key with R0.5 billion designated as a revolving credit facility The Group is able to prepay the debt without penalty from internally generated cash flows The term-funded debt package is structured as follows: Facilities Amount (Rm) Type Term Senior A Loan Bullet 5 years Senior B Loan Bullet 4 years Senior C Loan 498 Revolving 3 years Total Although the new average funding cost is slightly higher than the bridging facility it replaced, it is reflective of the longer term nature of the debt with normal covenants but is still competitive due to the investment grade debt profile of the Group Interest rates for years 1 & 2 are fixed In respect of years 3 & 4, R1.5 billion of the original hedgeable exposure of R2.85 billion has been hedged All covenants have been met with a significant safety margin in the 2015 financial year 18
19 Salient features St rategic overview Financial r eview Operational reviews Prospects KEY FINANCIAL ISSUES Segmental reporting Whilst the restructure was effective 1 January 2015, the management accounting systems required to enable this reporting will only be implemented for the 2016 financial year and therefore RCL Foods will report its segmental information on the historical basis for the 2015 financial year Massingir Impairment An amount of R84.0 million (no taxation impact) relating to work-in-progress spend for Massingir, the proposed greenfields sugar project in Mozambique, has been impaired in the current year as a suitable funding structure that reduces the risk to the Group within the mandate set by the board of directors, had not been obtained Pro-forma results Due to the material impact of the corporate transactions in the 2014 financial year, RCL Foods published pro forma results on SENS on the 27th August 2014 to provide shareholders with a better understanding of the underlying operational performance of the Group The pro-forma results have been included as an additional comparative for the 2015 financial reporting period 19
20 Salient features St rategic overview Financial r eview Operational reviews Prospects OPERATING RESULTS SUMMARY Segmental analysis Revenue Revenue (Rm) Year ended 30 June 15 Restated Pro forma Year ended 30 June 14 % var Restated * Year ended 30 June 14 Foodcorp (0.4) Rainbow TSB Vector Sales between Segments Foodcorp to Rainbow (89.7) (62.0) 44.7 (62.0) Rainbow to Foodcorp (73.0) (51.7) 41.2 (51.7) TSB to Foodcorp (55.7) (27.1) (13.5) TSB to Rainbow (4.8) Vector to Foodcorp (110.9) (21.5) (21.5) Vector to Rainbow (839.4) (814.2) 3.1 (814.2) Vector to TSB (13.5) Total * Restatement relates to certain allowances granted to customers which were reflected as an expense instead of a reduction of revenue 20
21 Salient features St rategic overview Financial r eview Operational reviews Prospects OPERATING RESULTS SUMMARY Segmental contribution to revenue 2015 R23.4 billion 2014 (PF) R22.4 billion 8% 7% 25% 31% 23% 33% 37% 37% Foodcorp Rainbow TSB Vector * Based on revenue before inter-segment sales 21
22 Salient features St rategic overview Financial r eview Operational reviews Prospects OPERATING RESULTS SUMMARY Segmental analysis EBITDA EBITDA (Rm) Year ended 30 June 15 Restated Pro forma Year ended 30 June 14 % var Restated Year ended 30 June 14 Foodcorp Rainbow TSB Vector Unallocated group costs (4.3) (28.5) 84.9 (149.0) Total EBITDA Margin Foodcorp 9.9% 9.5% % Rainbow 8.5% 2.3% % TSB 8.2% 6.4% % Vector 10.9% 11.6% (0.7) 11.7% Total 9.5% 6.4% % Rainbow pre-ias 39 EBITDA EBITDA Margin 7.4% 3.4% % 22
23 Salient features St rategic overview Financial r eview Operational reviews Prospects OPERATING RESULTS SUMMARY Segmental contribution to EBITDA (Rm) 2015 R million 2014 (PF) R million 9% 14% 23% 33% 24% 49% 35% 14% Foodcorp Rainbow TSB Vector 23
24 Salient features St rategic overview Financial r eview Operational reviews Prospects OPERATING RESULTS SUMMARY Segmental contribution to EBITDA improvement (Rm) Pro forma 30 Jun 14 (Pre-IAS 39) Foodcorp Rainbow TSB Vector Group 30 Jun '15 (Pre-IAS 39) IAS 39 adjustment Dec'14 Jun '15 (Statutory) 24
25 Salient features St rategic overview Financial r eview Operational reviews Prospects CASH FLOW SUMMARY Rm Year ended 30 June 15 Year ended 30 June 14 Opening balance (including money market investment and net of overdraft) Operating profit adjusted for non-cash flow items Working capital movement Net finance cost paid (322.6) (530.5) Tax paid (280.9) (48.9) Capital expenditure (including intangibles) (763.5) (672.4) Investment in joint venture/subsidiary (46.0) (616.4) Proceeds on disposal of PP&E and preference shares Interest-bearing liabilities ( ) ( ) Dividends received Dividends paid (301.8) - Issue of shares Proceeds on sale of fishing division (net of cash) Discontinued operation - net cash inflows Cash acquired in common control transaction (TSB acquisition) Other 2.0 (73.5) Closing balance
26 Salient features St rategic overview Financial r eview Operational reviews Prospects WORKING CAPITAL MOVEMENT Rm Year ended 30 June 15 Year ended 30 June 14 Net Trade payables Inventory and biological assets (336.5) Trade receivables (68.0) (337.6) Net working capital as a % of revenue has remained sub 10% Working capital management practices across the Group continue to receive attention 12.0% 10.0% 8.0% 6.0% 4.0% 2.0% 0.0% Net Working capital as a % of revenue June'13 June'14 June'15 26
27 Salient features St rategic overview Financial r eview Operational reviews Prospects CAPITAL EXPENDITURE Largely directed at Foodcorp and Vector in 2015 Rm Year ended 30 June 15 Year ended 30 June 14 Total expenditure (excluding intangibles) Foodcorp expenditure amounts to R233.8 million with major capital expenditure relating to the solvent extraction plant in the Grocery division TSB expenditure amounted to R218.3 million, while Rainbow expenditure amounted to R210.2 million R461.7 million has been contracted and committed, but not spent A further R460.7 million has been approved, but not contracted Approved capital expenditure for Vector includes the distribution and warehousing facility in Port-Elizabeth (R142.7 million), and the Thekwini and Peninsula expansions (R90.3 million and R71.2 million respectively) Approved capital expenditure for Foodcorp includes the Mageu UHT project (R120 million) and petfood plant upgrade (R123 million) 27
28 OPERATIONAL REVIEW FOODCORP Year ended 30 June 15 Restated Pro forma Year ended 30 June 14 % var Restated Year ended 30 June 14 Revenue (Rm) Foodcorp (0.4) Rainbow TSB Vector Sales between Segments ( ) (976.5) 21.6 (962.9) Total EBITDA (Rm) Foodcorp Rainbow TSB Vector Unallocated Group costs (4.3) (28.5) 84.9 (149.0) Total The opportunity Drive innovation in existing brands and categories and expand into new brand categories Being part of RCL Foods enables greater product innovation and investment in new opportunities Opportunity to harness the selling, distribution and credit management synergies across the Group 28
29 OPERATIONAL REVIEW FOODCORP Foodcorp experienced subdued growth driven by a slow first half in a competitive market, and industrial action in Speciality EBITDA grew at 3.9% to R743.3m (30 June 14 PF: R715.6m), translating into a margin of 9.9% Industrial action at the Speciality division had a profit impact of R23.0m (excluding this impact, 3.9% growth improves to 7.1%) Foodcorp s Grocery, Speciality, Pies and Beverages categories now form part of RCL Foods Consumer. Foodcorp s Milling and Baking divisions now form part of RCL Foods Sugar & Milling RCL Foods sees significant upside into the future in both margin and volume across all of Foodcorp s brands and categories 29


30 OPERATIONAL REVIEW FOODCORP The new Consumer Executive has been in place since January 2015: driving a clear, strong plan Brilliant basics have been put in place including: strict pricing compliance shelf health on shelf availability promotional step change and compliance depth of distribution achievement and longer term brand building basics have been put in place, including: clarifying brand opportunities and weaknesses and consequential plans real product intrinsic differentiation communication 30
31 OPERATIONAL REVIEW FOODCORP Consequential market shares, which started the year poorly, have shown strong recoveries in the final three months, in many cases to three year highs Culinary Source: Nielsen & Aztec June 2015 Brand Share 12MM Jun 14 Brand Share 12MM Jun 15 Apr Jun 15 Apr 15 May 15 June 15 Nola mayonnaise 32.0% 31.0% 31.3% 30.6% 33.6% 29.7% Yum Yum peanut butter 26.7% 27.1% 29.0% 26.7% 30.7% 29.7% Ouma rusks 39.8% 39.0% 46.1% 43.8% 45.6% 48.1% Pet Food Dry dog food 53.8% 47.4% 50.8% 51.6% 50.2% 50.7% Bobtail 26.7% 23.1% Foodcorp Housebrands 20.1% 19.0% Dogmor 5.3% 3.6% Canine Cuisine 0.5% 1.0% Wet Dog Food 3.9% 4.0% Dry Cat Food 32.9% 28.4% Catmor 28.0% 21.8% Wet Cat Food 4.5% 4.2% 31
32 OPERATIONAL REVIEW FOODCORP Noteworthy category performance As mentioned, Nola mayonnaise, Yum Yum peanut butter, Ouma rusks and Pet food brands have had a strong last quarter, soundly beating EBIT targets for this quarter Pies have stabilised, and a strong plan is being put in place, inclusive of a quality step change, innovation and keen price points in new channels Beverages continue to grow margin through trading up to the premium offering (No1 Smooth) this healthy brand remains key and a raft of innovation is in the pipeline Speciality (Woolworths) performance was affected by the strike (R23m). However, a three year wage agreement has been signed, and RCL Foods and Woolworths exec teams have agreed the growth blueprint for the future We are confident that the Foodcorp portfolio of brands are set for a strong performance 32
33 OPERATIONAL REVIEW FOODCORP Milling and Baking Milling and Baking divisions merged into single operational structure (Millbake) Positive revenue growth in Milling offset by increases in raw materials and utility costs and lower volumes Softer commodity prices resulted in improved maize margins versus prior year New Milling plant commissioned Consolidated Gauteng bakeries expected to deliver benefits in
34 OPERATIONAL REVIEW FOODCORP Milling and Baking Market review Competitive intensity in the grains industry increases, impacting margins Declining wheat consumption (1.77%) Change in consumption patterns in upper LSM s (Low Carb trend might be the driver) Over capacity More market entrants Maize consumption increases as other carbohydrates become increasingly more expensive Bread consumption per capita stagnant but Speciality breads increases off low base 34


35 OPERATIONAL REVIEW FOODCORP Millling and Baking initiatives 35
36 OPERATIONAL REVIEW RAINBOW Year ended 30 June 15 Restated Pro forma Year ended 30 June 14 % var Restated Year ended 30 June 14 Revenue (Rm) Foodcorp (0.4) Rainbow TSB Vector Sales between Segments ( ) (976.5) 21.6 (962.9) Total EBITDA (Rm) Foodcorp Rainbow TSB Vector Unallocated Group costs (4.3) (28.5) 84.9 (149.0) Total Rainbow pre-ias 39 EBITDA The opportunity Consumption and long-term volume growth trends expected to continue Focus on value-added products and strategic customers driving an improved mix Industry margins improved but not yet restored to acceptable levels - Tariffs and anti-dumping protection are key - Commodity price volatility and rand weakness remain a risk Rainbow remains supportive of Government s intended cap on injection 36
37 OPERATIONAL REVIEW RAINBOW Rainbow s new business model is performing and delivering more profitable, consistent results Rainbow Pre IAS 39 EBITDA, at R667.6m, is significantly up on the R299.2m for the comparable period. The post IAS 39 profit growth is 286.2% Critical factors in the success of the new business model are: 1. Increasing the proportion of the bird weights bell curve suitable for QSR s, so that we could reduce the number of birds going into commodity lines 2. thereby reducing the volume of loss making IQF substantially 3. Taking cost out and becoming more efficient 4. and growing added value aggressively, most notably FoodSolutions, followed by retail further processed brands 37
38 OPERATIONAL REVIEW RAINBOW 1. Bell curve success Historically 28% of Rainbow birds grown met the QSR weight spec. This has now been increased through new, innovative agriculture practices to 42% (a 50% increase in appropriate bird numbers for QSR s) and further upside still exists 28% 42% Total available birds Birds in QSR weight range This has allowed us to place fewer birds, and dramatically reduce loss making commodity lines, while allowing no investment growth for QSR s Source: Internal data 38
39 OPERATIONAL REVIEW RAINBOW 2. Reduction of IQF Rainbow, with lower injection than competitors, makes lower margin on the large IQF market category usually at a loss The extra QSR birds available in the bell curve have allowed us to down place bird numbers, and reduce IQF production dramatically. by up to two thirds Processing IQF tons per day Jul 13 Aug 13 Sept 13 Oct 13 Nov 13 Dec 13 Jan 14 Feb 14 Mar 14 Apr 14 May 14 Jun 14 Jul 14 Aug 14 Sept 14 Oct 14 Nov 14 Dec 14 Jan 15 Feb 15 Mar 15 Apr 15 May 15 Jun 15 Source: Internal data 39

40 OPERATIONAL REVIEW RAINBOW 3. Taking cost out and step changing efficiency A number of targeted savings have come to fruition in agriculture, processing and sourcing these have contributed significantly to results 4. Aggressive added value growth FoodSolutions has performed well, with decent volume growth returning to this area across all customers Rainbow has further developed the strong partnerships with QSR partners, winning more share of their chicken business in the process. In addition, the acquired Foodcorp capability to produce mayonnaise, sauces and baked products and deserts, has allowed RCL Foods to make a step change into the fuller QSR and Food Service basket of products In retail, the Simply Chicken ranges have grown their margin by some 20% as a consequence of carefully planned price value decisions 40
41 OPERATIONAL REVIEW RAINBOW Industry issues update Injection DAFF called a meeting of stakeholders last month, to announce that they have heard all input and will make an announcement on their decision soon This is expected to be a cap on injection in the desirable range for Rainbow and will level the playing fields in this important area Imports These show no sign of abating and remain at historical highs The recent AGOA decision, to allow tons of USA dumped leg quarters, dumping duty free into South Africa, will not help 41
42 OPERATIONAL REVIEW TSB Year ended 30 June 15 Restated Pro forma Year ended 30 June 14 % var Restated Year ended 30 June 14 Revenue (Rm) Foodcorp (0.4) Rainbow TSB Vector Sales between Segments ( ) (976.5) 21.6 (962.9) Total EBITDA (Rm) Foodcorp Rainbow TSB Vector Unallocated Group costs (4.3) (28.5) 84.9 (149.0) Total The opportunity Significant growth potential into Africa with huge diversification potential Potential to expand electricity exports to the Eskom grid 42


43 OPERATIONAL REVIEW TSB Performance at a glance EBITDA of R505.1 million (44.6% up on prior year pro forma) and an EBITDA margin of 8.2% Total Revenue of R6.1 billion increased by 13.2% from prior year of R5.4 billion Import duties & droughts in Brazil reduced sugar imports and led to a recovery in the average sugar prices Raw exports were tons less than in 2014 this was mainly due to the lower Industry crop Record production & sale levels Crushing the most cane in history Selati market share 30.3% Production share was 29.7% for the 2015 season due to the positive production results and the severe drought in KZN Massingir An amount of R84.0 million (no taxation impact) relating to work-in-progress spend for Massingir, the proposed greenfields sugar project in Mozambique, has been impaired in the current year as a suitable funding structure that reduces the risk to the Group within the mandate set by the board of directors, had not been obtained 43


44 OPERATIONAL REVIEW TSB Performance at a glance Feed Integration of Epol and Molatek into a single Feed business unit is going well with all structure changes implemented system changes will follow Financial result for the year is excellent with both Epol and Molatek exceeding their best ever results Expansion project contributing to Molatek brand Operating cost management focus well entrenched with savings exceeding R35 million 44
45 OPERATIONAL REVIEW TSB TSB Agronomic Dashboard Cane is provided per season June 2015 June 2014 Cane crushed (000) Raw sugar produced (000) Cane : Sugar ratio Sucrose % 14.4% 14.2% TSB Managed Farms Hectares managed Cane yield per hectare Capacity Cane capacity (000) Capacity utilisation 99% 86% TSB Production Share 29.7% 27.4% 45
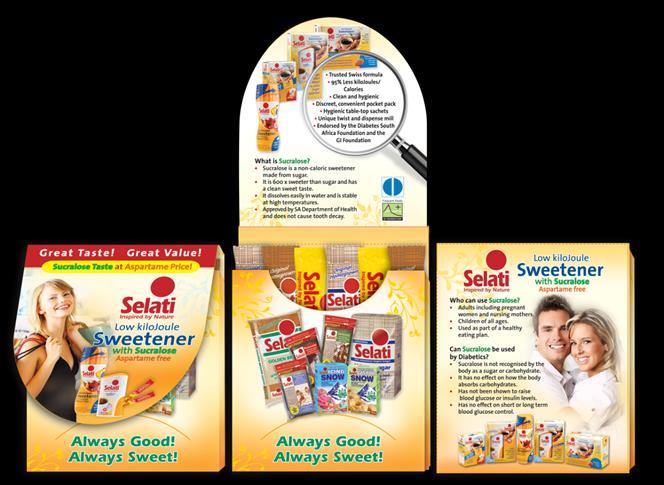
46 OPERATIONAL REVIEW TSB Brand share summary Category Brands Market position value TSB packed brands (Incl HB'S) TSB Share volume TSB Share value SELATI 29.2% 30.3% SUGAR 2 House Brands 16.5% 15.2% TOTAL TSB 45.7% 45.5% SELATI 23.6% 24.8% SPECIALITY SUGAR 2 House Brands 25.4% 18.6% TOTAL TSB 49.0% 43.4% ARTIFICIAL SWEETENERS 3 SELATI 6.0% 5.8% 46


47 OPERATIONAL REVIEW TSB Sugar Marketing initiatives 47
48 OPERATIONAL REVIEW VECTOR Year ended 30 June 15 Restated Pro forma Year ended 30 June 14 % var Restated Year ended 30 June 14 Revenue (Rm) Foodcorp (0.4) Rainbow TSB Vector Sales between Segments ( ) (976.5) 21.6 (962.9) Total EBITDA (Rm) Foodcorp Rainbow TSB Vector Unallocated Group costs (4.3) (28.5) 84.9 (149.0) Total The opportunity Opportunity to leverage Vector s business model and skills into the outbound supply chain for the Group Significant investment in new capacity will facilitate higher volumes and improved operational efficiency, positioning Vector well for future growth (c.r15 bn value of goods moved through Vector system annually) 48


49 OPERATIONAL REVIEW VECTOR Revenue growth of 10.8%, driven largely by take on of 4 new customers Vector welcomes four new customers into the network Foodservice industry volume performance pleasing Revenue growth 10.8% to R m Four new customers joined the network, namely Sea Harvest, Dr Oetker, Natures Garden and Heinz post the exit of McCain and Famous Brands in the year Volume growth in the Foodservice industry continued Second sales and merchandising structure operational 49


 Second sales and merchandising unit employing > 1 000 new staff")
50 OPERATIONAL REVIEW VECTOR Expansion and industrial action impact cost Industrial action costs R20m Second sales and merchandising structure implemented New facility at PE (Coega) EBITDA grew at a muted 4.4% to R206.2 million, largely due to the industrial action at the Midrand campus, R20m incurred to maintain service levels (excluding this impact, EBITDA would have grown by 14.5%) Second sales and merchandising unit employing > new staff New facility at Coega operational shortly after year-end, two additional major expansion projects underway 50

51 OPERATIONAL REVIEW VECTOR Operational efficiency 1.1% 9.0% Volume Inventory Service Level % 9% increase in inventory levels, 2% excluding new business Excluding new customers, inventory level growth of 2% on prior year 9% increase driven by the stock build in the take-on phase of the four new customers to ensure service level requirements were met Operational efficiency Year on year volume growth increased by 1.1% Average inventory levels increased by 9%, largely as a result of new business (2% excluding new business) Service levels maintained to meet customer requirements despite constraints in supply from certain major principals 51
52 PROSPECTS Sustainable improvement in consumer spending is unlikely: the impact of this is pervasive across all RCL Foods segments The Consumer division s new management structure and focused investment behind its brands is expected to yield positive financial results in 2016 Poultry industry still facing uncertainty following the recent decision with respect to duty free USA imports, while the injection cap issue remains unresolved The Sugar & Milling division s use of irrigation will largely shield it from the current drought conditions experienced by the KZN sugar producers, however the short-term outlook for global sugar pricing is negative Vector expects to commission new capacity in the latter half of the year, allowing the take-on of potential new customers. The continuing good performance of food service customers is expected to help offset negative economic factors RCL Foods continues to explore opportunities in strategic growth markets in the food sector in South Africa and sub-saharan Africa, in line with long-term aspirations 52

53 APPENDICES


54 Salient features Strategic overview Financial review Operational reviews Prospects STRATEGIC OVERVIEW RCL Foods in context Rupert Family Food, Liquor & Home care Banking Healthcare Insurance Industrial Infrastructure Media & Sport 54

55 FOODCORP: GROCERY AND PIE DIVISIONS Grocery Pie The Grocery Division consists of a portfolio of well recognised brands with market leading positions Includes a wide range of grain and edible oil based products, sorghum, peanut butter, rusks, a range of pet foods, as well as salad dressings, dips and spreads The Pie Division produces a range of high quality, predominantly meat pies under the Piemans brand that are sold in these formats: frozen unbaked, frozen baked and chilled baked One mega site which includes 6 operations Botswana Limpopo Botswana Limpopo Randfontein Mpumalanga North Gauteng West Centurion Krugersdorp Mpumalanga North Gauteng West Northern Cape Free State Lesotho KwaZulu- Natal Northern Cape Free State Lesotho KwaZulu- Natal Western Cape Molteno Eastern Cape Ouma Rusks Western Cape Eastern Cape Brands Brands 55


56 FOODCORP: BEVERAGE AND SPECIALITY DIVISIONS Beverage Speciality The Beverage Division produces a maize-based health drink under the Mageu No 1, Smooth, Phuzimpilo and Mnandi brands The Speciality Division produces a range of superior ready to eat products, including speciality breads, mainly for Woolworths The product range includes sandwiches, muffins, desserts, snack foods, scones, rye breads, cake products, pastries and croissants Botswana Limpopo Botswana Limpopo North West Pretoria Mpumalanga Gauteng Pretoria x 1 site Mpumalanga North Gauteng West Johannesburg x 2 sites Northern Cape Free State Lesotho KwaZulu- Natal Northern Cape Free State Lesotho KwaZulu- Natal Western Cape Eastern Cape Western Cape Worcester x 1 site Eastern Cape Brands Brands 56

57 FOODCORP: BAKING AND MILLING DIVISIONS Baking Milling The Baking Division is the fourth largest bakery group in the country, operating seven bakeries and distributing its products in five of the country s provinces The Milling Division operates the largest single site flour mill in Southern Africa and a maize mill, both based at the same site in Pretoria Botswana Tzaneen Limpopo Polokwane Rustenburg Bushbuckridge Pretoria Mpumalanga North Gauteng Nelspruit West Benoni Botswana North West Limpopo Pretoria Mpumalanga Gauteng Northern Cape Free State Lesotho KwaZulu- Natal Northern Cape Free State Lesotho KwaZulu- Natal Western Cape Eastern Cape Western Cape Eastern Cape Brands Brands 57


58 RAINBOW: COMPLEX BUSINESS CHAIN Integrated supply chain from farm to fork GP operation Agriculture Processing Grandparent chicks Grandparent farms Parent farms Broiler farms Rearing 21 weeks Laying 40 weeks Hatching 3 weeks Rearing 21 weeks Laying 40 weeks Hatching 3 weeks Growing 34 days Broilers Processing 4 plants + 2 FP plants World s oldest pedigree broiler breed Located in Carolina and East London to ensure optimal bio-security 3 broad agricultural regions - Northern, KZN, W Cape Feed supply 5 feed mills producing 1.1m tons pa Around 70% of production to Rainbow Consumers Brands Customers Distribution The consumer is at the heart of our business Grade A Quality, Grade A Taste They taste so good cos they eat so good The Chicken Experts Foodservice Retail Wholesale 58
59 RAINBOW INFRASTRUCTURE Limpopo Province Polokwane Tzaneen Windhoek Namibia Northern Cape Botswana Rustenburg North Roodepoort West Klerksdorp Free State Bloemfontein Wolwehoek Lesotho Mpumalanga Nelspruit Midrand Swaziland Carolina KwaZulu Natal Newcastle Pietermaritzburg Hammarsdale Durban Eastern Cape 209 rearing, laying and broiler farms and hatcheries 27m birds on the ground Western Cape 5 feed mills 1.1m tons per year Cape Town Worcester George Port Elizabeth East London 4 primary processing plants nearly 250m birds per year 2 further processed plants 27,000 tons per year 59


60 OPERATIONAL REVIEW TSB How Selati sugar is made HOW SELATI SUGAR IS MADE 60

61 OPERATIONAL REVIEW TSB TSB Mills Mill Mill Established Tons sugar produced Notes Nkomazi Malalane Nkomazi produces approximately tons of sugar per year Komati Pongola Pongola Pongola produces approximately tons of sugar per year. Adding Pongola to Nkomazi, TSB current produces 29.7% of the total SA production Malalane Mill 61
 Vector Cold Storage (VCS) Vector Primary Transport (VPT)")
 Vector Trade Marketing (VTM) call centres, sales and")

 Sales and Merchndising (VSS)")


62 Services OPERATIONAL REVIEW VECTOR Manufacturers Plant Based Cold Stores (PBCS) Vector Cold Storage (VCS) Vector Primary Transport (VPT) Principal Secondary Distribution (PSD) Customer Secondary Distribution (CSD) Vector Trade Marketing (VTM) call centres, sales and merchandising Credit & Information Management % Proportion of Mix % 2% 34% 22% 8% 5% 19% 12% Principal Secondary Distribution (PSD) Primary Transport (VPT) Customer Secondary Distribution (CSD) Sales and Merchndising (VSS) Bulk Storage (VCS) Plant Based Cold Storage (PBCS) In December 2004 Rainbow acquired the Vector business which comprised 94% Principal Secondary Distribution. Since then: Vector manages the entire Rainbow Outbound Supply Chain Vector now offers a fully integrated and cost effective outbound supply chain to customers and principals The business is more balanced and diversified with service offerings covering the full outbound supply chain 62


63 OPERATIONAL REVIEW VECTOR Customers Principals Customer Secondary Distribution (CSD) Vector is contracted by the customer to deliver their full basket of products directly to the outlets Principal Secondary Distribution (PSD) Vector is contracted by the principal to deliver to all retailers, wholesalers and general trade 63


 Tonnage 605 000 tons pa Eastern Cape Fleet of 372 vehicles (primary 80 / secondary 292)")

64 OPERATIONAL REVIEW VECTOR Infrastructure Limpopo Province Tzaneen Vector infrastructure Windhoek Namibia Botswana Rustenburg North Roodepoort West Free State Polokwane Wolwehoek Mpumalanga Nelspruit Midrand Swaziland Carolina KwaZulu Natal Newcastle National footprint including Windhoek 5 plant-based cold stores 13 distribution sites Capacity pallets Employees Customer Drop Points Northern Cape Bloemfontein Lesotho Hammarsdale Durban cases delivered daily (57.5m cases pa) Tonnage tons pa Eastern Cape Fleet of 372 vehicles (primary 80 / secondary 292) Cape Town Worcester George Western Cape Port Elizabeth East London plant-based cold stores distribution sites ISO and ISO accreditation for all Warehouses ISO and OHSAS across Peninsula, Midrand, Thekwini and Roodepoort 64
Rainbow Chicken Limited (RCL) Group audited results for the year ended 30 June 2012
 Group audited results for the year ended 30 June 2012") Rainbow Chicken Limited () Group audited results for the year ended 30 June 2012 29 August 2012 Introduction During the prior year changed its financial year-end from 31 March to 30 June to align with
Rainbow Chicken Limited () Group audited results for the year ended 30 June 2012 29 August 2012 Introduction During the prior year changed its financial year-end from 31 March to 30 June to align with
Interim Results 6 months ended 30 September 2008
 Interim Results 6 months ended 30 September 2008 2008 highlights Revenue + 15.9% Operating profit - 44.6% 3326,7 2871,4 315,7 2177,8 256,9 1915,2 214,2 174,8 2005 2006 2007 2008 2005 2006 2007 2008 Headline
Rainbow Chicken Limited (RCL) Interim results 6 month period ended 31 December 2012
 Interim results 6 month period ended 31 December 2012") Rainbow Chicken Limited () Interim results 6 month period ended 31 December 2012 20 February 2013 Introduction This presentation covers the results for the 6 month period to December 2012 Historic comparatives
Rainbow Chicken Limited () Interim results 6 month period ended 31 December 2012 20 February 2013 Introduction This presentation covers the results for the 6 month period to December 2012 Historic comparatives
RCL FOODS LIMITED. Audited Results for the Year Ended 30 June 2014 Investor Presentation: 28 August 2014
 RCL FOODS LIMITED Audited Results for the Year Ended 30 June 2014 Investor Presentation: 28 August 2014 Salient features Results summary Strategic overview Key issues and financial review Operational reviews
RCL FOODS LIMITED ( RCL Foods or the Group ) GROUP FINANCIAL RESULTS for the 12 months ended 30 June 2015 and CASH DIVIDEND DECLARATION
 GROUP FINANCIAL RESULTS for the 12 months ended 30 June 2015 and CASH DIVIDEND DECLARATION") RCL FOODS LIMITED ( RCL Foods or the Group ) GROUP FINANCIAL RESULTS for the 12 months ended 30 June 2015 and CASH DIVIDEND DECLARATION SUMMARY CONSOLIDATED RESULTS FINANCIAL HIGHLIGHTS Revenue up 20,1%
RCL FOODS LIMITED ( RCL Foods or the Group ) GROUP FINANCIAL RESULTS for the 12 months ended 30 June 2015 and CASH DIVIDEND DECLARATION SUMMARY CONSOLIDATED RESULTS FINANCIAL HIGHLIGHTS Revenue up 20,1%
INVESTOR PRESENTATION: 29 AUGUST 2018 RESULTS FOR THE YEAR ENDED JUNE 2018
 2018 INVESTOR PRESENTATION: 29 AUGUST 2018 RESULTS FOR THE YEAR ENDED JUNE 2018 MILES DALLY CHIEF EXECUTIVE OFFICER HEADLINES RESULTS FOR THE YEAR ENDED JUNE 2018 PERFORMANCE HEADLINES FINANCIAL HEADLINES
RCL FOODS LIMITED ( RCL FOODS OR GROUP ) UNAUDITED GROUP FINANCIAL RESULTS AND CASH DIVIDEND DECLARATION
 UNAUDITED GROUP FINANCIAL RESULTS AND CASH DIVIDEND DECLARATION") 20 17 RCL FOODS LIMITED ( RCL FOODS OR GROUP ) UNAUDITED GROUP FINANCIAL RESULTS AND CASH DIVIDEND DECLARATION FOR THE SIX MONTHS ENDED 31 DECEMBER 2016 FINANCIAL HIGHLIGHTS ABRIDGED CONSOLIDATED UNAUDITED
20 17 RCL FOODS LIMITED ( RCL FOODS OR GROUP ) UNAUDITED GROUP FINANCIAL RESULTS AND CASH DIVIDEND DECLARATION FOR THE SIX MONTHS ENDED 31 DECEMBER 2016 FINANCIAL HIGHLIGHTS ABRIDGED CONSOLIDATED UNAUDITED
RCL FOODS LIMITED ( RCL FOODS OR GROUP ) UNAUDITED GROUP FINANCIAL RESULTS AND CASH DIVIDEND DECLARATION
 UNAUDITED GROUP FINANCIAL RESULTS AND CASH DIVIDEND DECLARATION") RCL FOODS LIMITED ( RCL FOODS OR GROUP ) UNAUDITED GROUP FINANCIAL RESULTS AND CASH DIVIDEND DECLARATION FOR THE SIX MONTHS ENDED DECEMBER 2017 REVENUE R12,8 billion 2.4% EBITDA R1 201,0 million 33.4%
RCL FOODS LIMITED ( RCL FOODS OR GROUP ) UNAUDITED GROUP FINANCIAL RESULTS AND CASH DIVIDEND DECLARATION FOR THE SIX MONTHS ENDED DECEMBER 2017 REVENUE R12,8 billion 2.4% EBITDA R1 201,0 million 33.4%
Annual Results Presentation. for the year ended 30 September 2014
 Annual Results Presentation for the year ended 30 September 2014 AGENDA Business Overview Poultry Industry Trends Financial Overview Industry Matters Prospects Q & A 2 2 BUSINESS OVERVIEW 3 THE PERIOD
Group Results Presentation for the six months ended 31 March 2016
 Group Results Presentation for the six months ended 31 March 2016 Index Overview Financial performance Operational performance Outlook 2 Overview Noel Doyle Chief Operating Officer Disclaimer Forward-looking
For personal use only
 HY14 Results 15 May 2014 Disclaimer This presentation includes both information that is historical in character and information that consists of forward looking statements. Forward looking statements are
TONGAAT HULETT AUDITED RESULTS FOR THE YEAR ENDED 31 MARCH 2011
 1 TONGAAT HULETT AUDITED RESULTS FOR THE YEAR ENDED 31 MARCH 2011 Revenue of R9,681 billion (2010: R8,789 billion) Profit from operations of R1,338 billion (2010: R1,500 billion) Headline earnings of R806
TONGAAT HULETT INTERIM RESULTS FOR THE SIX MONTHS ENDED 30 SEPTEMBER 2017
 1 TONGAAT HULETT INTERIM RESULTS FOR THE SIX MONTHS ENDED 30 SEPTEMBER 2017 Revenue of R8,118 billion (2016: R8,503 billion) - 4,5% Operating profit of R1,471 billion (2016: R1,350 billion) +9,0% Headline
LRS INFLATION MONITOR JANUARY 2015
 LRS INFLATION MONITOR JANUARY 201 1 CPI SLOWED SLIGHTLY TO.% IN JANUARY 201 KEY FINDINGS Inflation measures how much more expensive a set of goods and services has become over a certain period, usually
AVI Limited presentation to shareholders & analysts for the year ended June 2018
 AVI Limited presentation to shareholders & analysts for the year ended June 2018 AGENDA Key features and results history Group financial results Business unit performance Prospects Questions and answers
AVI Limited presentation to shareholders & analysts for the six months ended 31 December 2017
 AVI Limited presentation to shareholders & analysts for the six months ended 31 December 2017 AGENDA Key features and results history Group financial results Performance and prospects Questions and answers
ANNUAL RESULTS PRESENTATION
 ANNUAL RESULTS PRESENTATION FOR THE YEAR ENDED 30 SEPTEMBER 2016 CONTENTS 2 Annual Results Presentation 8 Financial Performance 19 Divisional Performance 19 Essential Foods 26 Groceries 35 International
AUDITED RESULTS FOR THE YEAR ENDED 31 DECEMBER 2016
 AUDITED RESULTS FOR THE YEAR ENDED 31 DECEMBER 2016 AGENDA 2 1 Opening remarks / market update 2 Financial results 3 Operational review 4 Strategy update 5 Outlook 1 2 3 4 5 OPENING REMARKS / MARKET UPDATE
PRELIMINARY AUDITED SUMMARISED CONSOLIDATED RESULTS AND CASH DIVIDEND DECLARATION FOR THE YEAR ENDED 30 SEPTEMBER 2018 KEY FEATURES
 RHODES FOOD GROUP HOLDINGS LIMITED (Incorporated in the Republic of South Africa) Registration number: 2012/074392/06 JSE share code: RFG ISIN: ZAE000191979 PRELIMINARY AUDITED SUMMARISED CONSOLIDATED
TONGAAT HULETT INTERIM RESULTS FOR THE HALF-YEAR ENDED 30 SEPTEMBER 2011
 1 TONGAAT HULETT INTERIM RESULTS FOR THE HALF-YEAR ENDED 30 SEPTEMBER 2011 Revenue of R6,027 billion (2010: R4,724 billion) +27,6% Profit from operations of R1,047 billion (2010: R963 million) +8,7% Total
Knowledge is too important to leave in the hands of the bosses INFLATION MONITOR MARCH 2018
 Knowledge is too important to leave in the hands of the bosses INFLATION MONITOR MARCH 2018 1 The Consumer Price Index (CPI) declined to 3.8% in March 2018 The term inflation means a sustained increase
Interim Results FOR THE SIX MONTHS ENDED 30 SEPTEMBER 2016
 Interim Results FOR THE SIX MONTHS ENDED 30 SEPTEMBER 2016 1 AGENDA INTRODUCTION Martin Davey, Chairman HIGHLIGHTS Adam Couch, CEO FINANCIAL REVIEW Mark Bottomley, Finance Director COMMERCIAL REVIEW Jim
FINANCIAL RESULTS. for the twelve months ending 31 March 2015
 FINANCIAL RESULTS for the twelve months ending 31 March 2015 AGENDA 1. Introduction 2. Financial Overview 3. Market overview 4. Strategic Response 5. Prospects 2 GROUP OVERVIEW Gavin Dalgleish, Managing
Annual Results Presentation for the 12 months ended 30 September 2018
 Annual Results Presentation for the 12 months ended 30 September 2018 AGENDA Business Page 3 / Slide 3 Operational Page 5 / Slide 8 Industry Trends Page 12 / Slide 21 Financial Page 16 / Slide 29 Outlook
ANNUAL RESULTS PRESENTATION. for the year ended 30 September 2016
 ANNUAL RESULTS PRESENTATION for the year ended 30 September 2016 What a year!! Salient Features: Massive discontinuities Drought Rand volatility Wheat duty So Portfolio and brand strength matters (size
GROUP RESULTS PRESENTATION For the year ended 30 September 2017
 GROUP RESULTS PRESENTATION For the year ended 30 September 2017 Index Overview Financial & operational performance Strategy update 2 Disclaimer Forward-looking statement This document contains forward
RESULTS For the year ended 30 September 2011
 RESULTS For the year ended 30 September 2011 AGENDA Highlights Patrick Coveney, CEO Financial Review Alan Williams, CFO Operating Review & Strategy Patrick Coveney, CEO Outlook Patrick Coveney, CEO Q &
ANNUAL RESULTS PRESENTATION FOR THE 12 MONTHS ENDED 30 SEPTEMBER 2017
 ANNUAL RESULTS PRESENTATION FOR THE 12 MONTHS ENDED 30 SEPTEMBER 2017 AGENDA Business Overview Page 3 Industry Trends Page 20 The Period in Perspective Page 28 Financial Overview Page 30 Industry Matters
KAP INDUSTRIAL HOLDINGS LIMITED UNAUDITED RESULTS FOR THE SIX MONTHS ENDED 31 DECEMBER 2018
 KAP INDUSTRIAL HOLDINGS LIMITED INTEGRATED INTO EVERY DAY INTRODUCTION JAAP DU TOIT CHAIRMAN AGENDA INTRODUCTION JAAP DU TOIT UNAUDITED INTERIM RESULTS FOR THE SIX STRATEGY MONTHS IMPLEMENTATION ENDED
Kerry Preliminary Results Presentation
 Kerry - 2006 Preliminary Results Presentation Review of Business Hugh Friel Financial Review Brian Mehigan Business Growth Prospects Hugh Friel Q&A 2006 Performance Highlights Revenue growth of 4.9% to
Tegel Group Holdings Limited
 Tegel Group Holdings Limited FY17 Interim Results Presentation 15 December 2016 TEGEL GROUP HOLDINGS LIMITED FY17 INTERIM RESULTS 1 Disclaimer This presentation contains summary information about Tegel
ADMINISTERED PRICES AND AGRICULTURE. Christo Joubert CEO Forum 09 May
 ADMINISTERED PRICES AND AGRICULTURE Christo Joubert CEO Forum 09 May 2011 1 ON THE MENU Putting thing in context Administered and regulated prices: Some general trends Administered and regulated prices:
Astral Foods Limited Incorporated in the Republic of South Africa Registration number 1978/003194/06 Share code: ARL ISIN: ZAE
 Astral Foods Limited Incorporated in the Republic of South Africa Registration number 1978/003194/06 Share code: ARL ISIN: ZAE000029757 AUDITED SUMMARY CONSOLIDATED RESULTS AND DIVIDEND DECLARATION FOR
For personal use only
 Tegel Group Holdings Limited FY18 Interim Results Presentation 6 December 2017 1 TEGEL GROUP HOLDINGS FY18 INTERIM RESULTS PRESENTATION Disclaimer This presentation contains summary information about Tegel
FINANCIAL STATEMENTS for the year ended 30 June 2015
 FINANCIAL STATEMENTS REGULATORY APPROVALS Approval of the annual financial statements 1 Certificate by the Company Secretary 1 Report of the directors 2 Independent auditor s report to the shareholders
Statistical release P0141
 Statistical release Consumer Price Index June 2015 Embargoed until: 22 July 2015 10:00 Enquiries: Forthcoming issue: Expected release date Marietjie Bennett / Anita Voges July 2015 19 August 2015 (012)
GENERAL MILLS. Fiscal 2018 Third Quarter Results. March 21, 2018
 GENERAL MILLS Fiscal 2018 Third Quarter Results March 21, 2018 A Reminder on Forward-looking Statements This presentation contains forward-looking statements within the meaning of the Private Securities
Statistical release P0141
 Statistical release Consumer Price Index September 2010 Embargoed until: 27 October 2010 11:30 Enquiries: Forthcoming issue: Expected release date User information services October 2010 24 November 2010
Interim Results. Six months ended 31 August 2016
 Interim Results Six months ended 31 August 2016 Stefanutti Stocks City A multi-disciplinary construction group (Vision) (Mission) 2 www.stefanuttistocks.com y 2 Agenda Six month overview Operational Overview
Looking to the medium term
 Looking to the medium term Issued: 4 September 2013 Legal notice This presentation has been prepared to inform investors and prospective investors in the secondary markets about the Group and does not
Period overview Operational Overview Financial Results Conclusion
 Interim Results Six months ended 31 ust 2015 Bridging y expectations Agenda Period overview Operational Overview Financial Results Conclusion Bridging y expectations 2 1 Six month overview Satisfactory
McCormick & Company, Inc. Fourth quarter 2010 financial results and business outlook January 26, 2011
 McCormick & Company, Inc. Fourth quarter 2010 financial results and business outlook January 26, 2011 The following slides accompany a January 26, 2011 presentation to investment analysts. This information
Consumer Price Index
 STATISTICAL RELEASE P0141 Consumer Price Index May 2017 Embargoed until: 21 June 2017 10:00 ENQUIRIES: FORTHCOMING ISSUE: EXPECTED RELEASE DATE Marietjie Bennett / June 2017 19 July 2017 Evashnie Govender
Inghams Group Limited. FY2018 Results Presentation
 Inghams Group Limited FY2018 Results Presentation 22 AUGUST 2018 Important notice and disclaimer Disclaimer The material in this presentation is general background information about the activities of Inghams
Tiger Brands Limited. Group Results Presentation. for the year ended 30 September 2015
 Tiger Brands Limited Group Results Presentation for the year ended 30 September 2015 2 Index Strategic review 3 Strategic review Peter Matlare Chief Executive Officer 4 Key strategic deliverables 1 Improve
2015 ANNUAL RESULTS PRESENTATION
 2015 ANNUAL RESULTS PRESENTATION Francois Kuttel & Imraan Soomra AGENDA Group Overview Financial Review Operational Review & Outlook Guidance GROUP OVERVIEW South Africa s most empowered listed company
A comprehensive view of the state of the residential rental market in South Africa Q JAN - MAR
 A comprehensive view of the state of the residential rental market in South Africa JAN - MAR PayProp Rental Index Quarterly The current downward trend in the South African economy appears to be taking
Interim Results 2019 March 2019
 Interim Results 2019 March 2019 Disclaimer This presentation may contain forward-looking statements and projections. There can be no certainty of outcome in relation to the matters to which the forward-looking
Dedicated to Value Massmart Reviewed Results for the six months to December 2012
 Dedicated to Value Massmart Reviewed Results for the six months to December 2012 Presentation to Investors, Analysts and Media February 2013 Agenda Highlights Operations Financials Environment Strategy
Jamaica Broilers Group Ltd. Commentary on un-audited 3rd quarter results
 1 Jamaica Broilers Group Ltd Commentary on un-audited 3rd quarter results The Directors of Jamaica Broilers Group Ltd are pleased to release the un-audited financial results for the quarter ended January
Tongaat Hulett Limited Registration No: 1892/000610/06 JSE share code: TON ISIN: ZAE Audited Results for the year ended 31 March 2012
 Tongaat Hulett Limited Registration No: 1892/000610/06 JSE share code: TON ISIN: ZAE000096541 Audited Results for the year ended 31 March 2012 - Revenue of R12,081 billion (2011: R9,681 billion) +24,8%
TRELLIDOR HOLDINGS LIMITED AUDITED RESULTS FOR THE YEAR ENDED 30 JUNE 2016
 TRELLIDOR HOLDINGS LIMITED AUDITED RESULTS FOR THE YEAR ENDED 30 JUNE 2016 OVERVIEW Trellidor is the market leading manufacturer of custom made barrier security products Distribution through dedicated
Financial Results 2016
 Financial Results 2016 March 29 th, 2017 Website: www.dairibord.com Presentation Outline Operating Environment A Mandiwanza Performance Highlights Volumes and Revenue Review Financials M Ndoro Outlook
AUDITED RESULTS FOR THE YEAR ENDED 31 DECEMBER 2015
 AUDITED RESULTS FOR THE YEAR ENDED 31 DECEMBER 2015 AGENDA 2 1 Opening remarks / market update Richard 2 Financial results David 3 Operational review Richard 4 Strategy update Richard 5 Outlook Richard
CONTENTS FINANCIAL REVIEW 5 OPERATIONS PRODUCT GROUPS 26 STORE DEVELOPMENT AND PERFORMANCE ANALYSIS 37 SUMMARY AND STRATEGIC OVERVIEW 43
 AUDITED INTERIM RESULTS AND DIVIDEND DECLARATION DECEMBER CONTENTS FINANCIAL REVIEW 5 OPERATIONS PRODUCT GROUPS 26 STORE DEVELOPMENT AND PERFORMANCE ANALYSIS 37 SUMMARY AND STRATEGIC OVERVIEW 43 FINANCIAL
Investor Presentation June Henry Demone, CEO Kelly Nelson, CFO
 Investor Presentation June 2013 Henry Demone, CEO Kelly Nelson, CFO Disclaimer Certain statements made in this presentation are forward-looking and are subject to important risks, uncertainties and assumptions
Rural and Small Farmer Finance - Africa and South Africa
 Rural and Small Farmer Finance - Africa and South Africa Gerhard Coetzee Centre for Microfinance, University of Pretoria and Head of ABSA Micro Enterprise Finance Presentation to the Procasur Study Group
Investor Roadshow December 2010
 Investor Roadshow December 2010 1 A Spreading Geography OPERATING TERRITORIES KEY EXPORT MARKETS 2 A Strategy For Growth Market Volume Growth 2-3% Organic Growth Developing Cold-Drink Distribution Innovation
Availability, Reliability, Ease. 11 September 2018
 Availability, Reliability, Ease 11 September 2018 LEGAL NOTICE This presentation has been prepared to inform investors and prospective investors in the secondary markets about the Group and does not constitute
PREMIUM BRANDS HOLDINGS CORPORATION ANNOUNCES RECORD SECOND QUARTER SALES AND EARNINGS AND DECLARES THIRD QUARTER DIVIDEND
 PREMIUM BRANDS HOLDINGS CORPORATION ANNOUNCES RECORD SECOND QUARTER SALES AND EARNINGS AND DECLARES THIRD QUARTER DIVIDEND VANCOUVER, B.C., August 13,. Premium Brands Holdings Corporation (TSX: PBH), a
ARYZTA AG. FY 2016 Results. 26 September 2016
 ARYZTA AG FY 2016 Results 26 September 2016 Forward Looking Statement This document contains forward looking statements which reflect management s current views and estimates. The forward looking statements
John Wilson - Chairman. Fonterra Co-operative Group Ltd. #
 John Wilson - Chairman # Key highlights FORECAST CASH PAYOUT $6.12 Forecast Farmgate Milk Price lifted to $5.80 kgms. The full year dividend forecast remains at 32 cps VOLUME: MILK COLLECTIONS 6% Record
RESULTS PRESENTATION FOR THE 52 WEEKS ENDED 25 FEBRUARY 2018
 RESULTS PRESENTATION FOR THE 52 WEEKS ENDED 25 FEBRUARY 2018 1 Chairman s introduction Gareth Ackerman Chairman 2 3 Results overview Bakar Jakoet Chief Finance Officer Progress on our plan Richard Brasher
The J. M. Smucker Company
 The J. M. Smucker Company ACQUISITION OF BIG HEART PET BRANDS February 3, 2015 Forward Looking Statement This presentation contains forward-looking statements that are subject to known and unknown risks
Review of annual results for the 52 weeks ended 12 September November 2009
 Review of annual results for the 52 weeks ended 12 September 2009 3 November 2009 Business Highlights!! Good results in difficult economic times!! Considerable progress in development of group!! Strong
Biannual Economic and Capacity Survey. July December2017
 Biannual Economic and Capacity Survey July December2017 1 Firm distribution based on Annual Turnover (based on responses received) July December 2017 Full survey Category by gross annual income % of firms
12 month overview. Operational Overview. Financial Results. Conclusion
 Annual Results 12 months ended 29 ruary 2016 Agenda 12 month overview Operational Overview Financial Results Conclusion 2 1 12 month overview Reasonable financial performance in current market All Business
Summary consolidated financial statements
 Incorporated in the Republic of South Africa Registration number: 2013/208598/06 Tax registration number 9095455193 Share code: QFH (ISIN code: ZAE000193686) ( Quantum Foods or the Group or the Company
INTERIM RESULTS PRESENTATION
 INTERIM RESULTS PRESENTATION for the six months ended 31 March 2016 Agenda Strategic Update Financial Performance Divisional Performance Outlook and Imperatives 1 Strategic Update Phil Roux CEO 2 Environmental
UNAUDITED RESULTS FOR THE SIX MONTHS ENDED 31 DECEMBER 2016
 CAXTON AND CTP PUBLISHERS AND PRINTERS LIMITED Incorporated in the Republic of South Africa Registration number 1947/026616/06 Share code: CAT ISIN code: ZAE000043345 Preference share code:catp ISIN code:zae000043352
GENERAL MILLS. Fiscal 2018 Second Quarter Results. December 20, 2017
 GENERAL MILLS Fiscal 2018 Second Quarter Results December 20, 2017 A Reminder on Forward-looking Statements This presentation contains forward-looking statements within the meaning of the Private Securities
Financial Results for Fourth Quarter and Year Ended December 30, Pilgrim s Pride Corporation (NASDAQ: PPC)
") Financial Results for Fourth Quarter and Year December 30, 2018 Pilgrim s Pride Corporation (NASDAQ: PPC) Cautionary Notes and Forward-Looking Statements Statements contained in this presentation that
Financial Results for Fourth Quarter and Year December 30, 2018 Pilgrim s Pride Corporation (NASDAQ: PPC) Cautionary Notes and Forward-Looking Statements Statements contained in this presentation that
2010 Annual Results. November 2010
 2010 Annual Results November 2010 1 Agenda Highlights Group results Operational review Strategic Update 2 Highlights Operating profit up 126% Trading margin improved from 5.8% to 8.3% Sale/closure of under-performers
Financial Results for Third Quarter Ended Sep 30, Pilgrim s Pride Corporation (NASDAQ: PPC)
") Financial Results for Third Quarter Ended Sep 30, 2018 Pilgrim s Pride Corporation (NASDAQ: PPC) Cautionary Notes and Forward-Looking Statements Statements contained in this presentation that share our
Financial Results for Third Quarter Ended Sep 30, 2018 Pilgrim s Pride Corporation (NASDAQ: PPC) Cautionary Notes and Forward-Looking Statements Statements contained in this presentation that share our
Responsible investment in growth
 Responsible investment in growth Issued: 17 June 2014 Legal notice This presentation has been prepared to inform investors and prospective investors in the secondary markets about the Group and does not
AUDITED ANNUAL RESULTS FOR THE YEAR ENDED 31 DECEMBER 2018
 AUDITED ANNUAL RESULTS FOR THE YEAR ENDED 31 DECEMBER 2018 20 18 CONTENTS Overview Market review Operational review Financial review Outlook 01 OVERVIEW Safety Financial Operations Social 25.8% 13.2%
ANNUAL RESULTS PRESENTATION. for the year-ended 30 September 2015
 ANNUAL RESULTS PRESENTATION for the year-ended 30 September 2015 Agenda Pioneer Foods Introduction Phil Roux Financial review Cindy Hess Divisional reviews o Essential Foods Carstens o Groceries Lombard
Interim Results Presentation For six months to June Saving our customers money so they can live better
 Interim Results Presentation For six months to June 2017 Saving our customers money so they can live better Agenda 1 Financial review 2 Operational review 3 Strategy & prospects Financial Review Hans van
TONGAAT HULETT AUDITED RESULTS FOR THE YEAR ENDED 31 MARCH 2013
 1 TONGAAT HULETT AUDITED RESULTS FOR THE YEAR ENDED 31 MARCH 2013 Revenue of R14,373 billion (2012: R12,081 billion) +19,0% Profit from operations of R2,145 billion (2012: R1,921 billion) +11,7% Cash flow
For personal use only
 11 May 2017 The Manager Company Announcements Office ASX Limited 20 Bridge Street SYDNEY NSW 2000 GRAINCORP LIMITED: GNC INVESTOR PRESENTATION FINANCIAL HALF YEAR ENDED 31 MARCH 2017 Please find attached
INTERIM FINANCIAL RESULTS
 Presentation Tuesday, 14 November 2017 INTERIM FINANCIAL RESULTS For the six months ended 30 September 2017 Contents EXECUTIVE OVERVIEW FINANCIAL REVIEW OPERATIONAL REVIEW OUTLOOK & STRATEGY Presented
Patrick Kelly. The new CPI: Sources, methods and results
 Patrick Kelly The new CPI: Sources, methods and results Contents Understanding the CPI Key changes to the CPI in 2009 Results Looking forward Objectives of the CPI CPI is a measure of average price changes
Business Update. USPP Conference Miami. Luis Damasceno Group CFO Michael Williams Group Finance Director & Treasurer January 2019
 Business Update USPP Conference Miami Luis Damasceno Group CFO Michael Williams Group Finance Director & Treasurer 23-25 January 2019 www.alsglobal.com IMPORTANT NOTICE AND DISCLAIMER This presentation
INTERIM RESULTS PRESENTATION FOR THE SIX MONTHS ENDED 31 MARCH 2017
 INTERIM RESULTS PRESENTATION FOR THE SIX MONTHS ENDED 31 MARCH 2017 SALIENT FEATURES 1 ST HALF Regression in consumer confidence and spending No business is insulated by past success Considered choices
2.9% 16.8% 22.9% 31.7% 40.1%
 Results for the 52 weeks ended 30 December 2018 PERFORMANCE SUMMARY Like-on-like 52-week basis* Massmart, with total sales of R90.9 billion, comprises four Divisions operating in 436 stores, in 13 sub-saharan
COSATU Submission the Proposed Sugar Sweetened Beverages Tax 14 February 2017 Submitted to:
 COSATU Submission the Proposed Sugar Sweetened Beverages Tax 14 February 2017 Submitted to: Standing and Portfolio Committees on Finance and Health Parliament Republic of South Africa 1 1. Introduction
Electrocomponents 2017 half-year financial results. 18 November 2016
 Electrocomponents 2017 half-year financial results 18 November 2016 Agenda Overview of results Lindsley Ruth Financial results and performance update David Egan Performance Improvement Plan Lindsley Ruth
GENERAL MILLS FISCAL 2019 SECOND-QUARTER EARNINGS DECEMBER 19, 2018
 GENERAL MILLS FISCAL 2019 SECOND-QUARTER EARNINGS DECEMBER 19, 2018 1 A Reminder on Forward-looking Statements This presentation contains forward-looking statements within the meaning of the Private Securities
2011 Annual Results. November 2011
 2011 Annual Results November 2011 1 Agenda Highlights Group results Operational review Strategic review 2 Highlights HEPS from continuing operations up 21% Dividend increased by 30% to 108 cents per share
Preliminary Results Announcement
 Preliminary Results Announcement JIM SUTCLIFFE Chief Executive Introduction 23 rd February Day s agenda UK 09:00 10:00 10:30 11:00 12:00 12:45 SA 11:00 12:00 12:30 13:00 14:00 14:45 OM analyst presentation
Interim Results 2018
 Interim Results 2018 Forward looking statements We may make statements that are not historical facts and relate to analyses and other information based on forecasts of future results and estimates of amounts
Pilgrim s Pride Corporation (NASDAQ: PPC) Pilgrim s Acquires Moy Park September 11, 2017
 Pilgrim s Acquires Moy Park September 11, 2017") Pilgrim s Pride Corporation (NASDAQ: PPC) Pilgrim s Acquires Moy Park September 11, 2017 Cautionary Notes and Forward-Looking Statements Statements contained in this presentation that share our intentions,
Pilgrim s Pride Corporation (NASDAQ: PPC) Pilgrim s Acquires Moy Park September 11, 2017 Cautionary Notes and Forward-Looking Statements Statements contained in this presentation that share our intentions,
KAP INDUSTRIAL HOLDINGS LIMITED (KAP) UNAUDITED INTERIM RESULTS FOR THE SIX MONTHS ENDED 31 DECEMBER 2017
 UNAUDITED INTERIM RESULTS FOR THE SIX MONTHS ENDED 31 DECEMBER 2017") KAP INDUSTRIAL HOLDINGS LIMITED (KAP) UNAUDITED INTERIM RESULTS FOR THE SIX MONTHS ENDED 31 DECEMBER 2017 WELCOME JAAP DU TOIT CHAIRMAN AGENDA WELCOME UNAUDITED INTERIM RESULTS FOR THE SIX STRATEGY MONTHS
KAP INDUSTRIAL HOLDINGS LIMITED (KAP) UNAUDITED INTERIM RESULTS FOR THE SIX MONTHS ENDED 31 DECEMBER 2017 WELCOME JAAP DU TOIT CHAIRMAN AGENDA WELCOME UNAUDITED INTERIM RESULTS FOR THE SIX STRATEGY MONTHS
FONTERRA INTERIM RESULTS 2014
 FONTERRA INTERIM RESULTS 2014 Market Briefing FONTERRA CO-OPERATIVE GROUP LIMITED Overview John Wilson Chairman 2 Working Area Safee Copy Frame. This denotes working area and must be deleted before final
Dedicated to Value Massmart Reviewed Interim Results for the six months to 23 June Presentation to Investors, Analysts and Media August 2013
 Dedicated to Value Massmart Reviewed Interim Results for the six months to 23 June 2013 Presentation to Investors, Analysts and Media August 2013 Agenda Highlights Operations Financials Performance Summary
FY17 Results. 25 September 2017
 FY17 Results 25 September 2017 Forward Looking Statement This document contains forward looking statements, which reflect management s current views and estimates. The forward looking statements involve
ARYZTA AG. H1 Results, FY 2013 Fixed Income Investor Presentation 11 March 2013
 ARYZTA AG H1 Results, FY 2013 Fixed Income Investor Presentation 11 March 2013 Forward Looking Statement This document contains forward looking statements which reflect management s current views and estimates.
CONTENTS. Investment case 2. Summary consolidated financial statements 55. Directors responsibility 55. About this report 4
 Integrated report 2016 OUR BRANDS CONTENTS Investment case 2 About this report 4 Quantum Foods at a glance 11 Value chain and business model 13 Financial and non-financial highlights 16 Business overview
SABMiller plc. Full year results Twelve months ended 31 March Graham Mackay, Chief Executive Jamie Wilson, Chief Financial Officer.
 SABMiller plc Full year results Twelve months ended 31 March 2012 Graham Mackay, Chief Executive Jamie Wilson, Chief Financial Officer 24 May 2012 Forward looking statements This presentation includes
Availability, Reliability, Ease. 11 December 2018
 Availability, Reliability, Ease 11 December 2018 LEGAL NOTICE This presentation has been prepared to inform investors and prospective investors in the secondary markets about the Group and does not constitute