First Quarter 2017 Conference Call & Webcast. May 3, 2017
|
|
|
- Harry Goodwin
- 5 years ago
- Views:
Transcription

1 First Quarter 2017 Conference Call & Webcast May 3, 2017
2 Welcome and Participants Vyomesh Joshi President & Chief Executive Officer John McMullen Executive Vice President & Chief Financial Officer Andy Johnson Executive Vice President & Chief Legal Officer Stacey Witten To participate via phone, please dial: US: Outside the US: Vice President, Investor Relations 2
3 Forward Looking Statements This presentation contains certain statements that are not statements of historical or current facts are forward-looking statements within the meaning of the Private Securities Litigation Reform Act of Forward-looking statements include statements concerning plans, objectives, goals, strategies, expectations, intentions, projections, developments, future events, performance or products, underlying assumptions, and other statements which are other than statements of historical facts. In some cases, you can identify forward-looking statements by terms such as believes, beliefs, ''may,'' ''will,'' ''should,'' expects,'' ''intends,'' ''plans,'' ''anticipates,'' ''estimates,'' ''predicts,'' ''projects,'' ''potential,'' ''continue,'' and other similar terminology or the negative of these terms. From time to time, we may publish or otherwise make available forward-looking statements of this nature. All such forward-looking statements, whether written or oral, and whether made by us or on our behalf, are expressly qualified by the cautionary statements described on this message including those set forth below. Forward-looking statements are based upon management s beliefs, assumptions and current expectations concerning future events and trends, using information currently available, and are necessarily subject to uncertainties, many of which are outside our control. In addition, we undertake no obligation to update or revise any forward-looking statements made by us or on our behalf, whether as a result of future developments, subsequent events or circumstances, or otherwise, or to reflect the occurrence or likelihood of unanticipated events, and we disclaim any such obligation. Forward-looking statements are only predictions that relate to future events or our future performance and are subject to known and unknown risks, uncertainties, assumptions, and other factors, many of which are beyond our control, that may cause actual results, outcomes, levels of activity, performance, developments, or achievements to be materially different from any future results, outcomes, levels of activity, performance, developments, or achievements expressed, anticipated, or implied by these forward-looking statements. Although we believe that the expectations reflected in the forward-looking statements are reasonable, forward-looking statements are not, and should not be relied upon as a guarantee of future performance or results, nor will they necessarily prove to be accurate indications of the times at or by which any such performance or results will be achieved. 3D System s actual results could differ materially from those stated or implied in forward-looking statements. Past performance is not necessarily indicative of future results. We do not undertake any obligation to and do not intend to update any forward-looking statements whether as a result of future developments, subsequent events or circumstances or otherwise. Further, we encourage you to review Risk Factors in Part 1 of our Annual Report on Form 10-K and Part II of our quarterly reports on Form 10-Q filed with the SEC as well as other information about us in our filings with the SEC. These are available at 3
4 Vyomesh Joshi (VJ) President & Chief Executive Officer


5 Overview and Highlights Driving shift from prototyping to production with solutions that deliver improved productivity, repeatability, durability and total cost of operations Continued strength in healthcare, production printers and materials Clear progress in quality, reliability, supply chain and overall cost structure Positive feedback received from customers and industry on our breakthrough Figure 4 technology platform and our expansion in the healthcare market 5

6 Financial Highlights In the first quarter of 2017: Revenue increased 3%, or 4% at constant currency Expanded GPM to 51.3% Lower SG&A expenses by balancing investments with cost savings initiatives Increased focused R&D, including investments in Figure 4, materials and software Non-GAAP EPS increased 20% and GAAP EPS improved 44% Cash flow from operations of $19 million Reiterate previously provided 2017 full year guidance 6
7 John McMullen Executive Vice President & Chief Financial Officer
8 Operating Results GAAP ($ in millions, except per share) Revenue Gross Profit Gross Profit Margin Operating Expenses % of Revenue Operating Income (Loss) % of Revenue Net Income (Loss) % of Revenue Income (Loss) Per Share First Quarter Y/Y Favorable (Unfavorable) $ $ % $ 80.2 $ % 51.3% 50.8% 50 bps $ 89.3 $ % 57.1% 61.8% ($9.1) ($16.8) 46% (5.8%) (11.0%) ($10.0) ($17.8) 44% (6.4%) (11.7%) ($0.09) ($0.16) 44% 8
9 Operating Results Non-GAAP ($ in millions, except per share) Revenue Gross Profit Gross Profit Margin Operating Expenses % of Revenue Operating Income % of Revenue Net Income % of Revenue Earnings Per Share First Quarter Y/Y Favorable (Unfavorable) $ $ % $ 80.3 $ % 51.3% 50.9% 40 bps $ 72.3 $ % 46.2% 47.8% $8.0 $4.7 71% 5.1% 3.1% $7.1 $5.2 37% 4.5% 3.4% $0.06 $ % We use non-gaap measures to supplement our financial statements presented on a GAAP basis because management believes non-gaap financial measures are useful to investors in evaluating our operating performance and to facilitate a better understanding of the impact that strategic acquisitions, non-recurring charges and certain non-cash expenses had on our financial results. 9
10 Revenue Drivers Q Compared to Q1 2016: Healthcare solutions increased 29% Software was flat On demand manufacturing decreased 6% Printers decreased 4% Materials increased 11% 10

11 Gross Profit & Margin GPM improved to 51.3% in the first quarter of 2017 Executing plans to reduce costs and improve supply chain and manufacturing efficiency $ in millions - Charges related to portfolio prioritization negatively impacted Q GAAP GPM 11

12 Operating Expenses Non-GAAP SG&A expenses decreased 6% and GAAP SG&A expenses decreased 10% R&D expenses increased 13%, including investment in Figure 4 development Balanced investments in go to market and innovation while driving operational excellence $ in millions 12

13 Cash and Balance Sheet Generated $19 million of cash from operations in Q Cash balance of $162 million at March 31, 2017, after paying for the acquisition of Vertex Global Driving working capital improvements 13
14 Reiterate 2017 Guidance Revenue growth between 2% and 8% In the range of $643 million to $684 million GAAP EPS improvement of 106% to 117% In the range of $0.02 to $0.06 per share Non-GAAP EPS increase of 10% to 20% In the range of $0.51 to $0.55 per share Continued positive cash flow from operations 14
15 Vyomesh Joshi (VJ) President & Chief Executive Officer

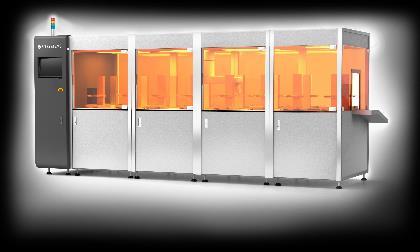
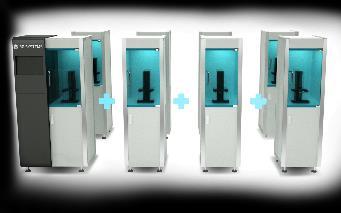
16 Scalable, Modular Figure 4 Platform Low Volume Platform Mid-Volume Platform Automated Production Customer Application Examples Dental Labs Production line for Start-up Complex part production line for Industrial Company Parts Volume Low Mid High Materials NextDent 3D Systems broad materials portfolio 3D Systems broad materials portfolio Material Handling Hand Pour Automated materials delivery system Automated materials delivery system Print Engine Figure 4 Module 2 Figure 4 Modules 16+ Figure 4 Modules Post Processing Manual or automated Manual or automated Fully Automated Workflow Cloud based, Automated Dental Workflow Cloud based MT Connect, Production workflow Cloud based MT Connect, Enterprise Production Workflow 16
 225 x Higher Facility Floor Space (sq ft) 26 x")
 Improvement Cost Per Part (in dollars) 71% Lower Average Print Time Per Part (in hours) 14.1 x Faster Material Waste (in grams) 1.")
17 Disruptive Total Cost of Operations Illustrative Example Figure 4 vs. Traditional SLA Figure 4 Production Configuration with 16 Print Engines Improvement Printers Required 225 x Fewer Annual Throughput Per Printer (prints) 225 x Higher Facility Floor Space (sq ft) 26 x Lower Printer Upkeep Labor 45 x Lower Labor Cost 4 x Lower Initial Investment 23 x Lower TCO - 5 Years, Full Fleet 3.5 x Lower Part (1 million units per year) Improvement Cost Per Part (in dollars) 71% Lower Average Print Time Per Part (in hours) 14.1 x Faster Material Waste (in grams) 1.5 x Lower -Figures in table are estimates based on the results of 3D Systems tests conducted in a laboratory setting. Fewer printers required, better throughput, lower direct labor costs and higher materials utilization contribute to lower total cost of operations Cost per Figure 4 produced parts approximately 30% of traditional SLA 17


18 Replicate and Scale Across Industries Teaching & Training 18


19 Delivering on Making 3D Production Real Focusing on production customer needs productivity, durability, repeatability and total cost of operations Accelerating innovation in precision metals solutions Developing solutions that combine hardware, materials and software to accelerate adoption of 3D production, expand the market and drive profitable growth 19

20 Q&A Session In the USA: Outside the USA:
21 Thank You
22 Appendix
23 GAAP to Non-GAAP Reconciliation Q1 Quarter Ended March 31, 2017 Quarter Ended March 31, 2016 (in thousands, except per share amounts) GAAP Amortization, Stock-Based Compensatio n & Other Legal and Acquisition- Related Portfolio Restructuring Non-GAAP GAAP Amortization, Stock-Based Compensatio n & Other Legal and Acquisition- Related Portfolio Restructuring Non-GAAP Revenue $ 156,431 $ $ $ $ 156,431 $ 152,555 $ $ $ $ 152,555 Cost of sales 76,245 (89) 76,156 75,042 (84) 74,958 Gross profit 80, ,275 77, ,597 Gross profit margin 51.3% 51.3% 50.8% 50.9% Operating expenses: Selling, general and administrative 66,405 (15,874) (1,063) 49,468 73,967 (20,401) (939) 52,627 Research and development 22,852 22,852 20,305 20,305 Income (loss) from operations (9,071) 15,963 1,063 7,955 (16,759) 20, ,665 Interest and other expense, net (201) (201) (126) (126) Income (loss) before income taxes (8,870) 15,963 1,063 8,156 (16,633) 20, ,791 Benefit for income taxes (a) 1,041 1,041 1,179 (1,452) (67) (340) Net income (loss) (9,911) 15,963 1,063 7,115 (17,812) 21,937 1,006 5,131 Less: net loss attributable to noncontrolling interests (24) (24) Net income (loss) attributable to 3D Systems Corporation $ (9,971) $ 15,963 $ 1,063 $ $ 7,055 $ (17,788) $ 21,937 $ 1,006 $ $ 5,155 Net income (loss) per share available to 3D Systems Corporation common stockholders basic and diluted $ (0.09) $ 0.06 $ (0.16) $ 0.05 (a) Tax effect for the quarter ended March 31, 2016 and earlier periods was calculated quarterly, based on the Company s overall tax rate for each quarter. Tax effect for the quarters ended after March 31, 2016 was calculated based on the Company s quarterly U.S. tax rate, which was 0% as a result of the valuation allowance that was recorded in the fourth quarter of 2015, in connection with GAAP net losses. 23
24 GAAP to Non-GAAP Reconciliation Guidance Full Year Ended December 31, 2017 (in millions, except per share amounts) Low High Revenue $ 643 $ 684 GAAP Earnings per Share $ 0.02 $ 0.06 Estimated adjustments to arrive at non-gaap EPS: Amortization Stock Based Compensation Acquisition, severance and settlements Total Adjustments $ 0.49 $ 0.49 Non-GAAP Earnings per Share $ 0.51 $ 0.55 Tax effect for non-gaap adjustments is based on the company s U.S. tax rate. As a result of the valuation allowance that was recorded in the fourth quarter of 2015, in connection with GAAP net losses, tax effect is expected to be 0% in
25 GAAP to Non-GAAP Reconciliation Q Quarter Ended June 30, 2016 (in thousands, except per share amounts) GAAP Amortization, Stock- Based Compensation & Other Legal and Acquisition- Related Portfolio Restructuring Non-GAAP Revenue $ 158,111 $ $ $ $ 158,111 Cost of sales 77,700 (80) 77,620 Gross profit 80, ,491 Gross profit margin 50.9% 50.9% Operating expenses: Selling, general and administrative 63,228 (16,008) (1,771) 45,449 Research and development 20,900 20,900 Total operating expenses 84,128 (16,008) (1,771) 66,349 Income (loss) from operations (3,717) 16,088 1,771 14,142 Interest and other expense, net (208) (208) Income (loss) before income taxes (3,509) 16,088 1,771 14,350 Provision (benefit) for income taxes (a) 1,700 1,700 Net income (loss) (5,209) 16,088 1,771 12,650 Less: net income (loss) attributable to noncontrolling interests (561) (561) Net income (loss) attributable to 3D Systems Corporation $ (4,648) $ 16,088 $ 1,771 $ $ 13,211 Net income (loss) per share available to 3D Systems Corporation common stockholders basic and diluted $ (0.04) $ 0.12 (a) Tax effect for the quarter ended March 31, 2016 and earlier periods was calculated quarterly, based on the Company s overall tax rate for each quarter. Tax effect for the quarters ended after March 31, 2016 was calculated based on the Company s quarterly U.S. tax rate, which was 0% as a result of the valuation allowance that was recorded in the fourth quarter of 2015, in connection with GAAP net losses. 25
26 GAAP to Non-GAAP Reconciliation Q Quarter Ended September 30, 2016 (in thousands, except per share amounts) GAAP Amortization, Stock- Based Compensation & Other Legal and Acquisition- Related Portfolio Restructuring Non-GAAP Revenue $ 156,362 $ $ $ $ 156,362 Cost of sales 87,425 (83) (10,723) 76,619 Gross profit 68, ,723 79,743 Gross profit margin 44.1% 51.0% Operating expenses: Selling, general and administrative 64,814 (18,287) (1,781) (34) 44,712 Research and development 26,140 (6,072) 20,068 Total operating expenses 90,954 (18,287) (1,781) (6,106) 64,780 Income (loss) from operations (22,017) 18,370 1,781 16,829 14,963 Interest and other expense, net 1,624 1,624 Income (loss) before income taxes (23,641) 18,370 1,781 16,829 13,339 Provision (benefit) for income taxes (a) (2,214) (2,214) Net income (loss) (21,427) 18,370 1,781 16,829 15,553 Less: net income (loss) attributable to noncontrolling interests (214) (214) Net income (loss) attributable to 3D Systems Corporation $ (21,213) $ 18,370 $ 1,781 $ 16,829 $ 15,767 Net income (loss) per share available to 3D Systems Corporation common stockholders basic and diluted $ (0.19) $ 0.14 (a) Tax effect for the quarter ended March 31, 2016 and earlier periods was calculated quarterly, based on the Company s overall tax rate for each quarter. Tax effect for the quarters ended after March 31, 2016 was calculated based on the Company s quarterly U.S. tax rate, which was 0% as a result of the valuation allowance that was recorded in the fourth quarter of 2015, in connection with GAAP net losses. 26
27 Reconciliation of GAAP to Non-GAAP Q Quarter Ended December 31, 2016 (in thousands, except per share amounts) GAAP Amortization, Stock-Based Compensation & Other Legal and Acquisition- Related Portfolio Restructuring Non-GAAP GAAP C Revenue $ 165,937 $ $ $ $ 165,937 $ 183,363 $ Cost of sales 83,047 (85) 82, ,203 Gross profit 82, ,975 60,160 Gross profit margin 50.0% 50.0% 32.8% Operating expenses: Selling, general and administrative 57,767 (11,394) (1,249) 45,124 66,542 Research and development 21,050 21,050 22,360 Impairment of goodwill and other intangible assets 537,179 Total operating expenses 78,817 (11,394) (1,249) 66, ,081 Income (loss) from operations 4,073 11,479 1,249 16,801 (565,921) Interest and other expense, net ,000 Income (loss) before income taxes 3,971 11,479 1,249 16,699 (574,921) Provision (benefit) for income taxes (a) (1,212) 1, ,535 Net income (loss) 5,183 10,234 1,249 16,666 (604,456) Less: net income (loss) attributable to noncontrolling interests (47) (47) (8,090) Net income (loss) attributable to 3D Systems Corporation $ 5,230 $ 10,234 $ 1,249 $ $ 16,713 $ (596,366) $ Net income (loss) per share available to 3D Systems Corporation common stockholders basic and diluted $ 0.05 $ 0.15 $ (5.32) (a) Tax effect for the quarter ended March 31, 2016 and earlier periods was calculated quarterly, based on the Company s overall tax rate for each quarter. Tax effect for the quarters ended after March 31, 2016 was calculated based on the Company s quarterly U.S. tax rate, which was 0% as a result of the valuation allowance that was recorded in the fourth quarter of 2015, in connection with GAAP net losses. The amount in the fourth quarter of 2016 also includes $1.2 million related to an adjustment for a prior period. 27
28 Thank You
First Quarter May 2, 2018
 First Quarter 2018 May 2, 2018 Welcome and Participants Vyomesh Joshi President & Chief Executive Officer John McMullen Executive Vice President & Chief Financial Officer Andy Johnson Executive Vice President
Second Quarter and Six Months August 2, 2017
 Second Quarter and Six Months 2017 August 2, 2017 Welcome and Participants Vyomesh Joshi President & Chief Executive Officer John McMullen Executive Vice President & Chief Financial Officer Patrick Rogers
Third Quarter and Nine Months October 31, 2017
 Third Quarter and Nine Months 2017 October 31, 2017 Welcome and Participants Vyomesh Joshi President & Chief Executive Officer John McMullen Executive Vice President & Chief Financial Officer Andy Johnson
Third Quarter October 30, 2018
 Third Quarter 2018 October 30, 2018 Welcome and Participants Vyomesh Joshi President & Chief Executive Officer John McMullen Executive Vice President & Chief Financial Officer Andy Johnson Chief Legal
3D Systems Reports Fourth Quarter and Full Year 2017 Financial Results
 3D Systems Corporation 333 Three D Systems Circle Rock Hill, SC 29730 News Release www.3dsystems.com NYSE: DDD Investor Contact: Stacey Witten Email: investor.relations@3dsystems.com Media Contact: Greg
3D Systems Reports First Quarter 2018 Financial Results
 3D Systems Reports First Quarter 2018 Financial Results ROCK HILL, South Carolina - May 2, 2018 - (NYSE: DDD) announced today its financial results for the first quarter ended March 31, 2018. For the first
3D Systems Corporation 333 Three D Systems Circle Rock Hill, SC News Release. NYSE: DDD
 3D Systems Corporation 333 Three D Systems Circle Rock Hill, SC 29730 News Release www.3dsystems.com NYSE: DDD Investor Contact: Stacey Witten Email: investor.relations@3dsystems.com Media Contact: Greg
Conference Call and Webcast Second Quarter and Six Months NYSE: DDD
 Conference Call and Webcast Second Quarter and Six Months 2011 www.3dsystems.com NYSE: DDD 2011 年 7 月 28 日 Participants Stacey Witten Abe Reichental Damon Gregoire Bob Grace Investor Relations Manager
Conference Call & Webcast
 3D Systems www.3dsystems.com NASDAQ:TDSC Conference Call & Webcast February 17, 2011 Fourth Quarter 2010 Results Participants Stacey Witten Abe Reichental Damon Gregoire Bob Grace Investor Relations Coordinator
MTS REPORTS FISCAL 2018 FIRST QUARTER FINANCIAL RESULTS
 MTS Systems Corporation 14000 Technology Drive Eden Prairie, MN 55344-2290 Telephone 952-937-4000 Fax 952-937-4515 News Release FOR IMMEDIATE RELEASE February 5, 2018 MTS REPORTS FISCAL 2018 FIRST QUARTER
Earnings Webcast & Conference Call
 August 9, 2016 Earnings Webcast & Conference Call Fourth Quarter and Fiscal Year 2016 2014 1 Forward-Looking Statements This presentation and other written or oral statements made from time to time by
Conference Call & Webcast
 3D Systems www.3dsystems.com NASDAQ:TDSC Conference Call & Webcast October 28, 2010 Third Quarter 2010 Results Participants Stacey Witten Abe Reichental Damon Gregoire Bob Grace Investor Relations Coordinator
MTS REPORTS FISCAL YEAR 2017 FOURTH QUARTER AND FULL YEAR FINANCIAL RESULTS
 MTS Systems Corporation 14000 Technology Drive Eden Prairie, MN 55344-2290 Telephone 952-937-4000 Fax 952-937-4515 News Release FOR IMMEDIATE RELEASE November 27, 2017 MTS REPORTS FISCAL YEAR 2017 FOURTH
Earnings Webcast & Conference Call. Fourth Quarter and Fiscal Year 2017
 Earnings Webcast & Conference Call Fourth Quarter and Fiscal Year 2017 1 Forward-Looking Statements This presentation and other written or oral statements made from time to time by representatives of Broadridge
 For Immediate Release Contact: Ken Bond Deborah Hellinger Oracle Investor Relations Oracle Corporate Communications 1.650.607.0349 1.212.508.7935 ken.bond@oracle.com deborah.hellinger@oracle.com Q4 FY18
ORACLE CORPORATION. Q4 FISCAL 2013 FINANCIAL RESULTS CONDENSED CONSOLIDATED STATEMENTS OF OPERATIONS ($ in millions, except per share data)
") Q4 FISCAL 2013 FINANCIAL RESULTS CONDENSED CONSOLIDATED STATEMENTS OF OPERATIONS ( in millions, except per share data) REVENUES Software Revenues Hardware systems support Hardware Systems Revenues Services
Q4 FISCAL 2013 FINANCIAL RESULTS CONDENSED CONSOLIDATED STATEMENTS OF OPERATIONS ( in millions, except per share data) REVENUES Software Revenues Hardware systems support Hardware Systems Revenues Services
Zimmer Biomet Reports Second Quarter 2016 Financial Results
 July 28, 2016 Zimmer Biomet Reports Second Quarter 2016 Financial Results -- Net Sales of $1.934 billion represent an increase of 65.6% over the prior year period, and an increase of 4.5% on an adjusted
Contact: Ken Bond Deborah Hellinger Oracle Investor Relations Oracle Corporate Communications
 For Immediate Release Contact: Ken Bond Deborah Hellinger Oracle Investor Relations Oracle Corporate Communications 1.650.607.0349 1.212.508.7935 ken.bond@oracle.com deborah.hellinger@oracle.com ORACLE
Digital River, Inc. Fourth Quarter Results (In thousands, except share data) Subject to reclassification
 Subject to reclassification") (In thousands, except share data) Consolidated Balance Sheets (Unaudited) 2012 2011 Assets Current assets Cash and cash equivalents $ 542,851 $ 497,193 Short-term investments 162,794 223,349 Accounts receivable,
(In thousands, except share data) Consolidated Balance Sheets (Unaudited) 2012 2011 Assets Current assets Cash and cash equivalents $ 542,851 $ 497,193 Short-term investments 162,794 223,349 Accounts receivable,
McKESSON REPORTS FISCAL 2013 SECOND-QUARTER RESULTS
 McKESSON REPORTS FISCAL 2013 SECOND-QUARTER RESULTS Revenues of $29.9 billion for the second quarter, down 1%. Second-quarter GAAP earnings per diluted share of $1.67, up 42%. Second-quarter per diluted
Margin GAAP from Continuing Operations $1.78 $1.6B Year/Year -2% -5% 66% 4.4Pts 1.0Pts. $2.25 $2.0B Year/Year -8% -12% 28% 3.2Pts 0.
 IBM REPORTS 2019 FIRST-QUARTER RESULTS Acceleration in Cloud Revenue Growth; Continued Margin Expansion Highlights First Quarter: GAAP EPS from continuing operations of $1.78 Operating (non-gaap) EPS of
EMERSON AND SUBSIDIARIES CONSOLIDATED OPERATING RESULTS (AMOUNTS IN MILLIONS EXCEPT PER SHARE, UNAUDITED)
") CONSOLIDATED OPERATING RESULTS (AMOUNTS IN MILLIONS EXCEPT PER SHARE, UNAUDITED) Table 1 Percent Change Net sales $3,337 $3,216 (4)% Costs and expenses: Cost of sales 1,923 1,851 SG&A expenses 879 822
CONSOLIDATED OPERATING RESULTS (AMOUNTS IN MILLIONS EXCEPT PER SHARE, UNAUDITED) Table 1 Percent Change Net sales $3,337 $3,216 (4)% Costs and expenses: Cost of sales 1,923 1,851 SG&A expenses 879 822
Digital River, Inc. First Quarter Results (In thousands, except share data) Subject to reclassification
 Subject to reclassification") (In thousands, except share data) Consolidated Balance Sheets (Unaudited) December 31, Assets Current assets Cash and cash equivalents $ 500,742 $ 542,851 Short-term investments 144,615 162,794 Accounts
(In thousands, except share data) Consolidated Balance Sheets (Unaudited) December 31, Assets Current assets Cash and cash equivalents $ 500,742 $ 542,851 Short-term investments 144,615 162,794 Accounts
Contact: Ken Bond Deborah Hellinger Oracle Investor Relations Oracle Corporate Communications
 For Immediate Release Contact: Ken Bond Deborah Hellinger Oracle Investor Relations Oracle Corporate Communications 1.650.607.0349 1.212.508.7935 ken.bond@oracle.com deborah.hellinger@oracle.com ORACLE
IFMI REPORTS FIRST QUARTER FINANCIAL RESULTS
 IFMI REPORTS FIRST QUARTER FINANCIAL RESULTS Board Declares Dividend of $0.02 per Share Philadelphia and New York, May 3, 2012 Institutional Financial Markets, Inc. (NYSE AMEX: IFMI), an investment firm
STRATASYS Q FINANCIAL RESULTS CONFERENCE CALL
 STRATASYS Q2 2018 FINANCIAL RESULTS CONFERENCE CALL August 1, 2018 Q2 2018 Conference and webcast details Speakers Elan Jaglom Interim CEO David Reis Vice-Chairman Lilach Payorski CFO Yonah Lloyd VP, Investor
Contact: Ken Bond Deborah Hellinger Oracle Investor Relations Oracle Corporate Communications
 For Immediate Release Contact: Ken Bond Deborah Hellinger Oracle Investor Relations Oracle Corporate Communications 1.650.607.0349 1.212.508.7935 ken.bond@oracle.com deborah.hellinger@oracle.com ORACLE
McKesson Corporation Fiscal 2018 Financial Performance Fiscal 2019 Annual Outlook. Financial Results and Company Highlights May 24, 2018
 McKesson Corporation Fiscal 2018 Financial Performance Fiscal 2019 Annual Outlook Financial Results and Company Highlights Forward-Looking Statements Some of the information in this presentation is not
Contact: Ken Bond Deborah Hellinger Oracle Investor Relations Oracle Corporate Communications
 For Immediate Release Contact: Ken Bond Deborah Hellinger Oracle Investor Relations Oracle Corporate Communications 1.650.607.0349 1.212.508.7935 ken.bond@oracle.com deborah.hellinger@oracle.com Q3 FY18
CARBONITE (NASDAQ: CARB)
") CARBONITE (NASDAQ: CARB) FOURTH QUARTER AND FY 2016 FINANCIAL RESULTS Thursday, February 9 th 2017 JERRY SISITSKY VP, Investor Relations Phone: 781-928-0713 Email: investor.relations@carbonite.com (NASDAQ:
CARBONITE (NASDAQ: CARB) FOURTH QUARTER AND FY 2016 FINANCIAL RESULTS Thursday, February 9 th 2017 JERRY SISITSKY VP, Investor Relations Phone: 781-928-0713 Email: investor.relations@carbonite.com (NASDAQ:
ServiceNow, Inc. Condensed Consolidated Statements of Operations (in thousands, except share and per share data) (Unaudited)
 (Unaudited)") Condensed Consolidated Statements of Operations (in thousands, except share and per share data) Revenues: Subscription $ 179,907 $ 117,375 Professional services and other 32,057 21,715 Total revenues 211,964
Condensed Consolidated Statements of Operations (in thousands, except share and per share data) Revenues: Subscription $ 179,907 $ 117,375 Professional services and other 32,057 21,715 Total revenues 211,964
ORACLE CORPORATION. Q1 FISCAL 2016 FINANCIAL RESULTS CONDENSED CONSOLIDATED STATEMENTS OF OPERATIONS ($ in millions, except per share data)
") CONDENSED CONSOLIDATED STATEMENTS OF OPERATIONS ($ in millions, except per share data) REVENUES % Increase Three Months Ended August 31, % Increase (Decrease) % of % of (Decrease) in Constant 2015 Revenues
CONDENSED CONSOLIDATED STATEMENTS OF OPERATIONS ($ in millions, except per share data) REVENUES % Increase Three Months Ended August 31, % Increase (Decrease) % of % of (Decrease) in Constant 2015 Revenues
Bottomline Technologies Reconciliation to Non GAAP Measures Three Months Ended June 30, 2013
 Reconciliation to Measures Three Months Ended June 30, 2013 Non Cash Amortization of Equity Based Integration Restructuring Interest GAAP Intangible Assets Compensation Related Expenses Expenses Expense
EMERSON AND SUBSIDIARIES CONSOLIDATED OPERATING RESULTS (AMOUNTS IN MILLIONS EXCEPT PER SHARE, UNAUDITED)
") CONSOLIDATED OPERATING RESULTS (AMOUNTS IN MILLIONS EXCEPT PER SHARE, UNAUDITED) Table 1 Quarter Ended March 31 Percent Change Net sales $3,579 $3,574 % Costs and expenses: Cost of sales 2,037 2,017 SG&A
CONSOLIDATED OPERATING RESULTS (AMOUNTS IN MILLIONS EXCEPT PER SHARE, UNAUDITED) Table 1 Quarter Ended March 31 Percent Change Net sales $3,579 $3,574 % Costs and expenses: Cost of sales 2,037 2,017 SG&A
Q Financial Supplement
 Reconcilation of GAAP and Non-GAAP Financial Measures Non-GAAP Net Income and Non-GAAP EPS (in thousands except per share data) 2014 2015 Three Months Ending June 30, Low Range Guidance (1) High Range
MTS REPORTS FISCAL 2018 THIRD QUARTER FINANCIAL RESULTS
 MTS Systems Corporation 14000 Technology Drive Eden Prairie, MN 55344-2290 Telephone 952-937-4000 Fax 952-937-4515 News Release FOR IMMEDIATE RELEASE August 6, 2018 MTS REPORTS FISCAL 2018 THIRD QUARTER
Oracle Corporation (Exact name of registrant as specified in its charter)
") Table of Contents UNITED STATES SECURITIES AND EXCHANGE COMMISSION Washington, D.C. 20549 FORM 8-K CURRENT REPORT Pursuant to Section 13 OR 15(d) of The Securities Exchange Act of 1934 Date of Report (Date
Table of Contents UNITED STATES SECURITIES AND EXCHANGE COMMISSION Washington, D.C. 20549 FORM 8-K CURRENT REPORT Pursuant to Section 13 OR 15(d) of The Securities Exchange Act of 1934 Date of Report (Date
McKESSON REPORTS FISCAL 2015 SECOND-QUARTER RESULTS
 McKESSON REPORTS FISCAL 2015 SECOND-QUARTER RESULTS Revenues of $44.8 billion for the second quarter, up 36%. Second-quarter GAAP earnings per diluted share from continuing operations of $2.05, up 13%.
Reconciliation of key non-gaap consolidated financial metrics to Legacy Cypress metrics. Three months ended March 29, 2015 Impact of the merger and
 Reconciliation of key non-gaap consolidated financial metrics to Legacy Cypress metrics Three months ended March 29, 2015 Impact of the merger and Spansion Legacy Consolidated operations Cypress Revenue
FAIR ISAAC CORPORATION CONDENSED CONSOLIDATED BALANCE SHEETS (In thousands) (Unaudited)
 (Unaudited)") CONDENSED CONSOLIDATED BALANCE SHEETS (In thousands) June 30, September 30, 2018 2017 ASSETS: Current assets: Cash and cash equivalents $ 119,929 $ 105,618 Accounts receivable, net 182,419 168,586 Prepaid
CONDENSED CONSOLIDATED BALANCE SHEETS (In thousands) June 30, September 30, 2018 2017 ASSETS: Current assets: Cash and cash equivalents $ 119,929 $ 105,618 Accounts receivable, net 182,419 168,586 Prepaid
FAIR ISAAC CORPORATION CONDENSED CONSOLIDATED BALANCE SHEETS (In thousands) (Unaudited)
 (Unaudited)") CONDENSED CONSOLIDATED BALANCE SHEETS (In thousands) 2018 2017 ASSETS: Current assets: Cash and cash equivalents $ 90,023 $ 105,618 Accounts receivable, net 208,865 168,586 Prepaid expenses and other current
CONDENSED CONSOLIDATED BALANCE SHEETS (In thousands) 2018 2017 ASSETS: Current assets: Cash and cash equivalents $ 90,023 $ 105,618 Accounts receivable, net 208,865 168,586 Prepaid expenses and other current
First Quarter Fiscal Quarter Ended December 31, 2016
 First Quarter Fiscal 2017 Quarter Ended December 31, 2016 Safe Harbor Statement Certain statements made during this presentation, including the Company's outlook for the second quarter fiscal year 2017
IBM REPORTS 2017 FOURTH-QUARTER AND FULL-YEAR RESULTS
 Highlights IBM REPORTS 2017 FOURTH-QUARTER AND FULL-YEAR RESULTS Fourth-quarter GAAP EPS from continuing operations of $(1.14) -- Includes a one-time charge of $5.5 billion associated with the enactment
SYSCO REPORTS FIRST QUARTER FISCAL 2018 RESULTS
 For more information contact: Sysco Corporation 1390 Enclave Parkway Neil Russell Camilla Zuckero Houston, TX 77077 Investor Contact Media Contact T 281-584-1308 T 281-899-1839 SYSCO REPORTS FIRST QUARTER
Brooks Automation, Inc. Financial Results Conference Call
 Brooks Automation, Inc. 1st Quarter Fiscal2014 Financial Results Conference Call February 6, 2014 Safe Harbor Statement Safe Harbor Statement under the U.S. Private Securities Litigation Reform Act of
Safe Harbor Statement
 Safe Harbor Statement Statements made in this presentation which are not statements of historical fact are forward-looking statements and are subject to the safe harbor provisions created by the Private
Fourth Quarter and Full-Year 2018 Earnings Call February 20, 2019
 Fourth Quarter and Full-Year 2018 Earnings Call February 20, 2019 1 2019 2017 ServiceSource International, Inc. All rights reserved. Important Information This presentation refers to certain non-gaap financial
NEW REVENUE ACCOUNTING STANDARD (ASC 606) February 7, 2018
 February 7, 2018") NEW REVENUE ACCOUNTING STANDARD February 7, 2018 DISCLAIMERS Forward-Looking Statements Statements in this document that are not statements of historical fact are forward-looking statements within the
NEW REVENUE ACCOUNTING STANDARD February 7, 2018 DISCLAIMERS Forward-Looking Statements Statements in this document that are not statements of historical fact are forward-looking statements within the
ZEBRA TECHNOLOGIES SECOND-QUARTER 2016 RESULTS. August 9, 2016
 ZEBRA TECHNOLOGIES SECOND-QUARTER 2016 RESULTS August 9, 2016 Anders Gustafsson Chief Executive Officer Mike Smiley Chief Financial Officer 2 Safe Harbor Statement Statements made in this presentation
Intermolecular Announces Third Quarter 2017 Financial Results
 Intermolecular Announces Third Quarter 2017 Financial Results SAN JOSE, Calif., November 2, 2017 -- Intermolecular, Inc. (NASDAQ: IMI) today reported results for its Third Quarter ended September 30, 2017.
3 rd Quarter 2018 Earnings Release Conference Call
 3 rd Quarter 2018 Earnings Release Conference Call October 31, 2018 1 2018 Belden Inc. belden.com @beldeninc Safe Harbor Statement Our commentary and responses to your questions may contain forward-looking
Q EARNINGS Presentation
 Q1 2018 EARNINGS Presentation Disclosures This presentation contains non-gaap financial measures relating to our performance. You can find the reconciliation of these measures to the most directly comparable
Second Quarter 2017 Earnings Conference Call August 2, 2017
 Philip Mezey President and Chief Executive Officer Joan Hooper Senior Vice President and Chief Financial Officer Barbara Doyle Vice President, Investor Relations Second Quarter 2017 Earnings Conference
1st Quarter FY 2019 Earnings Presentation. August 7, 2018
 1st Quarter FY 2019 Earnings Presentation August 7, 2018 Non-GAAP financial measures We present non-gaap financial measures of performance which are derived from the unaudited condensed consolidated statements
XPO Logistics Announces Third Quarter 2018 Results
 XPO Logistics Announces Third Quarter 2018 Results Reports 11.5% revenue growth, led by contract logistics and freight brokerage Closes $918 million of new business in the quarter, up 43% year-over-year
IBM REPORTS 2018 FIRST-QUARTER RESULTS Revenue Up 5 Percent Year to Year; Improving Gross Margin Trajectory
 IBM REPORTS 2018 FIRST-QUARTER RESULTS Revenue Up 5 Percent Year to Year; Improving Gross Margin Trajectory Highlights Revenue of $19.1 billion, up 5 percent (flat adjusting for currency) Gross margin
MICHAEL KORS HOLDINGS LIMITED (Exact name of Registrant as Specified in its Charter)
") UNITED STATES SECURITIES AND EXCHANGE COMMISSION Washington, D.C. 20549 Form 8-K CURRENT REPORT PURSUANT TO SECTION 13 OR 15(D) OF THE SECURITIES EXCHANGE ACT OF 1934 Date of Report (Date of earliest event
UNITED STATES SECURITIES AND EXCHANGE COMMISSION Washington, D.C. 20549 Form 8-K CURRENT REPORT PURSUANT TO SECTION 13 OR 15(D) OF THE SECURITIES EXCHANGE ACT OF 1934 Date of Report (Date of earliest event
Kodak Improves Profitability in 2013
 Media Contact: Christopher Veronda +1 585 724 2622, christopher.veronda@kodak.com Investor Contact: David Bullwinkle +1 585 724 4053, shareholderservices@kodak.com Kodak Improves Profitability in 2013
DISCOVERY COMMUNICATIONS REPORTS SECOND QUARTER 2017 RESULTS
 DISCOVERY COMMUNICATIONS REPORTS SECOND QUARTER 2017 RESULTS Second Quarter 2017 Financial Highlights: Revenues increased 2% to $1,745 million (increased 3% excluding currency effects) DCI Net Income decreased
Contact: Ken Bond Deborah Hellinger Oracle Investor Relations Oracle Corporate Communications
 For Immediate Release Contact: Ken Bond Deborah Hellinger Oracle Investor Relations Oracle Corporate Communications 1.650.607.0349 1.212.508.7935 ken.bond@oracle.com deborah.hellinger@oracle.com ORACLEREPORTS
Q3 Fiscal Year 2019 Financial Highlights
 Q3 Fiscal Year 2019 Financial Highlights For the quarter ended October 31, 2018 November 29, 2018 Forward Looking Statements Certain statements in this communication may contain forward looking statements
Brooks Automation, Inc. 4 th Quarter Fiscal 2013 Financial Results Conference Call
 Brooks Automation, Inc. 4 th Quarter Fiscal 2013 Financial Results Conference Call November 14, 2013 Safe Harbor Statement Safe Harbor Statement under the U.S. Private Securities Litigation Reform Act
Conference Call and Webcast
 Conference Call and Webcast NASDAQ: TDSC www.3dsystems.com Discussion of Fourth Quarter 2009 Results February 25, 2010 Participants Amanda Molbert Coordinator, Investor Relations Abe Reichental President
Waste Management Announces Fourth Quarter and Full-Year 2013 Earnings
 Waste Management Announces Fourth Quarter and Full-Year 2013 Earnings February 18, 2014 Company sees strong cash generation in 2013 and expects continued strength in 2014 HOUSTON--(BUSINESS WIRE)--Feb.
4th QUARTER FY 2015 EARNINGS PRESENTATION
 4th QUARTER FY 2015 EARNINGS PRESENTATION 1 Forward-Looking Statements All written or oral statements made by CSC at this meeting or in these presentation materials that do not directly and exclusively
XPO Logistics Announces Fourth Quarter and Full Year 2017 Results
 XPO Logistics Announces Fourth Quarter and Full Year 2017 Results Reports fourth quarter records for revenue, EPS, adjusted EBITDA, cash flow from operations and free cash flow GREENWICH, Conn. February
Fourth Quarter & Calendar Year 2016 Earnings Conference Call May 23, 2017
 Fourth Quarter & Calendar Year 2016 Earnings Conference Call May 23, 2017 Forward Looking Statements Certain statements in this presentation are forward-looking statements. These statements relate to future
NCI Building Systems CFO Commentary on Fourth Quarter 2015 Fiscal Year Results
 NCI Building Systems CFO Commentary on Fourth Quarter 2015 Fiscal Year Results Summary The fourth quarter 2015 results compared to last year s fourth quarter were as follows: Revenue of $459.8 million
Q4 Fiscal 2018 Earnings Conference Call. June 21, 2018
 Q4 Fiscal 2018 Earnings Conference Call June 21, 2018 Cautionary Language Regarding Forward-Looking Statements This presentation contains certain forward-looking statements, as defined in the Private Securities
Q4 18 Earnings Presentation. November 14, 2018
 Q4 18 Earnings Presentation November 14, 2018 Hillenbrand Participants Joe Raver President & Chief Executive Officer Kristina Cerniglia Senior Vice President & Chief Financial Officer Rich Dudley Director,
FY 2017 SECOND QUARTER EARNINGS. Adient delivers strong Q2 results; increases full year earnings expectations $286M $192M $2.04 $4,212M $235M 7.
 FY 2017 SECOND QUARTER EARNINGS Adient delivers strong Q2 results; increases full year earnings expectations > > GAAP net income and EPS diluted increased to $192M and $2.04, respectively; adjusted-eps
Q Financial Results
 Q4 2016 Financial Results February 2, 2017 Copyright Fortinet Inc. All rights reserved. Safe Harbor Statement Information, statements and projections contained in these presentation slides and related
Perrigo Fiscal Fourth Quarter Conference Call August 18, 2009
 Perrigo Fiscal Fourth Quarter Conference Call August 18, 2009 Forward Looking Statements Certain statements in this presentation are forward-looking statements within the meaning of Section 21E of the
2017 SECOND QUARTER RESULTS. Ended June 30, 2017
 2017 SECOND QUARTER RESULTS Ended June 30, 2017 Forward Looking Statements Disclaimer This presentation contains statements, including statements about future plans and expectations, which constitute forwardlooking
2Q 2017 Earnings Presentation. August 8, 2017
 2Q 2017 Earnings Presentation August 8, 2017 Caution Concerning Forward-Looking Statements and Non-GAAP Financial Measures This presentation contains forward-looking statements within the meaning of the
SALLIE MAE REPORTS SECOND-QUARTER FINANCIAL RESULTS NEWARK,
 SALLIE MAE REPORTS SECOND-QUARTER FINANCIAL RESULTS NEWARK, Del., July 20, Sallie Mae (NYSE: SLM) today released second-quarter financial results that reflected increased student loan originations and
Quarterly Update FY16 Fourth Quarter. November 8, 2016
 Quarterly Update FY16 Fourth Quarter November 8, 2016 Johnson Controls International plc Cautionary Statement Regarding Forward-Looking Statements Johnson Controls International plc has made statements
2nd Quarter FY 2019 Earnings Presentation. November 6, 2018
 2nd Quarter FY 2019 Earnings Presentation November 6, 2018 Non-GAAP financial measures We present non-gaap financial measures of performance which are derived from the unaudited condensed consolidated
 For Immediate Release Contact: Ken Bond Deborah Hellinger Oracle Investor Relations Oracle Corporate Communications 1.650.607.0349 1.212.508.7935 ken.bond@oracle.com deborah.hellinger@oracle.com Q2 FY19
McKESSON REPORTS FISCAL 2017 FOURTH-QUARTER AND FULL-YEAR RESULTS
 McKESSON REPORTS FISCAL 2017 FOURTH-QUARTER AND FULL-YEAR RESULTS Revenues of $48.7 billion for the fourth quarter and $198.5 billion for the full year, up 4% year-over-year. Fourth-quarter GAAP earnings
Kodak Reports Net Earnings for 2016 of $16 Million
 Media Contact: Louise Kehoe, Kodak, +1 585-802-1343, louise.kehoe@kodak.com Investor Contact: Bill Love, Kodak, +1 585-724-4053, shareholderservices@kodak.com Kodak Reports Net Earnings for 2016 of $16
Haemonetics Reports 3 rd Quarter and Year-to-Date Fiscal 2019 Results; Raises Cash Flow Guidance and Reaffirms Other Fiscal 2019 Guidance
 Earnings Release FY19 Q3 Investor Contacts Media Contact Gerry Gould, VP-Investor Relations Carla Burigatto, VP-Communications (781) 356-9402 (781) 348-7263 gerry.gould@haemonetics.com carla.burigatto@haemonetics.com
Digital River, Inc. Second Quarter Results (Unaudited, in thousands) Subject to reclassification
 Subject to reclassification") (Unaudited, in thousands) Condensed Consolidated Balance Sheets As of December 31, 2008 2007 Assets: Current assets Cash and cash equivalents $ 276,927 $ 381,788 Short-term investments 201,297 315,636
(Unaudited, in thousands) Condensed Consolidated Balance Sheets As of December 31, 2008 2007 Assets: Current assets Cash and cash equivalents $ 276,927 $ 381,788 Short-term investments 201,297 315,636
SYSCO REPORTS THIRD QUARTER EARNINGS
 SYSCO REPORTS THIRD QUARTER EARNINGS HOUSTON, May 7, 2018 - Sysco Corporation (NYSE: SYY) today announced financial results for its 13-week third fiscal quarter ended March 31, 2018. Third Quarter Fiscal
EMERSON REPORTS STRONG SECOND QUARTER 2018 RESULTS AND RAISES FULL-YEAR GUIDANCE
 Investor Contact: Tim Reeves (314) 553-2197 Media Contact: Pat Kane (314) 982-8726 EMERSON REPORTS STRONG SECOND QUARTER 2018 RESULTS AND RAISES FULL-YEAR GUIDANCE Net sales of $4.2 billion increased 19
Zebra Technologies Second-Quarter 2018 Results. August 7, 2018
 Zebra Technologies Second-Quarter 2018 Results August 7, 2018 Safe Harbor Statement Statements made in this presentation which are not statements of historical fact are forward-looking statements and are
2017 FIRST QUARTER RESULTS. Ended March 31, 2017
 2017 FIRST QUARTER RESULTS Ended March 31, 2017 Forward Looking Statements Disclaimer This presentation contains statements, including statements about future plans and expectations, which constitute forwardlooking
Third Quarter 2018 Teleconference Supplemental Data
 Third Quarter 2018 Teleconference Supplemental Data Cautionary Statement Forward-Looking Information This communication contains forward looking statements as that term is defined in the Private Securities
Kodak Reports Financial Results for First Quarter of 2016, Reflecting Improved Operating and Cash Performance
 Media Contact: Louise Kehoe, Kodak, +1 585 802 1343, louise.kehoe@kodak.com Investor Contact: David Bullwinkle, Kodak, +1 585 724 4053, shareholderservices@kodak.com Kodak Reports Financial Results for
FOR IMMEDIATE RELEASE Michael J. Monahan (651)
") News Release Ecolab Inc. 370 Wabasha Street North St. Paul, Minnesota 55102 FOR IMMEDIATE RELEASE Michael J. Monahan (651) 250-2809 ECOLAB REPORTED AND ADJUSTED FIRST QUARTER DILUTED EPS $0.77; ADJUSTED
News Release Ecolab Inc. 370 Wabasha Street North St. Paul, Minnesota 55102 FOR IMMEDIATE RELEASE Michael J. Monahan (651) 250-2809 ECOLAB REPORTED AND ADJUSTED FIRST QUARTER DILUTED EPS $0.77; ADJUSTED
Natus Medical Announces Third Quarter Financial Results
 October 24, Natus Medical Announces Third Quarter Financial Results Reports record third quarter revenue of $130.6 million Reports third quarter GAAP loss per share of $0.17 and non-gaap earnings per share
NUVASIVE ANNOUNCES FIRST QUARTER 2018 FINANCIAL RESULTS
 NEWS RELEASE NUVASIVE ANNOUNCES FIRST QUARTER 08 FINANCIAL RESULTS SAN DIEGO May, 08 NuVasive, Inc. (NASDAQ: NUVA), the leader in spine technology innovation, focused on transforming spine surgery with
R. R. DONNELLEY & SONS COMPANY (Exact name of Registrant as Specified in Its Charter)
") UNITED STATES SECURITIES AND EXCHANGE COMMISSION WASHINGTON, D.C. 20549 FORM 8-K CURRENT REPORT Pursuant to Section 13 or 15(d) of the Securities Exchange Act of 1934 Date of Report (Date of earliest event
UNITED STATES SECURITIES AND EXCHANGE COMMISSION WASHINGTON, D.C. 20549 FORM 8-K CURRENT REPORT Pursuant to Section 13 or 15(d) of the Securities Exchange Act of 1934 Date of Report (Date of earliest event
Illumina Q Financial Results April 25, Illumina, Inc. All rights reserved.
 Illumina Q1 2017 Financial Results April 25, 2017 2017 Illumina, Inc. All rights reserved. Safe Harbor Statement This communication may contain statements that are forward-looking. Forward-looking statements
Q215 Earnings Call. August 5, Silver Spring Networks. All rights reserved.
 Earnings Call August 5, 2015 Forward-Looking Statements This document contains forward-looking statements that involve risks and uncertainties. These forwardlooking statements include statements regarding
Mar. 31, Jun. 30, 2017
 Consolidated GAAP Statements of Operations ($ in thousands, except EPS) March 31, ended Net Revenues $921,580 $1,059,429 $1,134,224 $191,972 $209,032 $195,443 $593,755 $1,190,202 $199,725 Consumer 870,959
Third Quarter 2016 Earnings Call. November 9, 2016
 Third Quarter 2016 Earnings Call November 9, 2016 CAUTIONARY STATEMENT REGARDING FORWARD-LOOKING STATEMENTS This presentation includes forward-looking statements as that term is defined under the Private
FAIR ISAAC CORPORATION CONDENSED CONSOLIDATED BALANCE SHEETS (In thousands) (Unaudited)
 (Unaudited)") CONDENSED CONSOLIDATED BALANCE SHEETS (In thousands) June 30, September 30, 2016 2015 ASSETS: Current assets: Cash and cash equivalents $ 118,155 $ 86,120 Accounts receivable, net 155,196 158,773 Prepaid
CONDENSED CONSOLIDATED BALANCE SHEETS (In thousands) June 30, September 30, 2016 2015 ASSETS: Current assets: Cash and cash equivalents $ 118,155 $ 86,120 Accounts receivable, net 155,196 158,773 Prepaid
USA Truck Reports First Quarter 2018 Results
 USA Truck Reports First Quarter 2018 Results 1Q 2018 net income of $1.0 million, or $0.13 per diluted share versus 1Q 2017 net loss of ($4.9) million, or ($0.61) per diluted share Including adjusted items
McKESSON REPORTS FISCAL 2015 THIRD-QUARTER RESULTS
 McKESSON REPORTS FISCAL 2015 THIRD-QUARTER RESULTS Revenues of $47 billion for the third quarter, up 37%. Third-quarter GAAP earnings per diluted share from continuing operations of $2.01, up 187%. Third-quarter