SPECIAL MONTHLY REPORT ON. ENERGY (November 2018)
|
|
|
- Carmella Bell
- 5 years ago
- Views:
Transcription

1 SPECIAL MONTHLY REPORT ON ()
2 PERFORMANCE (October 2018) (% change) NYMEX Natural Gas Crude oil MCX PERFORMANCE (January - October 2018) (% change) NYMEX MCX Natural Gas Crude oil 1
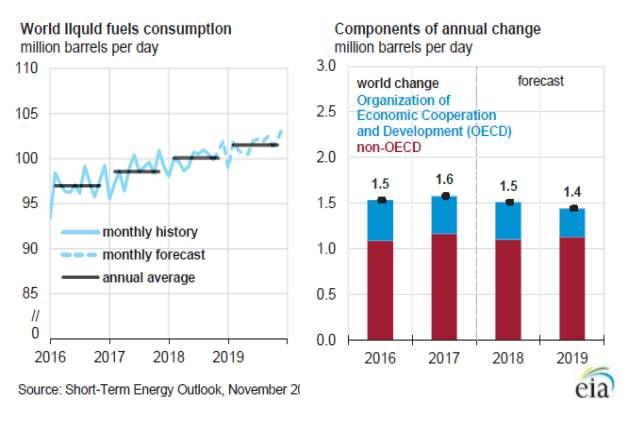
3 COMPLEX Overview In the month of Oct crude oil prices traded sharply lower after Saudi Arabia's pledge to raise production to a record high, two weeks before US sanctions potentially choke off Iranian supplies. On the one side crude oil has been supported by reports that Iranian crude exports may be falling faster than expected deadline of Nov 4, the date U.S. sanctions on the commodity are due to start. While on the other hand fall in global stock markets can cap the upside. Overall it managed to hover in range of $ in NYMEX and in MCX. Meanwhile, OPEC Secretary-General Mohammad Barkindo urged oil producing companies to increase capacities and invest more to meet future demand as spare oil capacity shrinks worldwide. Russian Government reported that is it s no longer capping oil output increases by local producers, signaling that Moscow's supply-restraint pact with OPEC has effectively expired for now. On Saudi-U.S. tension, U.S. President gave Saudi Arabia benefit of the doubt in the disappearance of journalist Jamal Khashoggi even as U.S. lawmakers pointed finger at Saudi leadership. when crude was pushed up ahead of the re-introduction of sanctions against Iran's oil exports on November 5. The huge decline was due to Trump administration, which announced it would issue waivers to eight countries, allowing them to continue importing Iranian crude for the next 180 days to eight importers - China, India, South Korea, Japan, Italy, Greece, Taiwan and Turkey. Meanwhile, U.S. output also hit an all-time high at 11.6 million bpd which kept pressure on prices. Elsewhere, prices got supported after Chinese crude imports eased concerns that slowdown in world's No.2 economy could stoke an emerging fuel glut. Crude oil can continue to remain under pressure as its prices can face resistance near 4700 and support near Key News Increase in US rig count U.S. rig count data continue to pressure crude prices after data from rig count which showed that U.S. energy firms added 12 oil rigs, bringing the total count to 886, the highest level since March US crude oil production to rise Outlook Crude oil prices may continue to remain downbeat as Saudi Arabia assured that markets would continue to meet customer demand for crude despite looming U.S. sanctions that are expected to reduce oil exports from Iran. Meanwhile, OPEC signaled that it may have to return to oil production cuts as global inventories rise that may further sour relations with U.S. President Donald Trump. Countries complied with 111% of pledged supply curbs in Sep compared to adherence of 129%, which means production has increased from August. Saudi Arabia reported that there could be need for intervention to reduce oil stockpiles after increases in recent months. The decline in prices over the past weeks follows a rally between August and October U.S. production will rise to record high 10.9 million bpd in 2018 and 12.1 million bpd in 2019 from 9.4 million bpd in Highlights of latest EIA report U.S. crude oil production is rising at a faster rate than EIA previously anticipated. Crude oil production reached a new monthly record of 11.3 million barrels per day (b/d) in August 2018 and surpassed 11 million b/d for the first time. August 2018 crude oil production was 290,000 b/d higher than expected in the October STEO. This higher level of production raised the baseline for EIA s forecast for 2019 crude oil production, and EIA now expects U.S. crude oil production to average 12.1 million b/d in 2019, compared with a forecast of 11.8 million b/d in the October. 2


4 EIA forecasts Brent crude oil prices to average $72 per barrel (b) in 2019, which is $3/b lower than previously forecast. EIA expects West Texas Intermediate crude oil prices to average $65/b in 2019, which is $5/b lower than previously forecast. The lower crude oil price forecasts are partly the result of higher expected crude oil production in the United States in the second half of 2018 and in 2019, which is expected to contribute to growth in global oil inventory and put downward pressure on crude oil prices. Brent WTI Spread Canadian oil production in July and August was higher than previously estimated, as updated analysis indicates that crude oil volumes EIA previously assumed were disrupted were online during those months. As a result, Canada s total liquid fuels production for the third quarter of 2018 is more than 0.3 million b/d higher than estimated in the October. Source: Reuters Analysis: Brent WTI crude oil spread widened from 8 to above Overall it can hover in range of $9-12 in the month of November. 3

5 4
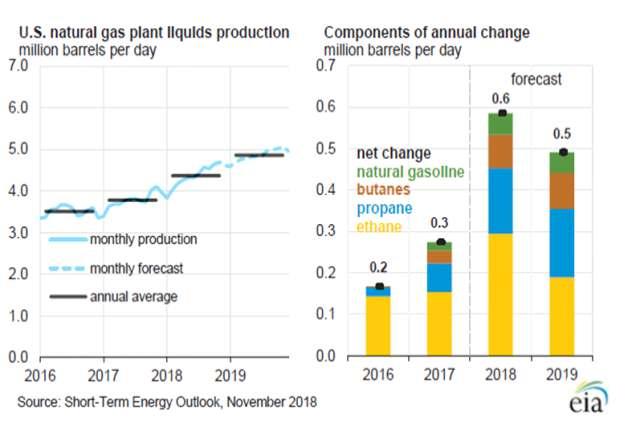
6 Natural Gas Overview Natural gas traded on upside path on higher demand. Overall it traded in range of $ in NYMEX and in MCX in the month of October. Recently natural gas got support on forecasts for more heating demand over the next two weeks than previously expected. Traders noted that heat should cut the amount of gas utilities will be able to inject into inventory to reduce the vast storage deficit before the start of the industry's winter heating season at the end of October. Natural gas prices also got support as colder than normal weather is forecast to move east generating additional heating demand during the balance of October. cooling this weekend into the 30s to near 50F. The southern U.S. will be mild to warm with highs of upper 40s to 60s, locally 70s. California and the Southwest will be warm with highs of 60s to 80s, while colder over the interior West. Overall, demand will be high, locally very high. EIA estimates of Natural gas EIA estimates dry natural gas production in the United States averaged 86.9 billion cubic feet per day (Bcf/d) in October, up 0.7 Bcf/d from September. EIA forecasts that dry natural gas production will average 83.2 Bcf/d in 2018, up 8.5 Bcf/d from Both the level and growth of natural gas production in 2018 would establish new records. EIA expects natural gas production will continue to rise in 2019 to an average of 89.6 Bcf/d. Natural gas can trade with upside bias as it can take support near 240 and resistance near 290 in the month of November. Natural Gas Prices Spike on Colder US Forecast Natural gas prices spiked recently after a new longterm North American weather forecast found much higher heating demand than previously expected. Short-Term Weather Outlook According to NatGasWeather.com for the period November 9 to November 15, Cold air will continue to spread across the Great Lakes and east-central U.S. today, including into portions of Texas and the South. Lows behind the cold front will reach the teens to 30 s, locally single digits. The East will be mild again today with highs mostly of 50s to 70s, but EIA estimates that U.S. natural gas storage inventories were 3.2 trillion cubic feet (Tcf) at the end of October. This level was 16% lower than both the 2017 end-of- October level and the five-year ( ) average for the end of October and was the lowest end-of-october level since Despite low storage levels, EIA expects strong growth in U.S. natural gas production to put downward pressure on prices in EIA expects Henry Hub natural gas spot prices to average $2.98/million British thermal units (MMBtu) in 2019, down 4 cents from the 2018 average and down from a forecast average price of $3.25/MMBtu in the fourth quarter of NYMEX futures and options contract values for February 2019 delivery traded during the five-day period ending November 1, 2018, suggest a range of $2.06/MMBtu to $4.94/MMBtu encompasses the market expectation for February Henry Hub natural gas prices at the 95% confidence level. 5

7 6
 Boardline : 011-30111000 Extn: 683 sandeepjoon@smcindiaonline.com E-mail: smc.care@smcindiaonline.")
8 Vandana Bharti (AVP - Commodity Research) Boardline : Extn: 625 vandanabharti@smcindiaonline.com Sandeep Joon Sr. Research Analyst (Metal & Energy) Boardline : Extn: 683 sandeepjoon@smcindiaonline.com smc.care@smcindiaonline.com Corporate Office: 11/6B, Shanti Chamber, Pusa Road, New Delhi Tel: Mumbai Office: Lotus Corporate Park, A Wing 401 / 402, 4th Floor, Graham Firth Steel Compound, Off Western Express Highway, Jay Coach Signal, Goreagon (East) Mumbai Tel: , Fax: Kolkata Office: 18, Rabindra Sarani, Poddar Court, Gate No-4,5th Floor, Kolkata Tel.: / Fax: / SMC Global Securities Ltd. (hereinafter referred to as SMC ) is regulated by the Securities and Exchange Board of India ( SEBI ) and is licensed to carry on the business of broking, depository services and related activities. SMC is a registered member of National Stock Exchange of India Limited, Bombay Stock Exchange Limited, MSEI (Metropolitan Stock Exchange of India Ltd.) and M/s SMC Comtrade Ltd is a registered member of National Commodity and Derivative Exchange Limited and Multi Commodity Exchanges of India and other commodity exchanges in India. SMC is also registered as a Depository Participant with CDSL and NSDL. SMC s other associates are registered as Merchant Bankers, Portfolio Managers, NBFC with SEBI and Reserve Bank of India. It also has registration with AMFI as a Mutual Fund Distributor. SMC is a SEBI registered Research Analyst having registration number INH SMC or its associates has not been debarred/ suspended by SEBI or any other regulatory authority for accessing /dealing in securities/commodities market. The views expressed by the Research Analyst in this Report are based solely on information available publicly available/internal data/ other reliable sources believed to be true. SMC does not represent/ provide any warranty expressly or impliedly to the accuracy, contents or views expressed herein and investors are advised to independently evaluate the market conditions/risks involved before making any investment decision. The research analysts who have prepared this Report hereby certify that the views /opinions expressed in this Report are their personal independent views/opinions in respect of the subject commodity. DISCLAMIER: This Research Report is for the personal information of the authorized recipient and doesn't construe to be any investment, legal or taxation advice to the investor. It is only for private circulation and use. The Research Report is based upon information that we consider reliable, but we do not represent that it is accurate or complete, and it should not be relied upon as such. No action is solicited on the basis of the contents of this Research Report. The Research Report should not be reproduced or redistributed to any other person(s)in any form without prior written permission of the SMC. The contents of this material are general and are neither comprehensive nor inclusive. Neither SMC nor any of its affiliates, associates, representatives, directors or employees shall be responsible for any loss or damage that may arise to any person due to any action taken on the basis of this Research Report. It does not constitute personal recommendations or take into account the particular investment objectives, financial situations or needs of an individual client or a corporate/s or any entity/s. All investments involve risk and past performance doesn't guarantee future results. The value of, and income from investments may vary because of the changes in the macro and micro factors given at a certain period of time. The person should use his/her own judgment while taking investment decisions. Please note that SMC its affiliates, Research Analyst, officers, directors, and employees, including persons involved in the preparation or issuance if this Research Report: (a) from time to time, may have long or short positions in, and buy or sell the commodity thereof, mentioned here in or (b) be engaged in any other transaction involving such commodities and earn brokerage or other compensation or act as a market maker in the commodities discussed herein(c) may have any other potential conflict of interest with respect to any recommendation and related information and opinions. All disputes shall be subject to the exclusive jurisdiction of Delhi High court. All disputes shall be subject to the exclusive jurisdiction of Delhi High court. 7
SPECIAL MONTHLY REPORT ON. ENERGY (February 2019)
") SPECIAL MONTHLY REPORT ON () PERFORMANCE (January 2019) (% change) NYMEX -14.85 18.66 Natural Gas Crude oil MCX -5.04 22.05-20.00-15.00-10.00-5.00 0.00 5.00 10.00 15.00 20.00 25.00 1 COMPLEX Overview In
SPECIAL MONTHLY REPORT ON () PERFORMANCE (January 2019) (% change) NYMEX -14.85 18.66 Natural Gas Crude oil MCX -5.04 22.05-20.00-15.00-10.00-5.00 0.00 5.00 10.00 15.00 20.00 25.00 1 COMPLEX Overview In
SPECIAL MONTHLY REPORT ON BULLIONS OCTOBER 2018
 SPECIAL MONTHLY REPORT ON OCTOBER 2018 PERFORMANCE (September 2018) (% change) 1.03 COMEX -0.87 Silver Gold 2.92 MCX 2.16-1.50-1.00-0.50 0.00 0.50 1.00 1.50 2.00 2.50 3.00 3.50 PERFORMANCE (January - September
REPORTON GOLD&SILVER DHANTERAS &DIWALI. (Special)
") REPORTON GOLD&SILVER DHANTERAS &DIWALI (Special) GOLD AND SILVER PRICE MOVEMENT IN 2018 Source: SMC Research Overview and Outlook of Gold Recently bullion counter on domestic bourses traded on positive
REPORTON GOLD&SILVER DHANTERAS &DIWALI (Special) GOLD AND SILVER PRICE MOVEMENT IN 2018 Source: SMC Research Overview and Outlook of Gold Recently bullion counter on domestic bourses traded on positive
SPECIAL MONTHLY REPORT ON BASE METALS
 SPECIAL MONTHLY REPORT ON BASE METALS FEBRUARY 2018 COPPER NICKEL LEAD ZINC ALIUMINUM BASE METALS PERFORMANCE (January 2018) (% change) Nickel 4.86 5.94 10.56 Lead 1.78 5.17 4.44 Aluminium -4.65-3.00-0.76
November 16, 2017 LARSEN & TOUBRO LIMITED. In Cr. Consolidated Results STOCK DATA VALUE PARAMETERS SHARE HOLDING PATTERN (%)
") LARSEN & TOUBRO LIMITED November 16, 2017 Current Price: `1207.80 STOCK DATA BSE Code 500510 NSE Symbol LT Reuters LART.BO Bloomberg LT IN VALUE PARAMETERS Price (Rs) 1207.80 52 W H/L(Rs) 1274.00/868.00
LARSEN & TOUBRO LIMITED November 16, 2017 Current Price: `1207.80 STOCK DATA BSE Code 500510 NSE Symbol LT Reuters LART.BO Bloomberg LT IN VALUE PARAMETERS Price (Rs) 1207.80 52 W H/L(Rs) 1274.00/868.00
SPECIAL MONTHLY REPORT ON BULLIONS NOVEMBER 2018
 SPECIAL MONTHLY REPORT ON NOVEMBER 2018 PERFORMANCE (October 2018) (% change) COMEX -2.92 1.57 Silver Gold MCX -1.37 3.14-4.00-3.00-2.00-1.00 0.00 1.00 2.00 3.00 4.00 PERFORMANCE (January - October 2018)
SPECIAL MONTHLY REPORT ON
 SPECIAL MONTHLY REPORT ON BASE METALS MARCH 2018 COPPER NICKEL LEAD ZINC ALIUMINUM BASE METALS PERFORMANCE (February 2018) (% change) Nickel 1.90 1.81 4.33 Lead -3.56-2.00-1.08 Aluminium -2.97-1.11-0.89
3rd April Monthly Report On SPICES. April 2017
 Monthly Report On SPICES April 2017 3rd April 2017 CARDAMOM Forward curve of Cardamom futures Historic returns of Cardamom futures during month of April 1420.00 15% 1370.00 1400.40 11% 1320.00 1270.00
3rd May Monthly Report On. May 2017
 3rd May 2017 Monthly Report On Guar, Kapas & Wheat May 2017 KAPAS Kapas futures Seasonal Index Historic returns of Kapas futures during month of May 1.06 1.04 1.02 1.00 0.98 0.96 0.94 0.92 0.90 Jan Feb
29 January, 2018 GUAR SEED OPTIONS: A BOON FOR AGRI-COMMODITY MARKET
 29 January, 2018 GUAR SEED OPTIONS: A BOON FOR AGRI-COMMODITY MARKET Guar Seed Options: A boon for agri-commodity market Shri Arun Jaitley (Hon ble Finance Minister, Govt. of India) launched the Agri Options
2nd Feb Monthly Report On. February 2017
 2nd Feb 2017 Monthly Report On Other Commodities Other Commodities February 2017 SUGAR Forward curve of Sugar M futures Historic returns of Sugar futures during month of February 3,900.00 8% 3,880.00 3,880.00
Monthly Report On SPICES. June 2018
 Monthly Report On 5th June, 2018 SPICES June 2018 TURMERIC (July) Forward curve of Turmeric futures Historic returns of Turmeric futures during month of June 7600 25% 7500 7548 20% 19.84% 7400 7404 15%
2nd May Monthly Report On SPICES. May 2017
 2nd May 2017 Monthly Report On SPICES May 2017 CARDAMOM Forward curve of Cardamom futures Historic returns of Cardamom futures during month of May 1250.00 1200.00 1150.00 1100.00 1050.00 1000.00 950.00
2nd May, Monthly Report On SPICES. May 2018
 Monthly Report On 2nd May, 2018 SPICES May 2018 TURMERIC (June) 7400.00 Forward curve of Turmeric futures 10% Historic returns of Turmeric futures during month of May 7350.00 7382.00 6.39% 5% 7300.00 7298.00
July 24, 2018 HDFC ASSET MANAGEMENT COMPANY LIMITED. SMC Ranking (3.5/5) About the Company. Issue Highlights. Strength. Shareholding Pattern (%)
 About the Company. Issue Highlights. Strength. Shareholding Pattern (%)") HDFC ASSET MANAGEMENT COMPANY LIMITED July 24, 2018 SMC Ranking (3.5/5) Issue Highlights Industry Mutual Fund Offer for sale (Shares) 25,457,555 Reservation Portions 3,280,000 Net Offer to the Public 22,177,555
HDFC ASSET MANAGEMENT COMPANY LIMITED July 24, 2018 SMC Ranking (3.5/5) Issue Highlights Industry Mutual Fund Offer for sale (Shares) 25,457,555 Reservation Portions 3,280,000 Net Offer to the Public 22,177,555
PNB HOUSING FINANCE LIMITED OFFER FOR SALE 28 - NOVEMBER
 PNB HOUSING FINANCE LIMITED OFFER FOR SALE 28 - NOVEMBER - 2017 OFFER BACKGROUND The Punjab National Bank (The "Seller") is the promoter of PNB Housing Finance Ltd ("the Company") has submitted to BSE
3rd November, Monthly Report On. November 2017
 3rd, 2017 Monthly Report On Kapas, Guar & Chana 2017 KAPAS Forward curve of Cotton 29MM futures Historic returns of Kapas futures during month of 1.06 1.06 1.04 1.04 1.02 1.02 0.98 0.98 0.96 0.96 0.94
ICICI Prudential Life Insurance Company Limited OFFER FOR SALE 14 - JUNE
 ICICI Prudential Life Insurance Company Limited OFFER FOR SALE 14 - JUNE - 2018 OFFER BACKGROUND The ICICI Bank Ltd (Promoter / Promoter Group) has submitted to BSE a copy of proposed offer for sale of
MARCH 2018 SMC RETAIL DESK
 TOP PICKS MARCH 2018 SMC RETAIL DESK HAVELLS INDIA LIMITED Investment Rationale: Target Price 586 Upside Potential 18% Havells India Limited is one of India s largest & fastest growing electrical and power
Monthly Report On. 2nd July, 2018 SPICES. July 2018
 Monthly Report On 2nd July, 2018 SPICES July 2018 TURMERIC (August) 7500 Forward curve of Turmeric futures 50% Historic returns of Turmeric futures during month of July 7450 40% 40.21% 7446 30% 7400 20%
1 April, 2019 CONTENTS
 CONTENTS Industry & Fund Update 2 New Fund Offers 3 Performance of Equity Funds 4 Performance of Balanced Funds 5 Performance of Debt Funds 6 Performance of Fund Of Funds 7 st 1 April, 2019 INDUSTRY &
January 09, 2018 APOLLO MICRO SYSTEMS LIMITED. SMC Ranking (2.5/5) About the Company. Issue Highlights. Strengths: Shareholding Pattern (%) Strategy
 About the Company. Issue Highlights. Strengths: Shareholding Pattern (%) Strategy") APOLLO MICRO SYSTEMS LIMITED January 09, 2018 SMC Ranking (2.5/5) Issue Highlights Industry Defense Total Issue (Shares) 5,672,727 Total Employee Reservation (Shares) 20,000 Net Offer to the Public 5,672,727
APOLLO MICRO SYSTEMS LIMITED January 09, 2018 SMC Ranking (2.5/5) Issue Highlights Industry Defense Total Issue (Shares) 5,672,727 Total Employee Reservation (Shares) 20,000 Net Offer to the Public 5,672,727
December 13, 2017 ASTRON PAPER AND BOARD MILLS LIMITED. SMC Ranking (1/5) About the Company. Issue Highlights. Strength. Shareholding Pattern (%)
 About the Company. Issue Highlights. Strength. Shareholding Pattern (%)") ASTRON PAPER AND BOARD MILLS LIMITED December 13, 2017 SMC Ranking (1/5) Issue Highlights Industry Book Running Lead Manager Pantomath Capital Advisors Private Limited Name of the registrar PAPER INDUSTRY
ASTRON PAPER AND BOARD MILLS LIMITED December 13, 2017 SMC Ranking (1/5) Issue Highlights Industry Book Running Lead Manager Pantomath Capital Advisors Private Limited Name of the registrar PAPER INDUSTRY
LT Technology Services Limited OFFER FOR SALE 02 - AUGUST
 LT Technology Services Limited OFFER FOR SALE 02 - AUGUST - 2018 OFFER BACKGROUND Larsen & Tourbo Ltd ("the Seller") has submitted to BSE a copy of Notice of Offer of Sale up to 41,00,000 equity shares
SPECIAL MONTHLY REPORT ON BASE METALS
 SPECIAL MONTHLY REPORT ON BASE METALS SEPTEMBER 2017 COPPER NICKEL LEAD ZINC ALIUMINUM BASE METALS PERFORMANCE (August 2017) (% change) Nickel 13.53 14.83 Lead 2.64 2.62 7.48 Aluminium 11.00 10.31 14.28
March 20, 2018 MISHRA DHATU NIGAM LIMITED. SMC Ranking (2.5/5) About the Company. Issue Highlights. Strength. Shareholding Pattern (%)
 About the Company. Issue Highlights. Strength. Shareholding Pattern (%)") MISHRA DHATU NIGAM LIMITED March 20, 2018 SMC Ranking (2.5/5) Issue Highlights Industry Book Running Lead Manager IDBI Capital Markets & Securities Limited SBI Capital Markets Limited Name of the registrar
MISHRA DHATU NIGAM LIMITED March 20, 2018 SMC Ranking (2.5/5) Issue Highlights Industry Book Running Lead Manager IDBI Capital Markets & Securities Limited SBI Capital Markets Limited Name of the registrar
IPO NOTE. Jan 19, BSE Ltd. About the company. Issue Highlights. Objects of the Issue. Strength. Issue Composition
 BSE Ltd. Jan 19, 2017 IPO NOTE Issue Highlights Total Issue (Shares) - Offer for sale 15,427,197 Total Issue (Shares) - Fresh Issue 0 Net Offer to the Public 15,427,197 Issue Size (Rs. Cr.) 1241.89-1243.33
September 19, 2017 SBI LIFE INSURANCE COMPANY LIMITED. SMC Ranking (3/5) About the Company. Issue Highlights. Strength. Shareholding Pattern (%)
 About the Company. Issue Highlights. Strength. Shareholding Pattern (%)") SBI LIFE INSURANCE COMPANY LIMITED September 19, 2017 SMC Ranking (3/5) Issue Highlights Industry Insurance Total Issue (Shares) - Offer for sale 120,000,000 Net Offer to the Public 120,000,000 Issue Size
SBI LIFE INSURANCE COMPANY LIMITED September 19, 2017 SMC Ranking (3/5) Issue Highlights Industry Insurance Total Issue (Shares) - Offer for sale 120,000,000 Net Offer to the Public 120,000,000 Issue Size
SPECIAL MONTHLY REPORT ON BASE METALS
 SPECIAL MONTHLY REPORT ON BASE METALS OCTOBER 2017 COPPER NICKEL LEAD ZINC ALIUMINUM BASE METALS PERFORMANCE (September 2017) (% change) Nickel -10.71-8.81 Lead 6.95 6.83 10.53 Aluminium -0.55-2.20 1.18
SPECIAL MONTHLY REPORT ON BASE METALS
 SPECIAL MONTHLY REPORT ON BASE METALS NOVEMBER 2017 COPPER NICKEL LEAD ZINC ALIUMINUM BASE METALS PERFORMANCE (October 2017) (% change) Nickel 14.22 16.24 Lead -15.14-4.61-4.16 Aluminium -0.37 3.53 2.15
CONTENTS Industry & Fund Update New Fund Offers Performance of Equity Funds Performance of Balanced Funds Performance of Debt Funds
 CONTENTS Industry & Fund Update 1 New Fund Offers 2 Performance of Equity Funds 3 Performance of Balanced Funds 4 Performance of Debt Funds 5 Performance of Fund Of Funds 6 18th February, 2019 INDUSTRY
APL Apollo Tubes India Limited 14 th August, 2018 BUY. Result Update. Result Highlights
 APL Apollo Tubes India Limited 14 th August, 2018 Result Update BUY Result Highlights Sector- Iron and Steel Products CMP 1,749 Target Price 2,615 % Up Side 50% Bloomberg Code Stock Info APAT IN Market
RASHTRIYA CHEMICALS AND FERTILIZERS LTD OFFER FOR SALE 29 - JUN
 RASHTRIYA CHEMICALS AND FERTILIZERS LTD OFFER FOR SALE 29 - JUN - 2017 OFFER BACKGROUND The President of India (acting through and represented by the Ministry of Chemicals & Fertilizers, Government of
SPECIALMONTHLYREPORTON. BASEMETALS (June 2017)
") SPECIALMONTHLYREPORTON BASEMETALS (June 2017) BASE METALS PERFORMANCE (May 2017) (% change) Nickel -6.77-4.48 Lead -7.74-6.57-1.24 Aluminium -2.44 0.42 0.77 SHFE LME MCX Zinc -1.94-0.65 4.34 Copper -1.49-2.09
SPECIALMONTHLYREPORTON BASEMETALS (June 2017) BASE METALS PERFORMANCE (May 2017) (% change) Nickel -6.77-4.48 Lead -7.74-6.57-1.24 Aluminium -2.44 0.42 0.77 SHFE LME MCX Zinc -1.94-0.65 4.34 Copper -1.49-2.09
CPSE ETF Product Note
 CPSE ETF Product Note What are Exchange Traded Funds (ETFs) An ETF is a marketable security that tracks an underlying index, a commodity or bonds. Equity ETFs are simple investment products that combine
July 12, 2017 SALASAR TECHNO ENGINEERING LTD. About the company. Issue Highlights. Strength. Shareholding Pattern (%) Objects of the Issue.
 Objects of the Issue.") SALASAR TECHNO ENGINEERING LTD July 12, 2017 About the company Issue Highlights Industry Book Running Lead Manager SARTHI CAPITAL ADVISORS PRIVATE LIMITED Name of the registrar Steel & Allied Total Issue
SALASAR TECHNO ENGINEERING LTD July 12, 2017 About the company Issue Highlights Industry Book Running Lead Manager SARTHI CAPITAL ADVISORS PRIVATE LIMITED Name of the registrar Steel & Allied Total Issue
October 24, 2017 RELIANCE NIPPON LIFE ASSET MANAGEMENT LIMITED. SMC Ranking (3/5) About the Company. Issue Highlights. Shareholding Pattern (%)
 About the Company. Issue Highlights. Shareholding Pattern (%)") RELIANCE NIPPON LIFE ASSET MANAGEMENT LIMITED October 24, 2017 SMC Ranking (3/5) Issue Highlights Industry Mutual Fund Total Issue (Shares) - Offer for sale 36,720,000 Total Issue (Shares) - Fresh Issue
RELIANCE NIPPON LIFE ASSET MANAGEMENT LIMITED October 24, 2017 SMC Ranking (3/5) Issue Highlights Industry Mutual Fund Total Issue (Shares) - Offer for sale 36,720,000 Total Issue (Shares) - Fresh Issue
October 27, 2017 THE NEW INDIA ASSURANCE COMPANY LIMITED. SMC Ranking (3.5/5) About the Company. Issue Highlights. Competitive Strengths
 About the Company. Issue Highlights. Competitive Strengths") THE NEW INDIA ASSURANCE COMPANY LIMITED October 27, 2017 SMC Ranking (3.5/5) Issue Highlights Industry General Insurance Total Issue (Shares) - Offer for sale 96,000,000 Total Issue (Shares) - Fresh Issue
THE NEW INDIA ASSURANCE COMPANY LIMITED October 27, 2017 SMC Ranking (3.5/5) Issue Highlights Industry General Insurance Total Issue (Shares) - Offer for sale 96,000,000 Total Issue (Shares) - Fresh Issue
June 15, 2017 CENTRAL DEPOSITORY (INDIA) SERVICES LIMITED. SMC Ranking (3.5/5) About the company. Issue Highlights. Strength. Shareholding Pattern (%)
 SERVICES LIMITED. SMC Ranking (3.5/5) About the company. Issue Highlights. Strength. Shareholding Pattern (%)") CENTRAL DEPOSITORY (INDIA) SERVICES LIMITED June 15, 2017 SMC Ranking (3.5/5) Issue Highlights Industry Depository Total Issue (Shares) - Offer for sale 35,167,208 Net Offer to the Public 35,167,208 Issue
CENTRAL DEPOSITORY (INDIA) SERVICES LIMITED June 15, 2017 SMC Ranking (3.5/5) Issue Highlights Industry Depository Total Issue (Shares) - Offer for sale 35,167,208 Net Offer to the Public 35,167,208 Issue
2nd August, Monthly Report On. August 2017
 2nd August, 2017 Monthly Report On Kapas, Guar & Chana August 2017 KAPAS (APRIL) Kapas futures Seasonal Index Historic returns of Kapas futures during month of August 1.06 1.06 1.04 1.04 1.02 1.02 0.98
FOR PRIVATE CIRCULATION ONLY 8 May 2018 MARKET ANALYSIS MARKET OUTLOOK
 FOR PRIVATE CIRCULATION ONLY 8 May 2018 MARKET ANALYSIS NYMEX crude slipped more than 1% to trade slightly below $70 per barrel after a 1.4% rally yesterday. Crude oil surged as high as $70.84/bbl in intraday
CONTENTS Industry & Fund Update New Fund Offers Performance of Equity Funds Performance of Balanced Funds Performance of Debt Funds
 CONTENTS Industry & Fund Update 1 New Fund Offers 2 Performance of Equity Funds 3 Performance of Balanced Funds 4 Performance of Debt Funds 5 Performance of Fund Of Funds 6 29th January, 2018 INDUSTRY
SPECIAL MONTHLY REPORT ON BASE METALS
 SPECIAL MONTHLY REPORT ON BASE METALS SEPTEMBER 2018 COPPER NICKEL LEAD ZINC ALIUMINUM BASE METALS PERFORMANCE (August 2018) (% change) Nickel -6.87-5.52-5.74 Lead -4.27-0.64 2.64 Aluminium Zinc -4.79-3.22
8 April, 2019 CONTENTS
 CONTENTS Industry & Fund Update 2 New Fund Offers 3 Performance of Equity Funds 4 Performance of Balanced Funds 5 Performance of Debt Funds 6 Performance of Fund Of Funds 7 st 8 April, 2019 INDUSTRY &
January 16, 2018 AMBER ENTERPRISES INDIA LIMITED. SMC Ranking (2.5/5) About the Company. Issue Highlights. Strengths. Shareholding Pattern (%)
 About the Company. Issue Highlights. Strengths. Shareholding Pattern (%)") AMBER ENTERPRISES INDIA LIMITED January 16, 2018 SMC Ranking (2.5/5) Issue Highlights Industry Book Running Lead Manager Edelweiss Financial Services Limited IDFC Bank Limited SBI Capital Markets Limited
AMBER ENTERPRISES INDIA LIMITED January 16, 2018 SMC Ranking (2.5/5) Issue Highlights Industry Book Running Lead Manager Edelweiss Financial Services Limited IDFC Bank Limited SBI Capital Markets Limited
CONTENTS 27th Feb 2017
 CONTENTS Industry & Fund Update 1 Dividend Declared 3 New Fund Offers 4 Performance of Equity Funds 5 Performance of Balanced Funds 6 Performance of Debt Funds 7 Performance of Fund Of Funds 8 27th Feb
CONTENTS Industry & Fund Update New Fund Offers Performance of Equity Funds Performance of Balanced Funds Performance of Debt Funds
 CONTENTS Industry & Fund Update 1 New Fund Offers 2 Performance of Equity Funds 3 Performance of Balanced Funds 4 Performance of Debt Funds 5 Performance of Fund Of Funds 6 2nd July, 2018 INDUSTRY & FUND
June 22, 2018 VARROC ENGINEERING LIMITED. SMC Ranking (2/5) About the Company. Issue Highlights. Strength. Shareholding Pattern (%)
 About the Company. Issue Highlights. Strength. Shareholding Pattern (%)") VARROC ENGINEERING LIMITED June 22, 2018 SMC Ranking (2/5) Book Running Lead Manager Issue Highlights Industry Kotak Mahindra Capital Company Limited Citigroup Global Markets India Private Limited Credit
VARROC ENGINEERING LIMITED June 22, 2018 SMC Ranking (2/5) Book Running Lead Manager Issue Highlights Industry Kotak Mahindra Capital Company Limited Citigroup Global Markets India Private Limited Credit
CONTENTS Industry & Fund Update New Fund Offers Performance of Equity Funds Performance of Balanced Funds Performance of Debt Funds
 CONTENTS Industry & Fund Update 1 New Fund Offers 2 Performance of Equity Funds 3 Performance of Balanced Funds 4 Performance of Debt Funds 5 Performance of Fund Of Funds 6 27th November, 2017 INDUSTRY
COMMODITY RESEARCH Kunal Kame COMMODITY DAILY 06 TH JULY 2018
 COMMODITY RESEARCH Kunal Kame COMMODITY DAILY 06 TH JULY 2018 In Yesterday s Session Bullion was trading weak ahead of minutes from the U.S. Federal Reserve's June policy meeting later in the day. The
March 15, 2018 HINDUSTAN AERONAUTICS LIMITED. SMC Ranking (3/5) About the Company. Issue Highlights. Strength. Shareholding Pattern (%)
 About the Company. Issue Highlights. Strength. Shareholding Pattern (%)") HINDUSTAN AERONAUTICS LIMITED March 15, 2018 SMC Ranking (3/5) Issue Highlights Industry Book Running Lead Manager Axis Capital Limited SBI Capital Markets Limited Name of the registrar Defence Offer for
HINDUSTAN AERONAUTICS LIMITED March 15, 2018 SMC Ranking (3/5) Issue Highlights Industry Book Running Lead Manager Axis Capital Limited SBI Capital Markets Limited Name of the registrar Defence Offer for
CONTENTS 27th Mar 2017
 CONTENTS Industry & Fund Update 1 Dividend Declared 2 New Fund Offers 3 Performance of Equity Funds 4 Performance of Balanced Funds 5 Performance of Debt Funds 6 Performance of Fund Of Funds 7 27th Mar
04th April Monthly Report On. Oilseeds. April 2017
 Monthly Report On Oilseeds April 2017 04th April 2017 Domestic : Soybean (NCDEX) Forward Curve of Soybean Futures (NCDEX) Historic return of Soybean futures (NCDEX) in the month of April 3300.00 2 17.47%
September 21, 2018 GARDEN REACH SHIPBUILDERS & ENGINEERS LIMITED. SMC Ranking (2/5) About the Company. Issue Highlights. Strength
 About the Company. Issue Highlights. Strength") GARDEN REACH SHIPBUILDERS & ENGINEERS LIMITED September 21, 2018 SMC Ranking (2/5) Book Running Lead Manager Ÿ Ÿ Issue Highlights Industry IDBI Capital Markets & Securities Limited YES Securities (India)
GARDEN REACH SHIPBUILDERS & ENGINEERS LIMITED September 21, 2018 SMC Ranking (2/5) Book Running Lead Manager Ÿ Ÿ Issue Highlights Industry IDBI Capital Markets & Securities Limited YES Securities (India)
September 07, 2017 MATRIMONY.COM LIMITED. SMC Ranking (2.5/5) About the Company. Issue Highlights. Competitive Strengths: Shareholding Pattern (%)
 About the Company. Issue Highlights. Competitive Strengths: Shareholding Pattern (%)") MATRIMONY.COM LIMITED September 07, 2017 SMC Ranking (2.5/5) Issue Highlights Industry Online Matchmaking Total Issue (Shares) - Offer for sale 3,767,254 Total Issue (Shares) - Fresh Issue 1,319,797 Net
MATRIMONY.COM LIMITED September 07, 2017 SMC Ranking (2.5/5) Issue Highlights Industry Online Matchmaking Total Issue (Shares) - Offer for sale 3,767,254 Total Issue (Shares) - Fresh Issue 1,319,797 Net
CONTENTS Industry & Fund Update New Fund Offers Performance of Equity Funds Performance of Balanced Funds Performance of Debt Funds
 CONTENTS Industry & Fund Update 1 New Fund Offers 2 Performance of Equity Funds 3 Performance of Balanced Funds 4 Performance of Debt Funds 5 Performance of Fund Of Funds 6 1st January, 2018 INDUSTRY &
August 22, 2017 APEX FROZEN FOODS LIMITED. SMC Ranking (2/5) About the Company. Issue Highlights. Strength. Shareholding Pattern (%)
 About the Company. Issue Highlights. Strength. Shareholding Pattern (%)") APEX FROZEN FOODS LIMITED August 22, 2017 SMC Ranking (2/5) About the Company Issue Highlights Industry Book Running Lead Manager Karvy Investor Services Limited Name of the registrar Bigshare Services
APEX FROZEN FOODS LIMITED August 22, 2017 SMC Ranking (2/5) About the Company Issue Highlights Industry Book Running Lead Manager Karvy Investor Services Limited Name of the registrar Bigshare Services
CONTENTS Industry & Fund Update New Fund Offers Performance of Equity Funds Performance of Balanced Funds Performance of Debt Funds
 CONTENTS Industry & Fund Update 1 New Fund Offers 2 Performance of Equity Funds 3 Performance of Balanced Funds 4 Performance of Debt Funds 5 Performance of Fund Of Funds 6 8th January, 2018 INDUSTRY &
COMMODITY RESEARCH Kunal Kame COMMODITY DAILY 30 TH AUGUST 2018
 COMMODITY RESEARCH Kunal Kame COMMODITY DAILY 30 TH AUGUST 2018 In Yesterday s Session Bullion edged up in Wednesday s session as fund managers bet prices would find short-term support at psychological
Energy Daily. Energy Benchmark. Oil slams over proposed increase in OPEC+ output. Get today s analysis on market fundamentals and pricing action here!
 Energy Daily Brought to you by Phillip Futures Pte Ltd (A member of PhillipCapital) Friday, 05 October 2018 Energy Benchmark Product Crude Oil Prices Opening Price % Change from previous day OP ICE BRENT
OIL PRICING AND VOLATILITY IN A MACRO AND MICRO VIEW
 OIL PRICING AND VOLATILITY IN A MACRO AND MICRO VIEW By Jon Hammond Sr. Director EH Energy November 28, 2018 www.eulerhermes.us/energy Oil Pricing and Volatility in a Macro and Micro View 3 WORDWIDE OIL
Market Overview. Key Market Commentaries. Weekly Market Assessment. This Week s Outlook: Mildly Bullish (WTI: ) Mid-Term Market Assessment
 Mid-Term Market Assessment") Energy Daily Brought to you by Phillip Futures Pte Ltd (A member of PhillipCapital) Monday, 25 February 2019 54. Energy Benchmark Product Crude Oil Prices Opening Price % Change from previous day OP ICE
Energy Daily Brought to you by Phillip Futures Pte Ltd (A member of PhillipCapital) Monday, 25 February 2019 54. Energy Benchmark Product Crude Oil Prices Opening Price % Change from previous day OP ICE
Market Overview. Key Market Commentaries. Daily Market Assessment. Today s Outlook: Mildly Bullish (WTI: ) Mid-Term Market Assessment
 Mid-Term Market Assessment") Energy Daily Brought to you by Phillip Futures Pte Ltd (A member of PhillipCapital) Friday, 22 February 2019 54. Energy Benchmark Product Crude Oil Prices Opening Price % Change from previous day OP ICE
Energy Daily Brought to you by Phillip Futures Pte Ltd (A member of PhillipCapital) Friday, 22 February 2019 54. Energy Benchmark Product Crude Oil Prices Opening Price % Change from previous day OP ICE
CONTENTS Industry & Fund Update New Fund Offers Performance of Equity Funds Performance of Balanced Funds Performance of Debt Funds
 CONTENTS Industry & Fund Update 1 New Fund Offers 2 Performance of Equity Funds 3 Performance of Balanced Funds 4 Performance of Debt Funds 5 Performance of Fund Of Funds 6 30th July, 2018 INDUSTRY & FUND
CONTENTS Industry & Fund Update New Fund Offers Performance of Equity Funds Performance of Balanced Funds Performance of Debt Funds
 CONTENTS Industry & Fund Update 1 New Fund Offers 2 Performance of Equity Funds 3 Performance of Balanced Funds 4 Performance of Debt Funds 5 Performance of Fund Of Funds 6 26th December, 2017 INDUSTRY
Exchange Spot ICE-Brent. Contract. Open High Low Close
 04 January 2010 Market Commentary Oil finishes the year climbing whooping 78% Crude prices traded in a very small range of $2 during the previous week on the back of year end holidays. But continuing with
Oil edges up for the 3 rd consecutive day amidst supply cuts. Market Overview. Key Market Commentaries. Daily Market Assessment
 Energy Daily Brought to you by Phillip Futures Pte Ltd (A member of PhillipCapital) Friday, 15 February 2019 Energy Benchmark Product Crude Oil Prices Opening Price % Change from previous day OP ICE BRENT
CONTENTS Industry & Fund Update New Fund Offers Performance of Equity Funds Performance of Balanced Funds Performance of Debt Funds
 CONTENTS Industry & Fund Update 1 New Fund Offers 2 Performance of Equity Funds 3 Performance of Balanced Funds 4 Performance of Debt Funds 5 Performance of Fund Of Funds 6 5th November, 2018 INDUSTRY
COMMODITY DAILY. Global Market Round Up. Commodity Research - Alpha Commodity Pvt Ltd. As on Friday, April 28, 2017
 Global Market Round Up Commodities traded lower with Bullion declined in evening session on stronger dollar on US tax reforms. Crude oil prices traded lower after steady trading session on supply overhang
COMMODITY RESEARCH Kunal Kame COMMODITY DAILY 01 ST AUGUST 2018
 COMMODITY RESEARCH Kunal Kame COMMODITY DAILY 01 ST AUGUST 2018 In Yesterday s Session Bullion continued to remain weak ahead of US Fed policy meeting. The U.S. Federal Reserve begins its two-day monetary
Dec 01, 2016 LAURUS LABS LIMITED. SMC Ranking. (3/5) About the company. Issue Highlights. Strengths. Objects of the Issue. Shareholding Pattern (%)
 About the company. Issue Highlights. Strengths. Objects of the Issue. Shareholding Pattern (%)") LAURUS LABS LIMITED Dec 01, 2016 SMC Ranking (3/5) About the company Issue Highlights Industry Pharma Total Issue (Shares) - Offer for sale 24,844,240 Total Issue (Shares) - Fresh Issue 7,009,346 Net Offer
LAURUS LABS LIMITED Dec 01, 2016 SMC Ranking (3/5) About the company Issue Highlights Industry Pharma Total Issue (Shares) - Offer for sale 24,844,240 Total Issue (Shares) - Fresh Issue 7,009,346 Net Offer
CONTENTS Industry & Fund Update New Fund Offers Performance of Equity Funds Performance of Balanced Funds Performance of Debt Funds
 CONTENTS Industry & Fund Update 1 New Fund Offers 2 Performance of Equity Funds 3 Performance of Balanced Funds 4 Performance of Debt Funds 5 Performance of Fund Of Funds 6 25th June, 2018 INDUSTRY & FUND
Friday, August 12, 2016 MAJOR COMMODITIES. News & Development. For Private Circulation Only
 Friday, August 12, 2016 For Private Circulation Only MAJOR COMMODITIES Commodity Expiry High Low Close Change Commodity Expiry High Low Close ($) Change Gold 05-Oct 31492 31262 31327-66 Gold (Oz) Oct 1350.40
FOR PRIVATE CIRCULATION ONLY 11 September 2018 MARKET ANALYSIS
 FOR PRIVATE CIRCULATION ONLY 11 September 2018 MARKET ANALYSIS NYMEX crude trades in a narrow range above $67 per barrel after a 0.3% decline yesterday. Crude is rangebound amid mixed cues and this trend
WEEKLY LATEST UPDATES
 WEEKLY LATEST UPDATES Oil prices were up slightly in heavy, seesaw trading on Friday, giving back earlier gains after news that major producers would consider additional supply a day after U.S. President
Monday, April 10, 2017 MAJOR COMMODITIES. News & Development. For Private Circulation Only
 Monday, April 10, 2017 For Private Circulation Only MAJOR COMMODITIES Commodity Expiry High Low Close Change Commodity Expiry High Low Close ($) Change Gold 05-Jun 29000 28661 28684-37 Gold (Oz) Jun 1273.30
ENERGY. Monthly Report. September 2015
 ENERGY Monthly Report September 2015 HIGHLIGHTS OF AUGUST Brent futures fell 5.2 percent at the start of the month to below $50 for the first time since January 29. The Obama administration won support
Energy Daily. Energy Benchmark. Weekly: Oil jumps as US announces for withdrawal on Iran deal
 Energy Daily Brought to you by Phillip Futures Pte Ltd (A member of PhillipCapital) Monday, 14 May 2018 Energy Benchmark Product Crude Oil Prices Opening Price % Change from previous day OP ICE BRENT 77.05-0.64%
COMMODITY WEEKLY REPORT
 COMMODITY REPORT 2017 Monday-Friday Trade House 426 Alok Nagar, Kanadia Main Road Near Bangali Square Indore-452001 (M.P.) India Mobile :+91-9039261444 E-mail: info@tradenivesh.in Telephone :+91-731-698.3000
07 August, Monthly Report On. Oilseeds. August 2017
 Monthly Report On Oilseeds August 2017 07 August, 2017 Domestic : Soybean (NCDEX) Forward Curve of Soybean Futures (NCDEX) Historic return of Soybean futures (NCDEX) in the month of August 3300.00 3250.00
CORPORATE ACTION METER 30th July 2018 AGM (AGM) & DIVIDEND AGM BOARD MEETINGS. TODAY S CORPORATE ACTION (30th July 2018)
 & DIVIDEND AGM BOARD MEETINGS. TODAY S CORPORATE ACTION (30th July 2018)") CORPORATE ACTION METER 30th July 2018 TODAY S CORPORATE ACTION (30th July 2018) AGM (AGM) & DIVIDEND KALPATPOWR 30-Jul-18 1-Aug-18 7-Aug-18 AGM/Dividend- Rs 2.5 Per Share JMCPROJECT 30-Jul-18 1-Aug-18
CORPORATE ACTION METER 30th July 2018 TODAY S CORPORATE ACTION (30th July 2018) AGM (AGM) & DIVIDEND KALPATPOWR 30-Jul-18 1-Aug-18 7-Aug-18 AGM/Dividend- Rs 2.5 Per Share JMCPROJECT 30-Jul-18 1-Aug-18
Wednesday, April 05, 2017 MAJOR COMMODITIES. News & Development. For Private Circulation Only
 Wednesday, April 05, 2017 For Private Circulation Only MAJOR COMMODITIES Commodity Expiry High Low Close Change Commodity Expiry High Low Close ($) Change Gold 05-Apr 28963 28816 28862 160 Gold (Oz) Jun
[ ] MACRO & MARKET COMMENTARY. » U.S. started the process to draft plans on a further $200 billion in Chinese
![[ ] MACRO & MARKET COMMENTARY. » U.S. started the process to draft plans on a further $200 billion in Chinese](/thumbs/93/112218100.jpg "[ ] MACRO & MARKET COMMENTARY. » U.S. started the process to draft plans on a further $200 billion in Chinese") July 16, 2018 [ ] MACRO & MARKET COMMENTARY» U.S. started the process to draft plans on a further $200 billion in Chinese imports after tensions between the two largest economies in the world intensified,
July 16, 2018 [ ] MACRO & MARKET COMMENTARY» U.S. started the process to draft plans on a further $200 billion in Chinese imports after tensions between the two largest economies in the world intensified,
Tuesday, April 11, 2017 MAJOR COMMODITIES. News & Development. For Private Circulation Only
 Tuesday, April 11, 2017 For Private Circulation Only MAJOR COMMODITIES Commodity Expiry High Low Close Change Commodity Expiry High Low Close ($) Change Gold 05-Jun 28800 28621 28739 55 Gold (Oz) Jun 1258.90
CONTENTS Industry & Fund Update New Fund Offers Performance of Equity Funds Performance of Balanced Funds Performance of Debt Funds
 CONTENTS Industry & Fund Update 1 New Fund Offers 2 Performance of Equity Funds 3 Performance of Balanced Funds 4 Performance of Debt Funds 5 Performance of Fund Of Funds 6 10th September, 2018 INDUSTRY
Market Overview. Key Market Commentaries. Daily Market Assessment. Today s Outlook: Range-Bound (WTI: ) Mid-Term Market Assessment
 Mid-Term Market Assessment") Energy Daily Brought to you by Phillip Futures Pte Ltd (A member of PhillipCapital) Friday, 22 March 2019 54. Energy Benchmark Product Crude Oil Prices Opening Price % Change from previous day OP ICE BRENT
Energy Daily Brought to you by Phillip Futures Pte Ltd (A member of PhillipCapital) Friday, 22 March 2019 54. Energy Benchmark Product Crude Oil Prices Opening Price % Change from previous day OP ICE BRENT
COMMODITY RESEARCH Kunal Kame COMMODITY DAILY 12 TH JAN 2018
 COMMODITY RESEARCH Kunal Kame COMMODITY DAILY 12 TH JAN 2018 In Yesterday s Session Bullion remained flat to negative in yesterday s session. Prices eased as investors debated the prospect of China trimming
News & Development Rising Channel Bollinger Band Overall, we maintain our bullish view in MCX Crude Oil for the next one month.
 13 th April 2018 News & Development MCX Crude Oil prices has witnessed a spike in the last couple of days and closed at Rs.4362/bbl by 12 th April. Geopolitical tensions prevailing across the globe led
COMMODITY RESEARCH Kunal Kame COMMODITY DAILY 11 TH JUNE 2018
 COMMODITY RESEARCH Kunal Kame COMMODITY DAILY 11 TH JUNE 2018 In Friday s Session Bullion was little change as investors looked forward to the start of the G7 summit. Traders are also keeping a close eye
Saudi Arabian economy
 Research Department ARC Research Team Tel 966 11 211 9370, research@alrajhi-capital.com Saudi Arabian economy Saudi Arabian Economy The IMF executive board maintained the Kingdom s real GDP growth outlook
CONTENTS Industry & Fund Update New Fund Offers Performance of Equity Funds Performance of Balanced Funds Performance of Debt Funds
 CONTENTS Industry & Fund Update 1 New Fund Offers 2 Performance of Equity Funds 3 Performance of Balanced Funds 4 Performance of Debt Funds 5 Performance of Fund Of Funds 6 7th May, 2018 INDUSTRY & FUND
CONTENTS Industry & Fund Update New Fund Offers Performance of Equity Funds Performance of Balanced Funds Performance of Debt Funds
 CONTENTS Industry & Fund Update 1 New Fund Offers 2 Performance of Equity Funds 3 Performance of Balanced Funds 4 Performance of Debt Funds 5 Performance of Fund Of Funds 6 11th September, 2017 INDUSTRY
COMMODITY RESEARCH Kunal Kame COMMODITY DAILY 12 TH APRIL 2018
 COMMODITY RESEARCH Kunal Kame COMMODITY DAILY 12 TH APRIL 2018 In Yesterday s Session Bullion surges more than 1.30% yesterday as a combination of concerns over ongoing trade tensions between the U.S.
COMMODITY RESEARCH Kunal Kame COMMODITY DAILY 12 TH JULY 2018
 COMMODITY RESEARCH Kunal Kame COMMODITY DAILY 12 TH JULY 2018 In Yesterday s Session Bullion, continues with Tuesday down trend as US dollar trade stronger after the Trump administration threatened to
June 20, 2018 FINE ORGANIC INDUSTRIES LIMITED. SMC Ranking (2/5) About the Company. Issue Highlights. Strength. Shareholding Pattern (%)
 About the Company. Issue Highlights. Strength. Shareholding Pattern (%)") FINE ORGANIC INDUSTRIES LIMITED June 20, 2018 SMC Ranking (2/5) Issue Highlights Industry Book Running Lead Manager Ÿ JM Financial Limited Ÿ Edelweiss Financial Services Limited Name of the registrar FMCG
FINE ORGANIC INDUSTRIES LIMITED June 20, 2018 SMC Ranking (2/5) Issue Highlights Industry Book Running Lead Manager Ÿ JM Financial Limited Ÿ Edelweiss Financial Services Limited Name of the registrar FMCG
Oct 20, 2016 VARUN BEVERAGES LIMITED. SMC Ranking (2.5/5) Issue Highlights. About the company. Issue Composition. Competitive Strengths
 Issue Highlights. About the company. Issue Composition. Competitive Strengths") VARUN BEVERAGES LIMITED Oct 20, 2016 SMC Ranking (2.5/5) Issue Highlights Industry FMCG Total Issue(Shares)-Offer for sale 10,000,000 Total Issue (Shares)-Fresh Issue 15,000,000 Net O? er to the Public
VARUN BEVERAGES LIMITED Oct 20, 2016 SMC Ranking (2.5/5) Issue Highlights Industry FMCG Total Issue(Shares)-Offer for sale 10,000,000 Total Issue (Shares)-Fresh Issue 15,000,000 Net O? er to the Public
RELIANCE INDUSTRIES LIMITED. January 29, In Cr. Current Price: ` Consolidated Results STOCK DATA VALUE PARAMETERS
 RELIANCE INDUSTRIES LIMITED January 29, 2018 Current Price: ` 964.55 STOCK DATA BSE Code 500325 NSE Symbol RELIANCE Reuters RELI.BO Bloomberg RIL IN VALUE PARAMETERS Price (Rs) 964.55 52 W H/L(Rs) 990.00/508.05
CONTENTS Industry & Fund Update New Fund Offers Performance of Equity Funds Performance of Balanced Funds Performance of Debt Funds
 CONTENTS Industry & Fund Update 1 New Fund Offers 2 Performance of Equity Funds 3 Performance of Balanced Funds 4 Performance of Debt Funds 5 Performance of Fund Of Funds 6 4th December, 2017 INDUSTRY
COMMODITY RESEARCH Kunal Kame COMMODITY DAILY 23 RD JAN 2018
 COMMODITY RESEARCH Kunal Kame COMMODITY DAILY 23 RD JAN 2018 In Yesterday s Session Bullion was marginally positively with US market awaiting word on a possible deal for a Senate vote to end the US government
22-26 Oct.2018 COMMODITY WEEKLY REPORT OCTOBER 2018
 COMMODITY REPORT 22-26 Oct.2018 Trade House 426 Alok Nagar, Kanadia Main Road Near Bangali Square Indore-452001 (M.P.) India Mobile :+91-9039261444 E-mail: info@tradenivesh.in COMMODITIES PREVIOUS WEEKS