Dilip Buildcon. Visit Note. Buy. FY18E a bumper year! Show continues!
|
|
|
- Ashley Oliver Martin
- 5 years ago
- Views:
Transcription

 and signing of an agreement with Shrem Group (Aug 17) to exit 1% from its 24 BoT projects for ` 16bn, DBL is in much better placed to")
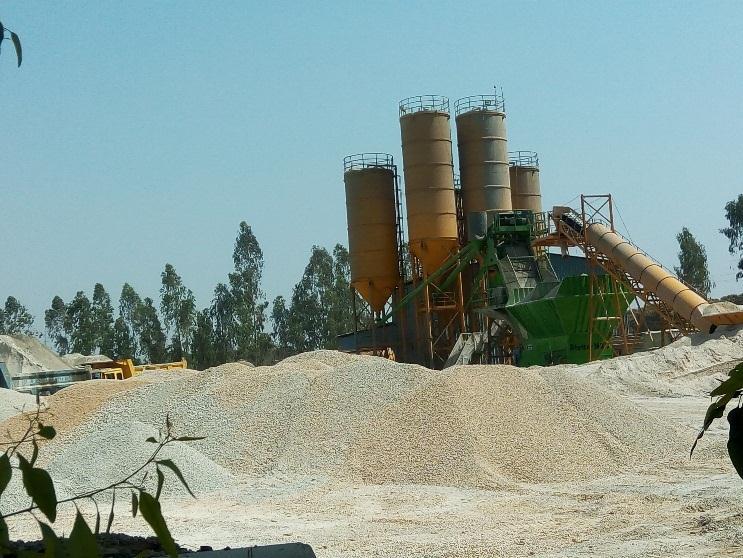
1 Apr-17 May-17 Jun-17 Jul-17 Aug-17 Sep-17 Oct-17 Nov-17 Dec-17 Jan-18 Feb-18 Mar-18 Visit Note Dilip Buildcon Buy FY18E a bumper year! Show continues! Company and Strategy DBL with its differentiated business model that lays on project selection and execution with operational efficiency continues to remain one of the prime beneficiaries of Govt s Bharatmala project (` 6.95tn). With its presence across 13 states of India (as on Mar 18) and signing of an agreement with Shrem Group (Aug 17) to exit 1% from its 24 BoT projects for ` 16bn, DBL is in much better placed to benefit from an upcoming pick up in the road awarding activity. DBL s stock price rose >27% post our initiation (click here) dated 1 th Apr 17 due to constant better performance, reduction in working capital and deleveraging of the balance sheet through the sale of BoT portfolio. Despite the furious spike in the stock price, we reiterate BUY due to its differentiated business model, proven execution capability, growth trajectory coupled with improving financials. Site visit of Lucknow-Sultanpur HAM project 42% completed Our site visit to Lucknow-Sultanpur HAM project in UP gave us a first-hand understanding of faster execution on the ground. DBL received appointed a date for this NHAI project on 8 th May 17 and completed 42% (in 9 months and 18 days) of EPC value of ` 17.8bn. The company targets to complete the entire project by 1 months ahead of the scheduled completion date of 4 th Nov 19. The scope of the project includes km rigid pavement of NH-56. Outlook We upgraded our revenue estimates by 3.9%/ 14.8%/ 15.8% for FY18E/ FY19E/ FY2E due to higher order inflow of ` 115.8bn in YTDFY18 vs. earlier estimate of ` 9bn and better execution on HAM projects. We factored higher capex of ` 11.8bn vs. ` 8.3bn and higher average debt of ` 26bn vs. ` 23.1bn during FY18-2E to support revenue growth, resulting into higher depreciation and interest cost. Hence, we raised Adj. PAT estimates by 6.7%/ 19.5%/ 12.8% for FY18E/ FY19E/ FY2E respectively. We expect DBL s revenue/ Adj. PAT to grow at a healthy CAGR of 33.3%/ 54.5% over FY17-2E. We expect DBL to witness traction in revenue, best EBITDA margin among peers, superior net profit margin, comfortable working capital, robust order inflow and order book, robust FCFF, declining leverage, and improving healthy return ratios (RoE/ RoCE of 26.5%/ 29.4% by FY2E) over FY17-2E. Thus, we reiterate Buy on the stock with an upward revised SOTP of ` 1,423 (Exhibit 1). FINANCIALS (` Mn) Particulars FY16 FY17 FY18E FY19E FY2E Revenue 4,853 5,976 75,366 1,319 12,811 Growth (%) EBITDA excl. OI 7,992 9,923 13,792 18,358 22,18 EBITDA excl. OI (%) Adj. PAT 1,697 2,77 5,22 8,159 1,183 Growth (%) EPS (`) Growth (%) PER(x) ROANW (%) ROACE (%) March 2, 218 CMP Target / Upside `969 `1,423/47% BSE Sensex 32,923 NSE Nifty 1,94 Scrip Details Equity / FV Market Cap 52-week High/Low `1,368mn/`1/- `133bn USD 2bn `1,59/315 Avg. Volume (no) 466,875 NSE Symbol Bloomberg Code Shareholding Pattern Dec 17(%) DBL DBL IN Promoters 75.6 MF/Banks/FIs 4.6 FIIs 11.1 Public / Others DBL Relative to Sensex DBL BSE Sensex Sr. Analyst: Shravan Shah Tel: shravans@dolatcapital.com Associate: Maulik Shah Tel: mauliks@dolatcapital.com
2 SOTP Valuation Component Valuation Method ` /sh % Standalone cons business 18x FY2E EPS Road BOTs 1x FY2E P/B Total CMP 969. Potential upside (%) 46.8 We have not valued DBL s equity investment in 24 BOT projects which it signed an agreement in Aug 17 to sell 1% to Shrem Group for ` 16bn (` 6bn/ ` 1bn to be received in FY18E/ FY19E). However, we have assumed `63 bn (7% of total inflow of ` 9bn) as HAM projects order inflow in FY19E and FY2E each year. We assumed 9% equity requirement for the same (higher than 8.4% in 6 HAM projects won in Q4FY18) and 5% of it to be infused in FY2E and FY21E for HAM order inflow in FY19E. We have also factored ` 8.5bn (5% in FY19E and 5% in FY2E) equity investment for 6 HAM projects won in Q4FY18. Accordingly, we have valued its equity investments in fresh (Q4FY18 + FY19E) HAM projects win at 1x FY2E book value. Upside/ Downside risk to our valuation Higher debt reduction in debt vs. expectation If DBL manages to reduce its debt at much lower level due to a faster reduction in NWC cycle compared to our estimates, then it will positively impact its profitability by a reduction in interest cost and balance sheet by a further dip in leverage. This may lead to further expansion in its valuation multiples and poises upside risk to our target price. Under utilisation of large fleet of equipment and manpower DBL owns a large fleet of equipment and has high employees base, resulting in higher fixed costs. It may have an adverse impact on its profitability if DBL is unable to utilise them properly. Execution delays Though the company has managed to complete most of its projects on or before time, any delay due to an impediment at the client s end or other regulatory bottlenecks could adversely affect DBL s revenue and profitability. Early completion bonus and O&M revenue DBL earned early completion bonuses (average 2.1% of revenue during FY13-17) which is likely considering its excellent track record of completing most of its projects before time. We have factored in 1% of revenue as an early completion bonus. If it earns more/less early completion bonuses vs. our estimates, then it will positively/negatively impact its revenue and profitability. We have not factored O&M order book of ` 67bn and its revenue poises upside risk to our target price. March 2, 218 2
3 Key highlights from interaction with the management Guidance DBL raised the revenue guidance from >` 7bn/ ` 8-84bn to >` 75bn/ ` 1bn in FY18E/ FY19E and 2-25% growth for next couple of years. Fresh EPC order inflow stood at `115.8 bn during YTDFY18 and another `8-1bn of inflows in FY19. DBL has bided for projects worth `115.1 bn which are yet to be opened. DBL would like to maintain order book at 2-2.5x of next year of revenue. DBL s bid to success rate remained at 36%/ 34%/ 27% during FY16/ FY17/ YTDFY18. EBITDA margin at 18-19% in FY19 and FY2. Capex of ` 4.15bn/ ` 3bn in FY18/ FY19, of which, already incurred ` 2.29bn in 9MFY18. Gross fixed asset turnover can reach to 3.5x due to improvement in utilisation of plant and machinery. Absolute gross debt level will continue to reduce from Q3FY18 levels for next couple of years. D:E to reduce below 1x in FY19 and to.5x in next couple of years. Projects won during YTDFY18 Project Authority Segment State `. mn Length in km During Parallel Taxi Track AAI Urban Development Goa 1,25 Q1FY18 Davanagere-Haveri Pkg.1B Karnataka 1,572 7 IRCON Davanagere-Haveri Pkg.2 Karnataka 3,66 4 Seoni MP/MH Border Karodi - Telwadi Road Road - EPC Maharashtra 5,65 56 NHAI MP 7,31 29 Varanasi - Dagamagpur (Pkg-l) UP 6,75 34 Kamataka/Goa Border Karnataka 3,81 52 Dagamagpur-Lalganj (Pkg-2) UP 7,7 48 Chandikhole-Bhadrak Odisha 15,22 75 Anandapuram-Pendurthi-Anakapalli AP 2,13 51 Bangalore-Nidagatta Karnataka 21,9 56 Road HAM Nidagatta-Mysore Karnataka 22,83 61 Gorhar-Khairatunda Jharkhand 9,17 4 Churhat Bypass of Rewasidhi section MP 1,4 15 Total Inflow 136,875* * Total EPC value - ` bn Q4FY18 March 2, 218 3

 Financial progress ` mn Q4FY17 Q1FY18 Q2FY18 Q3FY18 Unexecuted Order Book 17,8 16,558 15,32 12,918 Revenue 1,242 1,238 2,43 % completion 7. 13.9 27.")
4 Opportunities Live Road Tenders worth ` 89 bn Road tenders shared by DBL to be awarded in next 6 months Mode ` bn EPC 295 HAM 49 Others 25 Total 89 Key highlights of site visit of Lucknow-Sultanpur NHAI HAM project Project details Bid Project cost - ` 2.16bn EPC cost - ` 17.8bn Four laning of km of Lucknow - Sultanpur section of NH-56 in UP under NHDP Phase-IV. Appointed date 8 th May 17. Schedule completion date 4 th Nov 19. Expected completion date 31 st Dec 18 (1 months early). Construction period 91 days (2.5 years). Maintenance period 15 years. Cumulative financial progress - `7.5 bn (42%) Financial progress ` mn Q4FY17 Q1FY18 Q2FY18 Q3FY18 Unexecuted Order Book 17,8 16,558 15,32 12,918 Revenue 1,242 1,238 2,43 % completion Site progress - Earthwork Site progress - GSB March 2, 218 4


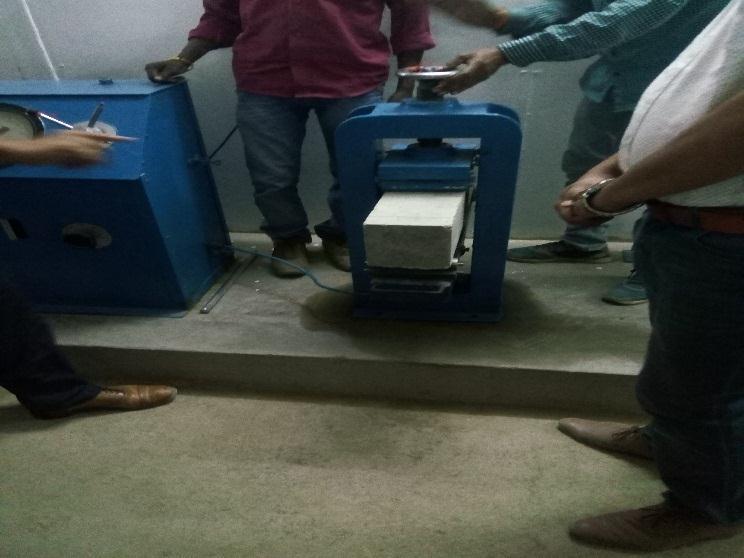
5 Site progress Dry Lean Concrete Site progress Cement Paver Site progress Finished cement layer Site progress Kerb Laying Site progress Hot mix plant Site progress Quality testing March 2, 218 5
6 FY15 FY16 FY17 FY18E FY19E FY2E Order book (` 124bn) break-up Order book trend Road 8% Mining 16% Urban Development 3% (` bn) (x) Irrigation 1% Order book Order inflow Revenue CAGR of 33.3% over FY17-2E (` bn) (%) FY15 FY16 FY17 FY18E FY19E FY2E Revenue YoY growth (RHS) Superior EBITDA Margin to continue (` bn) (%) FY15 FY16 FY17 FY18E FY19E FY2E EBIDTA (Excl. O.I.) EBIDTA margin (RHS) Deleveraging balance sheet Improving return ratios (` bn) (x) FY15 FY16 FY17 FY18E FY19E FY2E Net Debt Networth Net D:E (RHS). FY15 FY16 FY17 FY18E FY19E FY2E RoE (%) RoCE (%) March 2, 218 6
7 Q3FY18 performance (Standalone) Y/E Mar (` mn) Q3FY18 Q3FY17 YoY (%) Q2FY18 QoQ (%) 9MFY18 9MFY17 YoY (%) Total revenue 19,421 13, , ,88 33, (Inc)/dec in stocks & WIP (183) 71 - (1,3) - (1,65) Material consumption 15,121 1, , ,64 24, Employees cost , Other expenditure ,583 1, Operating expenditure 15,974 11, , ,578 27, EBITDA 3,447 2, , ,32 6, Depreciation ,24 1, Operating profit 2,749 2, , ,278 4, Other income EBIT 2,86 2, , ,393 4, Interest 1,168 1, , ,385 3,15 9. EBT 1,638 1, , ,8 1, Income tax (9) 61 - (58) - (22) 22 - Net income 1,647 1, , ,29 1, Adjustments (28) (235) - (275) - (826) (353) - Adjusted net income 1, ,23 1, EPS (`) bps bps bps EBIDTA Margin (excl. O.I.) (223) 18. (29) (112) EBIDTA Margin (incl. O.I.) (213) 18.2 (2) (114) NPM (%) Tax/PBT (%) (.5) 5.3 (587) (5.3) 472 (.5) 1.3 (183) Material cost/sales (%) (49) March 2, 218 7
8 Income Statement (Standalone) Particulars (` mn) Mar17 Mar18E Mar19E Mar2E Revenue 5,976 75,366 1,319 12,811 Growth (%) Total Expenditure 41,54 61,574 81,961 98,72 Cost of construction 37,93 57,618 76,443 91,937 Employee cost 1,25 1,57 2,6 2,416 Other Expenses 2,99 2,449 3,511 4,349 Other Income EBIDTA (Excl. OI) 9,923 13,792 18,358 22,18 Growth (%) EBIDTA (Incl. OI) 1,37 13,929 18,53 22,26 Depreciation 2,274 2,793 3,184 3,583 EBIT 7,763 11,136 15,318 18,677 Interest 4,162 4,4 3,7 3,47 Profit Before Tax 3,61 6,736 11,618 15,27 Tax (9) 316 2,759 5,24 Net Profit 3,69 6,42 8,859 1,183 Adjustments (84) (1,2) (7) - Adj. Net Profit 2,77 5,22 8,159 1,183 Growth (%) Balance Sheet (Standalone) Particulars (` mn) Mar17 Mar18E Mar19E Mar2E Sources of Funds Equity Capital 1,368 1,368 1,368 1,368 Reserves 17,161 23,416 32,111 42,129 Net Worth 18,529 24,784 33,478 43,496 Long Term Loans 9,93 12,231 12,871 12,216 Short Term Loans 15,731 15,851 12,451 12,451 Loan Funds 25,634 28,82 25,322 24,667 Deferred Tax Liability Total Capital Employed 44,922 53,458 59,424 68,823 Applications of Funds Gross Block 24,276 28,426 32,226 36,26 Less: Accumulated Dep. 7,451 1,244 13,429 17,12 Net Block 16,825 18,181 18,797 19,14 Capital Work in Progress Investments 4,695 4,782 4,227 11,289 Current Assets, Loans & Advances Inventories 16,639 21,859 27,867 32,572 Sundry Debtors 1,165 15,827 2,264 23,316 Cash and Bank Balance 1,137 1,926 1, Loans and Advances 4,591 5,326 6,957 7,83 Other Current Assets 12,441 13,65 16,273 18,17 sub total 44,973 58,3 72,995 82,58 Less: Current Liabilities & Provisions Current Liabilities 21,267 27,93 36,63 43,429 Provisions sub total 21,571 27,59 36,595 44,6 Net Current Assets 23,42 3,494 36,399 38,52 Total Assets 44,922 53,458 59,424 68,823 E Estimates Cash Flow (Standalone) Particulars (` mn) Mar17 Mar18E Mar19E Mar2E Profit before tax 3,61 6,736 11,618 15,27 Depreciation 2,274 2,793 3,184 3,583 Finance Cost 4,162 4,4 3,7 3,47 Other Income (93) (137) (144) (151) Other Direct taxes paid (835) (484) (2,727) (4,988) Change in Working Capital (2,966) (6,33) (6,197) (3,36) (A) CF from Operations 6,537 7,5 9,434 14,84 Capex (4,884) (4,15) (3,8) (3,8) Free Cash Flow to Firm 1,653 2,855 5,634 1,284 Inc./ (Dec.) in Investments (1,797) (87) 555 (7,62) Other (B) CF from Investments (6,592) (4,99) (3,11) (1,711) Issue of Equity/ Preference 4, Inc./(Dec.) in Debt (5) 2,448 (2,76) (655) Interest exp net (4,162) (4,4) (3,7) (3,47) Dividend Paid (Incl. Tax) (4) (165) (165) (165) Other 3 (C) CF from Financing 132 (2,116) (6,625) (4,29) Net Change in Cash (292) (916) Opening Cash balances 1,59 1,137 1,926 1,634 Closing Cash balances 1,137 1,926 1, Important Ratios Particulars Mar17 Mar18E Mar19E Mar2E (A) Measures of Performance (%) EBIDTA Margin (excl. O.I.) EBIDTA Margin (incl. O.I.) EBIT Margin Interest/EBIT Tax/PBT (.2) Net Profit Margin (B) As Percentage of Net Sales Raw Material Employees expenses Other Expenses (C) Measures of Financial Status Debt / Equity (x) Interest Coverage (x) Average Cost of Debt (%) Debtors Period (days) Closing stock (days) Working Capital (days) Fixed Assets Turnover (x) (D) Measures of Investment Diluted EPS (`) CEPS (`) DPS (`) Book Value (`) RoANW (%) RoACE (%) RoAIC (%) (E) Valuation Ratios CMP (`) P/E (x) Market Cap. (` Mn) 132,53 132,53 132,53 132,53 MCap/ Sales (x) EV (` Mn) 156,86 157, , ,348 EV/Sales (x) EV/EBDITA (x) P/BV (x) FCFE Yield (%) (1.9).7 (.6) 4.6 Dividend Yield (%) E Estimates March 2, 218 8
9 Feb-17 Feb-17 Mar-17 Apr-17 Apr-17 May-17 Jun-17 Jun-17 Jul-17 Aug-17 Aug-17 Sep-17 Oct-17 Nov-17 Nov-17 Dec-17 Jan-18 Jan-18 Feb-18 Mar-18 DART RATING MATRIX Total Return Expectation (12 Months) Buy > 2% Accumulate 1 to 2% Reduce to 1% Sell < % Rating and Target Price History Month Rating TP (`) Price (`)* Apr-17 Buy May-17 Buy Aug-17 Buy Oct-17 Buy 1, Feb-18 Buy 1, * As on Recommended Dated DBL Target DART Team Purvag Shah Managing Director purvag@dolatcapital.com Amit Khurana, CFA Head of Equities amit@dolatcapital.com CONTACT DETAILS Equity Sales Designation Direct Lines Dinesh Bajaj VP - Equity Sales dineshb@dolatcapital.com Kartik Sadagopan VP - Equity Sales kartiks@dolatcapital.com Kapil Yadav VP - Equity Sales kapil@dolatcapital.com Derivatives Strategist Designation Bhavin Mehta VP - Derivatives Strategist bhavinm@dolatcapital.com Equity Trading Designation P. Sridhar VP and Head of Sales Trading sridhar@dolatcapital.com Chandrakant Ware AVP - Equity Sales Trading chandrakant@dolatcapital.com Derivatives Trading Designation Shirish Thakkar AVP - Derivatives shirisht@dolatcapital.com Hardik Mehta Sales Trader hardikm@dolatcapital.com Dolat Capital Market Private Limited. 2, Rajabahadur Mansion, 1st Floor, Ambalal Doshi Marg, Fort, Mumbai - 4 1
10 Analyst(s) Certification The research analyst(s), with respect to each issuer and its securities covered by them in this research report, certify that: All of the views expressed in this research report accurately reflect his or her or their personal views about all of the issuers and their securities; and No part of his or her or their compensation was, is, or will be directly or indirectly related to the specific recommendations or views expressed in this research report. I. Analyst(s) and Associate (S) holding in the Stock(s): (Nil) II. Disclaimer: This research report has been prepared by Dolat Capital Market Private Limited. to provide information about the company(ies) and sector(s), if any, covered in the report and may be distributed by it and/or its affiliated company(ies) solely for the purpose of information of the select recipient of this report. This report and/or any part thereof, may not be duplicated in any form and/or reproduced or redistributed without the prior written consent of Dolat Capital Market Private Limited. This report has been prepared independent of the companies covered herein. Dolat Capital Market Private Limited. and its affiliated companies are part of a multi-service, integrated investment banking, brokerage and financing group. Dolat Capital Market Private Limited. and/or its affiliated company(ies) might have provided or may provide services in respect of managing offerings of securities, corporate finance, investment banking, mergers & acquisitions, financing or any other advisory services to the company(ies) covered herein. Dolat Capital Market Private Limited. and/or its affiliated company(ies) might have received or may receive compensation from the company(ies) mentioned in this report for rendering any of the above services. Research analysts and sales persons of Dolat Capital Market Private Limited. may provide important inputs to its affiliated company(ies) associated with it. While reasonable care has been taken in the preparation of this report, it does not purport to be a complete description of the securities, markets or developments referred to herein, and Dolat Capital Market Private Limited. does not warrant its accuracy or completeness. Dolat Capital Market Private Limited. may not be in any way responsible for any loss or damage that may arise to any person from any inadvertent error in the information contained in this report. This report is provided for information only and is not an investment advice and must not alone be taken as the basis for an investment decision. The investment discussed or views expressed herein may not be suitable for all investors. The user assumes the entire risk of any use made of this information. The information contained herein may be changed without notice and Dolat Capital Market Private Limited. reserves the right to make modifications and alterations to this statement as they may deem fit from time to time. Dolat Capital Market Private Limited. and its affiliated company(ies), their directors and employees may; (a) from time to time, have a long or short position in, and buy or sell the securities of the company(ies) mentioned herein or (b) be engaged in any other transaction involving such securities and earn brokerage or other compensation or act as a market maker in the financial instruments of the company(ies) discussed herein or act as an advisor or lender/borrower to such company(ies) or may have any other potential conflict of interests with respect to any recommendation and other related information and opinions. This report is neither an offer nor solicitation of an offer to buy and/or sell any securities mentioned herein and/or not an official confirmation of any transaction. This report is not directed or intended for distribution to, or use by any person or entity who is a citizen or resident of or located in any locality, state, country or other jurisdiction, where such distribution, publication, availability or use would be contrary to law, regulation or which would subject Dolat Capital Market Private Limited. and/or its affiliated company(ies) to any registration or licensing requirement within such jurisdiction. The securities described herein may or may not be eligible for sale in all jurisdictions or to a certain category of investors. Persons in whose possession this report may come, are required to inform themselves of and to observe such restrictions. For U.S. Entity/ persons only: This research report is a product of Dolat Capital Market Private Limited., which is the employer of the research analyst(s) who has prepared the research report. The research analyst(s) preparing the research report is/are resident outside the United States (U.S.) and are not associated persons of any U.S. regulated broker-dealer and therefore the analyst(s) is/are not subject to supervision by a U.S. broker-dealer, and is/are not required to satisfy the regulatory licensing requirements of FINRA or required to otherwise comply with U.S. rules or regulations regarding, among other things, communications with a subject company, public appearances and trading securities held by a research analyst account. This report is intended for distribution by Dolat Capital Market Private Limited. only to "Major Institutional Investors" as defined by Rule 15a- 6(b)(4) of the U.S. Securities and Exchange Act, 1934 (the Exchange Act) and interpretations thereof by U.S. Securities and Exchange Commission (SEC) in reliance on Rule 15a 6(a)(2). If the recipient of this report is not a Major Institutional Investor as specified above, then it should not act upon this report and return the same to the sender. Further, this report may not be copied, duplicated and/or transmitted onward to any U.S. person or entity. In reliance on the exemption from registration provided by Rule 15a-6 of the Exchange Act and interpretations thereof by the SEC in order to conduct certain business with Major Institutional Investors, Dolat Capital Market Private Limited. has entered into an agreement with a U.S. registered broker-dealer Ltd Marco Polo Securities Inc. ("Marco Polo"). Transactions in securities discussed in this research report should be effected through Marco Polo or another U.S. registered broker dealer/entity as informed by Dolat Capital Market Private Limited. from time to time. Dolat Capital Market Private Limited. Corporate Identity Number: U6599DD1993PTC9797 Member: BSE Limited and National Stock Exchange of India Limited. SEBI Registration No: BSE - INB17152 & INF17152, NSE - INB237131& INF237131, Research: INH685 Registered office: Office No. 141, Centre Point, Somnath, Daman , Daman & Diu Board: Fax: research@dolatcapital.com Our Research reports are also available on Reuters, Thomson Publishers, DowJones and Bloomberg (DCML <GO>)
Dilip Buildcon. Result Update. Buy. Stellar performance continues
 Result Update Dilip Buildcon Buy Stellar performance continues DBL s standalone revenue grew sharply by 72.6% YoY to `15.8bn in Q2FY18 (37.2% above estimates) due to better execution run rate in Road and
HCC. Result Update. Accumulate. Debt reduction factored in. Valuation (x) Estimates (` mn) Q2FY18 Result (` Mn) November 03, 2017
 Estimates (` mn) Q2FY18 Result (` Mn) November 03, 2017") Result Update HCC Accumulate Debt reduction factored in Q2FY18 standalone revenue increased by 6.5% YoY to `9.7bn (in-line with estimates) due to better execution. Excluding claims of `1.85 bn (`1.8 bn
Result Update HCC Accumulate Debt reduction factored in Q2FY18 standalone revenue increased by 6.5% YoY to `9.7bn (in-line with estimates) due to better execution. Excluding claims of `1.85 bn (`1.8 bn
MRF. Result Update. Accumulate
 Result Update MRF Accumulate Revenue disappoints MRF posted weak topline growth of 8.1% YoY at ` 38.6 bn for the quarter ended along with gross and EBITDA margins of 39.8% and 15.4% respectively. The gross
NCC. Result Update. Accumulate
 Result Update NCC Accumulate GST spoiled the show, but robust order inflow positive NCC posted 33.3% YoY de-growth in Q2FY18 standalone revenue to `13bn (35.8% below estimates). The fall in revenue was
Result Update. Ahluwalia Contracts. Buy
 Ahluwalia Contracts Buy Result Update Strong order inflow to drive growth ACIL posted 31.3% YoY growth in Q2FY19 revenue (after 2 consecutive quarter of de-growth) to `4.4 bn (9.% above estimates) led
Simplex Infrastructures
 Result Update Simplex Infrastructures Sell Working capital pressure continues SIL posted 7.4% YoY rise in Q1FY18 standalone revenue (increased post 6 consecutive quarters of de-growth) to `15.1bn (in line
Bharat Petroleum Corporation
 Result Update Bharat Petroleum Corporation Accumulate Bharat Petroleum Corporation (BPCL) s results were in-line with our estimates on revenues and below our estimates on profitability front. Revenues
Techno Electric & Engineering
 Result Update Techno Electric & Engineering Downgrade to Reduce (Prev. Accumulate) Techno is countering the slowing T&D business by going to overseas markets for orders. It continues to manage its balance
Result Update. Sterling Tools. Buy
 Sterling Tools Buy Result Update Growth momentum continues Sterling tools (STRT) number were broadly in line with estimates. Margins on a sequential basis have started showing signs of improvement at gross
Skipper. Result Update. Reduce
 Result Update Skipper Reduce Muted growth; opportunities from new segments For Q4FY18, the revenue declined 3% YoY to ` 5928mn, grew 4.7% QoQ from ` 5,664mn. EBITDA grew 8% YoY to ` 185mn, grew ~47% QoQ
Voltas. Result Update. Buy. Q4FY18 Result (` Mn) May 21, 2018
 May 21, 2018") Result Update Voltas Buy Softness seen in AC industry in Q4 has also got spilt over into Q1FY19, with unseasonal showers and lower temperatures playing spoilsport. The next seasonally important quarter
Result Update Voltas Buy Softness seen in AC industry in Q4 has also got spilt over into Q1FY19, with unseasonal showers and lower temperatures playing spoilsport. The next seasonally important quarter
MRF. Result Update. Accumulate
 Result Update MRF Accumulate Quarter marginally disappoints but outlook is intact MRF revenue grew 15.8% YoY in to ` 39bn, which was lower than our estimates of ` 4 bn. Profitability was also marginally
Transport Corporation of India
 Transport Corporation of India Accumulate Result Update Better numbers with improvement in industry utilisation rate Revenue up by 25.7%YoY to ` 652.5mn; grew 9% QoQ from ` 5,553.1mn. EBITDA grew by 53.6%YoY
Result Update. Atul Auto. Accumulate
 Atul Auto Accumulate Result Update Looking out for margin and distribution expansion Atul Auto (ATA) top line growth was in-line with our estimates at ` 1,765 mn but margins were lower due to higher other
Larsen & Toubro. Result Update. Accumulate. Valuation (x) Estimates (` Bn) Q1FY18 Result (` Mn) July 26, 2018
 Estimates (` Bn) Q1FY18 Result (` Mn) July 26, 2018") Result Update Larsen & Toubro Accumulate Q1 was an inline quarter adjusting for IndAS changes and one-off gains. It has held on to its FY19 guidance given at the beginning of the year, making Q1 a non-event
Result Update Larsen & Toubro Accumulate Q1 was an inline quarter adjusting for IndAS changes and one-off gains. It has held on to its FY19 guidance given at the beginning of the year, making Q1 a non-event
Music Broadcast. Result Update. Buy. Valuation (x) Estimates (` Mn) Q1FY18 Result (` Mn)
 Estimates (` Mn) Q1FY18 Result (` Mn)") Result Update Music Broadcast Buy Stable growth quarter; strong outlook for H2FY18 MBL reports revenue growth of 11.9% YoY supported by higher utilisation in new stations. EBITDA margin improved 106bps
Result Update Music Broadcast Buy Stable growth quarter; strong outlook for H2FY18 MBL reports revenue growth of 11.9% YoY supported by higher utilisation in new stations. EBITDA margin improved 106bps
GSK Pharma. Result Update. Buy
 Result Update GSK Pharma Buy Margins continue to hold above 21% The company continues to improve their margins. Company reported overall flat revenue with EBITDA margins at 2% taking the PAT growth to
Berger Paints. Result Update. Downgrade to Reduce (Prev. - Accumulate) Valuation (x) Estimates (` mn) Q2FY18 Result (` Mn) November 06, 2017
 Valuation (x) Estimates (` mn) Q2FY18 Result (` Mn) November 06, 2017") Result Update Berger Paints Downgrade to Reduce (Prev. - Accumulate) Continues to gain market share Revenues (consol.) grew by 11.% YoY to ` 12.bn in-line with our estimate. Standalone revenues were up
Result Update Berger Paints Downgrade to Reduce (Prev. - Accumulate) Continues to gain market share Revenues (consol.) grew by 11.% YoY to ` 12.bn in-line with our estimate. Standalone revenues were up
Result Update. Sterling Tools. Accumulate
 Sterling Tools Accumulate Result Update OEM slowdown and High RM cost impacted numbers. Downgrade to Accumulate. Sterling Tools (STRT) numbers were below estimates on profitability parameters as OEM slowdown
Maruti Suzuki India. Result Update. Accumulate. Growth Story Continues. Valuation (x) Estimates (` mn) Q3FY18 Result (` Mn)
 Estimates (` mn) Q3FY18 Result (` Mn)") Result Update Maruti Suzuki India Accumulate Growth Story Continues MSIL volume continues to remain strong at 11.3% YOY which totaled to 431,112 units during the quarter. The growth in realisations per
Result Update Maruti Suzuki India Accumulate Growth Story Continues MSIL volume continues to remain strong at 11.3% YOY which totaled to 431,112 units during the quarter. The growth in realisations per
Maruti Suzuki India. Result Update. Accumulate. Product mix driving margins
 Result Update Maruti Suzuki India Accumulate Product mix driving margins MSIL reported volume growth of 24.3% YoY and revenue growth rate of 28% YoY in. The base was low because of multiple events such
INOX Leisure. Result Update. Accumulate. Valuation (x) Estimates (` Mn) Q4FY18 Result (` Mn) May 08, 2018
 Estimates (` Mn) Q4FY18 Result (` Mn) May 08, 2018") Result Update INOX Leisure Accumulate Ad. growth outperformance drives profitability Inox reported healthy revenue growth YoY on back of good ad and F&B revenue. EBITDA margin improved 470bps YoY to 13.0%
Result Update INOX Leisure Accumulate Ad. growth outperformance drives profitability Inox reported healthy revenue growth YoY on back of good ad and F&B revenue. EBITDA margin improved 470bps YoY to 13.0%
Gujarat State Petronet
 Result Update Gujarat State Petronet Accumulate results were better than our estimates largely driven by higher than expected volumes. Higher volumes were due to low gas cost and these spot volumes resulted
Result Update. Havells. Buy
 Result Update Havells Buy Q2 was weak on the margin front with input cost pressures visible. The one bright spot has been the inventory build-up for the festive season in the ECD business, as evident in
Skipper. Buy. Result Update. India (Capital Goods) Institutional Research DOLAT CAPITAL
 Institutional Research DOLAT CAPITAL") Result Update India (Capital Goods) Institutional Research DOLAT CAPITAL Skipper CMP ` 140 Target / Upside ` 162/16% BSE Sensex 25,400 NSE Nifty 7,783 Scrip Details Equity / FV ` 102mn/` 1/- Market Cap
Result Update India (Capital Goods) Institutional Research DOLAT CAPITAL Skipper CMP ` 140 Target / Upside ` 162/16% BSE Sensex 25,400 NSE Nifty 7,783 Scrip Details Equity / FV ` 102mn/` 1/- Market Cap
Shemaroo Entertainment
 Aug-15 Sep-15 Oct-15 Nov-15 Dec-15 Jan-16 Feb-16 Mar-16 Apr-16 May-16 Jun-16 Jul-16 Aug-16 Result Update India (Entertainment) Institutional Research Shemaroo Entertainment Buy CMP ` 330 Target / Upside
Result Update. Tech Mahindra. Buy
 Tech Mahindra Buy Result Update View: Communication to aid profitability Company won deals worth USD 440mn in the quarter. Of these, USD 240mn was in the communication vertical and USD 200mn in enterprise.
Transport Corporation of India
 India (Logistics) Institutional Research Transport Corporation of India DOLAT CAPITAL Buy Q2FY16 Result Update CMP ` 283 Target / Downside ` 333 / 18% BSE Sensex 26,838 NSE Nifty 8,112 Scrip Details Equity
Balkrishna Industries
 Annual Report Analysis Balkrishna Industries Accumulate Distribution expansion is the focus area Balkrishna Industries (BKT) has highlighted the importance of distribution reach and higher number of SKUs
Result Update. Skipper. Sell
 Skipper Sell Result Update Muted ordering, slower execution increased cost leads to tepid growth For Q2FY19, the revenue grew 1.6% YoY to ` 5,239.6mn, grew 9.5% QoQ from ` 4787mn. EBITDA declined 43.2%
Skipper. Accumulate. Result Update. India (Capital Goods) Institutional Research DOLAT CAPITAL
 Institutional Research DOLAT CAPITAL") Result Update India (Capital Goods) Institutional Research DOLAT CAPITAL Skipper CMP ` 139 Target / Upside ` 145/5% BSE Sensex 26,818 NSE Nifty 8,296 Scrip Details Equity / FV ` 102mn/` 1/- Market Cap
Result Update India (Capital Goods) Institutional Research DOLAT CAPITAL Skipper CMP ` 139 Target / Upside ` 145/5% BSE Sensex 26,818 NSE Nifty 8,296 Scrip Details Equity / FV ` 102mn/` 1/- Market Cap
CONCOR. Management Meeting Update. Buy
 CONCOR Buy Management Meeting Update All is well DFC continues to be the most important long-term trigger as apart from boosting volumes, it will aid margins. Distribution logistics will help reduce rail
Result Update. Khadim India. Buy
 Khadim India Buy Result Update Delay in price hike impacted margins Khadim s revenues beat our estimates, but EBITDA and APAT came below our estimate. The revenue growth in retail business was at 7% -
Infosys. Result Update. Buy
 Infosys Buy Result Update INFY raises its revenue guidance for FY19E in CC terms; Maintain BUY The USD revenue rose 2.3% QoQ (2.7 % QoQ CC terms) to USD 2,987 million, (DCMe: USD 2,965 million), due to
Container Corporation of India
 Oct16 Nov16 Dec16 Jan17 Feb17 Mar17 Apr17 May17 Jun17 Jul17 Aug17 Sep17 Company Update Container Corporation of India Buy Stacked for success CONCOR has all its key triggers in place. DFC continues to
Music Broadcast. Annual Report Analysis. Buy. Financials (` mn) August 31, 2018
 August 31, 2018") Annual Report Analysis Music Broadcast Buy MBL reported revenue growth of 9.9% YoY in FY18 to ` 2982mn which includes revenue from exchange of services of ` 196 as on 31 st March, 218 as compared to `
Annual Report Analysis Music Broadcast Buy MBL reported revenue growth of 9.9% YoY in FY18 to ` 2982mn which includes revenue from exchange of services of ` 196 as on 31 st March, 218 as compared to `
Kajaria Ceramics. Result Update. Buy
 Result Update Kajaria Ceramics Buy Cautiously Optimistic In the last one & half year Ceramic Industry faced multiple challenges, Demonetization and GST Implementation restricted volume growth. Collective
Page Industries. Annual Report Analysis. Accumulate. FINANCIALS (` Mn) July 14, 2017
 July 14, 2017") Aug-16 Sep-16 Oct-16 Nov-16 Dec-16 Jan-17 Feb-17 Mar-17 Apr-17 May-17 Jun-17 Jul-17 Annual Report Analysis Page Industries Accumulate Despite demonetisation, Page Industries witnessed revenue growth of
Aug-16 Sep-16 Oct-16 Nov-16 Dec-16 Jan-17 Feb-17 Mar-17 Apr-17 May-17 Jun-17 Jul-17 Annual Report Analysis Page Industries Accumulate Despite demonetisation, Page Industries witnessed revenue growth of
Result Update. KEI Industries. Buy
 KEI Industries Buy Result Update Numbers beat estimates, Traction continues. Maintain Buy KEI Industries (KEI) numbers were ahead of estimates driven by strong sales in retail segment and expected growth
ICICI Bank. Result Update. Buy. Mixed bag. Valuation (x) Estimates (` mn) Q3FY18 Result (` Mn)
 Estimates (` mn) Q3FY18 Result (` Mn)") Result Update ICICI Bank Buy Mixed bag Q3FY18 PAT at ` 16.5bn down 32% YoY & 20% QoQ. NII mere 6% up YoY. NIMs stood stable YoY; down QoQ to 3.1%. Other income stood down 20% YoY & 39% QoQ; on the back
Result Update ICICI Bank Buy Mixed bag Q3FY18 PAT at ` 16.5bn down 32% YoY & 20% QoQ. NII mere 6% up YoY. NIMs stood stable YoY; down QoQ to 3.1%. Other income stood down 20% YoY & 39% QoQ; on the back
Mahanagar Gas. Result Update. Accumulate
 Result Update Mahanagar Gas Accumulate Volume Traction with Profitability Mahanagar Gas (MGL) numbers has outperformed on volume as well as profitability parameters. Volume traction was primarily driven
Dixon Technologies. Annual Report Analysis. Accumulate. Annual Report The IPO year. FINANCIALS (` Mn)
") Annual Report Analysis Dixon Technologies Accumulate Annual Report 218- The IPO year Dixon Technologies came up with the IPO in FY18 and got a great response from investors with a 117x subscription. From
Annual Report Analysis Dixon Technologies Accumulate Annual Report 218- The IPO year Dixon Technologies came up with the IPO in FY18 and got a great response from investors with a 117x subscription. From
Result Update ITC. Accumulate
 ITC Accumulate Result Update Volume growth improvement continues ITC s results came marginally ahead of our expectations. The cigarette business posted ~6% volume growth which was marginally better than
Result Update. NIIT Technologies. Buy
 Result Update NIIT Technologies Buy Healthy revenue growth & margins to aid profitability; upgrade to Buy USD revenue (Ex Hedge Gain) grew 5.8% QoQ to USD 132mn (DCMe: USD 128mn) led by healthy organic
Kalpataru Power Transmission
 Annual Report Analysis Kalpataru Power Transmission Accumulate Robust order book growth in FY18 FY18 saw the standalone order book grow at 38% YoY to ` 124bn (T&D- `84.3bn; Oil & Gas and Rail -`39.7bn)
Q3FY19 Quarterly Preview IT Services
 Q3FY19 Quarterly Preview IT Services Head of Equities: Amit Khurana, CFA Associate: Vinesh Vala Tel: +91 22 40969745 Tel: +91 22 40969736 E-mail: amit@dolatcapital.com E-mail: vineshv@dolatcapital.com
Particulars Q3FY15 Q3FY14 YoY (%) Q2FY15 QoQ (%) 9MFY15 9MFY14 YoY (%) Net Sales 3,774 3, , ,453 8,
 Q2FY15 QoQ (%) 9MFY15 9MFY14 YoY (%) Net Sales 3,774 3, , ,453 8,") Consumer / Result Update Page Industries CMP: ` 11,760 TP: ` 12,992 Accumulate Q3FY15 - Volume growth of 15% Volume growth of 15.2% was backed by a strong growth in the Mens and Leisure wear segment at
Consumer / Result Update Page Industries CMP: ` 11,760 TP: ` 12,992 Accumulate Q3FY15 - Volume growth of 15% Volume growth of 15.2% was backed by a strong growth in the Mens and Leisure wear segment at
Result Update. HDFC Bank. Accumulate
 HDFC Bank Accumulate Result Update Results in line, Caution on agricultural book HDFC bank reported a steady profit growth of 20% YoY aided by a NII growth of 22% YoY on stable NIMs, a robust core fees
Sagar Cement. Result Update. Buy. Valuation (x) Estimates (` mn) Q1FY19 Result (` Mn)
 Estimates (` mn) Q1FY19 Result (` Mn)") Result Update Sagar Cement Buy Better than expected cost rationalization, drives operating performance SGC reported topline growth of 6.2% YoY to ` 2.74bn (2.3% lower than D est). EBITDA at ` 364Mn (-14.2%
Result Update Sagar Cement Buy Better than expected cost rationalization, drives operating performance SGC reported topline growth of 6.2% YoY to ` 2.74bn (2.3% lower than D est). EBITDA at ` 364Mn (-14.2%
JK Cement. Result Update. Buy. Q3FY18 Result (` Mn)
") Result Update JK Cement Buy Volume growth supports top-line JK Cement reported a revenue of ` 11.2bn (+26.8% YoY, +1.7% QoQ), 2% higher than D est. The cement dispatches during the quarter rose by 20.3%
Result Update JK Cement Buy Volume growth supports top-line JK Cement reported a revenue of ` 11.2bn (+26.8% YoY, +1.7% QoQ), 2% higher than D est. The cement dispatches during the quarter rose by 20.3%
Ahluwalia Contracts (India)
") May-14 Jul-14 Aug-14 Sep-14 Oct-14 Dec-14 Jan-15 Feb-15 Apr-15 May-15 India Research Infrastructure May 22, 215 QUARTERLY REVIEW Bloomberg: AHLU IN Reuters: AHLU.BO BUY Better performance ahead ACIL posted
May-14 Jul-14 Aug-14 Sep-14 Oct-14 Dec-14 Jan-15 Feb-15 Apr-15 May-15 India Research Infrastructure May 22, 215 QUARTERLY REVIEW Bloomberg: AHLU IN Reuters: AHLU.BO BUY Better performance ahead ACIL posted
Simplex Infrastructures
 May-14 Jul-14 Aug-14 Sep-14 Nov-14 Dec-14 Jan-15 Mar-15 Apr-15 May-15 India Research Infrastructure May 27, 2015 QUARTERLY REVIEW Bloomberg: SINF IN Reuters: SINF.BO HOLD Working capital ease to improve
ICICI Bank. Result Update. Buy
 Result Update ICICI Bank Buy Stress priced-in; Servings are on course Lull operating performance; retail broadens out PAT at ` 20.4bn (in-line with our est. ` 20.2bn) reporting soft QoQ growth and 8% YoY
Repco Home Finance REPCO IN
 11 August 2014 Price: `431 India Banking & Financial Services Company Update BUY Repco Home Finance REPCO IN 12m Price Target: `460 Steady quarter REPCO reported 1Q15 net profit at `248mn, up 11% YoY and
Result Update. Yes Bank. Buy
 Yes Bank Buy Result Update Returning to old glory days, Expect a strong rerating With the appointment of the new MD and CEO from outside the group, we believe the hiatus in the Yes bank s story is now
KEC International. Annual Report Analysis. Accumulate
 Annual Report Analysis KEC International Accumulate KEC International - Strong FY18 enabled by T&D and Rail business FY18 was a strong year despite facing challenges regarding GST implementation in 1HFY18
HCC BUY. Infrastructure April 10, QIP step in the right direction EVENT UPDATE. India Research. Bloomberg: HCC IN Reuters: HCNS.
 Jan-14 Mar-14 Apr-14 May-14 Jul-14 Aug-14 Sep-14 Nov-14 Dec-14 Jan-15 India Research Infrastructure April 10, 2015 EVENT UPDATE Bloomberg: IN Reuters: HCNS.BO BUY QIP step in the right direction has successfully
BHEL SELL RESULTS REVIEW 1QFY15 13 AUG CMP (as on 12 Aug 2014) Rs 224 Target Price Rs 188
 Rs 224 Target Price Rs 188") RESULTS REVIEW 1QFY15 13 AUG 2014 BHEL SELL INDUSTRY CAPITAL GOODS CMP (as on 12 Aug 2014) Rs 224 Target Price Rs 188 Nifty 7,727 Sensex 25,881 KEY STOCK DATA Bloomberg/Reuters BHEL IN/BHEL.BO No. of Shares
RESULTS REVIEW 1QFY15 13 AUG 2014 BHEL SELL INDUSTRY CAPITAL GOODS CMP (as on 12 Aug 2014) Rs 224 Target Price Rs 188 Nifty 7,727 Sensex 25,881 KEY STOCK DATA Bloomberg/Reuters BHEL IN/BHEL.BO No. of Shares
Fineotex Chemical Ltd
 Company Update Decent Performance under Macroeconomic Pressure; Business Traction to Continue: Fineotex Chemical recorded decent set of result as consolidated sales grew by 1.1% YoY (largely in line) to
BUY. Robust quarter with clear growth visibility DILIP BUILDCON. Target Price: Rs 610. Financial summary (Standalone) Y/E March FY16 FY17 FY18E FY19E
 Y/E March FY16 FY17 FY18E FY19E") Robust quarter with clear growth visibility Dilip Buildcon s (DBL) Q1FY18 sales grew 60% YoY to Rs 16.6 bn, ahead of our estimate of Rs 12.0 bn and consensus of Rs 13.6 bn. EBITDA was up 47% at Rs 3.0
Robust quarter with clear growth visibility Dilip Buildcon s (DBL) Q1FY18 sales grew 60% YoY to Rs 16.6 bn, ahead of our estimate of Rs 12.0 bn and consensus of Rs 13.6 bn. EBITDA was up 47% at Rs 3.0
Q3FY13 Q3FY12 YOY(%) Q2FY13
 Q2FY13") Plastics / Result Update Supreme Industries CMP: ` 310 TP: ` 409 Buy High Points Supreme Industries Q3 FY13 results review Supreme Industries (SIL) for Q3FY13 has reported net revenues at ` 9.04bn (Dolat
Plastics / Result Update Supreme Industries CMP: ` 310 TP: ` 409 Buy High Points Supreme Industries Q3 FY13 results review Supreme Industries (SIL) for Q3FY13 has reported net revenues at ` 9.04bn (Dolat
Marico Kaya BUY RESULTS REVIEW 4QFY15 29 APR 2015
 RESULTS REVIEW 4QFY15 29 APR 2015 Marico Kaya INDUSTRY FMCG CMP (as on 28 Apr 2015) Rs 1,635 Target Price Rs 1,823 Nifty 8,240 Sensex 27,226 KEY STOCK DATA Bloomberg MAKA IN No. of Shares (mn) 13 MCap
Visaka Industries Ltd
 Company Update Superior Product Mix & New Age Markets to Aid Growth New investments to aid growth: Visaka continues to give a good set of numbers. YoY EPS grew at 142% aided by a revenue growth of 1.5%
Still on track. Exhibit 1: ICT is on track for FY09E
 Country: India Sector: Indian Education Diviya Nagarajan Diviya.Nagarajan@jmfinancial.in Tel: (91 22) 6630 3066 Subhashini Gurumurthy Subhashini.Gurumurthy@jmfinancial.in Tel: (91 22) 6630 3069 Price:
TVS Motors. Source: Company Data; PL Research
 Margins trajectory looking up ; Accumulate November 01, 2017 Saksham Kaushal sakshamkaushal@plindia.com +91 22 66322235 Poorvi Banka poorvibanka@plindia.com +91 22 66322426 Rating Accumulate Price Rs709
HOLD. Deleveraging story playing out RAMCO CEMENTS. Target Price: Rs 503. Q4 performance
 RAMCO S HOLD Target Price: Rs 503 Deleveraging story playing out Ramco Cements total debt reduced by a massive Rs 5 bn to Rs 22 bn in FY16. The company generated total EBITDA of Rs 11.5 bn in FY16 and
BUY. Efforts on cost cutting paying off RAMCO CEMENTS. Target Price: Rs 435. Key highlights. Key drivers FY15 FY16E FY17E
 RAMCO S BUY Target Price: Rs 435 Efforts on cost cutting paying off Q2 EBITDA at Rs 2.8 bn (up 30% YoY) was ahead of our estimates due to lower-than-expected costs. Average costs (excluding freight) declined
Maruti Suzuki. Source: Company Data; PL Research
 Run continues, Royalty reduction positive ; Buy January 29, 2018 Saksham Kaushal sakshamkaushal@plindia.com +91 22 66322235 Poorvi Banka poorvibanka@plindia.com +91 22 66322426 Rating BUY Price Rs9,277
Maruti Suzuki. In a league of its own ; Buy. Source: Company Data; PL Research
 In a league of its own ; Buy October 28, 2017 Saksham Kaushal sakshamkaushal@plindia.com +91 22 66322235 Poorvi Banka poorvibanka@plindia.com +91 22 66322426 Rating BUY Price Rs8,115 Target Price Rs9,250
Maruti Suzuki. Source: Company Data; PL Research
 Healthy operating performance; Accumulate October 28, 2016 Rohan Korde rohankorde@plindia.com +91 22 66322235 Rating Accumulate Price Rs5,860 Target Price Rs6,356 Implied Upside 8.5% Sensex 27,916 Nifty
Mahindra & Mahindra. Source: Company Data; PL Research
 Tractors drive Q2 performance; Accumulate November 11, 2016 Rohan Korde rohankorde@plindia.com +91 22 66322235 Rating Accumulate Price Rs1,242 Target Price Rs1,503 Implied Upside 21.0% Sensex 26,819 Nifty
Inox Wind BUY. Performance Highlights. CMP Target Price `242 `286. 4QFY2016 Result Update Capital Goods. 3 year price chart
 4QFY216 Result Update Capital Goods May 11, 216 Inox Wind Performance Highlights Quarterly Data (Consolidated) ( ` cr) 4QFY16 4QFY15 % chg (yoy) 3QFY16 % chg (qoq) Total Income 1,829 93 96.6 941 94.2 EBITDA
Maruti Suzuki (RHS) BUY. Operationally In Line; Reiterate Buy. Automobiles October 31, 2014 RESULT REVIEW. Outlook & Valuation.
 BUY. Operationally In Line; Reiterate Buy. Automobiles October 31, 2014 RESULT REVIEW. Outlook & Valuation.") Oct13 Dec13 Jan14 Feb14 Apr14 May14 Jun14 Aug14 Sep14 Oct14 India Research Automobiles RESULT REVIEW Bloomberg: MSIL IN Reuters: MRTI.BO BUY Operationally In Line; Reiterate Buy India s (MSIL) Revenue/EBIDTA/PAT
Oct13 Dec13 Jan14 Feb14 Apr14 May14 Jun14 Aug14 Sep14 Oct14 India Research Automobiles RESULT REVIEW Bloomberg: MSIL IN Reuters: MRTI.BO BUY Operationally In Line; Reiterate Buy India s (MSIL) Revenue/EBIDTA/PAT
Near-term pressure, but long-term outlook positive
 INDUSTRY IT CMP (as on 2 Nov 2015) Rs 1,812 Target Price Rs 2,050 Nifty 8,051 Sensex 26,559 KEY STOCK DATA Bloomberg ECLX IN No. of Shares (mn) 30 MCap (Rs bn) / ($ mn) 55/843 6m avg traded value (Rs mn)
Cummins India Ltd Bloomberg Code: KKC IN
 Company Update Margins Under Pressure; Domestic Recovery Underway Half-yearly revenue was flat; margins were under pressure: Cummins India revenue, EBITDA and PAT for H1FY17 reached to Rs.24,784mn, Rs.4,649mn
Exide Industries BUY. Auto Components February 03, Volume Recovery & Cost Saving to Cushion Margins RESULT UPDATE
 Feb-14 Mar-14 Apr-14 Jun-14 Jul-14 Aug-14 Oct-14 Nov-14 Dec-14 Jan-15 Institutional Equities India Research Auto Components February 03, 2015 RESULT UPDATE Bloomberg: EXID IN Reuters: EXID.BO BUY Volume
Adani Ports & SEZ Rating: Target price: EPS:
 Adani Ports & SEZ : price: EPS: Volume traction continues in a seasonally good quarter; maintain Adani Ports & SEZ reported a good quarter with total operating revenues (standalone) of Rs. 8.02bn and PAT
Financials/Valu FY15 FY16 FY17 FY18E FY19E
 29Aug17 INDUSTRY Eng. & Cons. BSE Code 540047 NSE Code NIFTY DBL 9912 Company Data CMP 625 Target Price 6 Previous Target Price 595 Upside 9% 52wk Range H/L Mkt Capital (Rs Cr) Av. Volume (,000) Superior
Coal India. Source: Company Data; PL Research
 Misses estimates; Higher costs dims hope for earnings recovery February 13, 2017 Kamlesh Bagmar kamleshbagmar@plindia.com +91 22 66322237 Rating Reduce Price Rs325 Target Price Rs320 Implied Upside 1.5%
CMP (Rs) 775 Upside/ (Downside) (%) (1.4) Market Cap. (Rs bn) 11.4 Free Float (%) 35.0 Shares O/S (mn) 14.7
 775 Upside/ (Downside) (%) (1.4) Market Cap. (Rs bn) 11.4 Free Float (%) 35.0 Shares O/S (mn) 14.7") 2QFY18 Result Update November 23, 2017 Market Cap. (Rs bn) 11.4 Free Float (%) 35.0 Shares O/S (mn) 14.7 High Order Book Provides Revenue Visibility (PMPL) has delivered a healthy performance in 2QFY18.
2QFY18 Result Update November 23, 2017 Market Cap. (Rs bn) 11.4 Free Float (%) 35.0 Shares O/S (mn) 14.7 High Order Book Provides Revenue Visibility (PMPL) has delivered a healthy performance in 2QFY18.
Bharat Forge. Exports remain subdued, outlook better. Source: Company Data; PL Research
 Exports remain subdued, outlook better November 08, 2016 Rohan Korde rohankorde@plindia.com +91 22 66322235 Rating BUY Price Rs850 Target Price Rs957 Implied Upside 12.6% Sensex 27,591 Nifty 8,544 (Prices
Indraprastha Gas. Growth traction continues. Source: Company Data; PL Research
 Growth traction continues June 28, 216 Avishek Datta avishekdatta@plindia.com +91 22 66322254 Rating BUY Price Rs65 Target Price Rs632 Implied Upside 4.5% Sensex 26,43 Nifty 8,95 (Prices as on June 27,
Mphasis. Increased confidence on margins. Source: Company Data; PL Research
 Increased confidence on margins July 25, 2016 Govind Agarwal govindagarwal@plindia.com +91 22 66322300 Rating BUY Price Rs540 Target Price Rs570 Implied Upside 5.6% Sensex 28,095 Nifty 8,636 (Prices as
Transport Corporation of India Ltd.
 Jan-12 Feb-12 Mar-12 Apr-12 May-12 Jun-12 Jul-12 Aug-12 Sep-12 Oct-12 Nov-12 Dec-12 Jan-13 January 31, 2013 COMPANY RESULTS REPORT REVIEW Nifty: 6,035; Sensex: 19,895 CMP Target Price Rs71 Rs66 Potential
Crompton Greaves. Looking to exit overseas Power segment! Source: Company Data; PL Research
 Looking to exit overseas Power segment! May 29, 2015 Kunal Sheth kunalsheth@plindia.com +91 22 66322257 Samir Bendre samirbendre@plindia.com +91 22 66322256 Rating Accumulate Price Rs166 Target Price Rs204
Source: Company Data; PL Research
 Strong inflow growth, renewable/railways key drivers October 28, 2016 Kunal Sheth kunalsheth@plindia.com +91 22 66322257 Samir Bendre samirbendre@plindia.com +91 22 66322256 Rating Accumulate Price Rs1,063
Suzlon Energy Ltd RESULT UPDATE 16th August, 2017
 RESULT UPDATE 16 th August, 2017 Aug-16 Oct-16 Dec-16 Feb-17 Apr-17 Jun-17 Aug-17 Please vote for us in Asiamoney Brokers Poll 2017: https://www.euromoney.com/article/b13j49qfcr6j pp/asiamoney-brokers-poll-2017-vote-now
Eicher Motors. Continues to ride high! Accumulate. Source: Company Data; PL Research
 Continues to ride high! Accumulate November 14, 2017 Saksham Kaushal sakshamkaushal@plindia.com +91 22 66322235 Poorvi Banka poorvibanka@plindia.com +91 22 66322426 Rating Accumulate Price Rs30,083 Target
SpiceJet. Healthy operating performance in Q2. Source: Company Data; PL Research
 Healthy operating performance in Q2 November 28, 2016 Rohan Korde rohankorde@plindia.com +91 22 66322235 Rating BUY Price Rs65 Target Price Rs115 Implied Upside 76.9% Sensex 26,316 Nifty 8,114 (Prices
Dilip Buildcon. Strong comeback BUY RESULT REVIEW 1QFY19 16 AUG Highlights of the quarter. CMP (as on 16 Aug 2018) Rs 847 Target Price Rs 1,434
 Rs 847 Target Price Rs 1,434") INDUSTRY INFRASTRUCTURE CMP (as on 16 Aug 2018) Rs 847 Target Price Rs 1,434 Nifty 11,385 Sensex 37,664 KEY STOCK DATA Bloomberg DBL IN No. of Shares (mn) 137 MCap (Rs bn) / ($ mn) 116/1,656 5m avg traded
INDUSTRY INFRASTRUCTURE CMP (as on 16 Aug 2018) Rs 847 Target Price Rs 1,434 Nifty 11,385 Sensex 37,664 KEY STOCK DATA Bloomberg DBL IN No. of Shares (mn) 137 MCap (Rs bn) / ($ mn) 116/1,656 5m avg traded
TTK Prestige Ltd. Result Highlights. Revenue growth of 41% YoY, shows no slowdown yet. OPM at ~15.8%; in line with our estimate
 Jan-11 Feb-11 Mar-11 Apr-11 May-11 Jun-11 Jul-11 Aug-11 Sep-11 Oct-11 Nov-11 Dec-11 Jan-12 January 12, 212 COMPANY RESULTS REPORT REVIEW TTK Prestige Ltd. Enough steam left BUY Nifty: 4,831; Sensex: 16,38
Sanofi India. Company Update. Buy
 May-17 Jun-17 Jul-17 Aug-17 Sep-17 Oct-17 Nov-17 Dec-17 Jan-18 Feb-18 Mar-18 Apr-18 Company Update Sanofi India Buy Cardio time ahead CY17 has been an evolving year for the domestic pharma industry including
SQS India BFSI Ltd HOLD. Impact of Macro Headwinds Still Hurting; Revenue from US May Pick up in FY18E
 Company Update Impact of Macro Headwinds Still Hurting; Revenue from US May Pick up in FY18E EBITDA Margins recovered by 618 bps QoQ: The company has witnessed many challenges over the year FY17 starting
Asian Paints. Source: Company Data; PL Research
 Premium Valuations to sustain, Accumulate May, 17 Amnish Aggarwal amnishaggarwal@plindia.com +91 Gaurav Jogani gauravjogani@plindia.com +91 8 Rating Accumulate Price Rs1,18 Target Price Rs1,171 Implied
Siemens. Railways and T&D driving inflows. Source: Company Data; PL Research
 Railways and T&D driving inflows November 23, 2016 Kunal Sheth kunalsheth@plindia.com +91 22 66322257 Samir Bendre samirbendre@plindia.com +91 22 66322256 Rating Accumulate Price Rs1,055 Target Price Rs1,230
Garware Wall Ropes ACCUMULATE. Performance Highlights CMP. `550 Target Price `618. 2QFY2017 Result Update Textile. Investment Period 12 months
 2QFY217 Result Update Textile November 16, 216 Garware Wall Ropes Performance Highlights Quarterly Data (`cr) 2QFY17 2QFY16 % yoy 1QFY17 % qoq Revenue 232 214 8.5 225 3.3 EBITDA 4 26 5.9 31 29.4 Margin
Amara Raja Batteries BUY. Performance Highlights. CMP `1,010 Target Price `1,167. 2QFY2017 Result Update Auto Ancillary. 3-year price chart
 2QFY217 Result Update Auto Ancillary November 8, 216 Amara Raja Batteries Performance Highlights BUY CMP `1,1 Target Price `1,167 Y/E March (` cr) 3QFY16 3QFY15 % chg (yoy) 2QFY16 % chg (qoq) Net Sales
JK Lakshmi Cement. Source: Company Data; PL Research
 Expansions on schedule; lower costs to aid margins June 28, 2016 Kamlesh Bagmar kamleshbagmar@plindia.com +91 22 66322237 Ankit Shah ankitshah@plindia.com +91 22 66322244 Rating BUY Price Rs385 Target
Coal India. Source: Company Data; PL Research
 Lower costs and higher scale off sets weaker realisations February 12, 2016 Kamlesh Bagmar kamleshbagmar@plindia.com +91 22 66322237 Ankit Shah ankitshah@plindia.com +91 22 66322244 Rating BUY Price Rs305
Amber Enterprises India Ltd
 3QFY2019 Result Update Consumer Durable February 16, 2019 Amber Enterprises India Ltd Performance Update (` cr) 3QFY19 3QFY18 % yoy 2QFY19 % qoq Revenue 388.8 338.4 14.9 226.3 71.8 EBITDA 22.1 24.1 (8.2)