Sarawak Plantation Berhad (Company No P) (Incorporated in Malaysia) and its subsidiaries
|
|
|
- Egbert Hunter
- 5 years ago
- Views:
Transcription
1 Sarawak Plantation Berhad ( ) (Incorporated in Malaysia) and its subsidiaries Financial statements for the financial year ended 31 December 2017
2 1 Sarawak Plantation Berhad ( P) (Incorporated in Malaysia) and its subsidiaries Directors' report for the financial year ended 31 December 2017 The Directors hereby submit their report and the audited financial statements of the Group and of the Company for the financial year ended 31 December Principal activities The Company is principally engaged in investment holding while the principal activities of the subsidiaries are stated in Note 5 to the financial statements. There has been no significant change in the nature of these activities during the financial year. Subsidiaries The details of the Company s subsidiaries are disclosed in Note 5 to the financial statements. Results Group RM Company RM (Loss)/Profit for the financial year attributable to: Owners of the Company ( 10,252,689) 4,174,260 Non-controlling interests ( 257,291) - ( 10,509,980) 4,174,260 ========= ========= Reserves and provisions There were no material transfers to or from reserves and provisions during the financial year under review. Dividends No dividend was paid during the financial year and the Directors do not recommend any dividend to be paid for the financial year under review.
3 2 Directors of the Company Directors who served during the financial year until the date of this report are: Datuk Amar Abdul Hamed Bin Sepawi* Polit Bin Hamzah* Hasmawati Binti Sapawi Umang Nangku Jabu* Datu Haji Chaiti Bin Haji Bolhassan* Azizi Bin Morni* Ali Bin Adai* * These Directors are also directors of the Company s respective subsidiaries. The names of the other directors of the Company s respective subsidiaries are: Datuk Haji Mohammed Sepuan Bin Anu Haji Soedirman Bin Haji Aini Datu Jumastapha Bin Lamat Hasbi Bin Suhaili Datu Sajeli Bin Kipli Sia Ting Lung Koay Bee Eng Trina Tan Yang Li Saidi Bin Bujang (resigned on 24 October 2017) Directors interests in shares The interests and deemed interests in the shares of the Company and of its related corporations (other than wholly-owned subsidiaries) of those who were Directors at financial year end (including the interests of the spouses or children of the Directors who themselves are not Directors of the Company) as recorded in the Register of Directors Shareholdings are as follows: Direct interests in the Company Number of ordinary shares At At Bought Sold Datuk Amar Abdul Hamed Bin Sepawi 200, ,000 Polit Bin Hamzah 50, ,000 Umang Nangku Jabu 50, ,000 Datu Haji Chaiti Bin Haji Bolhassan 100, ,000 Deemed interests in the Company Datuk Amar Abdul Hamed Bin Sepawi 84,969, ,969,024
4 3 Directors interests in shares (continued) By virtue of their interests in the shares of the Company, Datuk Amar Abdul Hamed Bin Sepawi is also deemed interested in the shares of the subsidiaries during the financial year to the extent that Sarawak Plantation Berhad has an interest. Deemed interests in SPB Pelita Suai Sdn. Bhd.: Number of ordinary shares At At Bought Sold Datuk Amar Abdul Hamed Bin Sepawi 1,596, ,596,000 Deemed interests in Sarawak Plantation Services Sdn. Bhd.: Datuk Amar Abdul Hamed Bin Sepawi 95, ,000 Deemed interests in Azaria Sdn. Bhd.: Datuk Amar Abdul Hamed Bin Sepawi Deemed interests in SPB PPES Karabungan Plantation Sdn. Bhd.: Datuk Amar Abdul Hamed Bin Sepawi None of the other Directors holding office at 31 December 2017 had any interest in the shares of the Company and of its related corporations during the financial year. Directors benefits Since the end of the previous financial year, no Director of the Company has received nor become entitled to receive any benefit (other than a benefit included in the aggregate amount of remuneration received or due and receivable by Directors as shown in the financial statements or the fixed salary of a full time employee of the Company and of its related corporations) by reason of a contract made by the Company or a related corporation with the Director or with a firm of which the Director is a member, or with a company in which the Director has a substantial financial interest, other than certain Directors who have significant financial interests in companies which traded with certain companies in the Group in the ordinary course of business (as disclosed in Note 32 to the financial statements).
5 4 Directors benefits (continued) There were no arrangements during and at the end of the financial year which had the object of enabling Directors of the Company to acquire benefits by means of the acquisition of shares in or debentures of the Company or any other body corporate. Issue of shares and debentures There were neither changes in the issued and paid-up capital of the Company, nor issuances of debentures by the Company during the financial year. Options granted over unissued shares No options were granted to any person to take up unissued shares of the Company during the financial year. Indemnity and insurance costs During the financial year, Sarawak Plantation Berhad and its subsidiaries, are covered under Directors and Officers Liability Insurance. The total amount of insurance effected for the Directors and Officers is RM5,000,000. The insurance premium for the company is RM14,250. Other statutory information Before the financial statements of the Group and of the Company were made out, the Directors took reasonable steps to ascertain that: i) all known bad debts have been written off and adequate provision made for doubtful debts, and ii) any current assets which were unlikely to be realised in the ordinary course of business have been written down to an amount which they might be expected so to realise. At the date of this report, the Directors are not aware of any circumstances: i) that would render the amount written off for bad debts or the amount of the provision for doubtful debts in the Group and in the Company inadequate to any substantial extent, or ii) that would render the value attributed to the current assets in the financial statements of the Group and of the Company misleading, or
6 5 Other statutory information (continued) iii) iv) which have arisen which render adherence to the existing method of valuation of assets or liabilities of the Group and of the Company misleading or inappropriate, or not otherwise dealt with in this report or the financial statements that would render any amount stated in the financial statements of the Group and of the Company misleading. At the date of this report, there does not exist: i) any charge on the assets of the Group or of the Company that has arisen since the end of the financial year and which secures the liabilities of any other person, or ii) any contingent liability in respect of the Group or of the Company that has arisen since the end of the financial year. No contingent liability or other liability of any company in the Group has become enforceable, or is likely to become enforceable within the period of twelve months after the end of the financial year which, in the opinion of the Directors, will or may substantially affect the ability of the Group and of the Company to meet their obligations as and when they fall due. In the opinion of the Directors, other than the effect of impairment losses on property, plant and equipment and plantation development expenditure of RM5,621,780 and RM37,389,803 as disclosed in Notes 3 and 4 respectively, the financial performance of the Group and of the Company for the financial year ended 31 December 2017 have not been substantially affected by any item, transaction or event of a material and unusual nature nor has any such item, transaction or event occurred in the interval between the end of that financial year and the date of this report.
7
8 7 Sarawak Plantation Berhad ( ) (Incorporated in Malaysia) and its subsidiaries Statements of financial position as at 31 December 2017 Group Company Note RM RM RM RM Assets Property, plant and equipment 3 368,092, ,585,715 2,221 2,515 Plantation development expenditure 4 330,734, ,742, Investment in subsidiaries ,052, ,052,482 Investment in an associate Investment properties 7 4,455,191 4,621, Total non-current assets 703,281, ,949, ,054, ,054, Inventories 8 16,975,430 18,092, Trade and other receivables 9 22,391,880 24,699,334 3,566,642 1,814,216 Prepayments and other assets 10 4,447,559 4,592, , ,177 Current tax recoverable 3,305, , ,130 28,999 Other investments 11 9,678,066 9,465, Cash and cash equivalents ,399, ,396,897 74,439,240 72,866, ,198, ,402,514 78,323,927 74,830,888 Assets classified as held for sale , , Total current assets 162,147, ,351,574 78,323,927 74,830, Total assets 865,429, ,300, ,378, ,885,885 ========== ========== ========== ========= Equity Share capital ,968, ,000, ,968, ,000,000 Share premium - 60,968,951-60,968,951 Reserves 287,609, ,862,467 53,813,109 49,638,849 Total equity attributable to owners of the Company 628,578, ,831, ,782, ,607,800 Non-controlling interests 5 ( 10,102,109) ( 9,844,818) - - Total equity 618,476, ,986, ,782, ,607,
9 8 Statements of financial position as at 31 December 2017 (continued) Liabilities Group Company Note RM RM RM RM Deferred tax liabilities 15 51,333,000 53,440, Loans and borrowings ,291,563 89,942, Total non-current liabilities 161,624, ,382, Trade and other payables 17 55,720,121 86,990,536 10,596,570 11,278,085 Loans and borrowings 16 29,577,184 42,925, Current tax payable 30,770 15, Total current liabilities 85,328, ,931,715 10,596,570 11,278, Total liabilities 246,952, ,314,255 10,596,570 11,278, Total equity and liabilities 865,429, ,300, ,378, ,885,885 ========== ========== ========== ========== The notes on pages 17 to 105 are an integral part of these financial statements.
10 9 Sarawak Plantation Berhad ( ) (Incorporated in Malaysia) and its subsidiaries Statements of profit or loss and other comprehensive income for the financial year ended 31 December 2017 Group Company Note RM RM RM RM Revenue ,176, ,966,858 5,000,000 20,867,500 Cost of sales (301,427,070) (299,653,951) - - Gross profit 97,749,712 84,312,907 5,000,000 20,867,500 Other income 1,721,055 2,520, Distribution expenses ( 20,851,216) ( 19,967,708) - - Administrative expenses ( 20,676,296) ( 17,910,485) ( 3,069,274) ( 5,564,996) Replanting expenses ( 13,387,135) ( 19,533,958) - - Results from operating activities 19 44,556,120 29,421,024 1,930,726 15,302,504 Other non-operating income 20-3,700, Other non-operating expenses 21 ( 43,408,015) ( 7,070,160) - - Finance income 22 3,393,727 3,309,112 2,588,152 2,687,360 Finance costs 23 ( 6,088,137) ( 3,631,813) ( 14,748) ( 5,479) Net finance (costs)/income ( 2,694,410) ( 322,701) 2,573,404 2,681,881 (Loss)/Profit before tax ( 1,546,305) 25,728,163 4,504,130 17,984,385 Taxation 24 ( 8,963,675) ( 6,397,650) ( 329,870) ( 505,834) (Loss)/Profit and total comprehensive (loss)/ income for the financial year ( 10,509,980) 19,330,513 4,174,260 17,478,551 ========= ========== ========== ==========
11 10 Statements of profit or loss and other comprehensive income for the financial year ended 31 December 2017 (continued) Group Company Note RM RM RM RM Total comprehensive (loss)/ income attributable to: Owners of the Company ( 10,252,689) 22,211,066 4,174,260 17,478,551 Non-controlling interests 5 ( 257,291) ( 2,880,553) - - (Loss)/Profit and total comprehensive (loss)/ income for the financial year ( 10,509,980) 19,330,513 4,174,260 17,478,551 ========= ========= ========= ========= Basic and diluted (loss)/ earnings per ordinary share (sen) 26 ( 3.66) 7.94 ========= ========= The notes on pages 17 to 105 are an integral part of these financial statements.
12 11 Sarawak Plantation Berhad ( ) (Incorporated in Malaysia) and its subsidiaries Consolidated statement of changes in equity for the financial year ended 31 December Attributable to owners of the Company Non-distributable Distributable Share Share Equity Treasury Retained Non-controlling Total capital premium reserve shares earnings Total interests equity Group Note RM RM RM RM RM RM RM RM At 1 January ,000,000 60,968, ,560 ( 1,222,307) 288,960, ,200,727 ( 6,841,795) 622,358,932 Profit and total comprehensive income for the financial year ,211,066 22,211,066 ( 2,880,553) 19,330,513 Dividends to owners of the Company ( 12,580,375) ( 12,580,375) - ( 12,580,375) Dividends to non-controlling interest ( 122,500) ( 122,500) Acquisition of a subsidiary At 31 December 2016/ 1 January ,000,000 60,968, ,560 ( 1,222,307) 298,591, ,831,418 ( 9,844,818) 628,986,600 Loss and total comprehensive loss for the financial year ( 10,252,689) ( 10,252,689) ( 257,291) ( 10,509,980) Transfer in accordance with Section 618 (2) of the Companies Act ,968,951 ( 60,968,951) At 31 December ,968, ,560 ( 1,222,307) 288,338, ,578,729 ( 10,102,109) 618,476,620 ========== ========== ========== ========== ========== ========== ========== ========== (Note 14.1) (Note 14.2) (Note 14.3) (Note 14.4)
13 12 Statement of changes in equity for the financial year ended 31 December Attributable to owners of the Company Non-distributable Distributable Share Share Treasury Retained capital premium shares earnings Total Company Note RM RM RM RM RM At 1 January ,000,000 60,968,951 ( 1,222,307) 45,962, ,709,624 Profit and total comprehensive income for the financial year ,478,551 17,478,551 Dividends to owners of the Company ( 12,580,375) ( 12,580,375) At 31 December 2016/1 January ,000,000 60,968,951 ( 1,222,307) 50,861, ,607,800 Profit and total comprehensive income for the financial year ,174,260 4,174,260 Transfer in accordance with Section 618 (2) of the Companies Act ,968,951 ( 60,968,951) At 31 December ,968,951 - ( 1,222,307) 55,035, ,782,060 ========== ========== ========== ========== ========== (Note 14.1) (Note 14.2) (Note 14.4) The notes on pages 17 to 105 are an integral part of these financial statements.
14 13 Sarawak Plantation Berhad ( ) (Incorporated in Malaysia) and its subsidiaries Statements of cash flows for the financial year ended 31 December 2017 Cash flows from operating activities Group Company Note RM RM RM RM (Loss)/Profit before tax ( 1,546,305) 25,728,163 4,504,130 17,984,385 Adjustments for: Change in fair value of other investments 19 ( 26,393) 87, Depreciation of property, plant and equipment 3 25,386,513 23,475, Depreciation of plantation development expenditure 4 220, , Depreciation of investment properties 7 166, , Dividend income from: - subsidiaries ( 5,000,000) (20,867,500) - other investments ( 48,891) ( 46,436) - - Gain on disposal of: - other investments ( 58,696) ( 50,921) property, plant and equipment 19 ( 18,775) Loss on surrender of: - land to government authorities 21 4, plantation development expenditure to government authorities , Impairment losses on: - property, plant and equipment 3 5,621, , plantation development expenditure 4 37,389,803 5,842, prepayments and other assets 86, , trade and other receivables 80,914 27,219 2, ,136 Finance income 22 ( 3,393,727) ( 3,309,112) ( 2,588,152) ( 2,687,360) Finance costs 23 6,088,137 3,631,813 14,748 5,479 Inventories written down 8 365, Inventories written off 8 115, , Write-off of investment in subsidiaries ,078 Reversal of impairment losses on deposits paid - ( 3,700,000) - - Property, plant and equipment written off 19 88,675 24, Plantation development expenditure expensed 4 191, Operating profit/(loss) before changes in working capital 71,105,863 53,523,787 ( 3,066,093) ( 4,606,488)
15 14 Statements of cash flows for the financial year ended 31 December 2017 (continued) Group Company Note RM RM RM RM Change in inventories 635, , Change in trade and other receivables, prepayments and other assets 3,959,583 ( 3,558,378) 2,261 20,662,870 Change in trade and other payables ( 40,720,151) ( 5,176,163) ( 781,143) 9,723,643 Cash generated from/(used in) operations 34,980,408 45,213,531 ( 3,844,975) 25,780,025 Tax paid ( 14,205,608) ( 3,878,116) ( 500,000) ( 604,834) Interest/Profit paid ( 6,636,445) ( 3,864,396) - - Interest received 3,082,025 2,851,854 2,339,692 1,606,544 Finance lease profit paid ( 142,833) ( 225,523) - - Net cash from/(used in) operating activities 17,077,547 40,097,350 ( 2,005,283) 26,781,735 ========= ========= ========= ========= Cash flows from investing activities Acquisition of property, plant and equipment (i) ( 11,225,809) ( 43,777,872) - - Advances to subsidiaries - - ( 1,421,973) - Dividends received 29,386 29,107 5,000,000 20,867,500 Net movement of deposits with original maturities exceeding three months ( 100,122) 4,926, Plantation development expenditure (net of depreciation of property, plant and equipment and interest capitalised) ( 9,473,690) ( 43,938,339) - - Partial payment/deposits for investment in a subsidiary company - ( 14,859,211) - ( 14,859,211) Proceeds from disposal of: - property, plant and equipment 83, plantation development expenditure 883, Deposits for investments refunded - 3,700, Net cash (used in)/from investing activities ( 19,802,510) ( 93,919,648) 3,578,027 6,008,289 ========= ========= ========= =========
16 15 Statements of cash flows for the financial year ended 31 December 2017 (continued) Cash flows from financing activities Group Company Note RM RM RM RM Net repayment of revolving credits ( 13,000,000) ( 3,000,000) - - Net proceeds of term loans 21,760,000 68,929, Repayment of finance lease liabilities ( 2,032,203) ( 2,667,108) - - Dividends paid to owners of the Company 27 - ( 12,580,375) - ( 12,580,375) Dividends paid to non-controlling interests - ( 122,500) - - Acquisition of a subsidiary Net cash from/(used in) financing activities (ii) 6,727,797 50,559,258 - ( 12,580,345) ========= ========= ========= ========= Net increase/(decrease) in cash and cash equivalents 4,002,834 ( 3,263,040) 1,572,744 20,209,679 Cash and cash equivalents at beginning of financial year 100,396, ,659,937 72,866,496 52,656,817 Cash and cash equivalents at end of financial year ,399, ,396,897 74,439,240 72,866,496 ========= ========= ========= ========= Notes (i) Acquisition of property, plant and equipment Group Note RM RM Paid in cash 11,225,809 43,777,872 Payables 6,491,535 24,470,361 Fair value of additions through acquisition of a subsidiary recognised at the date of acquisition - 29,769,175 Total acquisitions 3 17,717,344 98,017,408 ========= =========
17 16 Statements of cash flows for the financial year ended 31 December 2017 (continued) Notes (continued) (ii) Reconciliation of liabilities arising from financing activities Net changes Acquisition At from financing of At cash flows new leases RM RM RM RM Group Revolving credit 39,000,000 ( 13,000,000) - 26,000,000 Revolving credit (Islamic) 2,000, ,000,000 Islamic term loan 88,115,211 21,760, ,875,211 Finance lease liabilities 3,752,739 ( 2,032,203) 273,000 1,993,536 Total liabilities from financing activities 132,867,950 6,727, , ,868,747 ========= ========= ========= ========= The notes on pages 17 to 105 are an integral part of these financial statements.
18 17 Sarawak Plantation Berhad ( ) (Incorporated in Malaysia) and its subsidiaries Notes to the financial statements Sarawak Plantation Berhad is a public limited liability company, incorporated and domiciled in Malaysia and is listed on the Main Market of Bursa Malaysia Securities Berhad ( Bursa Malaysia ). The addresses of the principal place of business and registered office of the Company are as follows: Principal place of business Lot 1174, Block 9, MCLD, Miri Waterfront, Jalan Permaisuri, Miri, Sarawak. Registered office 8 th Floor, Wisma Naim, 2 ½ Miles, Rock Road, Kuching, Sarawak. The consolidated financial statements of the Company as at and for the financial year ended 31 December 2017 comprise the Company and its subsidiaries (together referred to as the Group and individually referred to as Group entities ) and the Group s interest in an associate. The financial statements of the Company as at and for the financial year ended 31 December 2017 do not include other entities. The Company is principally engaged in investment holding activities while the principal activities of the other group entities are stated in Note 5 to the financial statements. These financial statements were authorised for issue by the Board of Directors on 27 February Basis of preparation (a) Statement of compliance The financial statements of the Group and the Company have been prepared in accordance with Financial Reporting Standards ( FRSs ) and the requirements of the Companies Act 2016 in Malaysia. The following are accounting standards, amendments and interpretations that have been issued by the Malaysian Accounting Standards Board ( MASB ) but have not been adopted by the Group and the Company: Standard/Amendment/Interpretation Effective date FRS 9, Financial Instruments (2014) 1 January 2018 IC Interpretation 22, Foreign Currency Transactions and Advance Consideration 1 January 2018
19 18 1. Basis of preparation (continued) (a) Statement of compliance (continued) Standard/Amendment/Interpretation Effective date Amendments to FRS 1, First-time Adoption of Financial Reporting Standards (Annual Improvements to FRS Standards Cycle) 1 January 2018 Amendments to FRS 2, Share-based Payment Classification and Measurement of Share-based Payment Transactions 1 January 2018 Amendments to FRS 4, Insurance Contracts Applying FRS 9 Financial Instruments with FRS 4 Insurance Contracts 1 January 2018 Amendments to FRS 128, Investments in Associates and Joint Ventures (Annual Improvements to FRS Standards Cycle) 1 January 2018 Amendments to FRS 140, Investment Property Transfers of Investment Property 1 January 2018 IC Interpretation 23, Uncertainty over Income Tax Treatments 1 January 2019 Amendments to FRS 10, Consolidated Financial Statements and FRS 128, Investments in Associates and Joint Ventures - sale or Contribution of Assets between an Investor and its Associate or Joint Venture Yet to be determined The Group s financial statements for annual period beginning on 1 January 2018 will be prepared in accordance with the Malaysian Financial Reporting Standards ( MFRSs ) issued by the MASB and International Financial Reporting Standards ( IFRSs ). As a result, the Group and the Company will not be adopting the above FRSs, interpretations and amendments. The Group falls within the scope of MFRS 141, Agriculture. Therefore, the Company is currently exempted from adopting the MFRSs and is referred to as a Transitioning Entity.
20 19 1. Basis of preparation (continued) (a) Statement of compliance (continued) The Group and the Company will apply the following MFRSs, where applicable, that have been issued by Malaysian Accounting Standards Board ( MASB ) but not yet effective, on the respective effective dates. Standard/Amendment/Interpretation Effective date Agriculture: Bearer Plants (Amendments to MFRS 116 and MFRS 141) 1 January 2018 MFRS 9, Financial Instruments (2014) 1 January 2018 MFRS 15, Revenue from Contracts with Customers 1 January 2018 Clarifications to MFRS 15, Revenue from Contracts with Customers 1 January 2018 Amendments to MFRS 1, First-time Adoption of Malaysian Financial Reporting Standards (Annual Improvements to MFRS Standards Cycle) 1 January 2018 Amendments to MFRS 128, Investments in Associates and Joint Ventures (Annual Improvements to MFRS Standards Cycle) 1 January 2018 Amendments to MFRS 140, Investment Property - Transfers 1 January 2018 MFRS 16, Leases 1 January 2019 IC Interpretation 23, Uncertainty over Income Tax Treatments 1 January 2019 Amendments to MFRS 3, Business Combinations (Annual Improvements to MFRS Standards Cycle) 1 January 2019 Amendments to MFRS 9, Financial Instruments Prepayment Features with Negative Compensation 1 January 2019 Amendments to MFRS 112, Income Taxes (Annual Improvements to MFRS Standards Cycle) 1 January 2019 Amendments to MFRS 123, Borrowing Costs (Annual Improvements to MFRS Standards Cycle) 1 January 2019 Amendments to MFRS 128, Investments in Associates and Joint Ventures Long-term Interests in Associates and Joint Ventures 1 January 2019
21 20 1. Basis of preparation (continued) (a) Statement of compliance (continued) Material impacts of the initial application of the abovementioned accounting standards, amendments or interpretations, which are or are likely to be applicable to the Group and which are to be applied retrospectively, are discussed below: (i) Amendments to MFRS 116, Property, Plant and Equipment and MFRS 141, Agriculture - Agriculture: Bearer Plants The amendments to MFRS 116 and MFRS 141 require a bearer plant, defined as a living plant, to be accounted for as property, plant and equipment in accordance with MFRS 116, Property, Plant and Equipment., whereas biological assets within the scope of MFRS 141 are measured at fair value less costs to sell. The potential impacts on the financial statements for years ended 31 December 2017 and 31 December 2016 on initial application of Amendments to MFRS 116 and MFRS 141 are as follows: Group Statement of financial Statement of financial position as at position as at 31 December December 2016 As As currently Expected currently Expected stated restatement stated restatement RM RM RM RM Property, plant and equipment 368,092, ,364, ,585, ,585,715 Plantation development expenditure 330,734, ,889, ,742, ,303,295 Biological assets - 24,707,329-37,184,836 Reserves 287,609, ,989, ,862, ,685,879 Deferred tax liabilities 51,333, ,088,908 53,440, ,362,624 ========= ========= ========= =========
22 21 1. Basis of preparation (continued) (a) Statement of compliance (continued) (i) Amendments to MFRS 116, Property, Plant and Equipment and MFRS 141, Agriculture - Agriculture: Bearer Plants (continued) Group Statement of profit or Statement of profit or loss and other loss and other comprehensive income comprehensive income for the financial year for the financial year ended ended 31 December December 2016 As As currently Expected currently Expected stated restatement stated restatement RM RM RM RM Cost of sales (301,427,070) (317,464,452) (299,653,951)(313,745,042) Changes in fair value of biological assets - ( 12,477,508) - 14,964,492 Replanting expenditure ( 13,387,135) - ( 19,533,958) - Other non-operating expenses ( 43,408,015) ( 12,891,152) ( 7,070,160) ( 6,145,394) Taxation ( 8,963,675) ( 7,796,960) ( 6,397,650) ( 14,296,217) (Loss)/Profit for the year ( 10,509,980) 6,045,844 19,330,513 32,764,071 ========= ========= ========= ========= (ii) MFRS 9, Financial Instruments MFRS 9 replaces the guidance in MFRS 139, Financial Instruments: Recognition and Measurement on the classification and measurement of financial assets and financial liabilities, and on hedge accounting. There are no material financial impacts on the financial statements for years ended 31 December 2017 and 31 December 2016 on initial application of MFRS 9. (iii) MFRS 15, Revenue from Contracts with Customers and Clarifications to MFRS 15, Revenue from Contracts with Customers MFRS 15 replaces the guidance in MFRS 111, Construction Contracts, MFRS 118, Revenue, IC Interpretation 13, Customer Loyalty Programmes, IC Interpretation 15, Agreements for Construction of Real Estate, IC Interpretation 18, Transfers of Assets from Customers and IC Interpretation 131, Revenue - Barter Transactions Involving Advertising Services.
23 22 1. Basis of preparation (continued) (a) Statement of compliance (continued) (iii) MFRS 15, Revenue from Contracts with Customers and Clarifications to MFRS 15, Revenue from Contracts with Customers (continued) Currently, the Group recognises revenue from contracts with customers in accordance with the accounting policies as described in Note 2(m) to the financial statements. Upon adoption of MFRS 15, the Group will recognise the revenue from contracts with customers when the Group transfers controls of goods or services to its customers as the amount to which the Group expects to be entitled. Revenue is recognised over time or at a point in time, when control of goods or service is transferred to the customers. The Company will apply MFRS 15 retrospectively with adoption of practical expedients. There are no material financial impacts on the financial statements for years ended 31 December 2017 and 31 December 2016 on initial application of MFRS 15. (iv) MFRS 16, Leases MFRS 16 replaces the guidance in MFRS 117, Leases, IC Interpretation 4, Determining whether an Arrangement contains a Lease, IC Interpretation 115, Operating Leases Incentives and IC Interpretation 127, Evaluating the Substance of Transactions Involving the Legal Form of a Lease. MFRS 16 introduces a single, on-balance sheet lease accounting model for lessees. A lessee recognises a right-of-use asset representing its right to use the underlying asset and a lease liability representing its obligations to make lease payments. There are recognition exemptions for short-term leases and leases of low-value items. Lessor accounting remains similar to the current standard which continues to be classified as finance or operating lease. The Group is currently assessing the financial impact that may arise from the adoption of MFRS 16.
24 23 1. Basis of preparation (continued) (a) Statement of compliance (continued) (v) Amendments to MFRS 128, Investments in Associates and Joint Ventures (Annual Improvements to MFRS Standards Cycle) The amendments clarify that an entity, which is a venture capital organisation, or a mutual fund, unit trust or similar entities, has an investment-by-investment choice to measure its investments in associates and joint ventures at fair value. There will be no significant impact on the Group and Company from the adoption of Amendments to MFRS 128. (b) Basis of measurement The financial statements have been prepared on the historical cost basis, other than as disclosed in Note 2. (c) Functional and presentation currency These financial statements are presented in Ringgit Malaysia ( RM ), which is the Company s functional currency. (d) Use of estimates and judgements The preparation of financial statements in conformity with FRSs requires management to make judgements, estimates and assumptions that affect the application of accounting policies and the reported amounts of assets, liabilities, income and expenses. Actual results may differ from these estimates. Estimates and underlying assumptions are reviewed on an ongoing basis. Revisions to accounting estimates are recognised in the period in which the estimates are revised and in any future periods affected. There are no significant areas of estimation uncertainty and critical judgements in applying accounting policies that have significant effect on the amounts recognised in the financial statements other than impairment assessment of property, plant and equipment and plantation development expenditure as disclosed in Notes 3 and 4 of the financial statements respectively. In preparing the financial statements, the Group has evaluated whether these assets are stated in excess of their net recoverable amounts. The net recoverable amounts are determined either by calculating the value-in-use of the assets via estimating the cash flows from their continuing use and discounting them to their net present values or by estimating their fair value less costs of disposal, an exercise that entails a high degree of estimation uncertainty. An allowance for impairment loss is made if the net recoverable amounts of the assets are lower than their carrying amounts.
25 24 2. Significant accounting policies The accounting policies set out below have been applied consistently to the periods presented in these financial statements and have been applied consistently by Group entities, unless otherwise stated. (a) Basis of consolidation (i) Subsidiaries Subsidiaries are entities, including structured entities, controlled by the Company. The financial statements of subsidiaries are included in the consolidated financial statements from the date that control commences until the date that control ceases. The Group controls an entity when it is exposed, or has rights, to variable returns from its involvement with the entity and has the ability to affect those returns through its power over the entity. Potential voting rights are considered when assessing control only when such rights are substantive. The Group also considers it has de facto power over an investee when, despite not having the majority of voting rights, it has the current ability to direct the activities of the investee that significantly affect the investee s return. Investments in subsidiaries are measured in the Company s statement of financial position at cost less any impairment losses, unless the investment is classified as held for sale or distribution. The cost of investment includes transaction costs. (ii) Business combinations Business combinations are accounted for using the acquisition method from the acquisition date, which is the date on which control is transferred to the Group. Acquisitions on or after 1 January 2011 For acquisitions on or after 1 January 2011, the Group measures the cost of goodwill at the acquisition date as: the fair value of the consideration transferred; plus the recognised amount of any non-controlling interests in the acquiree; plus if the business combination is achieved in stages, the fair value of the existing equity interest in the acquiree; less the net recognised amount (generally fair value) of the identifiable assets acquired and liabilities assumed.
26 25 2. Significant accounting policies (continued) (a) Basis of consolidation (continued) (ii) Business combinations (continued) Acquisitions on or after 1 January 2011 (continued) When the excess is negative, a bargain purchase gain is recognised immediately in profit or loss. For each business combination, the Group elects whether it measures the non-controlling interests in the acquiree either at fair value or at the proportionate share of the acquiree s identifiable net assets at the acquisition date. Transaction costs, other than those associated with the issue of debt or equity securities, that the Group incurs in connection with a business combination are expensed as incurred. Acquisitions between 1 January 2006 and 1 January 2011 For acquisitions between 1 January 2006 and 1 January 2011, goodwill represents the excess of the cost of the acquisition over the Group s interest in the recognised amount (generally fair value) of the identifiable assets, liabilities and contingent liabilities of the acquiree. When the excess was negative, a bargain purchase gain was recognised immediately in profit or loss. Transaction costs, other than those associated with the issue of debt or equity securities, that the Group incurred in connection with business combinations were capitalised as part of the cost of the acquisition. Acquisitions prior to 1 January 2006 For acquisitions prior to 1 January 2006, goodwill represents the excess of the cost of the acquisition over the Group s interest in the fair value of the net identifiable assets and liabilities. (iii) Acquisitions of non-controlling interests The Group accounts for all changes in its ownership interest in a subsidiary that do not result in a loss of control as equity transactions between the Group and its non-controlling interest holders. Any difference between the Group s share of net assets before and after the change, and any consideration received or paid, is adjusted to or against Group reserves.
27 26 2. Significant accounting policies (continued) (a) Basis of consolidation (continued) (iv) Loss of control Upon the loss of control of a subsidiary, the Group derecognises the assets and liabilities of the former subsidiary, any non-controlling interests and the other components of equity related to the former subsidiary from the consolidated statement of financial position. Any surplus or deficit arising on the loss of control is recognised in profit or loss. If the Group retains any interest in the former subsidiary, then such interest is measured at fair value at the date that control is lost. Subsequently, it is accounted for as an equity-accounted investee or as an available-for-sale financial asset depending on the level of influence retained. (v) Associates Associates are entities, including unincorporated entities, in which the Group has significant influence, but not control, over the financial and operating policies. Investment in associates are accounted for in the consolidated financial statements using the equity method less any impairment losses, unless it is classified as held for sale or distribution. The cost of the investment includes transaction costs. The consolidated financial statements include the Group s share of the profit or loss and other comprehensive income of the associates, after adjustment if any, to align the accounting policies with those of the Group, from the date that significant influence commences until the date that significant influence ceases. When the Group s share of losses exceeds its interest in an associate, the carrying amount of that interest including any long-term investments is reduced to zero, and the recognition of further losses is discontinued except to the extent that the Group has an obligation or has made payments on behalf of the associate. When the Group ceases to have significant influence over an associate, any retained interest in the former associate at the date when significant influence is lost is measured at fair value and this amount is regarded as the initial carrying amount of a financial asset. The difference between the fair value of any retained interest plus proceeds from the interest disposed of and the carrying amount of the investment at the date when equity method is discontinued is recognised in the profit or loss.
28 27 2. Significant accounting policies (continued) (a) Basis of consolidation (continued) (v) Associates (continued) When the Group's interest in an associate decreases but does not result in a loss of significant influence, any retained interest is not re-measured. Any gain or loss arising from the decrease in interest is recognised in profit or loss. Any gains or losses previously recognised in other comprehensive income are also reclassified proportionately to the profit or loss if that gain or loss would be required to be reclassified to profit or loss on the disposal of the related assets or liabilities. Investments in associates are measured in the Company s statement of financial position at cost less any impairment losses, unless the investment is classified as held for sale or distribution. The cost of investment includes transaction costs. (vi) Non-controlling interests Non-controlling interests at the end of the reporting period, being the equity in a subsidiary not attributable directly or indirectly to the equity holders of the Company, are presented in the consolidated statement of financial position and statement of changes in equity within equity, separately from equity attributable to the owners of the Company. Noncontrolling interests in the results of the Group is presented in the consolidated statement of profit or loss and other comprehensive income as an allocation of the profit or loss and the comprehensive income for the year between non-controlling interests and owners of the Company. Losses applicable to the non-controlling interests in a subsidiary are allocated to the non-controlling interests even if doing so causes the noncontrolling interests to have a deficit balance. (vii) Transactions eliminated on consolidation Intra-group balances and transactions, and any unrealised income and expenses arising from intra-group transactions, are eliminated in preparing the consolidated financial statements. Unrealised gains arising from transactions with equity-accounted associates are eliminated against the investment to the extent of the Group s interest in the investees. Unrealised losses are eliminated in the same way as unrealised gains, but only to the extent that there is no evidence of impairment.
29 28 2. Significant accounting policies (continued) (b) Financial instruments (i) Initial recognition and measurement A financial asset or a financial liability is recognised in the statement of financial position when, and only when, the Group or the Company becomes a party to the contractual provisions of the instrument. A financial instrument is recognised initially, at its fair value plus, in the case of a financial instrument not at fair value through profit or loss, transaction costs that are directly attributable to the acquisition or issue of the financial instrument. An embedded derivative is recognised separately from the host contract and accounted for as a derivative if, and only if, it is not closely related to the economic characteristics and risks of the host contract and the host contract is not categorised as fair value through profit or loss. The host contract, in the event an embedded derivative is recognised separately, is accounted for in accordance with the policy applicable to the nature of the host contract. (ii) Financial instrument categories and subsequent measurement The Group and the Company categorise financial instruments as follows: Financial assets (a) Financial assets at fair value through profit or loss Fair value through profit or loss category comprises financial assets that are held for trading, including derivatives (except for a derivative that is a financial guarantee contract or a designated and effective hedging instrument), contingent consideration in a business combination or financial assets that are specifically designated into this category upon initial recognition. Derivatives that are linked to and must be settled by delivery of unquoted equity instruments whose fair values cannot be reliably measured are measured at cost. Other financial assets categorised as fair value through profit or loss are subsequently measured at their fair values with the gain or loss recognised in profit or loss.
30 29 2. Significant accounting policies (continued) (b) Financial instruments (continued) (ii) Financial instrument categories and subsequent measurement (continued) Financial assets (continued) (b) Held-to-maturity investments Held-to-maturity investments category comprises debt instruments that are quoted in an active market and the Group or the Company has the positive intention and ability to hold them to maturity. Financial assets categorised as held-to-maturity investments are subsequently measured at amortised cost using the effective interest method. (c) Loans and receivables Loans and receivables category comprises debt instruments that are not quoted in an active market. Financial assets categorised as loans and receivables are subsequently measured at amortised cost using the effective interest method. (d) Available-for-sale financial assets Available-for-sale category comprises investment in equity and debt securities instruments that are not held for trading. Investments in equity instruments that do not have a quoted market price in an active market and whose fair value cannot be reliably measured are measured at cost. Other financial assets categorised as available-for-sale are subsequently measured at their fair values with the gain or loss recognised in other comprehensive income, except for impairment losses, foreign exchange gains and losses arising from monetary items and gains and losses of hedged items attributable to hedge risks of fair value hedges which are recognised in profit or loss. On derecognition, the cumulative gain or loss recognised in other comprehensive income is reclassified from equity into profit or loss. Interest calculated for a debt instrument using the effective interest method is recognised in profit or loss. All financial assets, except for those measured at fair value through profit or loss, are subject to review for impairment [see Note 2(j)(i)].
31 30 2. Significant accounting policies (continued) (b) Financial instruments (continued) (ii) Financial instrument categories and subsequent measurement (continued) Financial liabilities All financial liabilities are subsequently measured at amortised cost other than those categorised as fair value through profit or loss. Fair value through profit or loss category comprises financial liabilities that are derivatives (except for a derivative that is a financial guarantee contract or a designated and effective hedging instrument), contingent consideration in a business combination or financial liabilities that are specifically designated into this category upon initial recognition. Derivatives that are linked to and must be settled by delivery of equity instruments that do not have a quoted price in an active market for identical instruments whose fair values otherwise cannot be reliably measured are measured at cost. Other financial liabilities categorised as fair value through profit or loss are subsequently measured at their fair values with the gain or loss recognised in profit or loss. (iii) Financial guarantee contracts A financial guarantee contract is a contract that requires the issuer to make specified payments to reimburse the holder for a loss it incurs because a specified debtor fails to make payment when due in accordance with the original or modified terms of a debt instrument. Fair value arising from financial guarantee contracts are classified as deferred income and is amortised to profit or loss using a straight-line method over the contractual period or, when there is no specified contractual period, recognised in profit or loss upon discharge of the guarantee. When settlement of a financial guarantee contract becomes probable, an estimate of the obligation is made. If the carrying value of the financial guarantee contract is lower than the obligation, the carrying value is adjusted to the obligation amount and accounted for as a provision.
32 31 2. Significant accounting policies (continued) (b) Financial instruments (continued) (iv) Regular way purchase or sale of financial assets A regular way purchase or sale is a purchase or sale of a financial asset under a contract whose terms require delivery of the asset within the time frame established generally by regulation or convention in the marketplace concerned. A regular way purchase or sale of financial assets is recognised and derecognised, as applicable, using trade date accounting. Trade date accounting refers to: (a) (b) the recognition of an asset to be received and the liability to pay for it on the trade date, and derecognition of an asset that is sold, recognition of any gain or loss on disposal and the recognition of a receivable from the buyer for payment on the trade date. (v) Derecognition A financial asset or a part of it is derecognised when, and only when the contractual rights to the cash flows from the financial asset expire or control of the asset is not retained or substantially all of the risks and rewards of ownership of the financial asset are transferred to another party. On derecognition of a financial asset, the difference between the carrying amount and the sum of the consideration received (including any new asset obtained less any new liability assumed) and any cumulative gain or loss that had been recognised in equity is recognised in profit or loss. A financial liability or a part of it is derecognised when, and only when, the obligation specified in the contract is discharged, cancelled or expires. On derecognition of a financial liability, the difference between the carrying amount of the financial liability extinguished or transferred to another party and the consideration paid, including any non-cash assets transferred or liabilities assumed, is recognised in profit or loss.
33 32 2. Significant accounting policies (continued) (c) Property, plant and equipment (i) Recognition and measurement Items of property, plant and equipment are measured at cost less any accumulated depreciation and any accumulated impairment losses. Cost includes expenditures that are directly attributable to the acquisition of the asset and any other costs directly attributable to bringing the asset to working condition for its intended use, and the costs of dismantling and removing the items and restoring the site on which they are located. The cost of self-constructed assets also includes the cost of materials and direct labour. For qualifying assets, borrowing costs are capitalised in accordance with the accounting policy on borrowing costs. Cost also may include transfers from equity of any gain or loss on qualifying cash flow hedges of foreign currency purchases of property, plant and equipment. Purchased software that is integral to the functionality of the related equipment is capitalised as part of that equipment. When significant parts of an item of property, plant and equipment have different useful lives, they are accounted for as separate items (major components) of property, plant and equipment. The gain and loss on disposal of an item of property, plant and equipment is determined by comparing the proceeds from disposal with the carrying amount of property, plant and equipment and is recognised net within other income or administrative expenses respectively in profit or loss. (ii) Subsequent costs The cost of replacing a component of an item of property, plant and equipment is recognised in the carrying amount of the item if it is probable that the future economic benefits embodied within the component will flow to the Group or the Company, and its cost can be measured reliably. The carrying amount of the replaced component is derecognised to profit or loss. The costs of the day-to-day servicing of property, plant and equipment are recognised in profit or loss as incurred.
34 33 2. Significant accounting policies (continued) (c) Property, plant and equipment (continued) (iii) Depreciation Depreciation is based on the cost of an asset less its residual value. Significant components of individual assets are assessed, and if a component has a useful life that is different from the remainder of that asset, then that component is depreciated separately. Depreciation is recognised in profit or loss on a straight-line basis over the estimated useful lives of each component of an item of property, plant and equipment from the date that they are available for use. Leased assets are depreciated over the shorter of the lease term and their useful lives unless it is reasonably certain that the Group will obtain ownership by the end of the lease term. Assets under construction are not depreciated until the assets are ready for their intended use. The estimated useful lives for the current and comparative periods are as follows: Leasehold land Commercial buildings Other buildings Furniture, fittings and equipment Infrastructure works Plant and machinery Motor vehicles years 50 years 20 years 5-10 years 20 years 5-20 years 5-20 years Depreciation methods, useful lives and residual values are reviewed at the end of the reporting period and adjusted as appropriate. (d) Leased assets (i) Finance lease Leases in terms of which the Group or the Company assumes substantially all the risks and rewards of ownership are classified as finance leases. Upon initial recognition, the leased asset is measured at an amount equal to the lower of its fair value and the present value of the minimum lease payments. Subsequent to initial recognition, the asset is accounted for in accordance with the accounting policy applicable to that asset.
35 34 2. Significant accounting policies (continued) (d) Leased assets (continued) (i) Finance lease (continued) Minimum lease payments made under finance leases are apportioned between the finance expense and the reduction of the outstanding liability. The finance expense is allocated to each period during the lease term so as to produce a constant periodic rate of interest on the remaining balance of the liability. Contingent lease payments are accounted for by revising the minimum lease payments over the remaining term of the lease when the lease adjustment is confirmed. Leasehold land which in substance is a finance lease is classified as property, plant and equipment, or as investment property if held to earn rental income or for capital appreciation or for both. (ii) Operating lease Leases, where the Group or the Company does not assume substantially all the risks and rewards of ownership are classified as operating leases and, except for property interest held under operating lease, the leased assets are not recognised on the statement of financial position. Payments made under operating leases are recognised in profit or loss on a straight-line basis over the term of the lease. Lease incentives received are recognised in profit or loss as an integral part of the total lease expense, over the term of the lease. Contingent rentals are charged to profit or loss in the reporting period in which they are incurred. Leasehold land which in substance is an operating lease is classified as prepaid lease payments.
36 35 2. Significant accounting policies (continued) (e) Plantation development expenditure (i) Oil palm plantation Oil palm plantation is stated at cost less accumulated impairment loss, if any. New planting expenditure incurred on land clearing, planting, upkeep of oil palms, related overhead expenses and interest incurred net of sale proceeds from scout harvesting during the pre-maturity period are capitalised as oil palm plantation expenditure. Upon maturity, all subsequent maintenance expenditure is charged to profit or loss. The capitalised pre-cropping cost is not depreciated, which represents cost incurred in planting the original estates, as their values are maintained through replanting programmes. Replanting expenditure is charged to profit or loss in the financial year in which the expenditure is incurred. (ii) Rubber tree plantation Rubber tree plantation is stated at cost less accumulated depreciation and impairment loss, if any. Expenditure on rubber tree plantation, comprising land clearing, planting and upkeep of trees, is depreciated equally over its remaining economic useful life of seven years. (iii) Teak tree plantation Teak tree plantation is stated at cost less accumulated depletion and impairment loss, if any. Expenditure on teak tree plantation in the form of land clearing, planting and upkeep of trees up to the time of harvest is capitalised in the statement of financial position as tree planting expenditure and will only be charged to profit or loss at the time of harvest in proportion to the area of teak trees harvested.
37 36 2. Significant accounting policies (continued) (f) Investment properties (i) Investment property carried at cost Investment properties are properties which are owned or held under a leasehold interest to earn rental income or for capital appreciation or for both, but not for sale in the ordinary course of business, use in the production or supply of goods or services or for administrative purposes. Properties that are occupied by the companies in the Group are accounted for as owner-occupied rather than as investment properties. Investment properties are measured at cost less accumulated depreciation and accumulated impairment losses, if any, consistent with the accounting policy for property, plant and equipment as stated in accounting policy Note 2(c). Cost includes expenditure that is directly attributable to the acquisition of the investment property. The cost of self-constructed investment property includes the cost of materials and direct labour, any other costs directly attributable to bringing the investment property to a working condition for their intended use and capitalised borrowing costs. Depreciation on investment property, comprising solely buildings, is charged to profit or loss on a straight-line basis over its estimated useful life of 50 years. Depreciation methods, useful lives and residual values are reviewed at the end of each reporting period and adjusted as appropriate. An investment property is derecognised on its disposal, or when it is permanently withdrawn from use and no future economic benefits are expected from its disposal. The difference between the net disposal proceeds and the carrying amount is recognised in profit or loss in the period in which the item is derecognised. (ii) Determination of fair value The Group exercises its judgement by reference to market information available and/or in consultation with independent valuers where warranted, to estimate the fair value of its investment property.
38 37 2. Significant accounting policies (continued) (g) Non-current assets held for sale Non-current assets that are expected to be recovered primarily through sale rather than through continuing use, are classified as held for sale. Immediately before classification as held for sale, the assets are remeasured in accordance with the Group s accounting policies. Thereafter generally the assets are measured at the lower of their carrying amount and fair value less costs of disposal. Impairment losses on initial classification as held for sale and subsequent gains or losses on remeasurement are recognised in profit or loss. Gains are not recognised in excess of any cumulative impairment loss. Property, plant and equipment once classified as held for sale are not depreciated. (h) Inventories Inventories are measured at the lower of cost and net realisable value. Cost of inventories is calculated using the weighted average method, and includes expenditure incurred in acquiring the inventories, production or conversion costs and other costs incurred in bringing them to their existing location and condition. In the case of finished goods, cost includes an appropriate share of production overheads based on normal operating capacity. Cost of crude palm oil and palm kernel includes raw material cost, direct labour and an appropriate share of production overheads based on normal operating capacity. Cost of fresh fruit bunches acquired from third parties includes the cost of purchase of the inventory while that of fresh fruit bunches from own plantations includes harvesting cost and an appropriate share of the expenditure incurred in the upkeep and maintenance of mature estates. Oil palm nursery inventories consist of seedlings remaining in the nursery for eventual field planting. Cost of palm oil seeds and seedlings includes the cost of treatment and cultivation. Net realisable value is the estimated selling price in the ordinary course of business, less the estimated costs of completion and the estimated costs necessary to make the sale.
39 38 2. Significant accounting policies (continued) (i) Cash and cash equivalents Cash and cash equivalents consist of cash on hand, balances and deposits with banks and highly liquid investments which have an insignificant risk of changes in fair value with original maturities of three months or less, and are used by the Group and the Company in the management of their short-term commitments. For the purpose of the statement of cash flows, cash and cash equivalents are presented net of bank overdrafts and pledged deposits. (j) Impairment (i) Financial assets All financial assets (except for financial assets categorised as fair value through profit or loss, investment in subsidiaries and investment in an associate) are assessed at each reporting date whether there is any objective evidence of impairment as a result of one or more events having an impact on the estimated future cash flows of the asset. Losses expected as a result of future events, no matter how likely, are not recognised. For an investment in an equity instrument, a significant or prolonged decline in the fair value below its cost is an objective evidence of impairment. If any such objective evidence exists, then the impairment loss of the financial asset is estimated. An impairment loss in respect of loans and receivables and held-tomaturity investments is recognised in profit or loss and is measured as the difference between the asset s carrying amount and the present value of estimated future cash flows discounted at the asset s original effective interest rate. The carrying amount of the asset is reduced through the use of an allowance account. An impairment loss in respect of available-for-sale financial assets is recognised in profit or loss and is measured as the difference between the asset s acquisition cost (net of any principal repayment and amortisation) and the asset s current fair value, less any impairment loss previously recognised. Where a decline in the fair value of an available-for-sale financial asset has been recognised in the other comprehensive income, the cumulative loss in other comprehensive income is reclassified from equity and recognised to profit or loss. An impairment loss in respect of unquoted equity instrument that is carried at cost is recognised in profit or loss and is measured as the difference between the financial asset s carrying amount and the present value of estimated future cash flows discounted at the current market rate of return for a similar financial asset.
40 39 2. Significant accounting policies (continued) (j) Impairment (continued) (i) Financial assets (continued) Impairment losses recognised in profit or loss for an investment in an equity instrument classified as available for sale is not reversed through profit or loss. If, in a subsequent period, the fair value of a debt instrument increases and the increase can be objectively related to an event occurring after the impairment loss was recognised in profit or loss, the impairment loss is reversed, to the extent that the asset s carrying amount does not exceed what the carrying amount would have been had the impairment not been recognised at the date the impairment is reversed. The amount of the reversal is recognised in profit or loss. (ii) Other assets The carrying amounts of other assets (except for inventories and noncurrent assets classified as held for sale) are reviewed at the end of each reporting period to determine whether there is any indication of impairment. If any such indication exists, then the asset s recoverable amount is estimated. For the purpose of impairment testing, assets are grouped together into the smallest group of assets that generates cash inflows from continuing use that are largely independent of the cash inflows of other assets or cashgenerating units ( CGU ). The goodwill acquired in a business combination, for the purpose of impairment testing, is allocated to a cashgenerating unit or a group of cash-generating units that are expected to benefit from the synergies of the combination. The recoverable amount of an asset or cash-generating unit is the greater of its value in use and its fair value less costs to sell. In assessing value in use, the estimated future cash flows are discounted to their present value using a pre-tax discount rate that reflects current market assessments of the time value of money and the risks specific to the asset or cash-generating unit. An impairment loss is recognised if the carrying amount of an asset or its related cash-generating unit exceeds its estimated recoverable amount. Impairment losses are recognised in profit or loss. Impairment losses recognised in respect of cash-generating units are allocated first to reduce the carrying amount of any goodwill allocated to the cash-generating unit (group of cash-generating units) and then to reduce the carrying amounts of the other assets in the cash-generating unit (groups of cash-generating units) on a pro rata basis.
41 40 2. Significant accounting policies (continued) (j) Impairment (continued) (ii) Other assets (continued) An impairment loss in respect of goodwill is not reversed. In respect of other assets, impairment losses recognised in prior periods are assessed at the end of each reporting period for any indications that the loss has decreased or no longer exists. An impairment loss is reversed if there has been a change in the estimates used to determine the recoverable amount since the last impairment loss was recognised. An impairment loss is reversed only to the extent that the asset s carrying amount does not exceed the carrying amount that would have been determined, net of depreciation or amortisation, if no impairment loss had been recognised. Reversals of impairment losses are credited to profit or loss in the financial year in which the reversals are recognised. (k) Equity instruments Instruments classified as equity are measured at cost on initial recognition and are not remeasured subsequently. (i) Issue expenses Costs directly attributable to the issue of instruments classified as equity are recognised as a deduction from equity. (ii) Ordinary shares Ordinary shares are classified as equity. (iii) Repurchase, disposal and reissue of share capital (treasury shares) When share capital recognised as equity is repurchased, the amount of the consideration paid, including directly attributable costs, net of any tax effects, is recognised as a deduction from equity. Repurchased shares that are not subsequently cancelled are classified as treasury shares in the statement of changes in equity. When treasury shares are sold or reissued subsequently, the difference between the sales consideration net of directly attributable costs and the carrying amount of the treasury shares is recognised in equity, and the resulting surplus or deficit on the transaction is presented in share capital.
42 41 2. Significant accounting policies (continued) (k) Equity instruments (continued) (iv) Distributions of assets to owners of the Company The Group measures a liability to distribute assets as a dividend to the owners of the Company at the fair value of the assets to be distributed. The carrying amount of the dividend is remeasured at each reporting period and at the settlement date, with any changes recognised directly in equity as adjustments to the amount of the distribution. On settlement of the transaction, the Group recognises the difference, if any, between the carrying amount of the assets distributed and the carrying amount of the liability in profit or loss. (l) Employee benefits (i) Short-term employee benefits Short-term employee benefit obligations in respect of salaries, annual bonuses, paid annual leave and sick leave are measured on an undiscounted basis and are expensed as the related service is provided. A liability is recognised for the amount expected to be paid under shortterm cash bonus or profit-sharing plans if the Group has a present legal or constructive obligation to pay this amount as a result of past service provided by the employee and the obligation can be estimated reliably. (ii) State plans The Group s contributions to statutory pension funds are charged to profit or loss in the financial year to which they relate. Prepaid contributions are recognised as an asset to the extent that a cash refund or a reduction in future payments is available. (m) Revenue and other income (i) Goods sold Revenue from the sale of goods in the course of ordinary activities is measured at fair value of the consideration received or receivable, net of returns and allowances, trade discounts and volume rebates. Revenue is recognised when persuasive evidence exists, usually in the form of an executed sales agreement, that the significant risks and rewards of ownership have been transferred to the customer, recovery of the consideration is probable, the associated costs and possible return of goods can be estimated reliably, and there is no continuing management involvement with the goods, and the amount of revenue can be measured reliably. If it is probable that discounts will be granted and the amount can be measured reliably, then the discount is recognised as a reduction of revenue as the sales are recognised.
43 42 2. Significant accounting policies (continued) (m) Revenue and other income (continued) (ii) Provision of services Management fee, agronomic fee and consultancy fee are recognised in profit or loss based on services rendered. (iii) Rental income Rental income from investment property is recognised in profit or loss on a straight-line basis over the term of the lease. Lease incentives granted are recognised as an integral part of the total rental income, over the term of the lease. Rental income from sub-leased property is recognised as other income. (iv) Dividend income Dividend income is recognised in profit or loss on the date that the Group s or the Company s right to receive payment is established, which in the case of quoted securities is the ex-dividend date. (v) Interest income Interest income is recognised in profit or loss as it accrues using the effective interest method in profit or loss except for interest income arising from temporary investment of borrowings taken specifically for the purpose of obtaining a qualifying asset which is accounted for in accordance with the accounting policy on borrowing costs. (n) Borrowing costs Borrowing costs that are not directly attributable to the acquisition, construction or production of a qualifying asset are recognised in profit or loss using the effective interest method. Borrowing costs directly attributable to the acquisition, construction or production of qualifying assets, which are assets that necessarily take a substantial period of time to get ready for their intended use or sale, are capitalised as part of the cost of those assets. The capitalisation of borrowing costs as part of the cost of a qualifying asset commences when expenditure for the asset is being incurred, borrowing costs are being incurred and activities that are necessary to prepare the asset for its intended use or sale are in progress. Capitalisation of borrowing costs is suspended or ceases when substantially all the activities necessary to prepare the qualifying asset for its intended use or sale are interrupted or completed.
44 43 2. Significant accounting policies (continued) (n) Borrowing costs (continued) Investment income earned on the temporary investment of specific borrowings pending their expenditure on qualifying assets is deducted from the borrowing costs eligible for capitalisation. (o) Income tax Income tax expense comprises current and deferred tax. Current tax and deferred tax are recognised in profit or loss except to the extent that it relates to a business combination or items recognised directly in equity or other comprehensive income. Current tax is the expected tax payable or receivable on the taxable income or loss for the year, using tax rates enacted or substantively enacted by the end of the reporting period, and any adjustment to tax payable in respect of previous financial years. Deferred tax is recognised using the liability method, providing for temporary differences between the carrying amounts of assets and liabilities in the statement of financial position and their tax bases. Deferred tax is not recognised for the temporary differences arising from the initial recognition of goodwill, the initial recognition of assets or liabilities in a transaction that is not a business combination and that affects neither accounting nor taxable profit or loss. Deferred tax is measured at the tax rates that are expected to be applied to the temporary differences when they reverse, based on the laws that have been enacted or substantively enacted by the end of the reporting period. The amount of deferred tax recognised is measured based on the expected manner of realisation or settlement of the carrying amount of the assets and liabilities, using tax rates enacted or substantively enacted at the reporting date. Deferred tax assets and liabilities are not discounted. Deferred tax assets and liabilities are offset if there is a legally enforceable right to offset current tax liabilities and assets, and they relate to income taxes levied by the same tax authority on the same taxable entity, or on different tax entities, but they intend to settle current tax liabilities and assets on a net basis or their tax assets and liabilities will be realised simultaneously. A deferred tax asset is recognised to the extent that it is probable that future taxable profits will be available against which the temporary differences can be utilised. Deferred tax assets are reviewed at the end of each reporting period and are reduced to the extent that it is no longer probable that the related tax benefit will be realised. Unutilised reinvestment allowance and investment tax allowance, being tax incentives that is not a tax base of an asset, is recognised as a deferred tax asset to the extent that it is probable that the future taxable profits will be available against which the unutilised tax incentive can be utilised.
45 44 2. Significant accounting policies (continued) (p) Contingent liabilities Where it is not probable that an outflow of economic benefits will be required, or the amount cannot be estimated reliably, the obligation is not recognised in the statements of financial position and is disclosed as a contingent liability, unless the probability of outflow of economic benefits is remote. Possible obligations, whose existence will only be confirmed by the occurrence or non-occurrence of one or more future events, are also disclosed as contingent liabilities unless the probability of outflow of economic benefits is remote. (q) Earnings per ordinary share The Group presents basic and diluted earnings per share data for its ordinary shares ( EPS ). Basic EPS is calculated by dividing the profit or loss attributable to ordinary shareholders of the Company by the weighted average number of ordinary shares outstanding during the period, adjusted for own shares held. Diluted EPS is determined by adjusting the profit or loss attributable to ordinary shareholders and the weighted average number of ordinary shares outstanding, adjusted for own shares held, for the effects of all dilutive potential ordinary shares, which comprise convertible notes and share options granted to employees. (r) Operating segments An operating segment is a component of the Group that engages in business activities from which it may earn revenues and incur expenses, including revenues and expenses that relate to transactions with any of the Group s other components. Operating segment results are reviewed regularly by the chief operating decision maker, which in this case is the Managing Director of the Group, to make decisions about resources to be allocated to the segment and to assess its performance, and for which discrete financial information is available. (s) Fair value measurements Fair value of an asset or a liability, except for share-based payment and lease transactions, is determined as the price that would be received to sell an asset or paid to transfer a liability in an orderly transaction between market participants at the measurement date. The measurement assumes that the transaction to sell the asset or transfer the liability takes place either in the principal market or in the absence of a principal market, in the most advantageous market.
46 45 2. Significant accounting policies (continued) (s) Fair value measurements (continued) For non-financial asset, the fair value measurement takes into account a market participant's ability to generate economic benefits by using the asset in its highest and best use or by selling it to another market participant that would use the asset in its highest and best use. When measuring the fair value of an asset or a liability, the Group uses observable market data as far as possible. Fair value are categorised into different levels in a fair value hierarchy based on the input used in the valuation technique as follows: Level 1: Level 2: Level 3: quoted prices (unadjusted) in active markets for identical assets or liabilities that the Group can access at the measurement date. inputs other than quoted prices included within Level 1 that are observable for the asset or liability, either directly or indirectly. unobservable inputs for the asset or liability. The Group recognises transfers between levels of fair value hierarchy as of the date of the event or change in circumstances that caused the transfers.
47 46 3. Property, plant and equipment Furniture, Infra- Assets Leasehold Commercial Other fittings and structure Plant and Motor under land buildings buildings equipment works machinery vehicles construction Total Group RM RM RM RM RM RM RM RM RM Cost At 1 January ,619,402 21,007,255 96,086,369 31,734, ,532,062 99,081,221 51,064,495 5,735, ,860,479 Additions 53,406, , ,929 14,601,893 1,004,083 2,761,044 25,240,660 98,017,408 Disposals ( 54) ( 54) Write-offs - - ( 15,465) ( 17,940) ( 20,000) ( 84,901) ( 600,797) - ( 739,103) Transfers - - 6,306,639 1,600 10,226,180 2,112, ,234 ( 19,299,497) 591 At 31 December 2016/ 1 January ,026,163 21,007, ,060,527 32,037, ,340, ,112,838 53,877,976 11,676, ,139,321 Additions , , , , ,736 15,893,601 17,717,344 Disposals ( 5,337) ( 269,364) - ( 274,701) Write-offs - - ( 109,109) ( 61,589) - ( 81,702) - - ( 252,400) Transfers 15,000-3,886, ,830 10,065, , ,492 ( 15,280,418) - At 31 December ,035,826 21,007, ,035,103 32,800, ,766, ,051,933 54,342,840 12,289, ,329,564 ============================================================================================== ==========
48 47 3. Property, plant and equipment (continued) Furniture, Infra- Assets Leasehold Commercial Other fittings and structure Plant and Motor under land buildings buildings equipment works machinery vehicles construction Total Group (continued) RM RM RM RM RM RM RM RM RM Depreciation and impairment loss At 1 January 2016 Accumulated depreciation Accumulated impairment loss 5,377,926 7,335,015 49,983,387 26,657, ,363,931 45,183,095 27,796, ,697,448 36, ,527, ,563,314 5,414,030 7,335,015 49,983,387 26,657, ,891,141 45,183,095 27,796, ,260,762 Depreciation for the financial year 967, ,221 4,387,961 1,486,004 11,178,752 4,739,327 4,174,918-27,489,385 Disposals ( 5) ( 5) Write-offs - - ( 14,078) ( 16,708) ( 7,731) ( 81,780) ( 594,723) - ( 715,020) Impairment loss , ,674 76,072 6, ,484 At 31 December 2016/ 1 January 2017 Accumulated depreciation Accumulated impairment loss 6,345,123 7,890,236 54,357,270 28,126, ,534,952 49,840,642 31,376, ,471,808 36,104-10, ,952,884 76,072 6,072-5,081,798 At 31 December ,381,227 7,890,236 54,367,927 28,126, ,487,836 49,916,714 31,383, ,553,
49 48 3. Property, plant and equipment (continued) Furniture, Infra- Assets Leasehold Commercial Other fittings and structure Plant and Motor under land buildings buildings equipment works machinery vehicles construction Total Group (continued) RM RM RM RM RM RM RM RM RM At 31 December ,381,227 7,890,236 54,367,927 28,126, ,487,836 49,916,714 31,383, ,553,606 Depreciation for the financial year 1,583, ,218 4,728,215 1,466,793 11,469,576 4,811,426 3,816,488-28,431,047 Disposals ( 952) ( 204,282) - ( 205,234) Write-offs - - ( 65,737) ( 61,589) - ( 36,399) - - ( 163,725) Impairment loss - - 4,690-3,412,292 2,043, ,063-5,621,780 At 31 December 2017 Accumulated depreciation 7,927,502 8,445,454 59,019,748 29,531, ,004,528 54,615,669 34,989, ,533,896 Accumulated impairment loss 36,104-15, ,365,176 2,119, ,135-10,703,578 7,963,606 8,445,454 59,035,095 29,531, ,369,704 56,735,476 35,156, ,237,474 =============================================================================================== ========== Carrying amounts At 31 December 2016/ 1 January ,644,936 13,117,019 48,692,600 3,911, ,852,299 52,196,124 22,494,951 11,676, ,585,715 =============================================================================================== ========== At 31 December ,072,220 12,561,801 48,000,008 3,268, ,396,819 46,316,457 19,186,546 12,289, ,092,090 =============================================================================================== ==========
50 49 3. Property, plant and equipment (continued) Company Furniture, fittings and equipment RM Cost At 1 January 2016/31 December 2016/1 January 2017/31 December ,784 ======== Depreciation At 1 January ,975 Depreciation for the financial year 294 At 31 December 2016/1 January ,269 Depreciation for the financial year 294 At 31 December ,563 ======== Carrying amounts At 31 December 2016/1 January ,515 ======== At 31 December ,221 ======== 3.1 Depreciation Depreciation charge for the financial year is allocated as follows: Group Note RM RM Amount charged to profit or loss 25,386,513 23,475,014 Amount capitalised in plantation development expenditure 4.1 3,044,534 4,014,371 28,431,047 27,489,385 ========= =========
51 50 3. Property, plant and equipment (continued) 3.2 Impairment loss Group Infrastructure works CGU 1 The Group recognised full impairment losses on infrastructure works amounted to RM4,952,884 in prior years. The allowance for impairment losses was made following disruption of its plantation activities by the local participants in a trust arrangement resulting in no harvesting activity being carried out since April In 2012, the Group through its subsidiary had initiated litigation against six (6) individuals, seeking injunctive, declaratory relief and claiming damages over the trespassing [see Note 34 (a)] CGU 2 & CGU CGU 4 During the current financial year, the Group assessed the recoverable amount of CGU 2 and CGU 3 due to continuing inability to harvest fresh fruit bunches from certain area of these estates on similar basis as disclosed in Note The Group has recognised an impairment loss of RM1,432,834 and RM883,896 (2016: RM Nil) for CGU 2 and CGU 3 respectively in the current financial year. The Group recognised full impairment loss on infrastructure works amounted to RM1,095,562 (2016: Nil) in current financial year. The allowance for impairment losses was made following continuing inability to harvest fresh fruit bunches from this estate Property, plant and equipment During the current financial year, the Group assessed the recoverable amount of the property, plant and equipment that are currently not in use, of which impairment loss of RM2,209,488 (2016: Nil) were recognised.
52 51 3. Property, plant and equipment (continued) 3.3 Security - Group Buildings, plant and machinery and leasehold land with carrying amounts of RM44,339,620 (2016: RM48,534,858) are charged to a bank for banking facilities granted to the Group (see Note 16). Assets under finance lease are charged to secure the finance lease liabilities of the Group (see Note 16). 3.4 At 31 December 2017, the net carrying amount of leased plant and equipment was RM6,725,357 (2016: RM8,059,651). 3.5 Additions of property, plant and equipment include interest capitalised of RM100,399 (2016: RM62,033) (see Note 23). 4. Plantation development expenditure - Group Plantation development expenditure consists of the following: Oil palm Teak tree Rubber tree plantation plantation plantation Total RM RM RM RM Cost At 1 January ,759,443 10,738,357 1,546, ,044,663 Additions 63,530, ,530,568 At 31 December 2016/ 1 January ,290,011 10,738,357 1,546, ,575,231 Additions 15,069, ,069,893 Disposals ( 1,275,915) - - ( 1,275,915) Expensed ( 191,036) - - ( 191,036) At 31 December ,892,953 10,738,357 1,546, ,178,173 ========= ========= ========= =========
53 52 4. Plantation development expenditure Group (continued) Depreciation and impairment loss At 1 January 2016 Accumulated depreciation Accumulated impairment loss Oil palm Teak tree Rubber tree plantation plantation plantation Total RM RM RM RM - - 1,104,900 1,104,900 10,926,291 10,738,357-21,664,648 10,926,291 10,738,357 1,104,900 22,769,548 Depreciation for the financial year , ,980 Impairment loss 5,842, ,842,608 At 31 December 2016/ 1 January 2017 Accumulated depreciation - - 1,325,880 1,325,880 Accumulated impairment loss 16,768,899 10,738,357-27,507,256 16,768,899 10,738,357 1,325,880 28,833,136 Depreciation for the financial year , ,980 Impairment loss 37,389, ,389,803 At 31 December 2017 Accumulated depreciation - - 1,546,860 1,546,860 Accumulated impairment loss 54,158,702 10,738,357-64,897,059 54,158,702 10,738,357 1,546,860 66,443,919 ========= ========= ========= ========= Carrying amounts At 31 December 2016/ 1 January ,521, , ,742,095 ========= ========= ========= ========= At 31 December ,734, ,734,254 ========= ========= ========= =========
54 53 4. Plantation development expenditure Group (continued) 4.1 Plantation development expenditure incurred during the financial year includes: RM RM Depreciation of property, plant and equipment (Note 3.1) 3,044,534 4,014,371 Term loan interest (Note 23) 534, ,940 Personnel expenses - Contributions to the Employee Provident Fund 327, ,983 - Wages, salaries and others 4,352,197 3,915,374 ======== ======== Included in plantation development expenditure is a carrying amount of RM16,661,348 (2016: RM17,068,785) located on certain leasehold land (see Note 16) charged to a bank for banking facilities granted to a subsidiary. 4.2 Impairment loss Plantation development expenditure is tested for impairment whenever events or changes in circumstances indicate that the carrying amount of the assets may no longer be recoverable. In preparing the financial statements, the Group has evaluated whether the assets are stated in excess of their net recoverable amounts. The net recoverable amounts are determined either by calculating the value in use of the assets via discounting the estimated cash flows from their continuing use to net present values or by estimating their fair values less costs of disposal, an exercise that entails a high degree of estimation uncertainty. An allowance for impairment loss is made if the net recoverable amounts of the assets are lower than their carrying amounts Oil palm plantation CGU 1 In earlier financial years, the Group had recognised full impairment losses of RM12,927,728 on its oil palm estate due to inability of the Group to harvest fresh fruit bunches from the estate.
55 54 4. Plantation development expenditure Group (continued) 4.2 Impairment loss (continued) Oil palm plantation (continued) CGU 2 & CGU 3 In the current financial year, due to the continuing inability to harvest fresh fruit bunches from certain areas of CGU 2 and CGU 3, the Group has performed impairment testing to assess the recoverable amount. The recoverable amounts of the estates are estimated based on their values in use, on the assumption that the Group can reclaim the estates and resume its harvesting activities in year The value in use calculation was based on the following key assumptions:- Projected future cash flows from the plantations are based on a single cycle of 25 years; Average selling price of fresh fruit bunches for past 10 years ( ) being used for the forecast and projection years; Average palm yields ranging from 6 to 20 (2016: 6 to 23) metric tonnes per hectare; A pre-tax discount rate of 12% (2016: 12%) per annum; and The Group is forecasting moderate increase in the cost of sales due to higher activity level of rehabilitation. The values assigned to the key assumptions represent management s assessment of current trends in the oil palm plantations in Sarawak and are based on both external and internal sources (historical data). Any subsequent changes in the market conditions or to decisions on the harvesting levels may have a material impact on the assets values as the future cash flows may differ from these estimates. Following the reassessment, the Group has estimated that the net recoverable amounts are lower than the carrying amounts as at 31 December 2017 and thus, an impairment loss of RM8,989,153 and RM14,545,877 from CGU 2 and CGU 3 respectively has been recognised as other non-operating expenses in the profit or loss (see Note 21).
56 55 4. Plantation development expenditure Group (continued) 4.2 Impairment loss (continued) Oil palm plantation (continued) CGU 4 In earlier financial years, the Group has recognised impairment losses of RM3,841,171 on the oil palm estate. The impairment losses were made following the inability of the Group to harvest fresh fruit bunches (see Note 3.2). In the current year, due to the continuing inability to harvest fresh fruit bunches from this estate, the Group has provided full impairment loss of RM13,854,773 for this estate Teak plantation In previous years, the Group had recognised a full impairment loss of RM10,738,357 on its teak tree plantation. 5. Investment in subsidiaries Company Note RM RM Unquoted shares, at cost 328,374, ,374,738 Deemed capital contribution 5.1 1,807,509 1,807,509 Less: Allowance for impairment losses 5.2 ( 3,129,765) ( 3,129,765) 327,052, ,052,482 ========= ========= 5.1 Deemed capital contribution Deemed capital contribution is related to fair value effect of the interest free advances to its subsidiaries recognised in the year ended 31 December 2010.
57 56 5. Investment in subsidiaries Company (continued) 5.2 Impairment losses In the previous years, the Company recognised impairment losses of RM3,129,765 based on the estimated recoverable amount of the investment in subsidiaries. The recoverable amount is estimated based on the fair value less costs of disposal with reference to the net tangible assets of the subsidiaries. During the year, the Company reassessed on similar bases and concluded no further impairment to the investment in subsidiaries. The principal activities of the subsidiaries, all of which are incorporated in Malaysia, and the Company s interests therein are as follows: Effective ownership interest and voting interest Subsidiary Principal activities % % Sarawak Plantation Cultivation of oil palm and Agriculture Development processing of fresh fruit Sdn. Bhd. ( SPAD ) bunches Sarawak Plantation Property Property investment Holding Sdn. Bhd. ( SPPH ) Sarawak Plantation Services Provision of Sdn. Bhd. ( SPSSB ) management, agronomic and consultancy services SPB Pelita Suai Sdn. Bhd.* ( SPBPS ) Cultivation of oil palm Azaria Sdn. Bhd.*^ Dormant Sarawak Plantation Property Development Sdn. Bhd. Dormant Telliana Oil Palm Sdn. Bhd. Cultivation of oil palm SPB PPES Karabungan Plantation Sdn. Bhd. Cultivation of oil palm * The financial statements of the subsidiaries are audited by a firm of Chartered Accountants other than KPMG PLT. ^ In the progress of winding up since financial year 2016.
58 57 5. Investment in subsidiaries Company (continued) Non-controlling interests in subsidiaries The Group s subsidiaries that have material non-controlling interests ( NCI ) are as follows: Other subsidiaries SPB Pelita with Suai immaterial Sdn. Bhd. NCI Total 2017 RM RM RM NCI percentage of ownership interest and voting interest 40% Carrying amount of NCI ( 9,671,655) ( 430,454) (10,102,109) ======== ======== ======== Loss allocated to NCI ( 92,808) ( 164,483) ( 257,291) ======== ======== ======== Summarised financial information before intra-group elimination As at 31 December Current assets 56,944 Current liabilities (23,953,588) Net liabilities (23,896,644) ======== Year ended 31 December Loss for the financial year ( 232,019) Total comprehensive loss ( 232,019) ======== Cash flows from operating activities 9,737 Net increase in cash and cash equivalents 9,737 ========
59 58 5. Investment in subsidiaries Company (continued) Non-controlling interests in subsidiaries (continued) Other subsidiaries SPB Pelita with Suai immaterial Sdn. Bhd. NCI Total 2016 RM RM RM NCI percentage of ownership interest and voting interest 40% Carrying amount of NCI ( 9,578,847) ( 265,971) ( 9,844,818) ======== ======== ======== Loss allocated to NCI ( 2,894,682) 14,129 ( 2,880,553) ======== ======== ======== Summarised financial information before intra-group elimination As at 31 December Current assets 47,342 Current liabilities (23,711,968) Net liabilities (23,664,626) ======== Year ended 31 December Loss for the financial year ( 7,236,705) Total comprehensive loss ( 7,236,705) ======== Cash flows from operating activities ( 9,413) Net decrease in cash and cash equivalents ( 9,413) ========
60 59 6. Investment in associate Group RM RM Unquoted shares, at cost 205, ,000 Share of post-acquisition losses ( 205,000) ( 205,000) - - ======= ======= The Group s share of losses of the associate is restricted to the cost of its investment therein. The principal activities of the associate, which is incorporated in Malaysia, and the Group s interest therein are as follows: Effective ownership interest and voting interest Name of entity Principal activity % % Wonderland Transport Services Sdn. Bhd.* Dormant * Held through a subsidiary, Sarawak Plantation Services Sdn. Bhd. The associate had ceased its operations in previous years and had not made available its management accounts or financial statements to the Group. Hence, the financial information on the associate is not presented. 7. Investment properties Group Buildings RM Cost At 1 January 2016/31 December 2016/ 1 January 2017 and 31 December ,313,388 ========
61 60 7. Investment properties Group (continued) Buildings RM Depreciation At 1 January ,525,637 Depreciation for the financial year 166,280 At 31 December 2016/1 January ,691,917 Depreciation for the financial year 166,280 At 31 December ,858,197 ======== Carrying amounts At 31 December 2016/1 January ,621,471 ======== At 31 December ,455,191 ======== Estimated fair value At 31 December 2016/1 January ,694,000 ======== At 31 December ,152,207 ======== The following are recognised in profit or loss in respect of investment properties: RM RM Rental income 489, ,195 Direct operating expenses: - income generating investment properties ( 195,178) ( 230,994) - non-income generating investment properties ( 49,364) ( 49,364) ======= ======= Determination of fair value The estimated fair value of investment properties was based on the valuation performed on 2 November 2017 and 19 January 2018 by an independent valuer. Policy on transfer between levels The fair value of an asset to be transferred between levels is determined as of the date of the event or change in circumstances that caused the transfer.
62 61 7. Investment properties Group (continued) Determination of fair value (continued) Level 1 fair value Level 1 fair value is derived from quoted price (unadjusted) in active markets for identical investment properties that the Group can access at the measurement date. Level 2 fair value Level 2 fair value is estimated using inputs other than quoted prices included within Level 1 that are observable for the investment properties, either directly or indirectly. Transfers between Level 1 and Level 2 fair values There has been no transfer between Level 1 and 2 fair values during the financial year (2016: no transfer in either directions). Level 3 fair value Level 3 fair value is estimated using unobservable inputs for the investment properties. Fair value of investment properties are categorised as follows: 2017 Level 1 Level 2 Level 3 Total RM RM RM RM Investment properties ,152,207 16,152,207 ========= ========= ========= ========= 2016 Level 1 Level 2 Level 3 Total RM RM RM RM Investment properties ,694,000 13,694,000 ========= ========= ========= ========= Valuation processes applied by the Group for Level 3 fair value The fair value of investment properties is determined by external, independent property valuers, having appropriate recognised professional qualifications and recent experience in the location and category of property being valued. The values derived are based on the comparative method. The comparative method entails comparing the property with similar properties that were sold recently and those that are currently being offered for sale in the vicinity. Diligent adjustment are then made for location, size and shape of land, age, size, design, type and condition of building, improvements, availability of facilities and amenities, time element and other relevant factors to equalise the differences so as to arrive at an acceptable degree of comparability with the subject property.
63 62 8. Inventories - Group RM RM At costs Crude palm oil and palm kernel 5,151,700 5,268,014 Stores and consumables 7,541,154 8,841,873 Oil palm nursery 2,844,215 2,594,605 Oil palm seeds 826,729 1,325,336 Oil palm fresh fruit bunches 611,632 62,431 16,975,430 18,092,259 ========= ========= Recognised in profit or loss: Inventories recognised as part of cost of sales 298,020, ,426,901 Inventories written off 115, ,782 Inventories written down 365,987 - ========= ========= Oil palm nursery and oil palm seeds incurred during the financial year include: RM RM Personnel expenses - Contributions to the Employees Provident Fund 119,263 84,440 - Wages, salaries and others 1,582,856 1,078,018 ========= =========
64 63 9. Trade and other receivables Group Company Note RM RM RM RM Non-current Non-trade Amount due from subsidiaries ,666,020 5,663,133 Less: Allowance for impairment losses - - ( 5,666,020) ( 5,663,133) Non-current total Current Trade Trade receivables Less: Allowance for impairment losses 21,838,777 24,020, ( 80,914) ,757,863 24,020, Non-trade Other receivables Less: Allowance for impairment losses 734, , , ,766 ( 100,720) ( 100,720) , , , ,766 Amount due from subsidiaries ,340,145 1,612, , ,200 3,566,642 1,814, Current total 22,391,880 24,699,334 3,566,642 1,814,216 Total 22,391,880 24,699,334 3,566,642 1,814,216 ======== ======== ======== ======== 9.1 Amount due from subsidiaries is unsecured and bears interest ranging from 4.60% to 7.65% (2016: 4.60% %) per annum.
65 Prepayments and other assets Group Company Note RM RM RM RM Non-trade Deposits 10.1 Less: Allowance for impairment losses 3,379,451 3,180, ( 1,874,000) ( 1,862,000) - - 1,505,451 1,318, Prepayments 10.2 Less: Allowance for 2,897,662 3,154, ,337 impairment losses ( 74,384) ,823,278 3,154, ,337 Club membership 118, , , ,840 2,942,108 3,274, , , ,447,559 4,592, , ,177 ======== ======== ======== ======== 10.1 Impairment losses - Group A full impairment loss of RM1,862,000 was made in earlier years following the local participants in a trust arrangement entering into an oil palm plantation of a subsidiary and disrupting its plantation activities, resulting in no harvesting activities being carried out since April 2010 (see Note 3.2) Prepayments - Group Included in prepayments is a prepayment of RM2,077,614 (2016: RM2,077,614) paid for an acquisition of land. 11. Other investments - Group RM RM Financial assets at fair value through profit or loss: - Unit trust 529, ,605 - Portfolio investments 1,384,934 1,312,425 1,914,493 1,802,030 Deposits with original maturities exceeding three months 7,763,573 7,663,451 9,678,066 9,465,481 ========= ========= The portfolio investments are managed by a fund management company.
66 Cash and cash equivalents Group Company RM RM RM RM Cash in hand and at banks 635, ,894 75,651 9,209 Deposits with original maturities not exceeding three months 103,763,990 99,580,003 74,363,589 72,857, ,399, ,396,897 74,439,240 72,866,496 ========= ========= ========= ========= 13. Assets held for sale - Group The assets classified as held for sale comprise the following: RM RM Buildings 1,295,076 1,295,076 Furniture, fittings and equipment 146, ,668 1,441,744 1,441,744 Less: Accumulated depreciation ( 492,684) ( 492,684) 949, ,060 ======== ======== These assets had been classified as assets held for sale as efforts to sell them had commenced. The planned disposal of the buildings and furniture, fittings and equipment was approved by the Directors at the Board of Directors Meeting held on 18 November The sale of building at the consideration of RM995,000 (2016: RM995,000) is pending fulfilment of conditions precedent stipulated in the sale and purchase agreement.
67 Capital and reserves Group and Company 14.1 Share capital Ordinary shares Amount Number of Amount Number of RM shares RM shares Issued and fully paid: Opening balance 280,000, ,000, ,000, ,000,000 Transfer from share premium in accordance with Section 618(2) of the Companies Act 2016 (Note 1) 60,968, ,968, ,000, ,000, ,000,000 ========= ========= ========= ========= (Note 2) Note 1: In accordance with Section 618 of Companies Act 2016, any amount standing to the credit of the share premium account has become part of the Company s share capital. The Company has twenty-four months upon the commencement of Companies Act 2016 on 31 January 2017 to utilise the credit. Note 2: Included in share capital is share premium amounting to RM60,968,951 that is available to be utilised in accordance with Section 618(3) of Companies Act 2016 on or before 30 January 2019 (24 months from commencement of Section 74). The new Companies Act 2016, which came into operation on 31 January 2017, abolished the concept of authorised share capital and par value of share capital. There is no impact on the number of ordinary shares in issue or the relative entitlement of any of the members as a result of the transition.
68 Capital and reserves Group and Company (continued) 14.1 Share capital (continued) Ordinary shares (continued) The holders of ordinary shares are entitled to receive dividends as declared from time to time, and are entitled to one vote per share at meetings of the Company Share premium This represents the premium arose from the issuance of ordinary shares in satisfaction of the purchase consideration for subsidiaries acquired in 1999 and the subsequent public issue, less capitalisation for bonus issue, effected in conjunction with the listing of the Company on the Main Market of Bursa Malaysia Securities Berhad in Equity reserve Equity reserve represents the capital contribution by certain shareholders of the Company, in respect of shares granted to employees of a subsidiary, Sarawak Plantation Agriculture Development Sdn. Bhd., in conjunction with the listing of the Company on the Main Market of Bursa Malaysia Securities Berhad in This entailed the sale of 135,000 ordinary shares in the Company by corporate shareholders, to eligible employees of the subsidiary, on a basis proportionate to their then existing shareholdings in the Company Treasury shares The shareholders of the Company, at an Annual General Meeting held on 18 June 2008, approved the Company s plan to repurchase its own shares. Such authority was last renewed at the Annual General Meeting held on 18 May The Directors of the Company are committed to enhance the value of the Company to its shareholders and believe that the repurchase plan can be applied in the best interests of the Company and its shareholders. The Company did not repurchase its own shares during the financial years ended 31 December 2017 and 31 December The number of treasury shares held was 436,100 ordinary shares as at 31 December 2017 and 31 December 2016.
69 Deferred tax liabilities - Group Movements in temporary differences during the financial year are as follows: Recognised At Recognised At in profit / in profit At or loss or loss RM RM RM RM RM Property, plant and equipment 54,749,480 ( 1,150,375) 53,599,105 ( 2,054,105) 51,545,000 Others ( 106,070) ( 53,035) ( 159,105) ( 52,895) ( 212,000) 54,643,410 ( 1,203,410) 53,440,000 ( 2,107,000) 51,333,000 ========= ======== ======== ======== ========= (Note 24) (Note 24) Unrecognised deferred tax assets - Group Deferred tax assets have not been recognised in respect of the following temporary differences (stated at gross): RM RM Capital and agriculture allowances carried forward 11,105,000 7,831,000 Unutilised tax losses carried forward 10,568,000 9,754,000 21,673,000 17,585,000 ======== ======== Deferred tax assets of RM5,200,000 (2016: RM4,220,000) have not been recognised in the statement of financial position in respect of the temporary differences because it is not probable that future taxable profits will be available against which the affected group entities can utilise the benefits. Unabsorbed capital and agriculture allowances and unutilised tax losses attributable to group entities incorporated in Malaysia do not expire under the current tax legislation except that in the case of a dormant company, such allowances and losses will not be available to the affected group entities if there is a substantial change of 50% or more in the shareholdings thereof.
70 Loans and borrowings - Group Note RM RM Non-current Islamic term loan - secured 109,875,211 88,115,211 Finance lease liabilities (Islamic) - secured ,352 1,827, ,291,563 89,942, Current Revolving credit - secured 26,000,000 39,000,000 Revolving credit (Islamic) - secured 2,000,000 2,000,000 Finance lease liabilities (Islamic) - secured ,577,184 1,925,410 29,577,184 42,925, ,868, ,867,950 ========= ========= One of the subsidiaries has been granted banking facilities comprising one (2016: one) term loan facility of RM150 million (2016: RM150 million) and two revolving credit facilities of RM50 million and RM30 million respectively (2016: RM50 million and RM30 million). The subsidiary shall maintain a gearing measured by total group financings over total group shareholders funds of not more than 1.00 time. The Islamic term loan and revolving credit facilities of RM150 million and RM30 million respectively are Islamic facilities under Bai Inah contract Security The Islamic term loan, the revolving credit (Islamic) and the revolving credit are secured by way of legal charges over certain land and buildings of a subsidiary (see Note 3) and a corporate guarantee from the Company. Assets under finance lease are charged to secure the finance lease liabilities (Islamic) of the Group (see Note 3).
71 Loans and borrowings Group (continued) 16.2 Interest and profit rates The Islamic term loan of RM109,875,211 (2016: RM88,115,211) bears profit rate of 12.00% (2016: 12.00%) per annum, which is equivalent to effective profit rate of 0.75% (2016: 0.75%) per annum above the Bank s i-cost of funds. The Islamic revolving credit (Islamic) bears profit rate of 12.00% (2016: 12.00%) per annum, which is equivalent to effective profit rate of 0.60% (2016: 0.60%) per annum above the Bank s i-cost of funds. The effective interest rate of revolving credit ranges from 4.64% to 4.96% (2016: 4.61% %) per annum. Finance lease liabilities (Islamic) carry profit rates fixed at 4.65% % (2016: 4.49% %) per annum Finance lease liabilities (Islamic) Finance lease liabilities (Islamic) are payable as follows: Present Future value of minimum minimum lease lease payments Profit payments RM RM RM 2017 Less than one year 1,636,848 59,664 1,577,184 Between one and five years 428,812 12, ,352 2,065,660 72,124 1,993,536 ======== ======== ======== 2016 Less than one year 2,071, ,237 1,925,410 Between one and five years 1,879,126 51,797 1,827,329 3,950, ,034 3,752,739 ======== ======== ========
72 Trade and other payables Group Company Note RM RM RM RM Current Trade Trade payables 20,592,497 23,336, Non-trade Amount due to subsidiaries , ,451 Accrued expenses 17,917,990 25,180,106 1,291,863 2,039,990 Other payables ,800,651 37,659,404 9,004,628 9,037,644 GST payable 408, , ,127,624 63,653,538 10,596,570 11,278, Total 55,720,121 86,990,536 10,596,570 11,278,085 ========= ========= ======== ======== 17.1 Amount due to subsidiaries Amount due to subsidiaries is unsecured and bears interest at 7.65% (2016: 7.65% %) per annum Other payables Included in other payables of the Group are: (a) (b) (c) an amount of RM61,359 (2016: RM1,748,761) due to companies in which a Director has interests as well as with common directorships; an amount of RM1,364,424 (2016: RM1,085,743) being construction retention sums mainly for the construction of buildings, infrastructures and plant and machinery; and an amount of RM8,956,130 (2016: RM8,956,130) being the balance purchase consideration for acquisition of equity interest in a subsidiary.
73 Revenue Group Company RM RM RM RM Dividend income from subsidiaries - - 5,000,000 20,867,500 Sale of oil palm products 398,196, ,747, Management/ Agronomic service income 490, , Rental from letting of investment properties 489, , ,176, ,966,858 5,000,000 20,867,500 ========= ========= ======== ======== 19. Results from operating activities Results from operating activities is arrived at after charging: Group Company RM RM RM RM Auditors remuneration: - Statutory audit - KPMG PLT 215, ,000 55,000 50,000 - Other auditors 5,850 5, Other services - KPMG PLT 35,000 43,500 35,000 43,500 - Local affiliates of KPMG PLT 113, ,100 12,010 12,370 Personnel expenses (including key management personnel): - Contributions to the Employees Provident Fund 4,177,845 4,246, , ,675 - Wages, salaries and others 52,620,854 50,909,581 2,039,769 1,966,018 Change in fair value of other investments - 87, Property, plant and equipment written off 88,675 24, ======== ======== ======== ========
74 Results from operating activities (continued) and after crediting: Group Company RM RM RM RM Change in fair value of other investments 26, Gain on disposal of property, plant and equipment 18, ======== ======== ======== ======== Included in the personnel expenses of the Company disclosed above are salary costs (including compensations to key management personnel) recharged by a subsidiary. 20. Other non-operating income - Group Included in other non-operating income of the Group for the financial year ended 31 December 2016 was a reversal of impairment losses on deposits paid amounting to RM3,700, Other non-operating expenses Group Included in other operating expenses of the Group are as below: RM RM Impairment losses on: - plantation development expenditure 37,389,803 5,842,608 - property, plant and equipment 5,621, ,484 - prepayments and other assets - 709,068 Loss on surrender of: - land to government authorities 4, plantation development expenditure to government authorities 392,047-43,408,015 7,070,160 ======== ========
75 Finance income Group Company RM RM RM RM Interest income of financial assets that are not at fair value through profit or loss: - receivables 2,073 3, , ,674 - deposits with banks/ financial institutions 3,374,271 3,289,695 2,364,424 2,088,686 Interest income from other investments 17,383 16, Recognised in profit or loss 3,393,727 3,309,112 2,588,152 2,687,360 ======== ======== ======== ======== 23. Finance costs Group Company RM RM RM RM Interest expense/profit payments of financial liabilities that are not at fair value through profit or loss: - loans and borrowings 7,086,796 4,089, payables - 400,861 14,748 5,479 7,086,796 4,490,780 14,748 5,479 ======== ======== ======== ======== Amount charged to profit or loss 6,088,137 3,631,813 14,748 5,479 Amount charged to profit or loss under replanting expenses 363, , Amount capitalised in property, plant and equipment (Note 3.5) 100,399 62, Amount capitalised in plantation development expenditure (Note 4.1) 534, , ,086,796 4,490,780 14,748 5,479 ======== ======== ======== ========.
76 Taxation Recognised in profit or loss Group Company RM RM RM RM Current tax expense Malaysian - current year 11,500,000 7,746, , ,000 - prior year ( 429,325) ( 144,940) 9,870 34,834 11,070,675 7,601, , , Deferred tax income (Note 15) Origination and reversal of temporary differences - current year ( 2,107,000) ( 1,203,410) Total taxation 8,963,675 6,397, , ,834 ======== ======== ======== ======== Reconciliation of taxation (Loss)/Profit for the financial year (10,509,980) 19,330,513 4,174,260 17,478,551 Total taxation 8,963,675 6,397, , ,834 (Loss)/Profit excluding tax ( 1,546,305) 25,728,163 4,504,130 17,984,385 ======== ======== ======== ======== Income tax calculated using Malaysian tax rate of 24% (2016: 24%) ( 371,000) 6,175,000 1,081,000 4,316,000 Non-deductible expenses 13,916,000 4,203, ,000 1,248,000 Movements in unrecognised deferred tax assets 88, , Utilisation of agriculture allowances and capital allowances ( 2,617,000) ( 2,435,000) - - Tax exempt income ( 525,000) ( 1,513,410) ( 1,325,000) ( 5,093,000) Effect of lower tax rate* ( 1,098,000) ,393,000 6,542, , ,000 (Over)/Under provision in prior year ( 429,325) ( 144,940) 9,870 34,834 Total taxation 8,963,675 6,397, , ,834 ======== ======== ======== ========
77 Taxation (continued) * Pursuant to Income Tax (Exemption) (No. 2) Order 2017, a tax exemption equivalent to a reduction in the prevailing corporate tax rate from 1% to 4% will be effectively given for year of assessment 2017 and 2018 based on incremental chargeable business income. 25. Compensations to key management personnel Compensations to key management personnel are as follows: Group Company RM RM RM RM Directors: - Fees 1,408,815 1,405,815 1,171,815 1,171,815 - Short term employee benefits (including estimated benefits-in-kind) 958, , , ,075 - Post employment benefits 147, ,397 22,101 31,566 2,515,316 2,347,782 1,385,314 1,397, Other key management personnel: - Short term employee benefits (including estimated benefitsin-kind) 1,508,892 1,840, , ,964 - Post employment benefits 251, ,532 44,584 49,390 1,760,360 2,125, , , ,275,676 4,473,628 1,695,004 1,768,810 ======== ======== ======== ======== Other key management personnel comprise persons, other than the Directors of the Group entities, having authority and responsibility for planning, directing and controlling the activities of the Group entities either directly or indirectly.
78 (Loss)/Earnings per ordinary share Group Basic and diluted (loss)/earnings per ordinary share The calculation of basic and diluted (loss)/earnings per ordinary share at 31 December 2017 and 31 December 2016 was based on the (loss)/earnings attributable to ordinary shareholders and the weighted average number of ordinary shares outstanding calculated as follows RM RM (Loss)/Earnings attributable to ordinary shareholders ( 10,252,689) 22,211,066 ========= ========= Weighted average number of ordinary shares Issued ordinary shares at 1 January/31 December 280,000, ,000,000 Effect of issued ordinary shares repurchased ( 436,100) ( 436,100) Weighted average number of ordinary shares at 31 December 279,563, ,563,900 ========= ========= The shareholders of the Company, at an Annual General Meeting held on 18 June 2008, approved the Company s plan to repurchase its own shares. Such authority was last renewed at the Annual General Meeting held on 18 May The Directors of the Company are committed to enhance the value of the Company to its shareholders and believe that the repurchase plan can be applied in the best interests of the Company and its shareholders. The Company did not repurchase its own shares during the years ended 31 December 2017 and 31 December The number of treasury shares held was 436,100 ordinary shares as at 31 December 2017 and 31 December Basic and diluted (loss)/earnings per ordinary share Sen Sen Basic and diluted (loss)/earnings per ordinary share ( 3.66) 7.94 ======== ========
79 Dividends Dividends recognised in prior financial year by the Company were: Sen per share Total Date of 2016 (tax exempt) RM payment First interim 2015 ordinary ,580, March 2016 ======== The Directors do not recommend any final dividend to be paid for the financial year ended 31 December Financial instruments 28.1 Categories of financial instruments The table below provides an analysis of financial instruments categorised as follows: (a) (b) (c) Loans and receivables ( L&R ); Financial liabilities measured at amortised cost ( FL ); and Fair value through profit or loss ( FVTPL ). Carrying L&R/ amount (FL) FVTPL Note RM RM RM 2017 Financial assets/(liabilities) Group Trade and other receivables 9 22,391,880 22,391,880 - Deposits 10 1,505,451 1,505,451 - Other investments 11 9,678,066 7,763,573 1,914,493 Cash and cash equivalents ,399, ,399,731 - Loans and borrowings 16 (139,868,747) (139,868,747) - Trade and other payables* 17 ( 55,311,138) ( 55,311,138) - ========= ========= =========
80 Financial instruments (continued) 28.1 Categories of financial instruments (continued) Carrying L&R/ amount (FL) FVTPL Note RM RM RM 2017 Financial assets/(liabilities) Company Trade and other receivables 9 3,566,642 3,566,642 - Cash and cash equivalents 12 74,439,240 74,439,240 - Trade and other payables 17 ( 10,596,570) ( 10,596,570) - ========= ========= ========= 2016 Financial assets/(liabilities) Group Trade and other receivables 9 24,699,334 24,699,334 - Deposits 10 1,318,615 1,318,615 - Other investments 11 9,465,481 7,663,451 1,802,030 Cash and cash equivalents ,396, ,396,897 - Loans and borrowings 16 (132,867,950) (132,867,950) - Trade and other payables* 17 ( 86,176,508) ( 86,176,508) - ========= ========= ========= Financial assets/(liabilities) Company Trade and other receivables 9 1,814,216 1,814,216 - Cash and cash equivalents 12 72,866,496 72,866,496 - Trade and other payables 17 ( 11,278,085) ( 11,278,085) - ========= ========= ========= * Excluding amount payable to Royal Malaysian Customs Department.
81 Financial instruments (continued) 28.2 Net (losses)/gains arising from financial instruments Group Company RM RM RM RM Net (losses)/gains on: Loans and receivables - impairment losses on trade and other receivables - interest income from receivables - interest income from term deposits - impairment losses on deposits - reversal of impairment losses on deposits Fair value through profit or loss - gain on disposal of other investments - change in fair value of other investments - dividend income - interest income ( 80,914) ( 27,219) ( 2,887) ( 957,136) 2,073 3, , ,674 3,374,271 3,289,695 2,364,424 2,088,686 ( 12,000) ( 709,068) ,700, ,283,430 6,256,542 2,585,265 1,730, ,696 50, ,393 ( 87,713) ,891 46, ,383 16, ,363 25,
82 Financial instruments (continued) 28.2 Net (losses)/gains arising from financial instruments (continued) Financial liabilities measured at amortised cost - interest expense on term loan - interest expense on revolving credits - payables Group Company RM RM RM RM ( 4,127,853) ( 882,884) - - ( 1,817,450) ( 2,122,545) ( 400,861) ( 14,748) ( 5,479) ( 5,945,303) ( 3,406,290) ( 14,748) ( 5,479) Profit payments on finance lease liabilities ( 142,834) ( 225,523) - - ( 6,088,137) ( 3,631,813) ( 14,748) ( 5,479) ( 2,653,344) 2,650,656 2,570,517 1,724,745 ======== ======== ======== ======== 28.3 Financial risk management The Group is exposed to the following risks from its use of financial instruments: Credit risk Liquidity risk Market risk 28.4 Credit risk Credit risk is the risk of a financial loss to the Group if a customer or counterparty to a financial instrument fails to meet its contractual obligations. The Group s exposure to credit risk arises principally from its receivables from customers, its deposits with banks and investment in liquid securities. The Company s exposure to credit risk arises principally from loans and advances to subsidiaries and financial guarantees given to banks for credit facilities granted to subsidiaries.
83 Financial instruments (continued) 28.4 Credit risk (continued) Receivables from third parties Risk management objectives, policies and processes for managing the risk Management regularly reviews and monitors on an on-going basis by setting appropriate credit limits on trade receivables on a case-by-case basis. Exposure to credit risk, credit quality and collateral The maximum exposure to credit risk is represented by the carrying amounts of the receivables in the statement of financial position. The credit risk is concentrated to one (2016: four) major customers, who are mainly involved in palm oil refinery as disclosed in Note 33, representing 91% (2016: 90%) of the total trade receivables. Deposits are only placed with licensed financial institutions. Impairment losses The ageing of trade receivables as at the end of the reporting period was: Individual Gross impairment Net Group RM RM RM 2017 Not past due 21,492,406-21,492,406 Past due days 251, ,776 Past due more than 365 days 94,595 ( 80,914) 13,681 21,838,777 ( 80,914) 21,757,863 ======== ======== ======== 2016 Not past due 22,816,004-22,816,004 Past due days 1,109,878-1,109,878 Past due more than 365 days 94,252-94,252 24,020,134-24,020,134 ======== ======== ========
84 Financial instruments (continued) 28.4 Credit risk (continued) The movements in the allowance for impairment losses on trade receivables during the financial year are: Group RM RM Opening balance - - Allowance for impairment losses 80,914 - Closing balance 80,914 - ======= ======= An allowance account in respect of receivables is used to record impairment losses. Unless the Group is satisfied that recovery is possible, the amount considered irrecoverable is written off against the receivables directly. Other investments Risk management objectives, policies and processes for managing the risk Investments are allowed only in liquid securities and only with counterparties that have a credit rating equal to or better than the Group. Exposure to credit risk, credit quality and collateral As at the end of the reporting period, the Group has only invested in domestic securities. The maximum exposure to credit risk is represented by the carrying amounts of the securities in the statement of financial position. Other investments of the Group (see Note 11) are categorised as financial assets fair value through profit or loss. The Group does not have overdue investments that have not been impaired. The investments are unsecured. Intercompany balances Risk management objectives, policies and processes for managing the risk The Company provides unsecured loans and advances to subsidiaries and monitors the results of the subsidiaries regularly.
85 Financial instruments (continued) 28.4 Credit risk (continued) Intercompany balances (continued) Exposure to credit risk, credit quality and collateral As at the end of the reporting period, the maximum exposure to credit risk is represented by their carrying amounts in the statement of financial position. There are no significant concentrations of credit risk as at the end of the reporting period other than the amount due from one (2016: one) subsidiary of RM3,318,312 (2016: RM1,588,678). Impairment losses As at the end of the reporting period, there was no indication that the loans and advances to subsidiaries are not recoverable, other than those on which an allowance for impairment losses has been made (see Note 9). The Company does not specifically monitor the ageing of loans and advances to subsidiaries and unless the Company is satisfied that recovery is possible, the amount considered irrecoverable will be written off against the receivable directly. Financial guarantees Risk management objectives, policies and processes for managing the risk The Company provides unsecured financial guarantees to banks in respect of banking facilities granted to a subsidiary. The Company monitors on an ongoing basis the results of the subsidiary and repayments made by the subsidiary. Exposure to credit risk, credit quality and collateral The maximum exposure to credit risk amounts to RM137,875,211 (2016: RM129,115,211) representing the outstanding banking facilities of a subsidiary as at the end of the reporting period. As at the end of the reporting period, there was no indication that the subsidiary would default on repayment. The financial guarantees have not been recognised since the fair value on initial recognition was not material.
86 Financial instruments (continued) 28.5 Liquidity risk Liquidity risk is the risk that the Group will not be able to meet its financial obligations as they fall due. The Group s exposure to liquidity risk arises principally from its various payables, loans and borrowings. Risk management objectives, policies and processes for managing the risk The Group maintains a level of cash and cash equivalents and bank facilities deemed adequate by the management to ensure, as far as possible, that it will have sufficient liquidity to meet its liabilities when they fall due. It is not expected that the cash flows included in the maturity analysis could occur significantly earlier, or at significantly different amounts.
87 Financial instruments (continued) 28.5 Liquidity risk (continued) Maturity analysis The table below summarises the maturity profile of the Group s and the Company s financial liabilities as at the end of the reporting period based on undiscounted contractual payments: Contractual Carrying interest rate/ Contractual Under More than amount profit rate cash flows 1 year years years 5 years Group RM % RM RM RM RM RM 2017 Non-derivative financial liabilities Islamic term loan - secured 109,875, ,336,009-25,192,800 90,143,209 - Revolving credit secured 26,000, ,289,600 27,289, Revolving credit (Islamic) secured 2,000, ,095,800 2,095, Finance lease liabilities secured 1,993, ,065,660 1,636, , Trade and other payables 55,311,138-55,311,138 55,311, ,179, ,098,207 86,333,386 25,621,612 90,143,209 - ========= ========= ========= ========= ========= ========= Company 2017 Non-derivative financial liabilities Other payables 10,596,570-10,596,570 10,596, Corporate guarantees ,000, ,000, ========= ========= ========= ========= ========= =========
88 Financial instruments (continued) 28.5 Liquidity risk (continued) Maturity analysis (continued) Contractual Carrying interest rate/ Contractual Under More than amount profit rate cash flows 1 year years years 5 years Group RM % RM RM RM RM RM 2016 Non-derivative financial liabilities Islamic term loan - secured 88,115, ,379, ,379,988 - Revolving credit secured 39,000, ,805,700 40,805, Revolving credit (Islamic) secured 2,000, ,088,800 2,088, Finance lease liabilities secured 3,752, ,950,773 2,071,647 1,879, Trade and other payables 86,176,508-86,176,508 86,176, ,044, ,401, ,142,655 1,879,126 92,379,988 - ========= ========= ========= ========= ========= ========= Company 2016 Non-derivative financial liabilities Other payables 11,278,085-11,278,085 11,278, Corporate guarantees ,000, ,000, ========= ========= ========= ========= ========= =========
89 Financial instruments (continued) 28.6 Market risk Market risk is the risk that changes in market prices, such as foreign exchange rates, interest rates and other prices that will affect the Group s financial position or cash flows Currency risk The Group and Company are not exposed to any foreign currency risk as it operates domestically and most of its transactions are denominated in Ringgit Malaysia Interest and profit rates risk The primary interest and profit rates risk to which the Group is exposed relates to the deposits which are fixed rate instruments placed with approved financial institutions. The exposure to a risk of change in their fair value due to changes in interest rates would not be significant as the deposits are usually placed for less than three months. The Group s variable rate borrowings are exposed to a risk of change in cash flows due to changes in interest/profit rates. Short term receivables and payables are not significantly exposed to interest rate risk. Risk management objectives, policies and processes for managing the risk The Group monitors its exposure to changes in interest and profit rates on a regular basis. Borrowings are negotiated with a view to securing the best possible terms, including rates of interest/profit, to the Group.
90 Financial instruments (continued) 28.6 Market risk (continued) Interest and profit rates risk (continued) Exposure to interest and profit rates risk The interest and profit rates profile of the Group s and the Company s significant interest-bearing financial instruments, based on their carrying amounts as at the end of the reporting period is: Group Company RM RM RM RM Fixed rate instruments Deposits with banks/ financial institutions 111,527, ,243,454 74,363,589 72,857,287 Amount due from subsidiaries - - 3,040,066 1,411,999 Finance lease liabilities ( 1,993,536) ( 3,752,739) ,534, ,490,715 77,403,655 74,269,286 ========= ========= ========= ========= Floating rate instruments Term loan (109,875,211) ( 88,115,211) - - Revolving credits ( 28,000,000) ( 41,000,000) - - (137,875,211) (129,115,211) - - ========= ========= ========= ========= The amount due from subsidiaries of the Company bears interest ranging from 4.60% to 7.65% (2016: 4.60% %) per annum. The Company bears interest at 7.65% (2016: 7.65% %) per annum for amount due to subsidiaries. The term loan facilities to the Group bear interest at 12.00% per annum, which is equivalent to effective profit rate of 0.75% (2016: 0.75%) per annum above the Bank s i-cost of funds.
91 Financial instruments (continued) 28.6 Market risk (continued) Interest and profit rates risk (continued) Exposure to interest and profit rates risk (continued) The secured revolving credit facilities of the Group bear effective interest at 1.00% (2016: 1.00%) per annum above the Bank s cost of funds, whereas the secured revolving credit facilities (Islamic) bear effective profit rate of 0.60% (2016: 0.60%) per annum above the Bank s i-cost of funds. The deposits placed with licensed banks of the Group and the Company (see Notes 11 and 12) bear interest ranging from 2.60% to 3.65% (2016: 2.30% to 3.65%) per annum. Finance lease liabilities under loan and borrowings bear interest ranging from 4.65% % (2016: 4.49% to 5.32%) per annum. Interest and profit rates risk sensitivity analysis Fair value sensitivity analysis for fixed rate instruments The Group does not account for any fixed rate financial assets and liabilities at fair value through profit or loss, and the Group does not designate derivatives as hedging instruments under a fair value hedge accounting model. Therefore, a change in interest rates at the end of the reporting period would not affect profit or loss. The exposure to interest rate risk is consequently not material and hence sensitivity analysis is not presented. Cash flow sensitivity analysis for variable rate instruments A change of 100 basis points ( bp ) in interest rates at the end of the reporting period would have increased (decreased) post-tax profit or loss by the amounts shown below. This analysis assumes that all other variables remain constant Profit or loss Profit or loss 100bp 100bp 100bp 100bp increase decrease increase decrease RM RM RM RM Group Floating rate instruments (1,048,000) 1,048,000 ( 981,000) 981,000 ======= ======= ======= =======
92 Financial instruments (continued) 28.6 Market risk (continued) Other price risk Equity price risk arises from the Group s investments in portfolio investments and unit trusts securities. Risk management objectives, policies and processes for managing the risk The Group monitors the equity investments on a portfolio basis. Material investments are managed on an individual basis and portfolio investments are managed by a fund management company appointed by the Group. Equity price risk sensitivity analysis There is no sensitivity analysis performed as any change will be insignificant to the Group Fair value information The carrying amounts of cash and cash equivalents, short term receivables and payables and short term borrowings approximate fair values due to the relatively short term nature of these financial instruments. The fair values of portfolio investments and unit trusts are based on the net asset value of the investments as at the date of the statement of assets and liabilities obtained from fund managers.
93 Financial instruments (continued) 28.7 Fair value information (continued) The table below analyses financial instruments non-current financial liabilities not carried at fair value for which fair value is disclosed, together with their fair values and carrying amounts shown in the statement of financial position. Fair value of financial instruments not carried at fair value Total Carrying Level 1 Level 2 Level 3 Total fair value amount RM RM RM RM RM RM 2017 Financial liabilities Term loan - secured - - (102,414,325) (102,414,325) (102,414,325) (109,875,211) Finance lease liabilities - - ( 408,645) ( 408,645) ( 408,645) ( 416,352) - (102,822,970) (102,822,970) (102,822,970) (110,291,563) ========= ========= ========= ========= ========= ========= 2016 Financial liabilities Term loan - secured - - ( 79,717,791) ( 79,717,791) ( 79,717,791) ( 88,115,211) Finance lease liabilities - - ( 1,791,264) ( 1,791,264) ( 1,791,264) ( 1,827,329) - - ( 81,509,055) ( 81,509,055) ( 81,509,055) ( 89,942,540) ========= ========= ========= ========= ========= =========
94 Financial instruments (continued) 28.7 Fair value information (continued) Policy on transfer between levels The fair value of an asset to be transferred between levels is determined as of the date of the event or change in circumstances that caused the transfer. Level 1 fair value Level 1 fair value is derived from quoted price (unadjusted) in active markets for identical financial assets or liabilities that the entity can access at the measurement date. Level 2 fair value Level 2 fair value is estimated using inputs other than quoted prices included within Level 1 that are observable for the financial assets or liabilities, either directly or indirectly. Non-derivative financial liabilities Fair value, which is determined for disclosure purposes, is calculated based on the present value of future principal and interest cash flows, discounted at the market rate of interest at the end of the reporting period. Transfers between Level 1 and Level 2 fair values There has been no transfer between Level 1 and 2 fair values during the financial year (2016: no transfer in either directions). Level 3 fair value Level 3 fair value is estimated using unobservable inputs for the financial assets and liabilities. The fair value of term loans approximate their carrying amounts as these are variable rate borrowings.
95 Financial instruments (continued) 28.7 Fair value information (continued) Level 3 fair value (continued) Amount due from subsidiaries bears interest at a rate that is in line with prevailing rates, also approximate fair value. Financial instruments not carried at fair value Inter-relationship between significant Significant unobservable inputs unobservable and fair value Type Valuation technique inputs (%) measurement Finance Discounted Interest rate The estimated fair value lease cash flows 4.65% to 5.22% would increase (decrease) liabilities (2016: 4.49% to if the interest rate 5.32%) were higher (lower). Term loan Discounted Interest rate The estimated fair value - secured cash flows 4.97% would increase (decrease) (2016: 4.84%) if the interest rate were higher (lower). 29. Contingencies The Directors are of the opinion that provision is not required in respect of the following corporate guarantees as it is not probable that a future sacrifice of economic benefits will be required or the amount is not capable of reliable measurement: Company RM RM Corporate guarantees for banking facilities granted to subsidiaries 230,000, ,000,000 ========= =========
96 Capital management The Group s objectives when managing capital is to maintain a strong capital base and safeguard the Group s ability to continue as going concern, so as to maintain investor, creditor and market confidence and to sustain future development of the business. The Directors monitor and are determined to maintain an optimal debt-to-equity ratio that complies with debt covenants and regulatory requirements. The Group is required to maintain a maximum gearing level of 1.00 time to comply with a bank covenant, failing which the bank may call an event of default (see Note 16). The Group has not breached this covenant as evident from the following tabulation: RM RM Total loans and borrowings (Note 16) 139,868, ,867,950 ========= ========= Total equity 618,476, ,986,600 ========= ========= Debt-to-equity ratio ========= ========= There was no change in the Group s approach to capital management during the financial year. 31. Capital expenditure commitments Group RM RM Contracted for but not provided for Property, plant and equipment 27,444,609 30,749,407 Plantation development expenditure 6,565,841 8,230,340 34,010,450 38,979,747 ========= ========= 32. Related parties Identity of related parties For the purposes of these financial statements, parties are considered to be related to the Group if the Group or the Company has the ability, directly or indirectly, to control or jointly control the party or exercise significant influence over the party in making financial and operating decisions, or vice versa, or where the Group or the Company and the party are subject to common control or common significant influence. Related parties may be individuals or other entities.
97 Related parties (continued) Identity of related parties (continued) Related parties also include key management personnel, defined as those persons having authority and responsibility for planning, directing and controlling the activities of the Group either directly or indirectly. The key management personnel include all the Directors of the Group, and certain members of senior management of the Group. The Group has a related party relationship with: (i) its subsidiaries; (ii) its associate; (iii) key management personnel; (iv) companies/organisations connected to certain Directors of the Company and/or of its subsidiaries; and (v) its corporate shareholders. Significant related party transactions Significant related party transactions of the Group and of the Company, other than compensations to key management personnel (see Note 25) and those disclosed elsewhere in the financial statements, are shown below. Subsidiaries Group Company RM RM RM RM Dividend income - - ( 5,000,000) (20,867,500) Interest income - - ( 223,728) ( 598,674) Interest expense ,748 5,479 Administrative fee ,878 93,427 ======== ======== ======== ======== A company in which a Director has interest Group Company RM RM RM RM Sale of oil palm fresh fruit bunches 3,347,371 2,835, Fresh fruit bunches transportation cost 7, Purchase of materials 653, ======== ======== ========= =========
98 Related parties (continued) Significant related party transactions (continued) A company with common Director and another Director has interest Group Company RM RM RM RM Purchase of oil palm fresh fruit bunches 9,228,633 18,883, ======== ======== ========= ========= A company in which a Director has interest Group Company RM RM RM RM Rental and annual support for satellite and broadband services 195, , ======== ======== ========= ======== A company in which a person connected to a Director has interest Group Company RM RM RM RM Software support, customisation, maintenance and implementation costs 315, , Acquisition of software - 131, ======== ======== ========= ========
99 Related parties (continued) Significant related party transactions (continued) The balances related to the above transactions are shown in Notes 9 and 17. There is no allowance for impairment loss on doubtful receivables provided against the outstanding balances of related parties, other than that provided against the amount due from subsidiaries as disclosed in Note 9. Related party transactions are based on negotiated terms and the amounts outstanding at the statement of financial position date are unsecured and expected to be settled in cash. 33. Segment reporting The Group has three reportable segments, as described below, which are the Group s strategic business units. For each of the strategic business units, the Group Managing Director (being the Chief Operating Decision Maker), reviews internal management reports on a quarterly basis. The following describes the operations in each of the Group s reportable segments. Investment holding Oil palm operations Management services and rental - Investment holding company. - Cultivation of oil palm and processing of fresh fruit bunches. - Provision of management service and rental of investment properties. There are varying levels of integration between the reportable segments. Inter-segment pricing is determined on negotiated terms. Performance is measured based on segment gross profit as included in the internal management reports. Segment gross profit is used to measure performance as management believes that such information is the most relevant in evaluating the results of the segments relative to other entities that operate within these industries.
100 Segment reporting (continued) Management Investment Oil palm services/ holding operations Rental Consolidated RM RM RM RM 2017 Revenue Segment revenue 5,000, ,196,345 4,055, ,252,229 Inter-segment revenue ( 5,000,000) - ( 3,075,447) ( 8,075,447) External revenue - 398,196, , ,176, Cost of sales Segment cost of sales - 299,808,881 1,897, ,706,725 Inter-segment cost of sales - ( 99,655) ( 180,000) ( 279,655) External cost of sales - 299,709,226 1,717, ,427, Gross profit/(loss) - 98,487,119 ( 737,407) 97,749,712 ========================================== Other income including finance income 2,588,152 2,892, ,621 5,981,625 Inter-segment ( 223,728) ( 631,222) ( 11,893) ( 866,843) External other income 2,364,424 2,261, ,728 5,114, Other expenses including finance costs ( 3,084,022) (102,477,428) ( 2,129,965) ( 107,691,415) Inter-segment 397,374 2,128, ,521 3,280,616 External other expenses ( 2,686,648) (100,348,707) ( 1,375,444) ( 104,410,799) (Loss)/Profit before tax ( 322,224) 400,042 ( 1,624,123) ( 1,546,305) ========================================== Included in the measure of segment gross profit is: Depreciation of property, plant and equipment - 20,978, ,923 21,959,720 ==========================================
101 Segment reporting (continued) Management Investment Oil palm services/ holding operations Rental Consolidated RM RM RM RM 2016 Revenue Segment revenue 20,867, ,747,048 4,276, ,891,134 Inter-segment revenue (20,867,500) - ( 3,056,776) ( 23,924,276) External revenue - 382,747,048 1,219, ,966, Cost of sales Segment cost of sales - (297,857,370) ( 2,106,501) (299,963,871) Inter-segment cost of sales - 129, , ,920 External cost of sales - (297,727,450) ( 1,926,501) (299,653,951) Gross profit/(loss) - 85,019,598 ( 706,691) 84,312,907 ========================================== Other income including finance income 2,687,360 7,832, ,232 11,000,174 Inter-segment ( 598,674) ( 861,784) ( 10,336) ( 1,470,794) External other income 2,088,686 6,970, ,896 9,529, Other expenses including finance costs ( 5,570,475) ( 70,113,332) ( 1,967,061) ( 77,650,868) Inter-segment 1,785,108 6,960, ,552 9,536,744 External other expenses ( 3,785,367) ( 63,153,248) ( 1,175,509) ( 68,114,124) (Loss)/Profit before tax ( 1,696,681) 28,837,148 ( 1,412,304) 25,728,163 ========================================== Included in the measure of segment gross profit is: Depreciation of property, plant and equipment - 19,718,128 1,582,882 21,301,010 ==========================================
102 Segment reporting (continued) Segment assets RM RM Investment holding 405,378, ,885,885 Oil palm operations 735,258, ,578,518 Management services/rental 37,233,054 36,710,803 Others 44,013 44,013 1,177,914,606 1,211,219,219 Elimination ( 312,485,348) ( 308,918,364) Total assets 865,429, ,300,855 ========== ========== Reconciliation of reportable segment revenue, profit or loss, assets and other material items RM RM Profit or loss Total gross profit for reportable segments 97,749,712 84,312,907 Depreciation of tangible assets ( 3,814,053) ( 2,561,264) Impairment losses on tangible assets ( 43,544,868) ( 7,097,379) Finance costs ( 6,088,137) ( 3,631,813) Finance income 3,393,727 3,309,112 Corporate expenses ( 2,686,648) ( 3,785,367) Others expenses ( 46,556,038) ( 48,518,033) Reversal of impairment losses - 3,700,000 Consolidated (loss)/profit before tax ( 1,546,305) 25,728,163 ========= ========= Segment information is presented in respect of the Group s business segments. As the Group operates within one geographical segment, geographical segment analysis is not applicable.
103 Segment reporting (continued) Major customers The following are the major customers with revenue equal or more than 10% of the Group s total revenue: Revenue RM RM Segment - Customer A 131,832,744 76,927,236 Cultivation of oil palm and processing of fresh fruit bunches - Customer B 114,565,594 73,491,578 Cultivation of oil palm and processing of fresh fruit bunches - Customer C 87,385,959 94,302,165 Cultivation of oil palm and processing of fresh fruit bunches - Customer D 50,543,641 76,354,228 Cultivation of oil palm and processing of fresh fruit bunches ========= ========= The major customers listed above collectively owe RM19,822,932 (2016: RM21,301,420) to the Group, equivalent to 91% (2016: 90%) of the total trade receivables. 34. Material litigations (a) A subsidiary of the Group, SPB Pelita Suai Sdn. Bhd. ( SP Suai ) sued 6 individuals ( Defendants ), seeking injunctive and declaratory relief against the Defendants for various acts of trespass over 2 parcels of Native Communal Reserve Land which the Defendants had given consent for development into an oil palm estate. SP Suai also seeks to claim damages from the Defendants. On 18 September 2013, the learned Judge decided as follows: (i) (ii) (iii) (iv) There is no concluded contract between the Defendants and SP Suai; It has not been shown by the parties that the Defendants were members of the Penan community for which the land was gazetted for their exclusive use; That the gazette to allow SP Suai to deal with native land has no retrospective effect; Generally, parties have not proven their case against each other.
104 Material litigations (continued) (a) SP Suai filed a Notice of Appeal against the whole of the learned Judge s decision on 14 October The Defendants also filed a Notice of Appeal against the whole of the learned Judge s decision on the same date. SP Suai had filed and served the Record of Appeal on 2 December The Court of Appeal heard the appeal on 10 December 2015, and ordered that the case be remitted back to the High Court (before a different Judge) for a retrial. They were of the view that there was a mistrial in respect of the High Court s finding. There was no order as to costs. The retrial of the case proceeded on 26 July At the conclusion of the proceedings, the Court directed as follows: (i) (ii) (iii) The parties are to file and exchange Written Submissions; Thereafter, the parties are to file Written Reply; and Counsels for the parties are to appear before the Court to go through their Submissions on 25 August The Court allowed the Counsel for the Defendants application for an extension of 2 weeks from 27 October 2016 to file the Written Submission and the same has to be filed on or before 10 November Thereafter, the parties may file Reply (if any) by 17 November Hearing of the Submissions was fixed on 28 November The Court delivered its ruling on 23 February 2017 as follows: (i) (ii) Dismissed SP Suai s claim; Allowed part of the Defendants claims, namely SP Suai is prohibited from entering the 2 parcels of NCR Land and SP Suai has to vacate and remove its machineries, equipments and structures existing on the Defendants 2 parcels of NCR land. SP Suai filed a Notice of Appeal against the whole of the learned Judge s decision on 9 March 2017 and an application for a stay of execution on 11 April The Court heard and allowed the application for a stay of execution on 9 June The Appeal came up for Case Management on 6 September The Court of Appeal fixed the hearing of the Appeal on 27 June 2018.
105 Material litigations (continued) (b) On 13 July 2016, the Company and SPAD were served with legal proceedings. Amongst other things, the Plaintiffs seeked a declaration to the effect that they have acquired native customary rights and/or are the customary owners over land situated at/around all of Kampung Melugu Sri Aman. The Company and SPAD had on 20 July 2016 entered appearance. On 10 August 2016, an application to strike out the Plaintiffs Writ and Statement of Claim was filed and served the Plaintiffs. On 17 October 2016, the Court dismissed SPAD s application to strike out the Plaintiff s Statement of Claim. SPAD filed its appeal against the Court s said decision on 9 November On 14 July 2017, the Court of Appeal dismissed the Company and SPAD s appeal with costs in the cause. On 18 July 2017, the parties informed the Court of the verdict of the appeal hearing. The Company and SPAD also informed the Court of their intention to amend the Defence of the 1st and 2nd Defendants. The Court fixed 18 August 2017 as the next mention date to monitor the progress of the application for amendment of the Defence of the 1st and 2nd Defendants. On 28 August 2017, the Court had allowed the 1st and 2nd Defendants application for amendment of the Defence. The Court on 20 September 2017 had given directors for the parties to file the bundle of documents and documents pertinent to the trial. At the pre-trial case management held on 20 November 2017, the High Court fixed the case for trial from 5 March 2018 to 9 March The Directors, in consultation with the Company s and SPAD s advocates are of the opinion that the Company and SPAD have strong merits in the case. 35. Acquisition of subsidiaries Year ended 31 December 2016 (a) Acquisition of a subsidiary Telliana Oil Palm Sdn. Bhd. On 17 August 2015, the Company entered into a Share Sale Agreement to purchase 100,000 ordinary shares of RM1.00 each of Telliana Oil Palm Sdn. Bhd. ( Telliana ) for a cash consideration of RM29,769,175. On 10 May 2016, the Company entered into a Deed of Variation with the Vendors to vary the terms of payment. The balance purchase consideration of RM8,956,130 shall be payable upon obtaining Environment Impact Assessment (EIA) approval from the relevant authority for part of the land (approximately 1,147 hectares). The EIA approval for the other part of land measuring approximately 1,903 hectares was obtained on 7 April The 100% equity in Telliana has also been transferred to the Company, thus making Telliana a wholly owned subsidiary of the Company.
106 Acquisition of subsidiaries (continued) Year ended 31 December 2016 (continued) (a) Acquisition of a subsidiary Telliana Oil Palm Sdn. Bhd. (continued) The acquisition had the following effect on the Group s assets and liabilities: Recognised fair value RM Property, plant and equipment 29,769,175 Other payables ( 1,200) Net identifiable assets 29,767,975 Reserve on consolidation 1,200 Purchase consideration 29,769,175 ========= (b) Acquisition of a subsidiary SPB PPES Karabungan Plantation Sdn. Bhd. On 4 March 2016, the Company entered into a joint venture agreement with a third party for the development of approximately 1,000 acres of land into an oil palm plantation. The land is situated at Karabungan, Niah Land District, Sarawak. On 23 May 2016, a joint venture company named SPB PPES Karabungan Plantation Sdn. Bhd. ( SPB PPES Karabungan ) was incorporated to undertake the said development. The equity shareholding in SPB PPES Karabungan is 70/30, with the Company owning 70% and the third party owning 30%. The Group recognised a non-controlling interest of RM30.
107
108
109
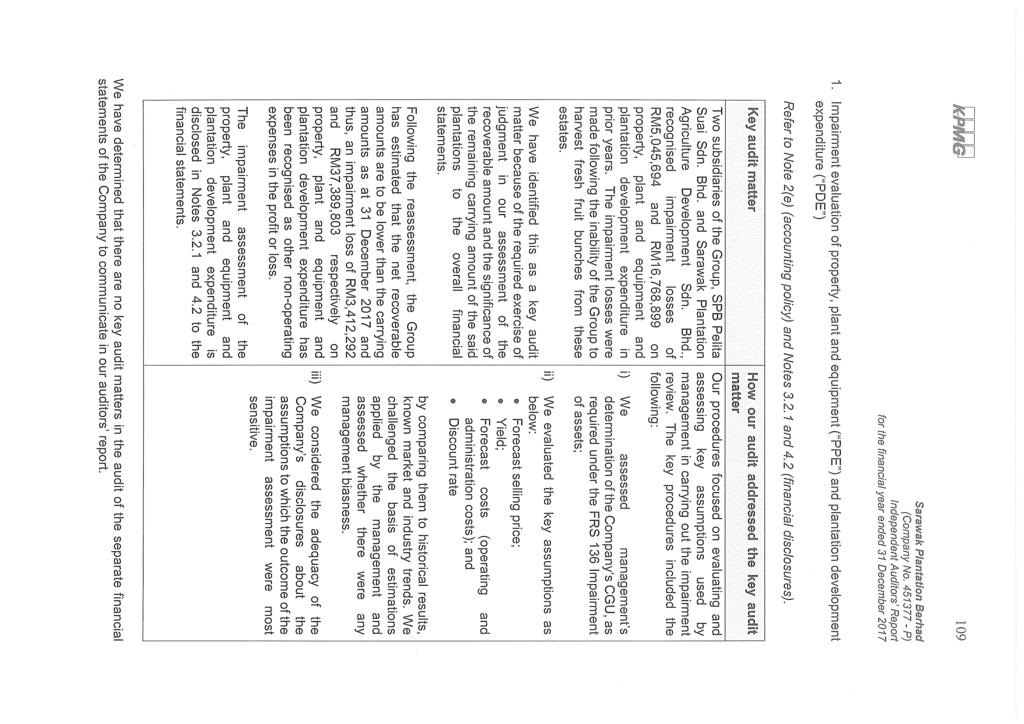
110
111
112
The details of the Company s subsidiaries are disclosed in Note 34 to the financial statements.
 Directors Report The Directors have pleasure in submitting their report and the audited financial statements of the Group and of the Company for the financial year ended 31 December 2016. Principal activities
ABM Fujiya Berhad (Company No W) (Incorporated in Malaysia) and its subsidiaries
 (Incorporated in Malaysia) and its subsidiaries") ABM Fujiya Berhad ( ) (Incorporated in Malaysia) and its subsidiaries Financial statements for the year ended 31 December 2016 1 ABM Fujiya Berhad ( ) (Incorporated in Malaysia) and its subsidiaries Directors'
ABM Fujiya Berhad ( ) (Incorporated in Malaysia) and its subsidiaries Financial statements for the year ended 31 December 2016 1 ABM Fujiya Berhad ( ) (Incorporated in Malaysia) and its subsidiaries Directors'
Profit for the financial year 157, ,481
 Directors Report 1 The Directors have pleasure in submitting their report and the audited financial statements of the Group and of the Company for the financial year ended 31 December 2016. Principal activities
See Hup Consolidated Berhad (Company No V) (Incorporated in Malaysia) and its subsidiaries Financial statements for the year ended 31 March
 (Incorporated in Malaysia) and its subsidiaries Financial statements for the year ended 31 March") See Hup Consolidated Berhad (Company No. 391077 - V) (Incorporated in Malaysia) and its subsidiaries Financial statements for the year ended 31 March 2015 1 See Hup Consolidated Berhad (Company No. 391077
See Hup Consolidated Berhad (Company No. 391077 - V) (Incorporated in Malaysia) and its subsidiaries Financial statements for the year ended 31 March 2015 1 See Hup Consolidated Berhad (Company No. 391077
EP Manufacturing Bhd (Company No T) (Incorporated in Malaysia) and its subsidiaries. Financial Statements for the year ended 31 December 2013
 (Incorporated in Malaysia) and its subsidiaries. Financial Statements for the year ended 31 December 2013") EP Manufacturing Bhd (Company No. 390116-T) (Incorporated in Malaysia) and its subsidiaries Financial Statements for the year ended 31 December 2013 1 EP Manufacturing Bhd (Company No. 390116-T) (Incorporated
EP Manufacturing Bhd (Company No. 390116-T) (Incorporated in Malaysia) and its subsidiaries Financial Statements for the year ended 31 December 2013 1 EP Manufacturing Bhd (Company No. 390116-T) (Incorporated
Financial Statements
 51 Directors Report 55 Statement by Directors 56 Statutory Declaration 57 Independent Auditors Report to the Members 59 Statements of Financial Position 61 Statements of Profit or Loss and Other Comprehensive
Weida (M) Bhd. (Company No W) (Incorporated in Malaysia) and its subsidiaries
 Bhd. (Company No W) (Incorporated in Malaysia) and its subsidiaries") Weida (M) Bhd. ( ) (Incorporated in Malaysia) and its subsidiaries Financial statements for the financial year ended 31 March 2015 1 Weida (M) Bhd. ( ) (Incorporated in Malaysia) and its subsidiaries Directors'
Weida (M) Bhd. ( ) (Incorporated in Malaysia) and its subsidiaries Financial statements for the financial year ended 31 March 2015 1 Weida (M) Bhd. ( ) (Incorporated in Malaysia) and its subsidiaries Directors'
DXN Holdings Bhd. (Company No V) (Incorporated in Malaysia) and its subsidiaries Financial statements for the year ended 28 February 2011
 (Incorporated in Malaysia) and its subsidiaries Financial statements for the year ended 28 February 2011") DXN Holdings Bhd. (Company No. 363120 - V) (Incorporated in Malaysia) and its subsidiaries Financial statements for the year ended 28 February 2011 1 DXN Holdings Bhd. (Company No. 363120 - V) (Incorporated
DXN Holdings Bhd. (Company No. 363120 - V) (Incorporated in Malaysia) and its subsidiaries Financial statements for the year ended 28 February 2011 1 DXN Holdings Bhd. (Company No. 363120 - V) (Incorporated
Scomi Energy Services Bhd (Company No A) (Incorporated in Malaysia) and its subsidiaries
 (Incorporated in Malaysia) and its subsidiaries") Scomi Energy Services Bhd (Company No. 397979-A) (Incorporated in Malaysia) and its subsidiaries Financial statements for the year ended 31 March 2015 Scomi Energy Services Bhd (Company No. 397979-A) (Incorporated
Scomi Energy Services Bhd (Company No. 397979-A) (Incorporated in Malaysia) and its subsidiaries Financial statements for the year ended 31 March 2015 Scomi Energy Services Bhd (Company No. 397979-A) (Incorporated
Hong Leong Industries Berhad (Incorporated in Malaysia) (Company No P) and its subsidiaries
 (Company No P) and its subsidiaries") Hong Leong Industries Berhad (Incorporated in Malaysia) () and its subsidiaries Financial statements for the financial year ended 30 June 2013 ` Hong Leong Industries Berhad (Incorporated in Malaysia)
Hong Leong Industries Berhad (Incorporated in Malaysia) () and its subsidiaries Financial statements for the financial year ended 30 June 2013 ` Hong Leong Industries Berhad (Incorporated in Malaysia)
HCL AXON MALAYSIA SDN. BHD. (Co. No P) (Incorporated in Malaysia) AND ITS SUBSIDIARY
 (Incorporated in Malaysia) AND ITS SUBSIDIARY") REPORTS AND FINANCIAL STATEMENTS FOR THE FINANCIAL YEAR ENDED 31 MARCH 2017 (In Ringgit Malaysia) Contents Pages Directors' report 1-4 Statement by Directors 5 Statutory declaration 6 Report of the independent
REPORTS AND FINANCIAL STATEMENTS FOR THE FINANCIAL YEAR ENDED 31 MARCH 2017 (In Ringgit Malaysia) Contents Pages Directors' report 1-4 Statement by Directors 5 Statutory declaration 6 Report of the independent
CONSOLIDATED STATEMENT OF FINANCIAL POSITION
 PETRONAS Dagangan Berhad Annual Report CONSOLIDATED STATEMENT OF FINANCIAL POSITION as at 31 December Note ASSETS Property, plant and equipment 3 3,372,292 3,794,252 Prepaid lease payments 4 456,821 476,856
RIMBUNAN SAWIT BERHAD (Incorporated in Malaysia)
") FINANCIAL REPORT for the financial year ended 31 December 2012 Contents Page Directors Report 1 Statement by Directors 7 Statutory Declaration 7 Independent Auditors Report 8 Statements of Financial Position
FINANCIAL REPORT for the financial year ended 31 December 2012 Contents Page Directors Report 1 Statement by Directors 7 Statutory Declaration 7 Independent Auditors Report 8 Statements of Financial Position
Oriental Food Industries Holdings Berhad
 Oriental Food Industries Holdings Berhad (389769-M) Directors' Report and Audited Financial Statements 31 March 2014 Contents Pages Directors' report 1-5 Statement by directors 6 Statutory declaration
Cymao Holdings Berhad (Co. No U) (Incorporated in Malaysia)
 (Incorporated in Malaysia)") Cymao Holdings Berhad Reports and Financial Statements For The Financial Year Ended 31 December 2017 (In Ringgit Malaysia) Contents Pages Directors report 1 4 Statement by Directors 5 Statutory declaration
Cymao Holdings Berhad Reports and Financial Statements For The Financial Year Ended 31 December 2017 (In Ringgit Malaysia) Contents Pages Directors report 1 4 Statement by Directors 5 Statutory declaration
PESONA METRO HOLDINGS BERHAD (Incorporated in Malaysia) REPORT AND FINANCIAL STATEMENTS 31 DECEMBER 2014 INDEX ***** DIRECTORS REPORT 1 5
 REPORT AND FINANCIAL STATEMENTS 31 DECEMBER 2014 INDEX ***** DIRECTORS REPORT 1 5") PESONA METRO HOLDINGS BERHAD (Incorporated in Malaysia) REPORT AND FINANCIAL STATEMENTS 31 DECEMBER 2014 INDEX ***** Page No. DIRECTORS REPORT 1 5 STATEMENT BY DIRECTORS 6 STATUTORY DECLARATION 7 INDEPENDENT
PESONA METRO HOLDINGS BERHAD (Incorporated in Malaysia) REPORT AND FINANCIAL STATEMENTS 31 DECEMBER 2014 INDEX ***** Page No. DIRECTORS REPORT 1 5 STATEMENT BY DIRECTORS 6 STATUTORY DECLARATION 7 INDEPENDENT
FINANCIAL STATEMENTS FOR THE YEAR ENDED 31 DECEMBER 2016
 FINANCIAL STATEMENTS FOR THE YEAR ENDED 31 DECEMBER 2016 218 FINANCIAL STATEMENTS (Available in CD version only) PDF processed with CutePDF evaluation edition www.cutepdf.com 2016 ANNUAL REPORT CONTENTS
DIRECTORS RESPONSIBILITY STATEMENT
 DIRECTORS RESPONSIBILITY STATEMENT In preparing the annual financial statements of the Group and of the Company, the Directors are collectively responsible to ensure that these financial statements have
Knusford Berhad (Company No D) (Incorporated in Malaysia) and its subsidiaries Financial statements for the year ended 31 December 2013
 (Incorporated in Malaysia) and its subsidiaries Financial statements for the year ended 31 December 2013") Knusford Berhad (Company No. 380100-D) (Incorporated in Malaysia) and its subsidiaries Financial statements for the year ended 31 December 2013 Knusford Berhad (Company No. 380100-D) (Incorporated in Malaysia)
Knusford Berhad (Company No. 380100-D) (Incorporated in Malaysia) and its subsidiaries Financial statements for the year ended 31 December 2013 Knusford Berhad (Company No. 380100-D) (Incorporated in Malaysia)
Notes to the Financial Statements
 Notes to the Financial Statements SAM Engineering & Equipment (M) Berhad is a public limited liability company, incorporated and domiciled in Malaysia and is listed on the Main Market of Bursa Malaysia
DATA CENTRE >50,000. Core Products. square feet of data centre space. Industry certified. Penang. Kuala Lumpur. Cyberjaya. Johor Bahru.
 DATA CENTRE >50,000 square feet of data centre space Penang Strategically Central Kuala Lumpur Core Products Industry certified Cyberjaya Johor Bahru Singapore Co-Location Managed Services Connectivity
THE ROYAL BANK OF SCOTLAND BERHAD (Company No A) (Incorporated in Malaysia)
 (Incorporated in Malaysia)") THE ROYAL BANK OF SCOTLAND BERHAD (Company No. 301932 - A) (Incorporated in Malaysia) REPORT OF THE DIRECTORS AND FINANCIAL STATEMENTS FOR THE YEAR ENDED 31 DECEMBER 2016 (In Ringgit Malaysia) These Audited
THE ROYAL BANK OF SCOTLAND BERHAD (Company No. 301932 - A) (Incorporated in Malaysia) REPORT OF THE DIRECTORS AND FINANCIAL STATEMENTS FOR THE YEAR ENDED 31 DECEMBER 2016 (In Ringgit Malaysia) These Audited
MAGNA PRIMA BERHAD (Incorporated in Malaysia) FINANCIAL STATEMENTS 31 DECEMBER 2012
 FINANCIAL STATEMENTS 31 DECEMBER 2012") MAGNA PRIMA BERHAD (Incorporated in Malaysia) FINANCIAL STATEMENTS 31 DECEMBER 2012 Registered office: Lot No. C-G11 & C-G12 Block C, Jalan Persiaran Surian Palm Spring @ Damansara 47810 Kota Damansara
MAGNA PRIMA BERHAD (Incorporated in Malaysia) FINANCIAL STATEMENTS 31 DECEMBER 2012 Registered office: Lot No. C-G11 & C-G12 Block C, Jalan Persiaran Surian Palm Spring @ Damansara 47810 Kota Damansara
KLUANG RUBBER COMPANY (MALAYA) BERHAD (3441-K)
 BERHAD (3441-K)") Independent auditors report to the members of Kluang Rubber Company (Malaya) Berhad (cont d) Other matters The supplementary information set out in Note 34 on page 76 is disclosed to meet the requirement
Independent auditors report to the members of Kluang Rubber Company (Malaya) Berhad (cont d) Other matters The supplementary information set out in Note 34 on page 76 is disclosed to meet the requirement
Our Numbers. Bumi Armada Berhad FINANCIAL STATEMENTS
 Our Numbers Bumi Armada Berhad FINANCIAL STATEMENTS 82 Directors Report 87 Statements of Income 88 Statements of Comprehensive Income 89 Consolidated Statement of Financial Position 91 Statement of Financial
FINANCIAL STATEMENTS DIRECTORS REPORT 65 STATEMENTS OF FINANCIAL POSITION 70 STATEMENTS OF PROFIT OR LOSS AND OTHER COMPREHENSIVE INCOME 72
 FINANCIAL STATEMENTS DIRECTORS REPORT 65 STATEMENTS OF FINANCIAL POSITION 70 STATEMENTS OF PROFIT OR LOSS AND OTHER COMPREHENSIVE INCOME 72 CONSOLIDATED STATEMENT OF CHANGES IN EQUITY 74 STATEMENTS OF
SINCE 1975 FINANCIAL STATEMENTS LANDMARK BUILDER
 FINANCIAL STATEMENTS Directors Report 78 Financial Statements Statements Of Financial Position 82 Statements Of Comprehensive Income 84 Statements Of Changes In Equity 85 Statements Of Cash Flows 88 Notes
Asia File Corporation Bhd. (Company No P) (Incorporated in Malaysia) and its subsidiaries Financial statements for the year ended 31 March
 (Incorporated in Malaysia) and its subsidiaries Financial statements for the year ended 31 March") Asia File Corporation Bhd. (Company No. 313192 P) (Incorporated in Malaysia) and its subsidiaries Financial statements for the year ended 31 March 2009 1 Asia File Corporation Bhd. (Company No. 313192
Asia File Corporation Bhd. (Company No. 313192 P) (Incorporated in Malaysia) and its subsidiaries Financial statements for the year ended 31 March 2009 1 Asia File Corporation Bhd. (Company No. 313192
SUNGEI BAGAN RUBBER COMPANY (MALAYA) BERHAD (3327-U) (Incorporated in Malaysia)
 BERHAD (3327-U) (Incorporated in Malaysia)") Statements of changes in equity For the financial year ended 30 June 2012 (cont d) < Non-distributable > < Distributable > Foreign Cultivation currency and Share Capital Fair value translation replacement
Statements of changes in equity For the financial year ended 30 June 2012 (cont d) < Non-distributable > < Distributable > Foreign Cultivation currency and Share Capital Fair value translation replacement
There have been no significant changes in these principal activities during the financial year, other than those disclose on Note 46.
 DIRECTORS' REPORT The directors submit herewith their report together with the audited financial statements of the Group and the Bank for the financial year ended 31 December 2013. PRINCIPAL ACTIVITIES
DIRECTORS REPORT FOR THE FINANCIAL YEAR ENDED 31 DECEMBER 2014
 DIRECTORS REPORT FOR THE FINANCIAL YEAR ENDED 31 DECEMBER 2014 The directors hereby submit their report together with the audited financial statements of the and of the for the financial year ended 31
Company No: W. REV ASIA BERHAD ( W) (formerly known as Catcha Media Berhad) (Incorporated in Malaysia)
 (formerly known as Catcha Media Berhad) (Incorporated in Malaysia)") Company No: REV ASIA BERHAD () (formerly known as Catcha Media Berhad) (Incorporated in Malaysia) DIRECTORS REPORT AND AUDITED FINANCIAL STATEMENTS 31 DECEMBER 2014 Company No: REV ASIA BERHAD () (formerly
Company No: REV ASIA BERHAD () (formerly known as Catcha Media Berhad) (Incorporated in Malaysia) DIRECTORS REPORT AND AUDITED FINANCIAL STATEMENTS 31 DECEMBER 2014 Company No: REV ASIA BERHAD () (formerly
MEMBINA MASA HADAPAN YANG BERMANFAAT UNTUK SEMUA
 MEMBINA MASA HADAPAN YANG BERMANFAAT UNTUK SEMUA > 226 226 FINANCIAL STATEMENTS Report of The Auditor General on The Financial Statements of Lembaga Tabung Haji Statement by Chairman and A Member of the
The results of operations of the Group and of the Company for the financial year are as follows:
 SUPERCOMNET TECHNOLOGIES BERHAD (Incorporated in Malaysia) DIRECTORS REPORT The directors of SUPERCOMNET TECHNOLOGIES BERHAD hereby submit their report and the audited financial statements of the Group
CSC STEEL HOLDINGS BERHAD (Company No X) (Incorporated in Malaysia) AND ITS SUBSIDIARY COMPANIES
 (Incorporated in Malaysia) AND ITS SUBSIDIARY COMPANIES") CSC STEEL HOLDINGS BERHAD (Company No. 640357 - X) (Incorporated in Malaysia) AND ITS SUBSIDIARY COMPANIES REPORT OF THE DIRECTORS AND FINANCIAL STATEMENTS FOR THE YEAR ENDED DECEMBER 31, 2012 (In Ringgit
CSC STEEL HOLDINGS BERHAD (Company No. 640357 - X) (Incorporated in Malaysia) AND ITS SUBSIDIARY COMPANIES REPORT OF THE DIRECTORS AND FINANCIAL STATEMENTS FOR THE YEAR ENDED DECEMBER 31, 2012 (In Ringgit
The financial results of operations during the year are as follows:- Group Company
 DIRECTORS REPORT The directors have pleasure in submitting their report together with the audited financial statements of the and of the Company for the year ended 31 December. 1. PRINCIPAL ACTIVITIES
TAFI INDUSTRIES BERHAD (Company No P) (Incorporated in Malaysia) AND ITS SUBSIDIARY COMPANIES
 (Incorporated in Malaysia) AND ITS SUBSIDIARY COMPANIES") TAFI INDUSTRIES BERHAD () (Incorporated in Malaysia) AND ITS SUBSIDIARY COMPANIES REPORT OF THE DIRECTORS AND FINANCIAL STATEMENTS FOR THE YEAR ENDED DECEMBER 31, 2014 (In Ringgit Malaysia) TAFI INDUSTRIES
TAFI INDUSTRIES BERHAD () (Incorporated in Malaysia) AND ITS SUBSIDIARY COMPANIES REPORT OF THE DIRECTORS AND FINANCIAL STATEMENTS FOR THE YEAR ENDED DECEMBER 31, 2014 (In Ringgit Malaysia) TAFI INDUSTRIES
The amount of dividends paid by the Company since 31 January 2014 were as follows:
 DIRECTORS REPORT The directors have pleasure in presenting their report together with the audited financial statements of the Group and of the Company for the financial year ended 31 January 2015. PRINCIPAL
TRC SYNERGY BERHAD ( D) (Incorporated in Malaysia) Directors' Report and Audited Financial Statements 31 December 2015
 (Incorporated in Malaysia) Directors' Report and Audited Financial Statements 31 December 2015") () Directors' Report and Audited Financial Statements 31 December 2015 () STATUTORY FINANCIAL STATEMENTS - 31 DECEMBER 2015 INDEX PAGES DIRECTORS' REPORT 1-8 STATEMENT BY DIRECTORS 9 STATUTORY DECLARATION
() Directors' Report and Audited Financial Statements 31 December 2015 () STATUTORY FINANCIAL STATEMENTS - 31 DECEMBER 2015 INDEX PAGES DIRECTORS' REPORT 1-8 STATEMENT BY DIRECTORS 9 STATUTORY DECLARATION
GOLDIS BERHAD (Incorporated in Malaysia)
") REPORTS AND FINANCIAL STATEMENTS FOR THE FINANCIAL YEAR ENDED 31 DECEMBER 2014 0236A5/fm REPORTS AND FINANCIAL STATEMENTS FOR THE FINANCIAL YEAR ENDED 31 DECEMBER 2014 CONTENTS PAGES DIRECTORS' REPORT
REPORTS AND FINANCIAL STATEMENTS FOR THE FINANCIAL YEAR ENDED 31 DECEMBER 2014 0236A5/fm REPORTS AND FINANCIAL STATEMENTS FOR THE FINANCIAL YEAR ENDED 31 DECEMBER 2014 CONTENTS PAGES DIRECTORS' REPORT
YFG Berhad. (Company No W) (Incorporated in Malaysia) and its subsidiaries Reissued financial statements for the year ended 30 June 2014
 (Incorporated in Malaysia) and its subsidiaries Reissued financial statements for the year ended 30 June 2014") YFG Berhad (Company No. 499758 - W) (Incorporated in Malaysia) and its subsidiaries Reissued financial statements for the year ended 30 June 2014 1 YFG Berhad (Company No. 499758 - W) (Incorporated in
YFG Berhad (Company No. 499758 - W) (Incorporated in Malaysia) and its subsidiaries Reissued financial statements for the year ended 30 June 2014 1 YFG Berhad (Company No. 499758 - W) (Incorporated in
C O A S T A L C O N T R A C T S B HD. (CO M P A N Y N O A ) (Incorporated in Malaysia)
 (Incorporated in Malaysia)") C O A S T A L C O N T R A C T S B HD. (CO M P A N Y N O. 517649- A ) (Incorporated in Malaysia) Directors Report and Audited Financial Statements 30 June 2017 (Incorporated in Malaysia) Audited Financial
C O A S T A L C O N T R A C T S B HD. (CO M P A N Y N O. 517649- A ) (Incorporated in Malaysia) Directors Report and Audited Financial Statements 30 June 2017 (Incorporated in Malaysia) Audited Financial
LATITUDE TREE HOLDINGS BERHAD. Directors Report and Audited Financial Statements
 LATITUDE TREE HOLDINGS BERHAD () Directors Report and Audited Financial Statements 30 JUNE 2011 Contents Pages Directors' report 1-6 Statement by directors 7 Statutory declaration 7 Independent auditors'
The principal activity of the Company is renting of buildings, provision of management services to its subsidiary companies and investment holding.
 FINANCIAL STATEMENTS 38 REPORT OF THE DIRECTORS 42 INDEPENDENT AUDITORS REPORT 46 STATEMENTS OF PROFIT OR LOSS AND OTHER COMPREHENSIVE INCOME 47 STATEMENTS OF FINANCIAL POSITION 49 STATEMENTS OF CHANGES
Directors Report for the year ended 31 December 2013
 Financial Statements Directors Report 27 Statement by Directors 31 Statutory Declaration 31 Independent Auditors Report 32 Statements of Financial Position 34 Statements of Profit or Loss and Other Comprehensive
WAH SEONG CORPORATION BERHAD (Incorporated in Malaysia)
") REPORTS AND FINANCIAL STATEMENTS FOR THE FINANCIAL YEAR ENDED 31 DECEMBER 2016 0004A7/py TABLE OF CONTENTS PAGES DIRECTORS REPORT 1-6 STATEMENT BY DIRECTORS 7 STATUTORY DECLARATION 7 INDEPENDENT AUDITORS
REPORTS AND FINANCIAL STATEMENTS FOR THE FINANCIAL YEAR ENDED 31 DECEMBER 2016 0004A7/py TABLE OF CONTENTS PAGES DIRECTORS REPORT 1-6 STATEMENT BY DIRECTORS 7 STATUTORY DECLARATION 7 INDEPENDENT AUDITORS
Financial Statements & Reports
 Financial Statements & Reports 70 Directors Report 77 Independent Auditors Report 79 Statements of Profit or Loss and Other Comprehensive Income 80 Statements of Financial Position 82 Statements of Changes
FINANCIAL STATEMENTS
 STATISTIC OF SHAREHOLDINGS as at 22 March 2017 FINANCIAL STATEMENTS 42 Directors Report 46 Statement by Directors 46 Statutory Declaration 47 Independent Auditors Report 52 Statements of Profit or Loss
STATEMENTS
 Financial STATEMENTS 98 Directors Report and Statement 104 Statements of Comprehensive Income 105 Balance Sheets 107 Consolidated Statement of Changes in Equity 109 Statement of Changes in Equity 110 Statements
STONE MASTER CORPORATION BERHAD ( X) (Incorporated in Malaysia) REPORTS AND FINANCIAL STATEMENTS 30TH SEPTEMBER 2015
 (Incorporated in Malaysia) REPORTS AND FINANCIAL STATEMENTS 30TH SEPTEMBER 2015") STONE MASTER CORPORATION BERHAD (498639 X) (Incorporated in Malaysia) REPORTS AND FINANCIAL STATEMENTS 30TH SEPTEMBER 2015 STONE MASTER CORPORATION BERHAD (Incorporated in Malaysia) REPORTS AND FINANCIAL
STONE MASTER CORPORATION BERHAD (498639 X) (Incorporated in Malaysia) REPORTS AND FINANCIAL STATEMENTS 30TH SEPTEMBER 2015 STONE MASTER CORPORATION BERHAD (Incorporated in Malaysia) REPORTS AND FINANCIAL
Notes to the Financial Statements
 Financial Statements SAM Engineering & Equipment (M) Berhad is a public limited liability company, incorporated and domiciled in Malaysia and is listed on the Main Market of Bursa Malaysia Securities Berhad.
financial statements
 Financial Statements 155 Directors Report 161 Statement by Directors 161 Statutory Declaration 162 Income Statements 163 Statements of Comprehensive Income 164 Statements of Financial Position 168 Consolidated
NOTES TO THE FINANCIAL STATEMENTS
 77 1 PRINCIPAL ACTIVITIES AND GENERAL INFORMATION The Company is principally engaged in investment holding and providing management services, whilst the principal activities of the subsidiaries are as
Directors' report 1-5. Statement by directors 6. Statutory declaration 6. Independent auditors' report 7-9. Statements of financial position 10
 Page Directors' report 1-5 Statement by directors 6 Statutory declaration 6 Independent auditors' report 7-9 Statements of financial position 10 Statements of comprehensive income 11-12 Statements of changes
MUAR BAN LEE GROUP BERHAD (Company No: P) (Incorporated in Malaysia) REPORTS AND FINANCIAL STATEMENTS 31 DECEMBER 2013
 (Incorporated in Malaysia) REPORTS AND FINANCIAL STATEMENTS 31 DECEMBER 2013") MUAR BAN LEE GROUP BERHAD (Company No: 753588-P) (Incorporated in Malaysia) REPORTS AND FINANCIAL STATEMENTS 31 DECEMBER 2013 Registered office: 87 Lebuh Muntri 10200 Penang Principal place of business:
MUAR BAN LEE GROUP BERHAD (Company No: 753588-P) (Incorporated in Malaysia) REPORTS AND FINANCIAL STATEMENTS 31 DECEMBER 2013 Registered office: 87 Lebuh Muntri 10200 Penang Principal place of business:
azman, wong, salleh & co.
 HSS ENGINEERS BERHAD (1128564-U) STATUTORY REPORT AND FINANCIAL STATEMENTS FOR THE YEAR ENDED 31 DECEMBER 2016 azman, wong, salleh & co. (AF: 0012) chartered accountants REPORTS AND FINANCIAL STATEMENTS
ADVANCED PACKAGING TECHNOLOGY (M) BHD. (Co. No K) (Incorporated in Malaysia)
 BHD. (Co. No K) (Incorporated in Malaysia)") REPORTS AND FINANCIAL STATEMENTS FOR THE FINANCIAL YEAR ENDED 31 DECEMBER 2014 (In Ringgit Malaysia) Contents Pages Corporate information 1 Directors' report 2-6 Statement by Directors 7 Statutory declaration
REPORTS AND FINANCIAL STATEMENTS FOR THE FINANCIAL YEAR ENDED 31 DECEMBER 2014 (In Ringgit Malaysia) Contents Pages Corporate information 1 Directors' report 2-6 Statement by Directors 7 Statutory declaration
Knusford Berhad. (Company No D) (Incorporated in Malaysia) and its subsidiaries Financial statements for the year ended 31 December 2009
 (Incorporated in Malaysia) and its subsidiaries Financial statements for the year ended 31 December 2009") Knusford Berhad (Company No. 380100-D) (Incorporated in Malaysia) and its subsidiaries Financial statements for the year ended 31 December 2009 1 Knusford Berhad (Company No. 380100-D) (Incorporated in
Knusford Berhad (Company No. 380100-D) (Incorporated in Malaysia) and its subsidiaries Financial statements for the year ended 31 December 2009 1 Knusford Berhad (Company No. 380100-D) (Incorporated in
NOTES TO THE FINANCIAL STATEMENTS
 1. Corporate information The Company is a public limited company, incorporated and domiciled in Malaysia, and is listed on the Main Market of Bursa Malaysia Securities Berhad. The registered office of
HeiTech Padu Berhad. ( D) (Incorporated in Malaysia) Directors Report and Audited Financial Statements 31 December 2016
 (Incorporated in Malaysia) Directors Report and Audited Financial Statements 31 December 2016") (310628-D) Directors Report and Audited Financial Statements 31 December 2016 Contents Pages Directors' report 1-5 Statement by directors 6 Statutory declaration 6 Independent auditors' report 7-13 Statements
(310628-D) Directors Report and Audited Financial Statements 31 December 2016 Contents Pages Directors' report 1-5 Statement by directors 6 Statutory declaration 6 Independent auditors' report 7-13 Statements
NOTES TO THE FINANCIAL STATEMENTS for the financial year ended 31 December 2009
 32 KLW HOLDINGS LIMITED ANNUAL REPORT 2009 1 GENERAL INFORMATION The financial statements of the Group and of the Company were authorised for issue in accordance with a resolution of the directors on the
POH KONG HOLDINGS BERHAD ( K) (Incorporated in Malaysia) REPORTS AND FINANCIAL STATEMENTS 31ST JULY 2015
 (Incorporated in Malaysia) REPORTS AND FINANCIAL STATEMENTS 31ST JULY 2015") POH KONG HOLDINGS BERHAD (586139 - K) (Incorporated in Malaysia) REPORTS AND FINANCIAL STATEMENTS 31ST JULY 2015 POH KONG HOLDINGS BERHAD (Incorporated in Malaysia) REPORTS AND FINANCIAL STATEMENTS FOR
POH KONG HOLDINGS BERHAD (586139 - K) (Incorporated in Malaysia) REPORTS AND FINANCIAL STATEMENTS 31ST JULY 2015 POH KONG HOLDINGS BERHAD (Incorporated in Malaysia) REPORTS AND FINANCIAL STATEMENTS FOR
KANGER INTERNATIONAL BERHAD (Company No.: D) (Incorporated in Malaysia) FINANCIAL STATEMENTS
 (Incorporated in Malaysia) FINANCIAL STATEMENTS") KANGER INTERNATIONAL BERHAD (: 1014793-D) (Incorporated in Malaysia) FINANCIAL STATEMENTS FOR THE FINANCIAL PERIOD FROM 27 AUGUST 2012 (DATE OF INCORPORATION) TO 31 DECEMBER 2013 Registered office: 2-1,
KANGER INTERNATIONAL BERHAD (: 1014793-D) (Incorporated in Malaysia) FINANCIAL STATEMENTS FOR THE FINANCIAL PERIOD FROM 27 AUGUST 2012 (DATE OF INCORPORATION) TO 31 DECEMBER 2013 Registered office: 2-1,
Red Ideas Holdings Berhad ( M) (Incorporated in Malaysia) Audited Financial Statements
 (Incorporated in Malaysia) Audited Financial Statements") Red Ideas Holdings Berhad (1234231-M) (Incorporated in Malaysia) Audited Financial Statements 2018 RED IDEAS HOLDINGS BERHAD (1234231-M) (Incorporated in Malaysia) CONTENTS PAGE Directors' Report 1-5 Statement
Red Ideas Holdings Berhad (1234231-M) (Incorporated in Malaysia) Audited Financial Statements 2018 RED IDEAS HOLDINGS BERHAD (1234231-M) (Incorporated in Malaysia) CONTENTS PAGE Directors' Report 1-5 Statement
The principal activities of the Company are investment holding and provision of management services.
 41 ACCOUNTABILITY 42 Directors Report 46 Statement by Directors 46 Statutory Declaration 47 Independent Auditors Report 49 Income Statements 50 Statements of Comprehensive Income 51 Statements of Financial
UNITED MALAYAN LAND BHD (Incorporated in Malaysia)
") DIRECTORS REPORT AND FINANCIAL STATEMENTS 0985A1/nad DIRECTORS' REPORT The Directors hereby submit to the members their annual report and the audited financial statements of the Group and Company for the
DIRECTORS REPORT AND FINANCIAL STATEMENTS 0985A1/nad DIRECTORS' REPORT The Directors hereby submit to the members their annual report and the audited financial statements of the Group and Company for the
Ranbaxy (Malaysia) Sdn. Bhd. (Company No K) (Incorporated in Malaysia) Financial statements for the period from 1 January 2013 to 31 March 2014
 Sdn. Bhd. (Company No K) (Incorporated in Malaysia) Financial statements for the period from 1 January 2013 to 31 March 2014") Ranbaxy (Malaysia) Sdn. Bhd. (Company No. 89186-K) (Incorporated in Malaysia) Financial statements for the period from 1 January 2013 to 31 March 2014 Independent auditors report to the members of Ranbaxy
Ranbaxy (Malaysia) Sdn. Bhd. (Company No. 89186-K) (Incorporated in Malaysia) Financial statements for the period from 1 January 2013 to 31 March 2014 Independent auditors report to the members of Ranbaxy
Notes To The Financial Statements For the year ended 31 December 2014
 1. Corporate information Ornapaper Berhad is a public limited liability company, incorporated and domiciled in Malaysia, and is listed on the Main Market of Bursa Malaysia Securities Berhad. The principal
FINANCIAL STATEMENTS
 FINANCIAL STATEMENTS 42 Directors Report 46 Statement by Directors 46 Statutory Declaration 47 Statements of Financial Position 49 Statements of Profit or Loss 50 Statements of Profit or Loss and Other
PENSONIC HOLDINGS BERHAD (Company No P) (Incorporated in Malaysia) REPORTS AND FINANCIAL STATEMENTS 31 MAY 2015
 (Incorporated in Malaysia) REPORTS AND FINANCIAL STATEMENTS 31 MAY 2015") - PENSONIC HOLDINGS BERHAD (Company No 300426 - P) (Incorporated in Malaysia) REPORTS AND FINANCIAL STATEMENTS 31 MAY 2015 Registered office: 85, Muntri Street 10200 Penang Principal place of business:
- PENSONIC HOLDINGS BERHAD (Company No 300426 - P) (Incorporated in Malaysia) REPORTS AND FINANCIAL STATEMENTS 31 MAY 2015 Registered office: 85, Muntri Street 10200 Penang Principal place of business:
Contents. Directors Report and Audited Financial Statements 31 December Directors report. Statement by directors. Statutory declaration
 Contents Directors Report and Audited Financial Statements 31 December 2014 Directors report 60-61 Statement by directors 62 Statutory declaration 62 Independent auditors report 63-64 Statements of profit
KLCC PROPERTY HOLDINGS BERHAD
 KLCC PROPERTY HOLDINGS BERHAD FINANCIAL STATEMENTS Directors Report 084 088 Statement by Directors 089 Statutory Declaration 089 Statements of Financial Position 090 091 Statements of Comprehensive Income
Financial. Statements
 Financial Statements Directors Report 44 Independent Auditors Report 48 Statements of Profit or Loss and 50 Other Comprehensive Income Statements of Financial Position 51 Statements of Changes in Equity
OUR WAY FORWARD FINANCIAL REPORT 2017 RHB BANK BERHAD
 OUR WAY FORWARD FINANCIAL REPORT RHB BANK BERHAD S F S STATUTORY FINANCIAL STATEMENTS FOR THE FINANCIAL YEAR ENDED 31 DECEMBER 002 Responsibility Statement by the Board of Directors 003 Directors Report
The principal activities of the Company are investment holding and provision of management services.
 Notes to the financial statements For the financial year ended 31 December 2011 1. Corporate information ("the Company") is a public limited liability company, incorporated and domiciled in Malaysia, and
RAMCO SYSTEMS SDN. BHD. (Formerly known as Ramcosystems Sdn. Bhd.) Company No.: W (Incorporated in Malaysia)
 Company No.: W (Incorporated in Malaysia)") RAMCO SYSTEMS SDN. BHD. (Formerly known as Ramcosystems Sdn. Bhd.) Company No.: 342313W (Incorporated in Malaysia) FINANCIAL STATEMENTS FOR THE YEAR ENDED 31 MARCH 2018 1 RAMCO SYSTEMS SDN. BHD. (Formerly
RAMCO SYSTEMS SDN. BHD. (Formerly known as Ramcosystems Sdn. Bhd.) Company No.: 342313W (Incorporated in Malaysia) FINANCIAL STATEMENTS FOR THE YEAR ENDED 31 MARCH 2018 1 RAMCO SYSTEMS SDN. BHD. (Formerly
GREENYIELD BERHAD (Company No T) (Incorporated in Malaysia)
 (Incorporated in Malaysia)") Condensed Consolidated Statement of Profit or Loss and Other Comprehensive Income for the first quarter ended 31 October 2018 (The figures have not been audited) Individual Quarter Cumulative Quarter 3
Condensed Consolidated Statement of Profit or Loss and Other Comprehensive Income for the first quarter ended 31 October 2018 (The figures have not been audited) Individual Quarter Cumulative Quarter 3
S A R A W A K C A B L E B E R H A D ( V) (Incorporated in Malaysia) Directors Report and Audited Financial Statements 31 December 2014
 (Incorporated in Malaysia) Directors Report and Audited Financial Statements 31 December 2014") S A R A W A K C A B L E B E R H A D ( 4 5 6 4 0 0 - V) (Incorporated in Malaysia) Directors Report and Audited Financial Statements 31 December 2014 (Incorporated in Malaysia) Directors: Secretary: Registered
S A R A W A K C A B L E B E R H A D ( 4 5 6 4 0 0 - V) (Incorporated in Malaysia) Directors Report and Audited Financial Statements 31 December 2014 (Incorporated in Malaysia) Directors: Secretary: Registered
The principal activities of the subsidiaries are set out in Note 16 to the Financial Statements.
 LAFARGE MALAYSIA BERHAD (Incorporated in Malaysia) DIRECTORS REPORT The Directors of LAFARGE MALAYSIA BERHAD have pleasure in submitting their report and the audited financial statements of the and of
CONTENTS of FINANCIAL STATEMENTS
 CONTENTS of FINANCIAL STATEMENTS Directors Report_56 Statement by Directors_60 Statutory Declaration_60 Independent Auditors Report_61 Statements of Comprehensive Income_63 Statements of Financial Position_64
K U M P U L A N F I M A B E R H A D
 K U M P U L A N F I M A B E R H A D (11817 - V) (Incorporated in Malaysia) Directors Report and Audited Financial Statements 31 March 2015 KUMPULAN FIMA BERHAD (Incorporated in Malaysia) CONTENTS PAGE
POH HUAT RESOURCES HOLDINGS BERHAD (Incorporated In Malaysia)
") Company No. : 443169 - X FINANCIAL REPORT for the financial year ended 31 October 2015 CONTENTS Page Directors' Report 1-7 Statement by Directors 8 Statutory Declaration 9 Independent Auditors' Report
Company No. : 443169 - X FINANCIAL REPORT for the financial year ended 31 October 2015 CONTENTS Page Directors' Report 1-7 Statement by Directors 8 Statutory Declaration 9 Independent Auditors' Report
Sumitomo Mitsui Banking Corporation Malaysia Berhad (Company No U) (Incorporated in Malaysia)
 (Incorporated in Malaysia)") Sumitomo Mitsui Banking Corporation Malaysia Berhad () (Incorporated in Malaysia) Financial Statements for the Financial Year Ended 31 March 2013 1 Sumitomo Mitsui Banking Corporation Malaysia Berhad ()
Sumitomo Mitsui Banking Corporation Malaysia Berhad () (Incorporated in Malaysia) Financial Statements for the Financial Year Ended 31 March 2013 1 Sumitomo Mitsui Banking Corporation Malaysia Berhad ()
Financial Statements. Directors Report. Statements of Financial Position. Consolidated Statement of Changes in Equity. Statement by Directors
 Financial Statements 56 Directors Report 68 Statements of Financial Position 62 Statement by Directors 70 Consolidated Statement of Changes in Equity 62 Statutory Declaration 72 Statement of Changes in
( W) (Incorporated in Malaysia) Statement by Directors and Audited Financial Statements 31 March Ernst & Young AF : 0039
 (Incorporated in Malaysia) Statement by Directors and Audited Financial Statements 31 March Ernst & Young AF : 0039") B ANGKOK BANK BERHAD (299740 W) Statement by Directors and Audited Financial Statements 31 March 2009 Ernst & Young AF : 0039 Contents Page Performance review and commentary on the prospects 1 Statement
B ANGKOK BANK BERHAD (299740 W) Statement by Directors and Audited Financial Statements 31 March 2009 Ernst & Young AF : 0039 Contents Page Performance review and commentary on the prospects 1 Statement
TA Global Berhad Annual Report 81
 KEY CONTROL PROCESSES The key processes adopted to establish, monitor and review the effectiveness of the Group s internal control system are as follows and these processes are embedded within the Group
NOTES TO THE FINANCIAL STATEMENTS
 These notes form an integral part of the financial statements. The financial statements were authorised for issue by the Board of Directors on 14 March 2014. 1 DOMICILE AND ACTIVITIES City Developments
ORACLE FINANCIAL SERVICES SOFTWARE PTE. LTD. (Incorporated in the Republic of Singapore) (Registration Number: K) AND ITS SUBSIDIARY
 (Registration Number: K) AND ITS SUBSIDIARY") ORACLE FINANCIAL SERVICES SOFTWARE PTE. LTD. (Registration Number: 200107453K) FINANCIAL STATEMENTS YEAR ENDED 31 MARCH ORACLE FINANCIAL SERVICES SOFTWARE PTE. LTD. Directors Venkatachalam Krishnakumar
ORACLE FINANCIAL SERVICES SOFTWARE PTE. LTD. (Registration Number: 200107453K) FINANCIAL STATEMENTS YEAR ENDED 31 MARCH ORACLE FINANCIAL SERVICES SOFTWARE PTE. LTD. Directors Venkatachalam Krishnakumar
Annual Audited Accounts
 Annual Audited Accounts WHITE HORSE BERHAD Subject Annual Audited Accounts - 31 December 2013 Attachments White Horse Bhd- AFS 311213.pdf 1002 KB Announcement Info Company Name WHITE HORSE BERHAD Stock
TRC SYNERGY BERHAD ( D) (Incorporated in Malaysia) Directors' Report and Audited Financial Statements 31 December 2016
 (Incorporated in Malaysia) Directors' Report and Audited Financial Statements 31 December 2016") () Directors' Report and Audited Financial Statements 31 December 2016 () STATUTORY FINANCIAL STATEMENTS - 31 DECEMBER 2016 INDEX PAGES DIRECTORS' REPORT 1-8 STATEMENT BY DIRECTORS 9 STATUTORY DECLARATION
() Directors' Report and Audited Financial Statements 31 December 2016 () STATUTORY FINANCIAL STATEMENTS - 31 DECEMBER 2016 INDEX PAGES DIRECTORS' REPORT 1-8 STATEMENT BY DIRECTORS 9 STATUTORY DECLARATION
There have been no significant changes in the nature of the activities of the Group and of the Company during the financial year.
 Financial Statements 2 Directors Report 6 Statements by Directors 6 Statutory Declaration 7 Independent Auditors Report 9 Income Statements 10 Balance Sheets 12 Consolidated Statement of Changes in Equity
AMMETLIFE INSURANCE BERHAD
 AMMETLIFE INSURANCE BERHAD (15743 - P) Unaudited Condensed Interim Financial Statements for the six months ended 30 September 2017 CONTENTS PAGE Unaudited Interim Statements of Financial Position 1 Unaudited
MUAR BAN LEE GROUP BERHAD (Company No: P) (Incorporated in Malaysia) REPORTS AND FINANCIAL STATEMENTS 31 DECEMBER 2017
 (Incorporated in Malaysia) REPORTS AND FINANCIAL STATEMENTS 31 DECEMBER 2017") MUAR BAN LEE GROUP BERHAD (Company No: 753588-P) (Incorporated in Malaysia) REPORTS AND FINANCIAL STATEMENTS 31 DECEMBER 2017 Registered office: 85, Lebuh Muntri 10200 Penang Principal place of business:
MUAR BAN LEE GROUP BERHAD (Company No: 753588-P) (Incorporated in Malaysia) REPORTS AND FINANCIAL STATEMENTS 31 DECEMBER 2017 Registered office: 85, Lebuh Muntri 10200 Penang Principal place of business:
Company No.: W. RAMCOSYSTEMS SDN. BHD. (Incorporated in Malaysia)
") Company No.: 342313W RAMCOSYSTEMS SDN. BHD. (Incorporated in Malaysia) FINANCIAL STATEMENTS FOR THE YEAR ENDED 31 MARCH 2017 Company No.: 342313W 1 RAMCOSYSTEMS SDN. BHD. (Incorporated in Malaysia) DIRECTORS'
Company No.: 342313W RAMCOSYSTEMS SDN. BHD. (Incorporated in Malaysia) FINANCIAL STATEMENTS FOR THE YEAR ENDED 31 MARCH 2017 Company No.: 342313W 1 RAMCOSYSTEMS SDN. BHD. (Incorporated in Malaysia) DIRECTORS'
SUMMARY OF SIGNIFICANT ACCOUNTING POLICIES For the financial year ended 31 December 2013
 Unless otherwise stated, the following accounting policies have been applied consistently in dealing with items that are considered material in relation to the financial statements. These policies have
Continuing operations Revenue 3(a) 464, ,991. Revenue 464, ,991
 464, ,991. Revenue 464, ,991") STATEMENT OF PROFIT OR LOSS For the year ended 30 June 2017 Consolidated Consolidated Note Continuing operations Revenue 3(a) 464,411 323,991 Revenue 464,411 323,991 Other Income 3(b) 4,937 5,457 Share
STATEMENT OF PROFIT OR LOSS For the year ended 30 June 2017 Consolidated Consolidated Note Continuing operations Revenue 3(a) 464,411 323,991 Revenue 464,411 323,991 Other Income 3(b) 4,937 5,457 Share
FOR THE FINANCIAL YEAR ENDED 31 DECEMBER 2017
 RHB INVESTMENT BANK BERHAD () Company No. 19663-P STATUTORY FINANCIAL STATEMENTS FOR THE FINANCIAL YEAR ENDED 31 DECEMBER 2017 CORPORATE INFORMATION BOARD OF DIRECTORS Tan Sri Azlan bin Mohd Zainol Chin
Report of the Directors Statements of Comprehensive Income Statements of Financial Position
 Financial Statements For the year ended 31 December Contents Report of the Directors 130-135 Statements of Comprehensive Income 136-137 Statements of Financial Position 138-139 Consolidated Statements
Nigerian Aviation Handling Company PLC
 Nigerian Aviation Handling PLC Financial Statements -- Q1 2018 Nigerian Aviation Handling PLC Consolidated Statement of Comprehensive Income 1 Consolidated Statement of Financial Position 2 Statement of
Notes to the Financial Statements For the financial year ended 31 December 2016
 Notes to the Financial Statements For the financial year ended These notes form an integral part of the financial statements. The financial statements for the financial year ended were authorised for issue