Financial Results Q4 FY & FY May 13, 2016
|
|
|
- Isabel Osborne
- 5 years ago
- Views:
Transcription
1 Financial Results Q4 FY & FY May 13, 2016
2 Table of Contents #1 Story of Transformation #2 Business Performance #3 Financials 2
3 Structural Transformation 3
")
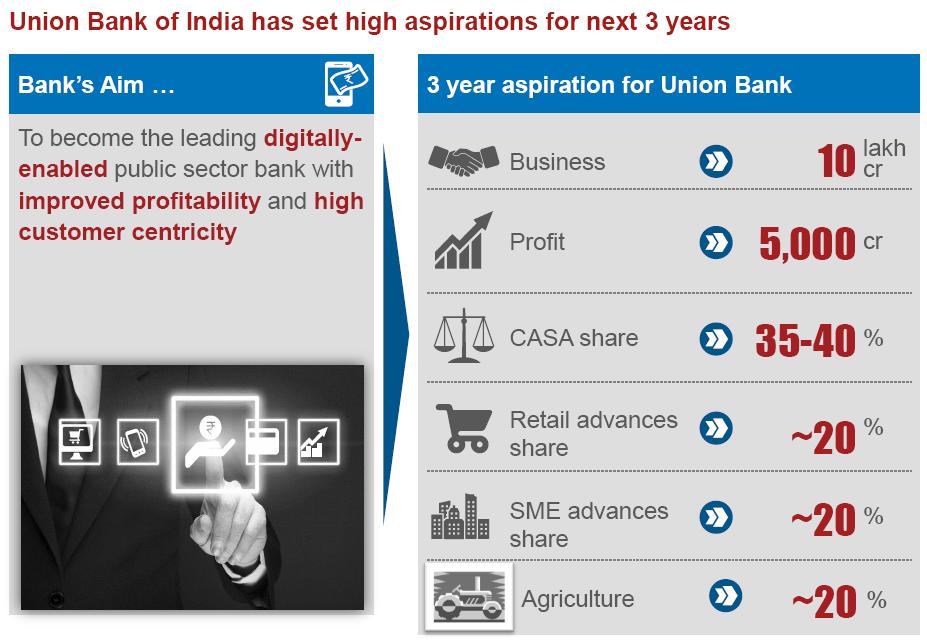
4 Structural Transformation Medium Term Strategy: The HDR (Human Resources, Digital Banking & Risk Management) Framework 4

5 Structural Transformation Story of Transformation: Project Utkarsh 5
6 Structural Transformation 6

7 Structural Transformation: Impact Story of Transformation: Project Utkarsh 7
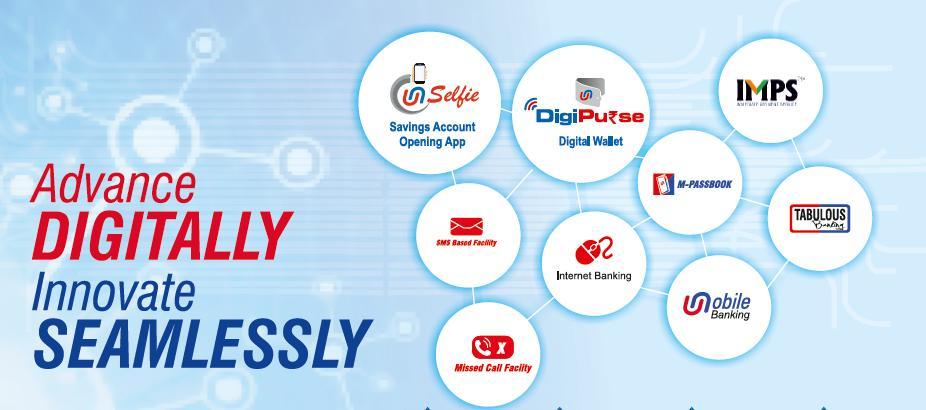
8 Structural Transformation: Impact Transaction through Alternate Channels (%) Mar/15 Jun/15 Sep/15 Dec/15 Mar/ Debit Card Base (Lakh) Internet Banking User (Lakh) Mobile Banking User (Thousands) Mar/15 Jun/15 Sep/15 Dec/15 Mar/16 Mar/15 Jun/15 Sep/15 Dec/15 Mar/16 Mar/15 Jun/15 Sep/15 Dec/15 Mar/16 8
9 Table of Contents #1 Story of Transformation #2 Business Performance #3 Financials 9
10 Performance Highlights Business Global Business increased by 7.0% to ` crore CASA Share improved by 310 bps over Mar RAM segment share in domestic advances increased to 52.4% Non Interest Income Non Interest Income for FY16 up 3.1% to ` 3632 crore; Net Profit Efficiency Asset Quality Capital Adequacy Net profit for FY16 stood at ` 1352 crore; Net Profit for Q4/FY16 stood at ` 97crore, up by 24% over Dec-15 quarter. ROA sequentially improved to 0.10% (Q4/FY16)from 0.08% (Q3/FY16) ; ROA for FY 16 stood at 0.35%; ROE sequentially improved to1.95% (Q4/FY16)from 1.53% (Q3/FY16); ROE for FY 16 stood at 6.84%. Gross NPA (%) and Net NPA (%) stood at 8.70% and 5.25% respectively. Capital Adequacy Ratio at 10.56%; CET 1 Ratio at 7.95%. 10
11 Strong Liability Franchise Parameters Mar 2015 Dec 2015 Mar 2016 Growth (%) (` crore) Y-o-Y Q-o-Q Total Deposits Domestic Overseas Current Deposits Savings Deposits CASA The Bank activated 4.3 lakh Dormant accounts during Q4 of FY In addition, the Bank added lakh CASA accounts during March 2016 Quarter. CASA Ratio (%) Shedding High Cost Deposits (% share in Total Deposits) Mar/15 Jun/15 Sep/15 Dec/15 Mar/16 Mar/15 Mar/16 11
12 RAM Led Advances Parameters Mar Dec Mar Growth (%) (` crore) Y-o-Y Q-o-Q Gross Advances Domestic Overseas Retail Advances Agriculture MSME Priority Sector Performance Parameters Mar 2015 % to ANBC Mar 2016 % to ANBC (` crore) Total Priority Agriculture Priority* Small & Marginal Farmers MSME Priority NA NA Micro Enterprises Women Beneficiaries Weaker Section * including investment in funds with NABARD 12

 18.9 Vehicle Loans 77.4 7.5 59.4 Education Loans 75.7 76.0 75.")
13 RAM Led Advances 24.0 Advances RAM Segment Annual Growth (%) RAM Share (%) in Domestic Advances Mar/15 Jun/15 Sep/15 Dec/15 Mar/16 Mar/15 Jun/15 Sep/15 Dec/15 Mar/ Home Loans Advances RWA to Gross Advances (%) 18.9 Vehicle Loans Education Loans Mortgage Loans 74.3 Mar-16 Others Composition of Retail Portfolio Mar/15 Jun/15 Sep/15 Dec/15 Mar/16 13
14 Advances Top Exposures Sl. Sectors Top 10 Sectors (% Share in Domestic Advances) Amount ( ` crore) Mar 2015 Dec 2015 Mar 2016 Mar Agriculture Retail Advances Infrastructure Trade NBFCs and HFCs Basic Metal Products Textiles Food Processing Construction Gems & Jewellery
15 Investment Investment ` Crore Mar/15 Dec/15 Mar/16 (` crore) Mar-16 % to Total Duration (Years) Mar-16 Held to Maturity Held for Trading Available for Sale Total Investment % of AFS & HFT portfolio is interest sensitive 15
 Business from Overseas Branches Business 4.2 billion (26074) Total Deposits Mar-15 Dec-15 Mar-16* Growth (%) YoY- US$ 0.7 billion (4640) 5.0 billion (32927) 1.")
16 Rising Overseas Profile Opened its 4 th overseas branch in Sydney, Australia Already has three Overseas branches at Hong Kong, DIFC (Dubai) & Antwerp (Belgium) Representative offices at Shanghai, Beijing, and Abu Dhabi US $ (` crore) Business from Overseas Branches Business 4.2 billion (26074) Total Deposits Mar-15 Dec-15 Mar-16* Growth (%) YoY- US$ 0.7 billion (4640) 5.0 billion (32927) 1.0 billion (6398) 4.9 billion (32706) 1.0 billion (6634) Union Bank of India (UK) Limited (a wholly-owned subsidiary of the Bank in London) Total Advances 3.4 billion (21434) *1 US$= ` as on Mar 31, billion (26529) 3.9 billion (26072)
17 LIABILITIES As at As at As at Growth (%) Y-o-Y Q-o-Q Capital Reserves and surplus Deposits Borrowings Other Liabilities and Provisions Total ASSETS Statement of Assets & Liabilities (` crore) Cash and Balances with Reserve Bank of India Balances with Banks and Money at call and Short Notice Investments Advances Fixed Assets Other Assets Total
18 Table of Contents #1 Story of Transformation #2 Business Performance #3 Financials 18
19 Cost & Yield Ratio Parameters (%) Mar-15 (Q4) Dec-15 (Q3) Mar-16 (Q4) FY 15 FY16 Domestic Global Domestic Global Domestic Global Domestic Global Domestic Global Cost of Deposit Cost of Funds Yield on Advances Yield on Funds Yield on Investment NIM
20 Non-Interest Income (` crore) Parameters Mar-15 (Q4) Dec-15 (Q3) Mar-16 (Q4) Growth (%) Y/Y Growth (%) Q/Q FY 15 FY 16 Growth (%) a. Core Non Interest Income b. Treasury Income W/w Profit on Sale of Investments Exchange Profit c. Recovery in Written off Accounts Total
21 Parameters Mar-15 Dec-15 Mar-16 Growth (%) Y/Y Operating Profit Growth (%) Q/Q (` crore) FY15 FY16 Growth (%)-Y/Y Interest Income Interest Expenditure Net Interest Income Non Interest Income Operating Expenses -Establishment Expenses -Other Expenses Operating Profit
22 Provisions (` crore) Parameters Mar-15 (Q4) Dec-15 (Q3) Mar-16 (Q4) FY15 FY16 NPAs Standard Assets Depreciation on Investment Shifting Loss Restructured Advances Others (FITL etc) Taxation Total
23 Net Profit ` crore Quarter 1782 Full Year Mar/15 Dec/15 Mar/16 FY FY
24 Efficiency/ Profitability Ratios Sl. Efficiency Parameters Mar-15 (Q4) Dec-15 (Q3) Mar-16 (Q4) FY 15 FY 16 1 Return on Avg. Assets (%) Return on Equity (%) Cost to Income Ratio (%) Book Value Per Share (`) Earnings per share (`) Sl. Profitability Parameters Mar-15 (Q4) Dec-15 (Q3) Mar-16 (Q4) FY 15 FY 16 1 Business per Branch ` crore Business per Employee ` crore Gross Profit per Branch ` crore Gross Profit per Employee ` lakh Net Profit per Branch ` lakh Net Profit per Employee ` lakh
25 Asset Quality (` crore) Parameters Mar-15 (Q4) Dec-15 (Q3) Mar-16 (Q4) FY 15 FY 16 Gross NPAs - Opening Add : Additions Less : Reductions Recoveries Upgradation Write Off Gross NPAs- Closing Gross NPA (%) Net NPA Net NPA (%) Provision Coverage Ratio (%) Credit Cost (%)
26 Asset Quality: Sectoral (` crore) Sectors Slippages During Q4 FY 16 NPAs March 2016 % to Total NPAs Mar 2015 % to Sector Loan Sep 2015 Dec 2015 Mar 2016 Agriculture Micro & Small (MSE) Retail Loans Others Total
27 Mar-16 (Q4) FY Particulars Standard NPA Total Standard NPA Total Restructured Assets as on (January 1, 2016/April 1, 2015) Fresh Restructuring during the (Quarter/ Year) Upgradation to Restructured Accounts during the (Quarter/ Year) Restructured Standard Advances which cease to attract higher provisioning and need not be shown as Restructured Assets (Quarter/ Year) Restructured Assets (` crore) Down gradation of restructured accounts during the (Quarter/ Year) Change in Outstanding/Write-off/ Recovery/Closures (Quarter/ Year) Restructured Accounts as on March 31, * * Outstanding Standard Restructured Assets excluding SEBs as % to Gross Advances: 2.6% * ` 9055 crore is included in Gross NPAs of the Bank 27
28 Sector wise Standard Restructured Accounts Sector Amt. % to Standard Restructured 1 Infrastructure (` crore) a. Power w/w SEBs Engineering Iron & Steel Textiles Hotel Amt % to Standard Restructured Advances % to Gross Loans Outstanding Standard Restructured Assets W/w -SEBs Stalled Projects
29 Basel III: Capital Adequacy CRAR Tier I Tier II Mar/15 Jun/15 Sep/15 Dec/15 Mar/16 (` crore) Mar 2015 Jun 2015 Sep 2015 Dec 2015 Mar 2016 Risk Weighted Assets Capital Funds CRAR-BASEL III ( % ) CET Ratio (%)
 Mar/15 Dec/15 Mar/16 8.58% 18.04% 18.27% 12.68% 8.49% 8.75% 17.19% 10.03% Mar/15 10.61% Dec/15 Govt.")
30 Shareholding Details Share Capital `687.4 crore No. of Equity Shares: 68.7 crore Net worth: ` crore Book Value per share ` Return on Equity 6.84% Market Cap ` 8992 crore 63.44% 63.44% 60.47% Shareholding Pattern (%) Mar/15 Dec/15 Mar/ % 18.04% 18.27% 12.68% 8.49% 8.75% 17.19% 10.03% Mar/ % Dec/15 Govt. of India FIIs DIIs Mar/16 Public & Others 30
 (139) Gujarat (263) (390) Goa (15) (19) Rajasthan (140) (173) Kerala (243) (347) Jammu & Kashmir (13) (16) Maharashtra (508) (1178) Madhya Pradesh (282) (655) Telangana (80) (146) Andhra")
 Bihar (150) (164) Jharkhand (84) (94) Orissa (127) (142) Pondicherry (4) (6) Andaman & Nicobar (1) (1) Meghalaya (5) (5) Sikkim (8) (8) Assam (68) (96) West Bengal (181) (283) Arunachal Pradesh")
31 Extensive & specialized distribution network focused on the needs of the different business segments Dadra, Nagar Haveli (1) (3) Daman & Diu (1) (2) Chandigarh (10) (21) Punjab (139) (171) Haryana (110) (139) Gujarat (263) (390) Goa (15) (19) Rajasthan (140) (173) Kerala (243) (347) Jammu & Kashmir (13) (16) Maharashtra (508) (1178) Madhya Pradesh (282) (655) Telangana (80) (146) Andhra Pradesh (172) (380) Karnataka (161) (311) Tamil Nadu (230) (388) Himachal Pradesh (20) (30) Delhi (95) (245) Uttar Pradesh (928) (1367) # Domestic Branches (4,196) # ATMS (6883) Uttarakhand (82) (131) Bihar (150) (164) Jharkhand (84) (94) Orissa (127) (142) Pondicherry (4) (6) Andaman & Nicobar (1) (1) Meghalaya (5) (5) Sikkim (8) (8) Assam (68) (96) West Bengal (181) (283) Arunachal Pradesh (1) (1) Tripura (7) (10) Nagaland (1) (1) Manipur (1) (1) Mizoram (1) (2) Extensive network across India Branch Distribution by Urbanization Rural 31% 61% branches in rural/semi-urban markets Branch Distribution by Geography Weatern 18.8% Southern 21.3% Semi Urban 30% Northen 12.6% Central 32.3% Urban 21% Eastern 13.1% Metro 18% N.Eastern 2.0% Geographical diversification minimizes regional risks Opened 4 th Overseas branch in Sydney, Australia during Q4 FY Overseas branches at Hong Kong, Dubai and Antwerp, in addition to representative offices in Shanghai, Beijing, and Abu Dhabi. Operates in the UK through its wholly owned subsidiary, Union Bank of India (UK) Ltd. The Bank has 31 extension counters, 60 satellite offices and 47 service branches in addition to its regular bank branches as of March

32 Financial Inclusion Progress under Pradhan Mantri Jan Dhan Yojana (PMJDY) Parameters Achievements of the Bank Villages covered Sub Service Areas 5407 Urban Wards 2581 Accounts opened till March 31, Lakh Deposits ` 858 Crore RuPay Cards issued 55.3 Lakh Aadhar Seeding 17.4 Lakh Progress under PMSBY, PMJJBY and APJ Schemes Scheme Name Total Enrolments Pradhan Mantri Suraksha Bima Yojana (PMSBY) Lakh Pradhan Mantri Jeevan Jyoti Bima Yojana (PMJJBY) Lakh Atal Pension Yojana (APJ) 0.53 Lakh Progress under Mudra Yojana Category No. of Account Sanctioned amount Outstanding amount (` crore) (` crore) Shishu (< ` 50k) Kishor (Above ` 50k-5 Lakh) Tarun (Above ` 5 Lakh-10 Lakh) Total

33 Awards & Recognition 1 st Best Corporate Vigilance Excellence Award ( ) in corporate category in 7th Conclave of Vigilance Officers Golden Peacock Award for excellence in HR practice in 10 th International Conference on Corporate Social Responsibility. Skoch Financial Inclusion and Deepening Award 2015 CNBC TV 18 Financial Advisors Awards in Best PSU Banks MSME Banking Excellence Awards 2015 from Chamber of Indian Micro Small & Medium Enterprises (CIMSME) 1. Best Bank Award for Promotional Schemes Winner 2. Best Bank Award for Mudra Yojna - Runner Up elets Awards 2015 for Multi Channel Payment Solution (IMPS) from elets Technomedia Pvt. Ltd. SKOCH order of Merit Awards 2015 for: 1. ekyc implementation 2. Financial Inclusion Technology 3. Kendriya Vidayalaya Fee Collection NPCI Award 2015 under: 1. Special category for implementation of IMPS through branches 2. Recognition Award 2015 in issuance of RuPay cards National Award for Innovative Training Practices" (Second Prize for ) by Indian Society for Training & Development (ISTD) Excellence in Innovation Award 2015 for implementation of M Passbook from Financial Insights, International Data Corporation (IDC) ICT4 Development Awards 2015 from ASSOCHAM in the areas of Green IT (Tabulous Banking, ekyc application, and M Passbook application 33
34 Disclaimer Except for the historical information contained herein, statements in this presentation which contain words or phrases such as is, aims, will, would, indicating, expected to etc., and similar expressions or variations of such expressions may constitute forward-looking statements. These forward-looking statements involve a number of risks, uncertainties and other factors that could cause actual results to differ materially from those suggested by the forward looking statements. These risks and uncertainties include, but are not limited to our ability to successfully implement our strategy, future levels of non-performing loans, our growth and expansion in business, the impact of any acquisitions, the adequacy of our allowance for credit losses, technological implementation and changes, the actual growth in demand for banking products and services, investment income, cash flow projections, our exposure to market risks as well as other risks. Union Bank undertakes no obligation to update forward-looking statements to reflect events or circumstances after the date thereof. 34


35 Investor queries:
Financial Results Q1 FY July 28, 2015
 Financial Results Q1 FY 2015-16 July 28, 2015 A Step Towards Digitalization 2 Performance Highlights Business Opex Profitability Global Business increased by 8.6% to ` 582817 crore Savings Deposits grew
Financial Results Q2 & H1 FY November 06, 2015
 Financial Results Q2 & H1 FY 2015-16 November 06, 2015 Highest Gainer in Brand Value Brand value rises 72% on accelerated digitalization efforts. 2 Structural Transformation Initiative 3 Performance Highlights
Financial Results. Q3 FY15 & Nine-months ended December th January 2015
 Financial Results Q3 FY15 & Nine-months ended December 27 th January 2015 1 Highlights Capital CRAR (Basel III) at 10.30%; CET 1: 7.02% Margin Domestic NIM stable at 2.6% Fee Income Core Fee Income up
Financial Results. 31st March Reorienting towards retail business and recovery for a sustained path of growth and profitability.
 Get Instant Loan Approval!!! Financial Results 31st 2016 Get Instant Loan Approval!!! CANARA BANK MULTI CURRENCY TRAVEL PREPAID CARD Reorienting towards retail business and recovery for a sustained path
Financial Results Q3/FY February 2019
 Financial Results Q3/FY18-19 08 February 2019 HIGHLIGHTS - DEC 2018 Total Business Total Deposit Gross Advance Operating Profit (Q-3) Rs. 291519 Crore Rs. 177906 Crore Rs.113610 Crore Rs. 381 Crore Basel
Press Release
 ---------------------------------------------------------------------------------------------------- Press Release Financial Results for the Quarter and Financial Year ended March 31, 2017 The Board of
Press Release
 ---------------------------------------------------------------------------------------------------- Press Release Financial Results for the quarter and half year ended September 30, 2017 The Board of
Financial Results. 30th September Reorienting towards retail business and recovery for a sustained path of growth and profitability.
 Get Instant Loan Approval!!! Financial Results 30th September 2016 Get Instant Loan Approval!!! CANARA BANK MULTI CURRENCY TRAVEL PREPAID CARD Reorienting towards retail business and recovery for a sustained
Press Release
 ---------------------------------------------------------------------------------------------------- Press Release Financial Results for the Quarter and Nine Months Ended December 31, 2017. The Board of
Corporate Presentation. February 2015
 Corporate Presentation February 2015 Disclaimer This document does not constitute or form part of and should not be construed as an offer to sell or issue or the solicitation of an offer to buy or acquire
Q4 FY 13. Investor Information
 Q4 FY 13 Investor Information Key Messages : FY 13 Retail Advance grew by 25.47% (12.58%) SME Advance grew by 22.44% (9.49%) Retail & SME Customer base increased by 79.8% in 12 months (32.90%) Other Income
Growth Powered by Technology, Driven by Customers. Financial Results 31 st March 2017
 Financial Results 31 st March 2017 Performance Highlights Q4 FY 2016-17 NET INTEREST INCOME ` 989.49 cr NON INTEREST INCOME ` Rs.450.16 cr OPERATING PROFIT ` Rs.703.12 cr NET PROFIT ` 203.99 cr NET INTEREST
Un-Audited/ Reviewed Financial Results For the Quarter ended June 30,2018
 Un-Audited/ Reviewed Financial Results For the Quarter ended June 30,2018 1 BUSINESS PROFILE 200000 150000 100000 50000 0 Advances Deposit Business June-17 March-18 June-18 Parameter June 17 Mar 18 June
154 years in service of the Nation and going strong
 Financial Results Q4 & Welcome Board of Directors 11 th May 2018 154 years in service of the Nation and going strong The Bank s Key Strengths Robust CASA Stable Operating Profit Young & energetic workforce
Investor Presentation
 FINANCIAL RESULTS FOR THE QUARTER & NINE-MONTH ENDED DEC 2013 Investor Presentation UCO BANK 1 BANKS OPERATING ENVIRONMENT Positives in Q3: Improving liquidity situation Ebbing stress on cost of funds
Page 1
 Page 1 HIGHLIGHTS MARCH 2015 Major HIghlights Net profit at 2703 crore, up by 10.8% y.o.y. Gross profit at 6950 crore, up by 2.3% y.o.y. Total provisions at 4248 crore compared to 4358 crore in FY14 Non-interest
Financial Highlights FY
 Financial Highlights FY 2014-15 Corporation Bank was founded in the Year 1906 in Udupi a small town in South India Nationalized in the year 1980 and went public in 1998 The Bank holds a unique record of
Investor Presentation March-2014
 Investor Presentation March-2014 1 IMPORTANT NOTICE No representation or warranty, express or implied is made as to, and no reliance should be placed on, the fairness, accuracy, completeness or correctness
Analyzing Data of Pradhan Mantri Jan Dhan Yojana
 Technical Report 217 Analyzing Data of Pradhan Mantri Jan Dhan Yojana Tulika Dutta and Ashish Das Department of Mathematics Indian Institute of Technology Bombay Mumbai-476, India May 217 Indian Institute
Financial Results Q4-10 & FY Analyst Presentation
 Financial Results Q4-10 & FY 2010 Analyst Presentation 6th May, 2010 HIGHLIGHTS OF BUSINESS GROWTH Total Business increased from Rs.236968 Cr. to Rs.291289 Cr. an increase of 22.92% Total Deposits registered
Q2 FY 12 INVESTOR PRESENTATION
 Q2 FY 12 INVESTOR PRESENTATION PERFORMANCE HIGHLIGHTS Profitability Measure ROA 1.34 1.15 1.44 11.48% 11.28% 14.29% Shareholder Value Measure ROE 38.60% 38.91% Efficiency Measure COST-INCOME 33.90% 0.68
Investor Presentation Q3 FY 12
 Investor Presentation Q3 FY 12 Performance Highlights Profitability Measure ROA 1.30 1.44 1.41 11.37 14.29 14.56 Shareholder Value Measure ROE 37.30 38.91 37.13 Efficiency Measure COST-INCOME 0.81 0.58
The Bank that begins with. Financial Results Q-3 / FY
 The Bank that begins with Financial Results Q-3 / FY 2017-18. Results at a Glance Q-3(FY 2017-18). Performance Parameter (Rs/Cr) Q3-18 Ratio for Q-3 (in %) Q3-18 Operating Profit 182 Return on Assets -1.82
The Bank that begins with. Financial Results Q-4 / FY ( )
") The Bank that begins with Financial Results Q-4 / FY (2014-15 ) Result at A Glance. Performance Parameter Rs. crore Ratio for 2014-15 (in %) Net Profit 256 Return on Assets 0.21% Operating Profit 2428
The Bank that begins with Financial Results Q-4 / FY (2014-15 ) Result at A Glance. Performance Parameter Rs. crore Ratio for 2014-15 (in %) Net Profit 256 Return on Assets 0.21% Operating Profit 2428
Investor Presentation
 Investor Presentation 31.12.2016 Awards and Accolades IDRBT Award for the Best Bank Among Small Banks for Digital Banking, 2015-16 on 18.07.2016 IDRBT Award for the Best Bank Among Small Banks for Managing
International Journal for Research in Applied Science & Engineering Technology (IJRASET) Status of Urban Co-Operative Banks in India
 Status of Urban Co-Operative Banks in India") Status of Urban Co-Operative Banks in India Siddhartha S Vishwam 1, Dr. B. S. Chandrashekar 2 1 Research Scholar, DOS in Economics and Co-operation, University of Mysore, Manasagangothri, Mysore 2 Assistant
Status of Urban Co-Operative Banks in India Siddhartha S Vishwam 1, Dr. B. S. Chandrashekar 2 1 Research Scholar, DOS in Economics and Co-operation, University of Mysore, Manasagangothri, Mysore 2 Assistant
INVESTOR PRESENTATION FEDERAL BANK
 INVESTOR PRESENTATION FY 2010-11 Fourth Quarter & Annual Results as on 31.03.2011 PERFORMANCE HIGHLIGHTS Q4 FY 11 FY 2011 (YOY growth) (YOY growth) Net Interest Income Fee Income Total Income Net Profit
Investor Presentation Sept-2014
 Investor Presentation Sept-2014 1 IMPORTANT NOTICE No representation or warranty, express or implied is made as to, and no reliance should be placed on, the fairness, accuracy, completeness or correctness
Tweets UnionBankInsta UnionBankofIndiaUtube
 Investor Presentation @unionbankofficial @UnionBank Tweets UnionBankInsta UnionBankofIndiaUtube These materials have been prepared by Union Bank of India together with its subsidiaries (the Bank ), are
PROGRESS AT A GLANCE (Rs. in Crore)
") PRESS RELEASE 16.05.2017 MARCH 17 QUARTER PERFORMANCE HIGHLIGHTS Business Performance Growth in Key Parameters (Mar 16 Mar 17) Business grew by 9.3% - from Rs. 310673 Cr to Rs. 339673 Cr. Total Deposits
PRESS RELEASE 16.05.2017 MARCH 17 QUARTER PERFORMANCE HIGHLIGHTS Business Performance Growth in Key Parameters (Mar 16 Mar 17) Business grew by 9.3% - from Rs. 310673 Cr to Rs. 339673 Cr. Total Deposits
HIGHLIGHTS OF WORKING RESULTS
 1 HIGHLIGHTS OF WORKING RESULTS 2 Business Global Business at ` 4,96,122 Crore. Grew by 6% (Y-o-Y) Global Advances at ` 2,23,346 Crore. Grew by 8%(Y-o-Y) Income Net - Interest Income increased by 4% (Y-o-Y)
A Premier Public Sector Bank
 Sector Bank A Premier Public Sector Bank Performance highlights for the Quarter/ Year ended 31 st March, 2016. 1. Performance highlights of the Bank for the 12 months ended 31.03.2016: [Rs. in Crore] Parameter
Investor Presentation June-2014
 Investor Presentation June-2014 1 IMPORTANT NOTICE No representation or warranty, express or implied is made as to, and no reliance should be placed on, the fairness, accuracy, completeness or correctness
FINANCIAL HIGHLIGHTS FOR THE 1 ST QUARTER ENDED 30 TH JUNE 2018
 FINANCIAL HIGHLIGHTS FOR THE 1 ST QUARTER ENDED 30 TH JUNE 2018 PERFORMANCE HIGHLIGHTS- FY 20 Total Business of the Bank increased to Rs. 4,68,535 crore as at June 30, 2018 compared to Rs. 4,66,360 crore
Post and Telecommunications
 Post and Telecommunications This section presents operating and financial data relating to the different branches of the Department of Posts including the Post Office Savings Banks. It comprises statistics
JOINT STOCK COMPANIES
 This section contains statistics relating to joint stock companies which are based on returns received from Registrars of Joint Stock Companies. Tables 25.1 (A) (B) to 25.4 These tables present data regarding
INVESTOR PRESENTATION FEDERAL BANK FY
 INVESTOR PRESENTATION FY 2010-11 Second Quarter Results as on 30.09.2010 PERFORMANCE HIGHLIGHTS (Q2 FY 2011 vs Q2 FY 2010) Net Interest Income up by 32.86 % from Rs.329.95 Cr to Rs.438.37 Cr Operating
Performance During Q4 : FY17-18 * ENABLING THE STAR TO SHINE *
 Performance During Q4 : FY17-18 * ENABLING THE STAR TO SHINE * PERFORMANCE AT A GLANCE Q4 FY18 Parameter Rs. Crore Y-o-Y (%) Growth Business 896,850-3.96 Total Deposits 520,854-3.55 Gross Advances 375,995-4.52
HIGHLIGHTS OF WORKING RESULTS
 1 HIGHLIGHTS OF WORKING RESULTS 2 Business Global Business at ` 4,67,626 Crore Savings Deposits grew by 23% (Y-o-Y) Income Non - Interest Income increased by 38% (Y-o-Y) Profit Advances Consistent and
Van 4to Indian Bank. Corporate Office Investor Services Cell , Avvai Shanmugam Salai Royapettah Chennai
 411 Van 4to Indian Bank FAX :28134075 PHONE : 28134076 E-mail : investorsaindianbank.co.in Corporate Office Investor Services Cell 254-260, Avvai Shanmugam Salai Royapettah Chennai 600 014 Ref : ISC /
Audited Financial Results. For Q / FY. March, 2015
 Audited Financial Results For Q / FY March, 2015 1 BUSINESS PROFILE 200000 150000 100000 50000 0 Advances Business Mar-13 Mar-14 Mar-15 Parameter Mar 13 Mar 14 Mar 15 Y-o-Y % Growth Gross Advances 66,457
FINANCIAL HIGHLIGHTS FOR THE QUARTER ENDED
 FINANCIAL HIGHLIGHTS FOR THE QUARTER ENDED 30 th JUNE 2015 PERFORMANCE HIGHLIGHTS- FY 20 Total Business of the Bank increased to Rs. 4,51,739 crore from Rs. 4,26,829 crore in June 2014, recording Y-o-Y
Customers perception on Pradan Manthri Jan Dhan Yojana in Shivamogga District of Karnataka State, India.
 Customers perception on Pradan Manthri Jan Dhan Yojana in Shivamogga District of Karnataka State, India. by Mr. Anand M B [a] & Dr. H H Ramesh [b] Abstract Government is responsible for end financial untouchability,
Financial Results for Quarter/ Financial Year ended 31 st March 2018 SMALL STEPS TOWARDS BIG CHANGE
 Financial Results for Quarter/ Financial Year ended 31 st March 2018 SMALL STEPS TOWARDS BIG CHANGE Performance Highlights Assets, Liabilities & Business Overview Loans & Advances Asset Quality Investments
FINANCIAL HIGHLIGHTS FOR THE QUARTER / NINE MONTHS ENDED
 FINANCIAL HIGHLIGHTS FOR THE QUARTER / NINE MONTHS ENDED 31 ST DECEMBER 2015 PERFORMANCE HIGHLIGHTS- / 20 Total Business of the Bank increased to Rs. 4,59,266 crore from Rs. 4,41,510 crore in December
FOREWORD. Shri A.B. Chakraborty, Officer-in-charge, and Dr.Goutam Chatterjee, Adviser, provided guidance in bringing out the publication.
 FOREWORD The publication, Basic Statistical Returns of Scheduled Commercial Banks in India, provides granular data on a number of key parameters of banks. The information is collected from bank branches
Financial Performance For the Quarter/ Nine Months Ended 31ST DEC. 2017
 Financial Performance For the Quarter/ Nine Months Ended 31ST DEC. 2017 12th FEBRUARY 2018 1 Corporation Bank was founded in the Year 1906 in Udupi a small town in South India Nationalized in the year
FINANCIAL INCLUSION: PRESENT SCENARIO OF PRADHAN MANTRI JAN DHAN YOJANA SCHEME IN INDIA
 FINANCIAL INCLUSION: PRESENT SCENARIO OF PRADHAN MANTRI JAN DHAN YOJANA SCHEME IN INDIA *Dr. P. Chellasamy Associate Professor, School of commerce, Bharathiar University, Coimbatore. **Mr. R. Selvakumar
ANALYST S MEET. Performance Highlights For the Financial Year ended 31-March-2015
 ANALYST S MEET Performance Highlights For the Financial Year ended 31-March-2015 Sl. No. Areas of Presentation Slide No. 1 Highlights 3 2 Business Cross Section 4 3 Deposits 5 4 Domestic Advances 6 5 Infrastructure
FINANCIAL RESULTS HY 1 / Q2 FY 18
 1 FINANCIAL RESULTS HY 1 / Q2 FY 18 2 EMERGING ECONOMIC & BANKING SCENARIO Domestic Economy Reset in New Normal Govt s Mega Recapitalization Plan Improved Economic Macros Credit Growth shows green shoots
FINANCIAL HIGHLIGHTS FOR THE QUARTER / NINE MONTHS ENDED
 FINANCIAL HIGHLIGHTS FOR THE QUARTER / NINE MONTHS ENDED 31 ST DECEMBER 2014 PERFORMANCE HIGHLIGHTS- / 20 Total Business of the Bank increased to Rs. 4,41,510 crore from Rs. 4,12,164 crore in December
Domestic Branch Network
 Domestic Branch Network RURAL SEMI-URBAN URBAN METRO 20% 19% 20% 41% Branches 2716 Rural-1105 S-Urban-553 Urban-551 Metro-507 3000 2500 2000 1500 Branches 2415 2259 2286 2716 2516 FY'09 FY'10 FY'11 FY'12
isyndicateb ank has W13? W37 i3v7sl'llnvestor Relations Centre m 30$?)- 351m:
- 351m:") 2"d aria: mm am, has 560009 351m: 080-22283030 amt: 080-22283030 m 30$?)- inrc@syndlicatebank.co.in fi- F: 5 _ ' \ isyndicateb ank SyndicateBank,Corporate Office 2" Cross, Gandhi Nagar, Bengaluru - 560009
2"d aria: mm am, has 560009 351m: 080-22283030 amt: 080-22283030 m 30$?)- inrc@syndlicatebank.co.in fi- F: 5 _ ' \ isyndicateb ank SyndicateBank,Corporate Office 2" Cross, Gandhi Nagar, Bengaluru - 560009
FORM L-1-A : Revenue Account. FORM L-1-A : Revenue Account UP TO THE QUARTER ENDED ON JUNE Non Participating (Linked) Total
 Total") Insurer : DHFL Pramerica Insurance Company Limited Registration No. 140 ; Date of Registration with the IRDAI: June 27, 2008 Revenue Account For the quarter Ended June 30, 2017 FORM L-1-A : Revenue Account
Insurer : DHFL Pramerica Insurance Company Limited Registration No. 140 ; Date of Registration with the IRDAI: June 27, 2008 Revenue Account For the quarter Ended June 30, 2017 FORM L-1-A : Revenue Account
REPORT ON THE WORKING OF THE MATERNITY BENEFIT ACT, 1961 FOR THE YEAR 2010
 REPORT ON THE WORKING OF THE MATERNITY BENEFIT ACT, 1961 FOR THE YEAR 2010 1. Scope and Objective 1.1 The Maternity Benefit Act, 1961 extends to the whole of the Indian Union and applies to every factory,
Note on ICP-CPI Synergies: an Indian Perspective and Experience
 2 nd Meeting of the Country Operational Guidelines Task Force March 12, 2018 World Bank, Washington, DC Note on ICP-CPI Synergies: an Indian Perspective and Experience 1. Meaning and Scope 1.1 International
Performance Analysis:
 Performance Analysis: Q3 FY 2016 (April December 2015) February 13, 2016 2016 Bank of Baroda. All Rights Reserved 1 Bank of Baroda: Our Key Strengths Bank of Baroda is a 107 years old State-owned Bank
INVESTOR PRESENTATION MARCH 2012
 INVESTOR PRESENTATION MARCH 2012 South Indian Bank At A Glance 83 Years 700 663 `64136 Cr 27% 25% `401 Cr 3.10 % 14.00% 0.28% Number of years in banking business Number of branches Number of ATM s Business
... (Please leave one blank box between two words) 2. Permanent Account Number (PAN) of the person (see instructions)
 2. Permanent Account Number (PAN) of the person (see instructions)") FORM NO. 66 [See rule 114E of income-tax rules, 1962] Annual Information Return under section 285BA of the Income-tax Act, 1961 (PART-A) Please see the instructions and fill up relevant columns Name of
FORM NO. 66 [See rule 114E of income-tax rules, 1962] Annual Information Return under section 285BA of the Income-tax Act, 1961 (PART-A) Please see the instructions and fill up relevant columns Name of
Welcomes. Analyst Friends for the Presentation on
 Welcomes Analyst Friends for the Presentation on 2 To be a Bank of choice of every Indian & A Preferred banking partner Globally To achieve consistent growth in Business. To Endeavour for inclusive development.
State Government Borrowing: April September 2015
 November 5, 2015 Economics State Government Borrowing: April September 2015 State Development Loans (SDL) are debt issued by state governments to fund their fiscal deficit. States in India like the centre,
Performance highlights for the Quarter ended 30 th June 2016 Performance highlights of the Bank -June 16 [Q1] over June 15 [Q1]:
![Performance highlights for the Quarter ended 30 th June 2016 Performance highlights of the Bank -June 16 [Q1] over June 15 [Q1]:](/thumbs/92/109840252.jpg "Performance highlights for the Quarter ended 30 th June 2016 Performance highlights of the Bank -June 16 [Q1] over June 15 [Q1]:") Sector Bank Performance highlights for the Quarter ended 30 th June 2016 Performance highlights of the Bank -June 16 [Q1] over June 15 [Q1]: Parameter A Premier Public Sector Bank As at 30 June 15[Q1]
Sector Bank Performance highlights for the Quarter ended 30 th June 2016 Performance highlights of the Bank -June 16 [Q1] over June 15 [Q1]: Parameter A Premier Public Sector Bank As at 30 June 15[Q1]
4.4 Building Name 4.5 Block/Sector. 4.8 City 4.9 State Code (Refer to State Code in instructions)
") FORM No. 61A [See rule 114E] Annual Information Return under section 285BA of the Income -tax Act, 1961 (PART-A) Please see the instructions and fill up relevant columns 1. Name of the person (in block
FORM No. 61A [See rule 114E] Annual Information Return under section 285BA of the Income -tax Act, 1961 (PART-A) Please see the instructions and fill up relevant columns 1. Name of the person (in block
INVESTOR PRESENTATION DEC 2011
 INVESTOR PRESENTATION DEC 2011 South Indian Bank At A Glance 83 Years 674 614 `58884 Cr 27% 25% `280 Cr `102 Cr 3.05 % 12.03% 0.24% Number of years in banking business Number of branches Number of ATM
FINANCIAL HIGHLIGHTS FOR THE 4 TH QUARTER & FINANCIAL YEAR ENDED 31 ST MARCH 2018
 FINANCIAL HIGHLIGHTS FOR THE 4 TH QUARTER & FINANCIAL YEAR ENDED 31 ST MARCH 2018 PERFORMANCE HIGHLIGHTS- & 20 Total Business of the Bank improved to Rs. 4,72,323 crore in March 31, 2018 as against Rs.
Welcome to Analysts Meet
 PERFORMANCE HIGHLIGHTS For the Quarter Ended 30 th JUNE, 2013 Welcome to Analysts Meet 31 st July- 2013 Mumbai INDEX Sl. No. Slide Details Slide No. 1 Financial Highlights 4 2 Earnings Cross Section 5
Insolvency Professionals to act as Interim Resolution Professionals or Liquidators (Recommendation) Guidelines, 2018
 Guidelines, 2018") Insolvency Professionals to act as Interim Resolution Professionals or Liquidators (Recommendation) Guidelines, 2018 Provisions in the Insolvency and Bankruptcy Code, 2016 31 st May, 2018 1. Section 16(3)(a)
Insolvency Professionals to act as Interim Resolution Professionals or Liquidators (Recommendation) Guidelines, 2018 Provisions in the Insolvency and Bankruptcy Code, 2016 31 st May, 2018 1. Section 16(3)(a)
ROLE OF PRIVATE SECTOR BANKS FOR FINANCIAL INCLUSION
 270 ROLE OF PRIVATE SECTOR BANKS FOR FINANCIAL INCLUSION ABSTRACT DR. BIMAL ANJUM*; RAJESHTIWARI** *Professor and Head, Department of Business Administration, RIMT-IET, Mandi Gobindgarh, Punjab. **Assistant
Microfinance Industry Penetration in India: A State - wise Analysis in Context of Micro Credit
 24 Microfinance Industry Penetration in India: A State - wise Analysis in Context of Micro Credit Laxmi Devi, Assistant Professor, Gargi College, University of Delhi Umed Yadav, Student, Dept. of Commerce,
Performance Highlights for the year ended 31 st March, 2017.
 Sector Bank A Premier Public Sector Bank Performance Highlights for the year ended 31 st March, 2017. 1. Performance highlights of the Bank March 17 [Q4] over March 16[Q4]: [Rs. in Crore] As at As at Parameter
A Class 2 Digital Signature Certificate is available for download after verification based on a trusted and pre-verified database.
 S No. 1 2 3 4 5 New Description of Services DSC Class-2/2 Years/Signature DSC Class-2/ 2 Years/ Combo DSC Class-3/2 Years/Signature DSC Class-3/ 1 Year/ Combo DSC Class-3/ 2 Year/ Combo 6 DSC Token Legends
The Bank that begins with Financial Results Q1, F.Y
 The Bank that begins with Financial Results Q1, F.Y. 2012-13 Analyst Meet August 8 th, 2012 Performance Highlights Jun - 2011 Jun - 2012 Percent 153264 Total Business 130201 17.7 Deposit 77104 89639 16.3
AN EVALUATION OF FINANCIAL INCLUSION
 AN EVALUATION OF FINANCIAL INCLUSION 1 2 3 Mary Sunita Dutto, Namratha R D, Dr. R. Himachalapathy 1 Research Scholar, St. Joseph's College of Commerce, Bangalore 2 Research Scholar, St. Joseph's College
THE INDIAN HOUSEHOLD SAVINGS LANDSCAPE
 THE INDIAN HOUSEHOLD SAVINGS LANDSCAPE Cristian Badarinza National University of Singapore Vimal Balasubramaniam University of Oxford Tarun Ramadorai University of Oxford, CEPR and NCAER July 2016 Savings
Capital Adequacy Ratio (Basel III) Earnings Per share, Book Value Per Share & Share Holdings Pattern
 Earnings Per share, Book Value Per Share & Share Holdings Pattern") 1 Sl. No. Areas of Presentation Slide No 1 Highlights 3 2 Business Cross Section 4 3 Domestic CASA 5 4 Domestic Advances 6 5 Retail Credit Components 7 6 Industry & NBFC Exposure 8 7 Restructured Advances,
1 Sl. No. Areas of Presentation Slide No 1 Highlights 3 2 Business Cross Section 4 3 Domestic CASA 5 4 Domestic Advances 6 5 Retail Credit Components 7 6 Industry & NBFC Exposure 8 7 Restructured Advances,
IIP growth (%) Rates FY CPI(YoY) in % Repo Reverse Repo MSF Call Money(Daily movement) A p r.
 Rates FY CPI(YoY) in % Repo Reverse Repo MSF Call Money(Daily movement) A p r.") 2 Rates FY13-14 Repo Reverse Repo MSF Call Money(Daily movement) 13.5 12.5 11.5 10.5 9.5 8.5 7.5 6.5 5.5 A p r M a y J u n J u l A u g S e p O c t N o v D e c J a n F e b M a r IIP growth (%) 3.5 2.6 2.7
2 Rates FY13-14 Repo Reverse Repo MSF Call Money(Daily movement) 13.5 12.5 11.5 10.5 9.5 8.5 7.5 6.5 5.5 A p r M a y J u n J u l A u g S e p O c t N o v D e c J a n F e b M a r IIP growth (%) 3.5 2.6 2.7
DF-3 Capital Adequacy- Qualitative Disclosure
 DF-3 Capital Adequacy- Qualitative Disclosure The Bank actively manages its capital requirement by taking in to account the current and future Business growth of the Bank. Stress tests are used as a part
POPULATION PROJECTIONS Figures Maps Tables/Statements Notes
 8 POPULATION PROJECTIONS Figures Maps Tables/Statements 8 Population projections It is of interest to examine the variation of the Provisional Population Totals of Census 2011 with the figures projected
RETAIL PNB -DIGITAL PNB
 RETAIL PNB -DIGITAL PNB Presentation on Financial Performance for the Quarter/FY March 2016 1 Operating Profit of the Bank crosses landmark of Rs. 12000 cr. (OverRs.10000cr.forconsecutive5years). Domestic
Review of performance of Pradhan Mantri Mudra Yojana
 Review of performance of Pradhan Mantri Mudra Yojana (An analysis on the performance of PMMY during FY 2015-16) hetbpeer meheàuelee keàer kegbàpeer 2 MUDRA/PMMY Micro Units Development & Refinance Agency
Pradhan Mantri Jan Dhan Yojana The National Mission on Financial Inclusion
 Pradhan Mantri Jan Dhan Yojana (PMJDY) Ministry of Finance www.swaniti.in Pradhan Mantri Jan Dhan Yojana The National Mission on Financial Inclusion Key Features of PMJDY The Pradhan Mantri Jan Dhan Yojana
INVESTOR PRESENTATION
 INVESTOR PRESENTATION 1 South Indian Bank At A Glance 83 Years 644 568 `56386 Cr 31% 25% `177 Cr `95 Cr 3% 13.48% 0.25% Number of years in banking business Number of branches Number of ATM s Business as
Investor Presentation Q2 FY November 2017
 Investor Presentation Q2 FY 2017-18 November 2017 Disclaimer 2 This presentation is confidential and may not be copied, published, distributed or transmitted. The information in this presentation is being
FORM L-1-A : Revenue Account. FORM L-1-A : Revenue Account UP TO THE QUARTER ENDED ON JUNE Non Participating. (Linked) Individual
 Individual") Insurer : DHFL Pramerica Insurance Company Limited Registration No. 140 ; Date of Registration with the IRDAI: June 27, 2008 Revenue Account For the quarter Ended March 31, 2018 FORM L-1-A : Revenue Account
Insurer : DHFL Pramerica Insurance Company Limited Registration No. 140 ; Date of Registration with the IRDAI: June 27, 2008 Revenue Account For the quarter Ended March 31, 2018 FORM L-1-A : Revenue Account
FINANCIAL RESULTS Q1 FY 18
 1 FINANCIAL RESULTS Q1 FY 18 2 EMERGING ECONOMIC & BANKING SCENARIO Strengthening of NPA Resolution Process Strong Macro Economic Environment Good Monsoon Improves Rural Business Growth Outlook Re-emergence
PRADHAN MANTRI MUDRA YOJNA: A CRITICAL REVIEW
 Parikalpana - KIIT Journal of Management (December, 2017) 97 PRADHAN MANTRI MUDRA YOJNA: A CRITICAL REVIEW Manish Agarwal, Amity Business School, Amity University Email: manish234agarwal@gmail.com Ritesh
The Bank that begins with Financial Results Q3 & 9Months, F.Y
 The Bank that begins with Financial Results Q3 & 9Months, F.Y. 2012-13 Concall with Analysts 4 th March, 2013 Performance Highlights Mar - 2012 Dec - 2011 Dec - 2012 Percent 152989 157682 Total Business
 www.allahabadbank.in Business Mix Sl. No. Parameters Jun'15 Mar'16 Jun'16 Variation Q-o-Q Y-o-Y Jun'16 over Mar'16 Jun'16 over Jun'15 Amt. (%) Amt. (%) 1 Business 334548 358352 350848-7504 -2.09 16300
Eligible students have to contact our branches where they have availed/availing loans.
 Eligible students have to contact our branches where they have availed/availing loans. The last date for Banks to submit subsidy claims to Nodal Bank is 31.08.2014. Hence, we advise the students to submit
Corporate Office: Bengaluru 9 th May, 2017 PRESS RELEASE. Highlights
 Corporate Office: Bengaluru 9 th May, 2017 PRESS RELEASE Highlights Net Profit stood at `359 crore for the year ended March 2017 as against a loss of Rs.1643 crore a year ago. Operating Profit at `1514
Subject: Press Release on the Financial Results of the Bank
 Ref:: MD&CEO:SD:2477/2478/11/12::2018 The Vice President The Bombay Stock Exchange Ltd. Phiroze Jeejeebhoy Towers Dalal Street, MUMBAI - 400 001 October 31, 2018 The Vice President Listing Department National
(b) whether the Government has paid insurance claims as compensation for damage of crops due to floods and drought during the current year;
 whether the Government has paid insurance claims as compensation for damage of crops due to floods and drought during the current year;") O.I.H. GOVERNMENT OF INDIA MINISTRY OF AGRICULTURE AND FARMERS WELFARE DEPARTMENT OF AGRICULTURE, COOPERATION AND FARMERS WELFARE LOK SABHA UNSTARRED QUESTION NO.2026 TO BE ANSWERED ON THE 14 TH MARCH,
O.I.H. GOVERNMENT OF INDIA MINISTRY OF AGRICULTURE AND FARMERS WELFARE DEPARTMENT OF AGRICULTURE, COOPERATION AND FARMERS WELFARE LOK SABHA UNSTARRED QUESTION NO.2026 TO BE ANSWERED ON THE 14 TH MARCH,
OUTSTANDING GOVERNMENT DEBT
 ISIN Security OUTSTANDING GOVERNMENT DEBT TABLE 3: OUTSTANDING GOVERNMENT DEBT (Previous Month) Mod V+ (for V- (for Modified for 100bps for 100 bps Expected price for a 100bps rise in yield due to and
Performance Highlights
 Presentation on Financial Performance for the Quarter/FY March 2015 1 Performance Highlights Top Line Milestones: Global Assets- Rs. 6.0 Lac Global Deposit- Rs. 5.0 Lac Saving Deposit- Rs. 1.5 Lac Overseas
 www.allahabadbank.in Business Mix Sl. No. Parameters Mar'15 Sep'15 Variation Q-o-Q Y-o-Y over Sep'15 over Amt. (%) Amt. (%) 1 Business 331196 346519 340101 344709 4608 1.35 13513 4.08 2 Deposit 184544
Total Business Gross Advances Total Deposits 12.05% 9.91% 13.82% NIM CASA. CRAR Basel III 2.59% 11.20% 12.52%
 1 Total Business Gross Advances Total Deposits 12.05% 9.91% 13.82% CASA NIM CRAR Basel III 12.52% 2.59% 11.20% 2 PARTICULARS 31.03.2015 31.03.2016 No. of Share % Holding No. of Share % Holding Govt of
NET PROFIT (Q4) INCREASED BY 110% Y-O-Y TOTAL NUMBER OF BRANCHES CROSSED 2500 PROVISION COVERAGE RATIO IMPROVED TO 58.93
 INCREASED BY 110% Y-O-Y TOTAL NUMBER OF BRANCHES CROSSED 2500 PROVISION COVERAGE RATIO IMPROVED TO 58.93") 1 NET PROFIT (Q4) INCREASED BY 110% Y-O-Y NIM @ 3.00% FOR FY 2014-15 TOTAL NUMBER OF BRANCHES CROSSED 2500 PROVISION COVERAGE RATIO IMPROVED TO 58.93 CASA DEPOSITS CROSSED 27% NET NPAs BELOW 3% 2 BRANCH
1 NET PROFIT (Q4) INCREASED BY 110% Y-O-Y NIM @ 3.00% FOR FY 2014-15 TOTAL NUMBER OF BRANCHES CROSSED 2500 PROVISION COVERAGE RATIO IMPROVED TO 58.93 CASA DEPOSITS CROSSED 27% NET NPAs BELOW 3% 2 BRANCH
Earnings Presentation. Annual Results FY16-17
 Earnings Presentation Annual Results FY16-17 1 Safe Harbor Except for the historical information contained herein, statements in this release which contain words or phrases such as will, aim, will likely
GST Update M.S. CHHAJED & CO. GST UPDATE 2/
 GST Update 02 2018-19 01st June 2018 FOR PRIVATE CIRCULATION ONLY M.S. CHHAJED & CO. GST UPDATE 2/18-19 1 E-way Bill Now E-way Bill shall be required to be generated for intra-state movement of goods in
Dr. Najmi Shabbir Lecturer Shia P.G. College, Lucknow
 Banking Development after Nationalization and Social Control in India (1967 To 1991) Dr. Najmi Shabbir Lecturer Shia P.G. College, Lucknow Abstract: This paper mainly analyses the impact of Nationalisation