Institutional Presentation
|
|
|
- Barnaby Logan
- 5 years ago
- Views:
Transcription
1 Institutional Presentation As of 3Q17 November 2017 Apresentação do Roadshow 1
2 Disclaimer Statements regarding the Company s future business perspectives and projections of operational and financial results are merely estimates and projections, and as such they are subject to different risks and uncertainties, including, but not limited to, market conditions, domestic and foreign performance in general and in the Company s line of business. These risks and uncertainties cannot be controlled or sufficiently predicted by the Company management and may significantly affect its perspectives, estimates, and projections. Statements on future perspectives, estimates, and projections do not represent and should not be construed as a guarantee of performance. The operational information contained herein, as well as information not directly derived from the financial statements, have not been subject to a special review by the Company s independent auditors and may involve premises and estimates adopted by the management. 2

3 Company overview


4 1 Platform of brands of reference Arezzo&Co is the leading Company in the footwear and accessories industry through its platform of Top of Mind brands 4
5 1 Company overview Arezzo&Co is the reference in the Brazilian retail sector and has a unique positioning combining growth with high cash generation Leading company in the footwear and accessories industry with presence in all Brazilian states Controlling shareholders are reference in the sector Development of collections with efficient supply chain Asset light: high operational efficiency Strong cash generation and high growth 11.6 million pairs of shoes (1) More than 45 years of experience in the sector ~11,500 models created per year 90.7% outsourced sdproduction Net revenues CAGR: 10.5% ( ) 1,244 thousand handbags (1) 2,289 points of sale 12% market share (2) Wide recognition Lead time of 40 days 15 to 18 launches per year ROIC of 23.9% in 3Q17 2,355 employees Net Profit CAGR: 4.0% ( ) Increased operating leverage 1. 3Q17 LTM 2. Refers to the Brazilian women footwear market (source: Company estimates). Estimated for


6 1 Successful track record of entrepreneurship The right changes at the right time accelerated the Company's development Foundation and structuring Industrial Era Retail Era Corporate Era 70 s 80 s 90 s 00 s Industry Reference Founded in 1972 Focused on brand and product Consolidation of industrial business model located in Minas Gerais 1.5 mm pairs per year and 2,000 employees Focus on retail R&D and production outsourcing on Vale dos Sinos - RS Franchises expansion Specific brands for each segment Expansion of distribution channels Efficient supply chain Opening of the first shoe factory Opening of the flagship store at Oscar Freire Launch of new brands Consolidate leadership position + Merger First store Launch of the first design with national success Schutz launch Commercial operations centralized in São Paulo Fast Fashion concept Strategic Partnership (November 2007) Initial Public Offering (February 2011) 6

7 1 Shareholder structure Others Aberdeen Management² 40.6% 8.0% 0.0% Birman family Float 51.4% 48.6% 1. Arezzo&Co capital stock is composed of 89,765,882 common shares, all nominative, book-entry shares with no par value 2. Shareholder structure as of September Includes Stock Options plan 7


8 1Principles of success at Arezzo&Co: Culture & Management 01 That which cannot be transparent should not be done. 02 Always be true, so that at any point you are not false in your job. Always be authentic. 03 Clearly negotiate your goals and responsibilities, and consider achievement as a requirement for continuity and prosperity. 04 Do not uncover problems only. Blaming others will never be the solution. Take risks, propose solutions. In case of doubt, act! 05 Formalize everything, even if in an informal way. 06 Always be flexible. Be ready for changes. 07 Goals met are, at least, the basis for the next goal. 08 United we stand! Divergences are constructive, conflicts are destructive. 09 A humble stance: the key to our success. 10 Enjoy. Appreciate. Get involved. And always be happy!
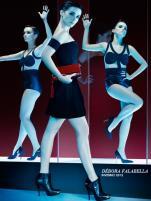
9 Distribution 1 Strong platform of brands Strong platform of brands, aimed at specific target markets, enables the Company to capture growth from different income segments Foundation Brands profile Female target market Trendy New Easy to use Eclectic Fashion Up to date Bold Provocative Pop Flat shoes Affordable Colorful Design Exclusivity Identity Seduction Casual Young Urban Modern years years years years years channel 1 POS 1 % gross rev. 2 O F MB EX , % 65% 13% 2% O F MB EX O F MB EX % 16% 29% 18% 1, ,201 10% 46% 36% 19 2% O MB EX % 4% 66% O MB EX % 53% 0% % Web Gross Revenue Retail price point R$55.5MM (6%) R$57.3MM (10%) R$8.7MM (6%) R$0.8MM (2%) R$1.5MM (9%) R$190 / pair R$330 / pair R$110 / pair R$960 / pair R$248 / pair Sales Volume 3 R$874MM R$557MM R$149MM R$50MM R$17MM % Gross Revenues % 33.8% 9.1% 3.0% 1.0% Notes: 1. Points of sales (LTM); O = Owned Stores; F = Franchised Stores; MB = Multi-brand Stores; EX = Exports (including US and ROW wholesalers). 2. % of each brand gross revenues (LTM) does not include other revenues (not generated by any of the 5 brands). 3. Gross revenues LTM, including external market; does not include other revenues (not generated by any of the 5 brands). 4. % of Company s total gross revenues LTM. 9
10 1 Multiple distribution channels Flexible platform through different distribution channels with specific strategies, maximizing the Company's profitability 520 franchises in more than 220 cities in Brazil 2,289 multibrand¹ clients in more than 1,220 cities 49 owned stores in Brazil Broad distribution network throughout Brazil Gross Revenue Breakdown by Channel (R$ mm)² 44.4% 20.4% 18.3% 7.5% 0.2% 9.2% 100% , Franchises Multibrand Owned Stores Web commerce Other External Market Total 1. Without store overlap between brands 2. Last twelve months 10
11 Business model
12 2 enhanced Unique business model in Brazil by. Customer focus: we are at the forefront of Brazilian women fashion and design ABILITY TO INNOVATE SOLID MARKETING AND COMMUNICATION PROGRAM EFFICIENT SUPPLY CHAIN NATIONWIDE DISTRIBUTION STRATEGY SEASONED MANAGEMENT TEAM WITH PERFORMANCE BASED INCENTIVES R&D Communication & Marketing Sourcing & Logistics Multi-channel Management BRANDS OF REFERENCE 12


13 2 Ability to Innovate We produce 15 to 18 collections per year I. Research II. Development III. Sourcing IV. Delivery Creation: 11,500 SKUs / year Available for selection: 63% of SKUs created / year Stores: 52% of SKUs created / year Activities JAN FEV MAR APR MAY JUN JUL AUG SEP OCT NOV DEC Creation Launch Orders Production Delivery Normal sale Discount sale Winter I Winter II Winter III Summer I Summer II Summer III Summer IV Arezzo&Co fulfills the various aspirations of women, delivering on average 5 new models at the stores per day, allowing for consistent desire-driven purchases 13


14 2 Broad media plan Each brand has an integrated and expressive communication strategy, from the creation of campaigns to the point of sales Presence in electronic media and television Strong presence in printed media Digital communication Celebrity Endorsement Marketing Events +2.2 million accesses to site/month Over 6 million followers/ fans: Facebook, Demi Moore Gisele Bündchen Blake Lively CRM VIP sales +180k monthly access to Schutz s Blog Instagram and Twitter (all 4 Brands) Seasonal showroom in Los Angeles near In-store events PA Average navigation time: 8 minutes 1 Source: Indexsocial/ Agência Espalhe, 2013 Arezzo is leader in interactions 1 the Red Carpet Season Stylists Fashion Advisors 14


15 2 reflected Communication & marketing program in every aspect of the stores Stores constantly modified to incorporate the concept of each new collection, creating desiredriven purchases POS materials (catalogs, packaging, and others) Store layout & visual merchandising Flagship stores All visual communication at stores is monitored and updated simultaneously throughout Brazil for each new collection 15


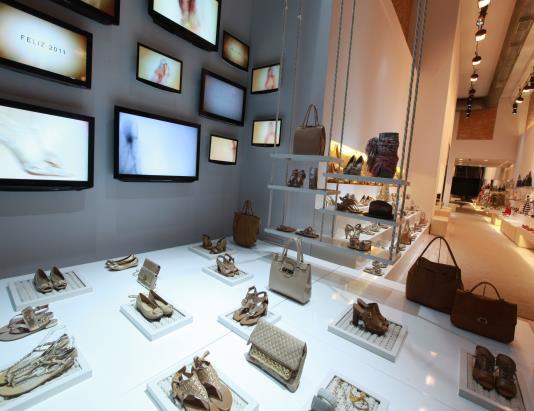
16 2 concepts Atmosphere of stores: differentiated for each brand Niches and lighting Iguatemi Faria Lima - SP Wall display Each theme is disposed in different niches Experimental and creative Closet Essentials Distinguished storefront Suspended Shelves Shelves, Niches and Suspended shelves Combos Visual merchandising: Window related to the brand s ZZ symbol To increase in 50% the number of models exposed Products highlighted in the center of the stores Lights that highlighting the product A better distribution of the furniture offers more comfort for clients Video Wall Jackets and accessories Campaigns and marketing actions Preeminence for products Differentiated products Accessories Storage Display of a large variety of products Inventory at the sales area: lower necessity of space for storage Sophisticated lighting Atmosphere of a jewelry store Private shop experience Focus on exclusivity, design and highly selected materials Oscar Freire St 1128 Experimental and creative space Interaction with the customer Collaborative experience (instore office) 16
17 2 store Large distribution network and scale of chain Mono-brand store chain with high distribution network, reaching more than 220 cities and wellpositioned among the retail companies Size and average sales per mono-brand stores 2016 Points of sale (3Q17) 3 Brand Average size (m 2 ) Net Revenue/m 2 (R$ 000s) Total Stores , , Points of sale average size: new stores are increasing the network s average store size 85 sq m 2011 new stores 3 80 sq m 2012 new stores 55 sq m 2013 new stores 52 sq m 2014 new stores 69 sq m 2015 new stores 66 sq m 2016 new stores GDP³: 5% A&C¹: 5% GDP³: 9% A&C¹: 9% GDP³: 17% A&C¹: 14% GDP³: 14% A&C¹: 17% GDP³: 55% A&C¹: 55% 369 franchises + 15 owned stores + 1,211 multibrand clients 62 franchises + 22 owned stores (ii) + 1,336 multibrand clients 89 franchises 4 owned stores 1,220 multibrand clients 4 owned store + 64 multibrand clients 4 owned store 298 multibrand clients Source: IBGE, Companies filings. 1. Considers only mono-brand stores of Arezzo&Co. 2. Domestic market only. 3. Domestic and external market multibrand without overlap. 17


18 2 Flexible production process Production speed, flexibility and scalability to ensure Arezzo&Co s expected growth based on asset light model Sourcing Model Owned factory with capacity to produce 1,1mm pairs annually and a strong relationship with Vale dos Sinos production cluster as the main outsourcing region Gains of scale Arezzo s scale and structure gives flexibility to source a large number of SKU s from various factories on a short time frame at competitive prices Certification and auditing of suppliers In-house certification and auditing ensure quality and punctuality (ISO 9001 certification in 2008) New Distribution Center Joint purchases Coordination of material purchase jointly with shoe, handbag and accessories suppliers Sourcing model 91% of production outsourced¹ 9% 91% Arezzo&Co Owned Factories Others Consolidation and improvement of distribution in national scale Reception: 100,000 units/day Storage: 100,000 units/day Picking: 150,000 units/day Distribution: 200,000 units/day 18


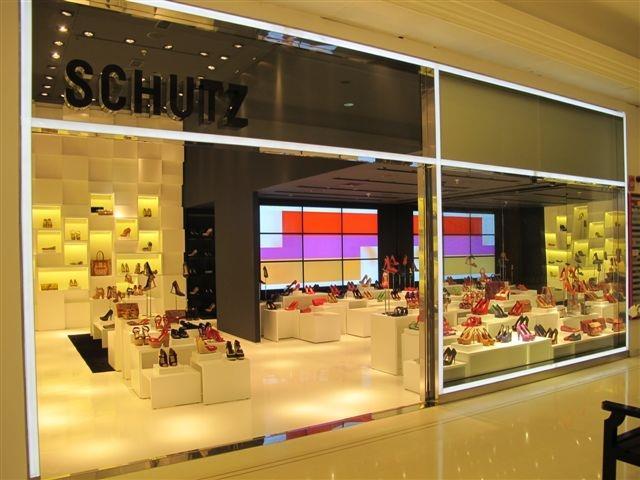
19 sold through owned stores Capturing value from the network while developing retail know-how and brands visibility Flagship Stores Greater brand awareness coupled with operational efficiencies Clustering higher productivity stores in main areas (mainly SP and RJ) improving operational efficiency and profitability: Average Sales per Store 3Q17 LTM Franchise Owned R$1.4mm R$6.2mm Arezzo Iguatemi / SP Direct costumers interaction develops retail assets which are also reflected at franchised stores Flagship stores ensure greater visibility and reinforce brand image Total sales area and # of stores (000 m 2 ) Anacapri Oscar Freire/ SP 1.1% -0.2% 0.5% 0.3% Schutz Morumbi/ SP Schutz Oscar Freire/ SP Arezzo Oscar Freire/ SP 3Q16 4Q16 1Q17 2Q17 3Q17 Franchises Owned Stores¹ Area (000 M²) 19


 get connected through national internet broadcast")


20 2 based on a retail oriented structure... Structure applied to retail in order to achieve better sales and margin results as well as to integrate and connect all monobrand stores back office Strong focus on franchise and owned store performance All sales team (4,000+) get connected through national internet broadcast for three sales conventions per year, creating an aligned sales pitch and a great sense of motivation before each season Large service program to assist franchisees on sales and profitability goals Recurring training programs in products, fashion trends, sales techniques, store management, IT, among others Strong visual merchandising, trade marketing and ambiance investments and training 20
21 2.10 with efficient management of the franchise network... Model allows rapid expansion with low invested capital by Arezzo&Co and high profitability to franchisees Successful Partnership: Win Win Intense retail training Ongoing support: average of 6 stores/ consultant and average of 22 visits per store/ year Strong relationship with and ongoing support to franchisee IT integration with our franchises amounts to 100% As mono-brand stores, franchises reinforce branding in each city they are located Best Franchise in Brazil (2005 and 2012) and in the industry for 7 years since 2004 Franchise Concentration per Operator (# of franchises by # of franchisees) 3 franchises 2 franchises 4 or more franchises 9% 24% 9% 57% 1 franchise Excellence in Franchising (ABF). Awarded in the last 8 years 96% satisfaction of franchisees 1 Notes: 1. 96% of the current franchisees indicated they would be interested in opening a franchise if they did not already have one 2. Annual sales of R$ 3.3 million + average initial investment of R$ 900 thousand + working capital of R$ 600 thousand 5-year contract and average payback of 48 months 2 21


22 2...and of the multi-brand stores Multi-brand stores widen the distribution network and the brands visibility, resulting in a strong retail footprint Multi-brand stores Gross Revenue¹ 2, % 15.9% 2, Multi-brand stores Gross Revenue LTM # Stores MB Improved distribution and brand visibility Greater brand distribution network Presence in over 1,220 cities Rapid expansion at low investment and risk Main focus: share of wallet Owner s loyalty Schutz Club Relationship program that offers advantages to the 50 Top Multi-brand stores, such as better products display, training and awards to the best sales teams. Important sales channel for smaller cities Sales team optimization: internal team and commissioned sales representatives Notes: 1. Domestic market only 22
23 2 New Organizational Structure The new structure presents a reduction in the number of CEO reports, value chain integration and higher speed in decision making, with an increased focus on people and sustainability Board of Directors Risk, Audit and Finance Committee Internal Auditing People Committee CEO Strategy Committee Brands Silvia Machado Industrial & Operations Cisso Klaus e Cassiano Lemos New Business Development Administrative & Finance Daniel Levy HR & Management Marco Aurélio Vidal BU Arezzo BU Schutz BU Anacapri BU A.Birman E-commerce Commercial (Multiband/Exports) Sourcing Engineering Quality Industry Planning Logistics USA Fiever/ New Brands Strategic Planning /Innovation /Franchising /CRM /PMO Expansion* Portfolio Management /Competitive Finance/Legal/Fiscal IT Controller Investor Relations Risk Management People Sustainability*/PR Non productive purchase Management (Method, goals and indicators) intelligence * 2018 onwards
24 2 Corporate governance The Board is comprised of 7 members, of which 2 are independent, and has a very large engagement on the strategic planning of Arezzo&Co Board of Directors Name Experience Name Experience Title Title Alessandro Carlucci Chairman of the Board José Bolonha Vice Chairman of the Board Natura s CEO for over a decade and former Board Member of Lojas Renner, Redecard, Alcoa Latam and Itau-Unibanco Founder and CEO of Ethos Desenvolvimento Humano e Organizacional ; Board member of the Inter-American Economic and Social Council (UN, WHO) Alexandre Birman Member Juliana Rozenbaum Member Current CEO of Arezzo&Co and part of the controlling group. Founder of Schutz brand, with over 18 year of experience on the footwear industry. Over 13 years of experience as sell side equity research analyst, focused on retail and consumer sector Paula Bellizia Independent member CEO of Microsoft Brasil. Former CEO for Apple Brasil and Facebook Latam Sales Diretor. Member of the Economic and Social Development Council (CDES). Luiz Fernando Giorgi member 28 years of experience in Management and Leadership. Current member of people committees for Santander, Sul América and Grupo Martins Guilherme A. Ferreira Independent Member CEO of Bahema Participações, current board member of Petrobras, Valid, Sul América, Gafisa and T4F Committees Risk, Audit and Finance Committee Guilherme A. Ferreira (Coordinator) Members: Alessandro Carlucci, Guilherme A. Ferreira and Edward Ruiz Strategy and Brands Committee Juliana Rozenbaum (Coordinator) Members: Alexandre Birman, Paula Bellizia and Juliana Rozenbaum People Committee José Bolonha (Coordinator) Members: Luiz Fernando Giorgi, José Bolonha and Ligia Martins 24
25 Key messages 2Arezzo&Co keeps developing its business model in a sustainable way Consolidated business model with multiple growth opportunities Launch of a new brand Fiever with encouraging results Improvement in the profitability of existing brands: Anacapri and Alexandre Birman Staff management an ongoing development Broad range of selection, training and retaining of staff at all levels Strengthening of organizational identity Ownership of the value chain, greater competitive advantage More agile and collaborative model Sell-out oriented to boost results in the value chain Financial strength allows for sustainable business growth History of cash generation together with consistent dividend payment policy Net cash position, an important differentiator in challenging economic times Multi-channel management know-how, excellent platform to lift brands Omni channel growth: Fiever debut, Schutz FIS, Arezzo consolidation, Anacapri expansion Strong knowledge in franchises management in addition to improving opportunities Multibrand channel leverages growth of new brands 25

26 a multi-brand and multichannel strategy 2Organic growth leveraged by multi-brand, multichannel strategy in footwear and handbags 26

27 2.aligned with a clear focus of the future 27

28 03 Financial Highlights
29 2.00 0, , , , , ,0 800,0 600,0 400,0 200, , , ,0 500, , , , , , , 0 Operational and financial highlights 3Gross Revenue Breakdown by Brand Domestic Market (R$ million) CAGR: 12% , % Q16 3Q17 Arezzo Schutz Anacapri Others Others: includes only domestic markets for Alexandre Birman and Fiever brands and other revenues. 29
30 200 0, , , , , ,00 800,00 600,00 400,00 200, , , ,00 500,00 (500,00 ) (1000,0 0) (1500,0 0) (2000,0 0) (2500,0 0) (3000,0 0) Operational and financial highlights 3Gross Revenue Breakdown by Channel Domestic Market (R$ million) CAGR: 13% % Q16 3Q17 Foreign Market Franchise Multibrands Owned Stores Web commerce Others Total Others: includes domestic market revenues that are not specific for distribution channels. 30
31 Key highlights Operational and financial highlights Gross revenue reached R$455 million in the 3Q17, a increase of 6.7% over 3Q16. Sales area increased 4.2% in the last twelve months. Net Revenues (R$ mln) CAGR : 20.4% 10.6% 6.4% 1, % 1,121 1, % % % % % 89.4% Number of Stores (R$ mln) and Total Area (m 2-000) Area CAGR : 12.6% 1.1% -0.2% 0.3% 0.5% Q16 4Q16 1Q17 2Q17 3Q17 Franchises Owned Stores¹ Area (000 M²) 31
32 ,0 % 45,0 % 40,0 % 35,0 % 30,0 % 25,0 % 20,0 % 15,0 % 10,0 % 5,0% 250,0 200,0 150,0 100,0 50,0-16, 0% 14, 0% 12, 0% 10, 0% 8,0 % 6,0 % 4,0 % 2,0 % 0,0 % 3 Operational and financial highlights Gross Profit Evolution (R$ MM) and Gross Margin (%) Net Profit Evolution (R$ MM) and Net Margin (%) bps 41,5% 43,7% 44,2% 43,3% 42,5% 44,3% 43,9% 45,8% 13,5% 0 bps % ,9% 11,5% 11,4% 10,7% 9,4% ,2% 10,2% 6.3% Q16 3T Q16 3Q17 Gross Profit Gross Margin Net Profit Net Margin 32
33 2.00 0, , , , , ,0 800,0 600,0 400,0 200, , , , , ,0 800,0 600,0 400,0 200,0 300,0 250,0 200,0 150,0 100,0 50,0-20, 0% 18, 0% 16, 0% 14, 0% 12, 0% 10, 0% 8,0 % 6,0 % 4,0 % 2,0 % 0,0 % 3 Operational and financial highlights Gross Revenue (R$ MM) EBITDA Evolution (R$ MM) and EBITDA Margin (%) CAGR: 13% ,3% 16,7% 16,6% 16,1% bps 17,6% 16,1% 14,8% 14,3% % % Q16 3Q17 Foreign Market Domestic Market Q16 3Q17 EBITDA EBITDA Margin 33
34 3 Operational and financial highlights Arezzo&Co has a solid balance sheet with a healthy net cash position, coupled with a strong ability to generate operating cash flow and dividend payments Operating cash flow yield¹ 5.9% Arezzo&Co generated R$173.6 mm in operating cash flow in 3Q17, translating into cash flow yield of 5,9% Dividend Payout (YTD) 111.3% Working Capital (% of Net Revenue) 23.5% Consistent dividend payments, with a payout of more than 90% of net profit in In 9M17, payout of more than 100% of net profit. Reduction in working capital needs by 560 bps from 3Q16 to 3Q17 Capex / Depreciation LTM 0.2x From 2015 onwards capex trended roughly in line with depreciation Net Debt / EBITDA - 0.6x The Company has a strong balance sheet and a net cash/ebitda ratio of -0.6x in Sep/17. 1) Operating cash flow yield = LTM Operating cash flow / Firm value. Considered Cash Flow LTM of R$ 2,835.4mm (as of 09/29/2017) 34
35 3 Operational and financial highlights Cash Conversion Cycle (R$ thousand) Cash Conversion Cycle 3Q16 3Q17 #days (R$'000) #days (R$'000) Change (in days) Capex (R$ thousand) Summary of investments 3Q17 3Q16 Δ 17 x 16 (%) 9M Inventory¹ Accounts Receivable² (-) Accounts Payable¹ ¹ Days of COGS ² Days of Net Revenues Total CAPEX (4,9%) 13 Stores - expansion and refurbishing ,9% 5 Corporate (20,7%) 5 Other (41,4%) 2 Operational Indicators Operating Indicators 3Q17 3Q16 Δ 17 x 16 # of pairs sold ('000) ,7% 8.4 # of handbags sold ('000) ,2% 8 # of employees ,8% 2.3 # of stores* Owned Stores Franchises Outsourcing (as % of total production) 90,7% 89,5% 1,2 p.p 90, SSS² Sell-in (franchises) 7,2% 2,1% 5,1 p.p 6, SSS² Sell-out (ow ned stores + franchises) 1,5% 5,6% -4,1 p.p 3, SSS² Sell-out (ow ned stores + franchises + w eb commer 2,7% 6,4% -3,7 p.p 4, 9M1 Cash Flow From Operating Activities (R$ thousand) Operating Cash Flow 3Q17 3Q16 Income before income tax and social contribution Depreciation and amortization Others Decrease (increase) in assets / liabilities Trade accounts receivables Inventories Suppliers Change in other noncurrent and current assets and liabilities Payment of income tax and social contribution Δ 17 x 16 (R$) Δ 17 x 16 (%) 9M ,3% ,8% 22.6 (2.925) (880) (2.045) 232,4% (4.2 (18.260) (21.674) (15,8%) (3.6 (50.078) (50.634) 556 (1,1%) ( ,0% ( (2.260) (10,3%) ,9% (5.8 (13.040) (10.672) (2.368) 22,2% (27.9 Net cash flow generated by operational activities ,5%
36 3 Operational and financial highlights Indebtedness (R$ thousand) Total indebtedness of R$93.2 million in 3Q17 against R$95.7 million in 3Q16. Long term indebtedness of 21.7% of total debt in 3Q17, compared to 30.7% in 3Q16. The weighted average cost of the company s total debt in 3Q17 remained at low levels. It is worth mentioning that during 3Q17, the Company distributed the amount of R$ 88.8 million in dividends. Cash position and Indebtedness 3Q17 2Q17 3Q16 Cash Total debt Short term % total debt 78,3% 79,7% 69,3% Long-term % total debt 21,7% 20,3% 30,7% Net debt ( ) ( ) ( ) 36
37 Appendix 37
38 A 3Q17 Key financial indicators Key financial indicators 3Q16 Δ (%) 17 x 16 9M17 9M16 Δ (%) 17 x 16 Net revenues ,9% ,7% COGS ( ) ( ) 3,2% ( ) ( ) 7,6% Gross profit ,6% ,7% Gross margin 45,8% 43,9% 1,9 p.p 45,6% 44,0% 1,6 p.p SG&A ( ) ( ) 10,5% ( ) ( ) 11,3% % of net revenues (30,6%) (29,6%) (1,0 p.p) (32,6%) (32,4%) (0,2 p.p) Selling expenses (79.149) (75.208) 5,2% ( ) ( ) 7,9% Ow ned stores and w eb commerce (30.876) (30.625) 0,8% (91.132) (89.437) 1,9% Selling, logistics and supply (48.273) (44.583) 8,3% ( ) ( ) 12,4% General and administrative expenses (24.953) (19.570) 27,5% (75.560) (61.476) 22,9% Other operating revenues (expenses) (282) (1.526) (81,5%) (817) (1.830) (55,4%) Depreciation and amortization (9.218) (6.500) 41,8% (22.630) (19.282) 17,4% EBITDA ,1% ,2% EBITDA margin 17,6% 16,1% 1,5 p.p 15,2% 13,7% 1,5 p.p Net income ,3% ,4% Net margin 10,2% 10,2% - 9,9% 8,9% 1,0 p.p Working capital¹ - as % of revenues 23,5% 29,1% (5,6 p.p) 23,4% 29,1% (5,7 p.p) Invested capital² - as % of revenues 38,8% 45,3% (6,5 p.p) 38,7% 45,3% (6,6 p.p) Total debt (2,7%) ,7% Net debt³ ( ) ( ) (0,6%) ( ) ( ) 58,4% Net debt/ebitda LTM -0,6x -0,7x - -0,7x -0,7x - (1) Working Capital: current assets minus cash, cash equivalents and financial investments less from current liabilities minus loans and financing and dividends payable. (2) Invested Capital: working capital plus fixed assets and other long term assets less income tax and deferred social contributions. (3) Net debt is equal to total interest bearing debt position at the end of a period less cash, cash equivalents and short-term financial investments. 38
39 A 3Q16 History Franchises and Owned Stores History of Stores 4Q16 1Q17 2Q17 3Q17 Sales area 1,3 - Total (m²) Sales area - franchises (m²) Sales area - ow ned stores² (m²) Total num ber of dom estic stores # of franchises Arezzo Schutz Anacapri # of ow ned stores Arezzo Schutz Alexandre Birman Anacapri Fiever Total num ber of international stor # of franchises # of ow ned stores (1) Include area in square meters of the seven stores abroad (2) Includes eight outlet stores with a total area of 1,959 m² (3) Includes areas in square meters of stores that were expanded 39
40 Balance Sheet - IFRS AAssets 3Q17 2Q17 3Q16 Liabilities 3Q17 2Q17 3Q16 Current assets Cash and cash equivalents Financial Investments Trade accounts receivables Inventory Taxes recoverable Other credits Non-current assets Long-term receivables Trade accounts receivables Deferred income and social contribution Other credits Investments Property, plant and equipment Intangible assets Total Assets Current liabilities Loans and financing Suppliers Other liabilities Non-current liabilities Loans and financing Related parties Other liabilities Equity Capital Capital reserve Income reserves Equity Valuation Adjustments Profit Additional proposed dividend Total liabilities and shareholders' equity
41 A Income Income Statement - IFRS statement - IFRS 3Q17 3Q16 Var.% 9M17 9M16 Var.% Net operating revenue ,9% ,7% Cost of goods sold ( ) ( ) 3,2% ( ) ( ) 7,6% Gross profit ,6% ,7% Operating incom e (expenses): ( ) ( ) 10,5% ( ) ( ) 11,3% Selling (86.311) (80.003) 7,9% ( ) ( ) 8,7% Administrative and general expenses (27.009) (21.275) 27,0% (81.593) (66.966) 21,8% Other operating income net (282) (1.526) -81,5% (817) (1.830) -55,4% ROL LAIR Incom e before financial result ,8% ,3% IR Financial income ,8% ,0% Alíqu LL Incom e before incom e taxes ,3% ,8% M. Lí Income tax and social contribution (20.532) (17.329) 18,5% (42.021) (30.130) 39,5% Current (23.390) (20.079) 16,5% (50.523) (33.849) 49,3% ROL Deferred ,9% ,6% LAIR IR Net incom e for period ,3% ,4% Alíqu 41
42 A Cash Cash Flow Statement - IFRS Flow - IFRS 3Q17 3Q16 9M17 9M16 Operating activities Income before income tax and social contribution Adjustm ents to reconcile net incom e w ith cash from operational activit (3.273) Depreciation and amortization Income from financial investments (6.485) (6.804) (21.351) (21.722) Interest and exchange rate (1.301) (5.427) Other (279) Decrease (increase) in assets Trade accounts receivables (50.078) (50.634) (30.567) (53.991) Inventory (9.794) (17.917) Recoverable taxes (8.148) (5.820) Variation other current assets (255) Judicial deposits (1.281) (1.971) (3.835) (4.412) Decrease (increase) in liabilities Suppliers Labor liabilities Fiscal and social liabilities (2.803) (4.029) (5.860) (5.459) Variation in other liabilities (1.873) (2.349) (5) (77) Paym ent of incom e tax and social contribution (13.040) (10.672) (27.911) (19.209) 42
43 A Net Cash Flow Statement - IFRS cash flow from operating activities Investing activities Sale of fixed and intangible assets Acquisitions of fixed and intangible assets (5.084) (5.342) (13.944) (20.783) Financial Investments ( ) ( ) ( ) ( ) Redemption of financial investments Net cash used in investing activities Financing activities w ith third parties Increase in loans Payments of loans (26.238) (30.858) (62.531) (63.818) Payments of Interest on loans (288) (140) (935) (1.321) Net cash used in financing activities w ith third parties (15.388) (8.513) (13.221) (18.891) Financing activities w ith shareholders Interest on equity (21.540) (21.893) (21.540) (21.893) Distribution of profits (88.832) 1 ( ) (18.704) Receivables (payables) w ith shareholders (52) 67 (34) (183) Share Issuance Net cash used in financing activities ( ) (20.875) ( ) (38.849) Increase (decrease) in cash and cash equivalents (2.623) (2.482) (1) (1.127) Cash and cash equivalents Foreign exchange effect on cash and cash equivalents (152) 30 (99) (540) Cash and cash equivalents - Initial balance Cash and cash equivalents - Closing balance Increase (decrease) in cash and cash equivalents (2.623) (2.482) 639 (1.127) 43

44 Contacts CFO and IR Officer Daniel Levy IR Manager Aline Penna IR Coordinator Guilherme de Biagi IR Analyst Victoria Machado Telephone:
Apresentação do Roadshow Institutional Presentation
 Apresentação do Roadshow Institutional Presentation March 2018 1 Disclaimer Statements regarding the Company s future business perspectives and projections of operational and financial results are merely
Results Important Disclaimer
 2Q18 Important Disclaimer Information contained in this document may include forward-looking statements and reflect Management s current view and estimates of the evolution of the macroeconomic environment,
Results Important Disclaimer
 2Q18 Important Disclaimer Information contained in this document may include forward-looking statements and reflect Management s current view and estimates of the evolution of the macroeconomic environment,
RESULTS 4Q17 AND 2017
 RESULTS 4Q17 AND 2017 Important Disclaimer Information contained in this document may include forward-looking statements and reflect Management s current view and estimates of the evolution of the macroeconomic
Capital composition 1. Cash proceeds 2. Balance sheet assets 3. Balance sheet liabilities and equity 4. Statement of income 6
 (A free translation of the original in Portuguese) Quarterly Information (ITR) 9/30/2017 - AREZZO INDÚSTRIA E COMERCIO S/A Version: 1 Contents Company information Capital composition 1 Cash proceeds 2
Capital composition 1. Balance sheet assets 2. Balance sheet liabilities and equity 3. Statement of income 5. Statement of comprehensive income 6
 (A free translation of the original in Portuguese) Quarterly Information (ITR) 9/30/2018 - AREZZO INDÚSTRIA E COMÉRCIO S.A. Version: 1 Contents Company information Capital composition 1 Parent company
Capital composition 1. Cash proceeds 2. Balance sheet assets 3. Balance sheet liabilities and equity 4. Statement of income 6
 (A free translation of the original in Portuguese) Quarterly Information (ITR) 6/30/2018 - AREZZO INDÚSTRIA E COMERCIO S.A. Version: 1 Contents Company information Capital composition 1 Cash proceeds 2
Quarterly Information (ITR) - 3/31/ AREZZO INDÚSTRIA E COMERCIO S.A. Version: 2. Capital composition 1. Cash proceeds 2
 - 3/31/ AREZZO INDÚSTRIA E COMERCIO S.A. Version: 2. Capital composition 1. Cash proceeds 2") (A free translation of the original in Portuguese) Quarterly Information (ITR) - 3/31/2018 - AREZZO INDÚSTRIA E COMERCIO S.A. Version: 2 Contents Company information Capital composition 1 Cash proceeds
(A free translation of the original in Portuguese) Quarterly Information (ITR) - 3/31/2018 - AREZZO INDÚSTRIA E COMERCIO S.A. Version: 2 Contents Company information Capital composition 1 Cash proceeds
Institutional Presentation. March
 Institutional Presentation March 2013 Marisa at a glance Largest women fashion and lingerie retailer in Brazil 64 years of track record Focus on the middle class National footprint 2 Multiformat store
2Q17. Net profit of R$8.3 million in the 2Q17 (R$11.1 million excluding non-recurring impacts).
.") São Paulo, Brazil, August 7, 2017 - Restoque Comércio e Confecções de Roupas S.A. ( Company ) (LLIS3), leading company in the premium clothing and apparel retail industry in Brazil, presents its results
São Paulo, Brazil, August 7, 2017 - Restoque Comércio e Confecções de Roupas S.A. ( Company ) (LLIS3), leading company in the premium clothing and apparel retail industry in Brazil, presents its results
Our net revenue has also been adversely affected by the re-burden of the payroll.
 São Paulo, Brazil, May 10, 2016 Restoque Comércio e Confecções de Roupas S.A. ( Company ) (LLIS3), a leading company of premium clothing and apparel industry in Brazil, presents its results for the first
EBITDA of R$ 76.0 million (+18.4%), with a 25.4% margin (+3.8 p.p.). Higher full-price sales volume, with 46.5% reduction of remarked-price sales.
, with a 25.4% margin (+3.8 p.p.). Higher full-price sales volume, with 46.5% reduction of remarked-price sales.") São Paulo, Brazil, May 7, 2018 - Restoque Comércio e Confecções de Roupas S.A. ( Company ) (LLIS3), leading company in the premium clothing and apparel retail industry in Brazil, presents its results for
São Paulo, Brazil, May 7, 2018 - Restoque Comércio e Confecções de Roupas S.A. ( Company ) (LLIS3), leading company in the premium clothing and apparel retail industry in Brazil, presents its results for
Springs Global: E-commerce revenue more than doubled yoy
 Springs Global: E-commerce revenue more than doubled yoy São Paulo, August 14 th, 2018 - Springs Global Participações S.A. (Springs Global), the Americas largest company in bedding, tabletop and bath products,
Springs Global: focus on South America, with a more robust financial structure
 Springs Global: focus on South America, with a more robust financial structure São Paulo, April 5 th, 2019 - Springs Global Participações S.A. (Springs Global), the Americas largest company in bedding,
Institutional Presentation November 2017
 Institutional Presentation November 2017 DISCLAIMER This presentation may include declarations about Springs Global s expectations regarding future events or results. All declarations based upon future
Institutional Presentation May 2017
 Institutional Presentation May 2017 DISCLAIMER This presentation may include declarations about Springs Global s expectations regarding future events or results. All declarations based upon future expectations,
Institutional Presentation March 2017
 Institutional Presentation March 2017 DISCLAIMER This presentation may include declarations about Springs Global s expectations regarding future events or results. All declarations based upon future expectations,
ITR Quarterly Information Form- 6/30/ RESTOQUE COM E CONFECÇÕES DE ROUPAS SA Version: 1. Statement of Capital 1.
 ITR Quarterly Information Form- 6/30/2013 - RESTOQUE COM E CONFECÇÕES DE ROUPAS SA Table of Contents Company Information Statement of Capital 1 Dividends Paid 2 Parent Company Financial Statements Statement
2Q17 RESULTS. Conference Call: Aug/11th :00 (BZ) / 13:00 (ET) Dial-in: Portuguese: +55 (11) English: +1 (646)
 / 13:00 (ET) Dial-in: Portuguese: +55 (11) English: +1 (646)") 2Q17 RESULTS Conference Call: Aug/11th - 2017 14:00 (BZ) / 13:00 (ET) Dial-in: Portuguese: +55 (11) 2188-0155 English: +1 (646) 843 6054 Access Code: Marisa Webcast: www.marisa.com.br/ri Investor relations
2Q17 RESULTS Conference Call: Aug/11th - 2017 14:00 (BZ) / 13:00 (ET) Dial-in: Portuguese: +55 (11) 2188-0155 English: +1 (646) 843 6054 Access Code: Marisa Webcast: www.marisa.com.br/ri Investor relations
EBITDA + 23,5% vs Adjusted EBITDA of R$133.2 million Operational cash flow: R$ 138,6mn in 2013
 EBITDA + 23,5% vs. 2012 Adjusted EBITDA of R$133.2 million Operational cash flow: R$ 138,6mn in 2013 São Paulo, Brazil, February 24, 2014 Brazilian premium fashion retail leader Restoque Comércio e Confecções
Highlights of the period
 GROWTH IN REVENUES AND ADJUSTED EBITDA São Paulo, November 06, 2017. A Linx S.A. (B3: LINX3; Bloomberg: LINX3:BZ and Reuters: LINX3.SA), the leader in management software for retailers, announced its consolidated
Results 3Q18. October 25, 2018 B3: LREN3; USOTC:LRENY. CONFERENCE CALL ON RESULTS October :00 p.m. (Brazil) / 12 noon (US-EST)
 / 12 noon (US-EST)") Results 3Q18 October 25, 2018 B3: LREN3; USOTC:LRENY CONFERENCE CALL ON RESULTS October 26. 2018 1:00 p.m. (Brazil) / 12 noon (US-EST) Access in Portuguese: +55 11 3127-4971 ou +55 11 3728-5971 Access
Results 3Q18 October 25, 2018 B3: LREN3; USOTC:LRENY CONFERENCE CALL ON RESULTS October 26. 2018 1:00 p.m. (Brazil) / 12 noon (US-EST) Access in Portuguese: +55 11 3127-4971 ou +55 11 3728-5971 Access
4Q17 and 2017 Earnings Release. Earnings Release 4Q17 and 2017
 4Q17 and 2017 Earnings Release Earnings Release 4Q17 and 2017 Dear Investors, In 2017, our team set audacious goals for growth, value creation, customer satisfaction and brand positioning, even in an adverse
1Q17 Results Conference Call April 28 th, :00 pm (BrT) 11:00 am (NY)/ 4:00 pm (London)
 11:00 am (NY)/ 4:00 pm (London)") 1Q17 Results Conference Call April 28 th, 2017 12:00 pm (BrT) 11:00 am (NY)/ 4:00 pm (London) 1Q17 Results Financial Performance Outlook Q&A DISCLAIMER This presentation contains forward-looking statements
1Q17 Results Conference Call April 28 th, 2017 12:00 pm (BrT) 11:00 am (NY)/ 4:00 pm (London) 1Q17 Results Financial Performance Outlook Q&A DISCLAIMER This presentation contains forward-looking statements
Marisa at a Glance. Largest women fashion and underwear retailer in Brazil. Focus on the middle class. 63 years of track record.
 Institutional Presentation May 2012 Marisa at a Glance 63 years of track record Financial services platform Focus on the middle class Largest women fashion and underwear retailer in Brazil Multiformat
German Investment Seminar 2011 Commerzbank AG New York January 10-11, 2011
 German Investment Seminar 2011 Commerzbank AG Mark Langer Chief Financial Officer Dennis Weber Head of Investor Relations New York January 10-11, 2011 German Investment Seminar, Commerzbank HUGO BOSS January
Conference Call 3Q10 Results
 Conference Call 3Q10 Results In Portuguese with simultaneous translation in English Time: 11:00 am (US-ET)/ 1:00 pm (Brazil) Access in English: +1 (786) 9246977 Access in Portuguese: +55 (11) 46886361
Forward-Looking Statements
 March 2017 Forward-Looking Statements Certain information contained in this presentation, particularly information regarding future economic performance, finances, and expectations and objectives of management
Conference Call 2Q10 Results
 Conference Call 2Q10 Results In Portuguese with simultaneous translation in English Time: 12:00 pm (US-ET) / 1:00 pm (Brazil) Access in English: +1 (786) 924 6977 Access in Portuguese: +55 (11) 4688 6361
3Q14 Earnings Conference Call
 3Q14 Earnings Conference Call 2 Group Overview CONTAX IS THE LEADING CRM BPO COMPANY IN SOUTH AMERICA Contax Group at a glance Contax Group footprint and portfolio of services Contax Group Highlights 4
INSTITUTIONAL PRESENTATION 3Q18. p. 1
 INSTITUTIONAL PRESENTATION 3Q18 p. 1 Market under transformation and with high growth potential Company ready to capture increase in profitability PROFITABILITY Scale business with high dilution potencial
3Q18 EARNINGS RELEASE. Earnings Release 3Q18 1 / 16
 EARNINGS RELEASE 3Q18 1 / 16 Monterrey, Mexico, October 25 th, 2018. Grupo Famsa, S.A.B. de C.V. (BMV: GFAMSA), a leading Mexican commercial conglomerate in the retail, consumer and savings sector, announced
Merger Presentation 90, 90, 90
 228, 132, 106 85, 134, 180 233, 234, 235 254, 221, 34 Merger Presentation 90, 90, 90 1, 64, 148 226, 31, 29 December 2017 UNIDAS TRACK-RECORD 1985-2000 2001-2009 2010-2012 2013-2015 2016 Foundation SAG
2016 Highlights. Gross margin expanded in both channels to reach 31.4% (growth of 364bps)
") February 22, 2017 Via Varejo S.A., Brazil s largest retailer of electronics, home appliances and furniture, announces its results for the fourth quarter (4Q16) and full year 2016. On November 1, 2016,
February 22, 2017 Via Varejo S.A., Brazil s largest retailer of electronics, home appliances and furniture, announces its results for the fourth quarter (4Q16) and full year 2016. On November 1, 2016,
1Q18 Earnings Conference Call
 1Q18 Earnings Conference Call CONFERENCE CALL ON RESULTS May 04, 2018 1:00 p.m. (Brazil) / 12 noon (US-EST) Access in Portuguese: +55 11 3127-4971 or +55 11 3728-5971 Access in English: +1 516-300-1066
NON-RECURRING IMPACTS IN 2Q18
 2Q18 RESULTS 1 NON-RECURRING IMPACTS IN 2Q18 Brazil: Truck Drivers Strike + World Cup ~R$7M in Sales ~R$5M in EBITDA USA Non-recurring legal fees: ~R$1.6M in EBITDA Consolidated Impact in Results Net Revenue
IMPORTANT INFORMATION
 INSTITUTIONAL PRESENTATION Dec/2013 IMPORTANT INFORMATION This document contains forward-looking information to take into account regarding the business prospects, operational and financial results estimates
Presentation of 1Q17 Results. May 11th, 2017
 Presentation of Results May 11th, 2017 Disclaimer The forward-looking statements contained herein are based on our management s current assumptions and estimates, which may result in material differences
2015 and 4Q15 Results FLRY3. March 2016
 2015 and Results FLRY3 March 2016 Disclosure This presentation may contain forward-looking statements. Such statements are not statements of historical facts and reflect the beliefs and expectations of
CORPORATE PRESENTATION
 CORPORATE PRESENTATION Grupo Pão de Açúcar and Globex Utilidades May, 2011 ABOUT GRUPO PÃO DE AÇÚCAR > Key figures > R$ 50+ bi Sales 1 > #1 Retailer in Brazil > Growth higher than the 2nd player s 2 >
Valid reports Net Revenue of R$412.1 million in 3Q17, down 3.2% from 3Q16 and up 5.2% from 2Q17.
 Valid reports Net Revenue of R$412.1 million in, down 3.2% from and up 5.2% from 2Q17. Rio de Janeiro, November 8 th 2017 Valid (B 3 : VLID3 - ON) announces today its results for the third quarter of 2017
4Q17 Results. CONFERENCE CALL ON RESULTS February 09, :00 p.m. (Brazil) / 10:00 a.m. (US-EST)
 / 10:00 a.m. (US-EST)") 4Q17 Results CONFERENCE CALL ON RESULTS February 09, 2018 1:00 p.m. (Brazil) / 10:00 a.m. (US-EST) Access in Portuguese: +55 11 3127-4971 +55 11 3728-5971 Access in English: +1 516-300-1066 Password: Lojas
4Q17 Results CONFERENCE CALL ON RESULTS February 09, 2018 1:00 p.m. (Brazil) / 10:00 a.m. (US-EST) Access in Portuguese: +55 11 3127-4971 +55 11 3728-5971 Access in English: +1 516-300-1066 Password: Lojas
CENCOSUD DAY BUENOS AIRES 2016 CONSOLIDATING OUR STRATEGY
 CENCOSUD DAY BUENOS AIRES 2016 CONSOLIDATING OUR STRATEGY AGENDA 1. CENCOSUD INDICATORS 2. STRATEGIC THRUSTS AND PROGRESS OF THE LAST 12 MONTHS 3. VISION FOR THE FUTURE 4. OPPORTUNITIES PER COUNTRY 1.
4Q16 Results. CONFERENCE CALL ON RESULTS February 10, :00 p.m. (Brazil) / a.m. (US-EST)
 / a.m. (US-EST)") CONFERENCE CALL ON RESULTS February 10, 2017 1:00 p.m. (Brazil) / 10.00 a.m. (US-EST) 4Q16 Results Access in Portuguese: +55 11 3127-4971 +55 11 3728-5971 Access in English: +1 516-300-1066 Password: Lojas
CONFERENCE CALL ON RESULTS February 10, 2017 1:00 p.m. (Brazil) / 10.00 a.m. (US-EST) 4Q16 Results Access in Portuguese: +55 11 3127-4971 +55 11 3728-5971 Access in English: +1 516-300-1066 Password: Lojas
A purpose-driven, global, multichannel cosmetics group. Transaction close briefing 11th September 2017
 A purpose-driven, global, multichannel cosmetics group Transaction close briefing 11th September 2017 1 2 Three brands, one vision Guilherme Leal TODAY'S AGENDA A renewed governance and management structure
3Q13 Earnings Release
 3Q13 Earnings Release São Paulo, October 31, 2013 Smiles S.A. (BM&FBOVESPA: SMLE3), one of the largest coalition programs in Brazil, with more than 9.5 million members, announces today its results for
Fixed Income Presentation 3Q17
 Fixed Income Presentation 3Q17 1 Agenda 1. Company Overview 2. Investment Highlights 3. Operating and Financial Highlights 2 Section 1 Company Overview 3 Company Overview Company Overview Competitive Advantages
Resultados 3º Trimestre de de outubro Q18 and 2018 Results February 21, 2019
 4Q18 and 2018 Results February 21, 2019 2018: Highlights OPTIMIZATION OF STORE PORTFOLIO 15 Pão de Açúcar stores renovated into the new model 23 Extra Super to Mercado Extra 13 conversions to Compre Bem
CAMIL ANNOUNCES ITS THIRD QUARTER RESULTS (3Q17) The Company reached an EBITDA of R$128.9 million with EBITDA margin of 11.
 The Company reached an EBITDA of R$128.9 million with EBITDA margin of 11.") CAMIL ANNOUNCES ITS THIRD QUARTER RESULTS (3Q17) The Company reached an EBITDA of R$128.9 million with EBITDA margin of 11.1% in 3Q17 São Paulo, January 11, 2018 Camil Alimentos S.A. ("Company" or "Camil")
CAMIL ANNOUNCES ITS THIRD QUARTER RESULTS (3Q17) The Company reached an EBITDA of R$128.9 million with EBITDA margin of 11.1% in 3Q17 São Paulo, January 11, 2018 Camil Alimentos S.A. ("Company" or "Camil")
Banco Santander (Brasil) S.A.
 S.A.") Banco Santander (Brasil) S.A. 9M09 IFRS Results Pro forma October 28th, 2009 Table of Contents 2 Macroeconomic Scenario and Financial System 9M09 - Strategy -Results - Business Macroeconomic Scenario 3
Banco Santander (Brasil) S.A. 9M09 IFRS Results Pro forma October 28th, 2009 Table of Contents 2 Macroeconomic Scenario and Financial System 9M09 - Strategy -Results - Business Macroeconomic Scenario 3
Arezzo Indústria e Comércio S.A. Parent company and consolidated financial statements at December 31, 2017 and 2016 and independent auditor s report
 (A free translation of the original in Portuguese) Arezzo Indústria e Comércio S.A. Parent company and consolidated financial statements at December 31, 2017 and 2016 and independent auditor s report (A
MAISONS DU MONDE: FULL-YEAR 2018 RESULTS
 PRESS RELEASE MAISONS DU MONDE: FULL-YEAR 2018 RESULTS Strong performance in line with targets Continued solid momentum in online and international sales Focus on strategic pillars to deliver further profitable
9M 2014 Results Presentation November 13, 2014
 9M 2014 Results Presentation November 13, 2014 9M 2014 key facts Sales: Euro 668.4 million +8.1% (+8.8% constant FX) Directly Operated Stores Same Store Sales: +9.4% (vs -5.7% in 9M 13) EBITDA: Euro 46.3
2Q12 Results FLRY 3. August, 2012
 2Q12 Results FLRY 3 August, 2012 ALL RIGHTS RESERVED 2012 Disclaimer This presentation may contain forward-looking statements. Such statements are not statements of historical facts and reflect the beliefs
Group Strategy. Claus-Dietrich Lahrs, Chief Executive Officer. November 8, 2011
 Group Strategy Claus-Dietrich Lahrs, Chief Executive Officer November 8, 2011 HUGO BOSS Investor Day 2011 // Group Strategy HUGO BOSS November 8, 2011 2 / 37 AGENDA INTRODUCTION HUGO BOSS A PREMIUM BUSINESS
4Q16. Discussion Material
 Discussion Material - 2016 March, 2017 Disclaimer This document may contain prospective statements, which are subject to risks and uncertainties as they were based on expectations of the Company s management
2Q17 Highlights. Same-store sales growth reached 10.8% in 2Q17 among brick and mortar stores. Double-digit growth not seen since 3Q13.
 July 24, 2017 Via Varejo S.A., Brazil s largest electronics, home appliances and furniture retailer, announces its results in the second quarter of 2017 (2Q17). On November 1, 2016, the Company started
4Q15 and 2015 Results
 4Q15 and 2015 Results Investor Relations Contacts: Felipe Enck Gonçalves CFO and Investor Relations +55 (31) 3615-8400 ri@logcp.com.br www.logcp.com.br/relacoes-com-investidores 1 A LOG COMMERCIAL PROPERTIES
1Q18 Earnings April 27, Q18 Earnings Presentation April 27, 2018
 1Q18 Earnings Presentation April 27, 2018 Higher profitability at GPA: Reversal of sales trend and strong recovery in profitability at Multivarejo, accompanied by solid performance of Assaí Multivarejo
Discussion Material November, ParkShoppingSãoCaetano São Caetano (SP) 1
 1") Discussion Material November, 2017 ParkShoppingSãoCaetano São Caetano (SP) 1 Disclaimer This document may contain prospective statements, which are subject to risks and uncertainties as they were based
Discussion Material November, 2017 ParkShoppingSãoCaetano São Caetano (SP) 1 Disclaimer This document may contain prospective statements, which are subject to risks and uncertainties as they were based
Strong Operating Cash Generation: R$ 263 MM Net Debt reduced to 1.06x EBITDA LTM Growth of 15.7% in Bookings and 21.1% in Profit. Period Highlights*
 Santo André, November 8th, 2017: CVC Brasil Operadora e Agência de Viagens S.A. (BM&FBOVESPA: CVCB3), the largest tourism operator in the Americas, informs its shareholders and other market participants
Cia. Hering s gross revenue growth of 12.6% in 2013, with EBITDA of R$ MM and EBITDA margin of 26.1%
 Blumenau, February 20 2014. Cia. Hering (BM&FBOVESPA: HGTX3), one of the largest retail and apparel designers and manufacturers in Brazil, announces the results of the fourth quarter of 2013(4Q13). The
CORPORATE PRESENTATION
 CORPORATE PRESENTATION 2017 InRetail Overview Multi-format retailer with exclusive focus in Peru Leading positions in its 3 segments #1 supermarket chain #1 pharmacy chain #1 shopping center operator Controlled
PRESS AND ANALYST CONFERENCE
 PRESS AND ANALYST CONFERENCE Metzingen April 12, 2010 Press and Analyst Conference 2010 HUGO BOSS April 12, 2010 2 / 39 AGENDA KEY FACTS 2009 FINANCIAL PERFORMANCE 2009 OUTLOOK 2010 GROWTH STRATEGY 2015
H Financial Results
 H1 2016 Financial Results Gilles Petit, CEO Arnaud Louet, CFO H1 2016 Financial Results FORWARD LOOKING STATEMENTS This presentation does not constitute an offer to sell securities in the United States
CORPORATE PRESENTATION. March 2017
 CORPORATE PRESENTATION March 2017 InRetail Overview Multi-format retailer with exclusive focus in Peru Leading positions in its 3 segments #1 supermarket chain #1 pharmacy chain #1 shopping center operator
Fixed Income Presentation 1Q18
 Fixed Income Presentation 1Q18 1 Agenda 1. Company Overview 2. Investment Highlights 3. Operating and Financial Highlights 2 Section 1 Company Overview 3 Company Overview Company Overview Competitive Advantages
Investor Presentation
 Investor Presentation Cautionary Note Regarding Forward-Looking Statements This presentation contains forward-looking information, including the Company s statements regarding its future outlook. In addition,
ITAÚ UNIBANCO HOLDING S.A.
 CNPJ 60.872.504/0001-23 ITAÚ UNIBANCO HOLDING S.A. A Publicly Listed Company ANNOUNCEMENT TO THE MARKET Conference Calls of the 2 nd quarter 2017 Result In accordance with the invitation extended to the
Netshoes Limited Reports First Quarter 2017 Results
 Netshoes Limited Reports First Quarter 2017 Results Gross Merchandise Volume increased 20.6%, or 25.2% on an FX neutral basis, to R$531.2 million, compared to 1Q-2016 Margin improvements reflect operating
Gross Margin (%) Gross Profit (R$Millions) Change % 1Q15/1Q14. Change % 1H15/1H % -5.2% 61.9% % 61.9% 58.
 Gross Profit (R$Millions) Change % 1Q15/1Q14. Change % 1H15/1H % -5.2% 61.9% % 61.9% 58.") São Paulo, Brazil, August 13 2015 Restoque Comércio e Confecções de Roupas S.A. ( Company ) (LLIS3), a leading company of premium clothing and apparel industry in Brazil, presents its results of the second
São Paulo, Brazil, August 13 2015 Restoque Comércio e Confecções de Roupas S.A. ( Company ) (LLIS3), a leading company of premium clothing and apparel industry in Brazil, presents its results of the second
FIRST QUARTER OF 2018 RESULTS
 FIRST QUARTER OF 2018 RESULTS São Paulo, May 07, 2018. Linx S.A. (B3: LINX3; Bloomberg: LINX3:BZ e Reuters: LINX3.SA), announces its consolidated results for the first quarter of 2018 (). The Company s
CONFERENCE CALL. (only in Portuguese) Date: November 14 th, at 5 pm BRT/ 2 pm US ET/ 7 pm London. Phone: Dial-in Brazil:
 Date: November 14 th, at 5 pm BRT/ 2 pm US ET/ 7 pm London. Phone: Dial-in Brazil:") CONFERENCE CALL (only in Portuguese) Date: November 14 th, 2017 at 5 pm BRT/ 2 pm US ET/ 7 pm London Phone: Dial-in Brazil: +55 11 3193-1001 Code: Alpargatas Presentation: http://ri.alpargatas.com.br Speakers:
CONFERENCE CALL (only in Portuguese) Date: November 14 th, 2017 at 5 pm BRT/ 2 pm US ET/ 7 pm London Phone: Dial-in Brazil: +55 11 3193-1001 Code: Alpargatas Presentation: http://ri.alpargatas.com.br Speakers:
3Q17 HIGHLIGHTS. Gross margin 43.8% 47.0% 3.2p.p. 46.1% 47.9% 1.7p.p. Net margin -7.8% -9.2% -1.4p.p. -9.7% -7.4% 2.3p.p.
 3Q17 RESULTS GRUPO TECHNOS ANNOUNCES 3Q17 EARNINGS RESULTS Rio de Janeiro, October 26, 2017 Grupo Technos (BM&FBovespa: TECN3) announces its 3Q results. The following financial and operational information
2017 RESULTS. JBS ended 2017 with a 18.9% higher EBITDA of R$13.4 billion. FY free cash flow was R$2.8 billion
 2017 RESULTS JBS ended 2017 with a 18.9% higher EBITDA of R$13.4 billion FY free cash flow was R$2.8 billion In 2017, net revenue was R$163.2 billion, equivalent to US$51.5 billion Gross profit totaled
4Q18 & 2018 EARNINGS RELEASE
 São Paulo, February 20, 2019 - GPA [B3: PCAR4; NYSE: CBD] announces its results for the fourth quarter and full year of 2018. Due to the ongoing divestment of the interest held by GPA in Via Varejo S.A.,
FIRST HALF 2018 RESULTS July 31, 2018
 FIRST HALF 2018 RESULTS July 31, 2018 1H 2018 HIGHLIGHTS HIGHLIGHTS 1H2018 Sales: Euro 414.1 mln, -8.2% (-7.2% at constant forex) due to: A weak 1Q18 (-11.2%) mainly impacted by lower sales of old seasons
1Q17. BH Shopping, Belo Horizonte
 BH Shopping, Belo Horizonte Discussion Material May, 2017 Disclaimer This document may contain prospective statements, which are subject to risks and uncertainties as they were based on expectations of
2Q17 Earnings Release
 2Q17 Earnings Release 2Q17 HIGHLIGHTS 34.1% growth in access using ultra broadband (over 10MB) Uberlândia - MG, August 2017 - Algar Telecom, a comprehensive integrated telecommunications and IT company,
Full year and Q results March 15, 2017
 Full year and Q4 2016 results March 15, 2017 Disclaimer This document and its related communication ( Presentation ) have been issued by windeln.de SE and its subsidiaries ( Company ) and do not constitute
Felipe Dutra Chief Finance & Technology Officer
 Felipe Dutra Chief Finance & Technology Officer Agenda Financial Performance Role of Financial Discipline in our business model Risk management: Balancing deleveraging with returning cash to shareholders
+3% INCREASE IN REVENUES TO MILLION DRIVEN BY A POSITIVE PERFORMANCE
 PRESS RELEASE - 2016 RESULTS +3% INCREASE IN REVENUES TO 900.8 MILLION DRIVEN BY A POSITIVE PERFORMANCE OF THE WHOLESALE CHANNEL, UP 12%, AND ONLINE SALES, WHICH GREW BY MORE THAN 30%. +9% INCREASE IN
2017 RESULTS 1Q18 RESULTS
 2017 RESULTS 1Q18 RESULTS São Paulo, May 11 th, 2018 - International Meal Company Alimentação S.A. (B3: MEAL3), one of the largest multibrand companies in the Latin American food retail industry, announces
Corporate presentation August 2017 FLRY3
 Corporate presentation August 2017 FLRY3 Agenda Overview and Strategy Financial Performance Healthcare Sector in Brazil Expansion Plan Ownership Structure and Governance 2 Agenda Overview and Strategy
Fourth-quarter and full-year 2017 RESULTS MARCH,
 Fourth-quarter and full-year 2017 RESULTS MARCH, 15 2018 DISCLAIMERS This presentation contains forward-looking statements. Such statements are not statements of historical fact, and reflect the beliefs
FIRST-HALF 2017 RESULTS. 27 July 2017
 FIRST-HALF 2017 RESULTS 27 July 2017 Disclaimer FORWARD LOOKING STATEMENTS This presentation contains certain statements that constitute "forward-looking statements", including but not limited to statements
Highlights of the Period (*)
") B2W ANNOUCES GROSS REVENUE GROWTH OF 50% AND EBITDA GROWTH OF 67% FOR 1H07 Rio de Janeiro, Brazil, August 9, 2007 B2W Companhia Global do Varejo (Bovespa: BTOW3), company resultant from the merger between
B2W ANNOUCES GROSS REVENUE GROWTH OF 50% AND EBITDA GROWTH OF 67% FOR 1H07 Rio de Janeiro, Brazil, August 9, 2007 B2W Companhia Global do Varejo (Bovespa: BTOW3), company resultant from the merger between
Investor Presentation
 Investor Presentation Cautionary Note Regarding Forward-Looking Statements This presentation contains forward-looking information, including the Company s statements regarding its future outlook. In addition,
Corporate presentation May 2017 FLRY3
 Corporate presentation May 2017 FLRY3 Agenda Overview and Strategy Financial Performance Healthcare Sector in Brazil Expansion Plan Ownership Structure and Governance 2 Agenda Overview and Strategy Financial
LOCAMERICA Investors Institutional Presentation
 228, 132, 106 85, 134, 180 233, 234, 235 254, 221, 34 LOCAMERICA Investors Institutional Presentation 90, 90, 90 1, 64, 148 226, 31, 29 History of Entrepreneurship and Growth 1993 2000 2008 2012 2015/16
ROADSHOW Hong Kong // Credit Suisse
 ROADSHOW Hong Kong // Credit Suisse HUGO BOSS Company Handout Hong Kong, July 3, 2015 HUGO BOSS July 3, 2015 2 Agenda Financial Review First Quarter 2015 Strategic Outlook 2015 and beyond Financial Outlook
1H 2018 Results Update Analyst Presentation
 1H 2018 Results Update Analyst Presentation July 31, 2018-6.00 PM CET Disclaimer This presentation contains forward-looking statements regarding future events and results of the Company that are based
Earnings Conference Call 1Q14
 Earnings Conference Call 1Q14 April 30 th, 1 p.m. (Brazil) / 12 p.m. (US-ET) Access in English: +1 516 300 1066 Access in Portuguese: +55 11 3127 4971/ + 55 11 3728 5971 Password: Lojas Renner Replay:
1Q17 Highlights. Sales recovery in Brick and Mortar Stores, with same-store sales growth of 2.5% in 1Q17.
 April 26, 2017 Via Varejo S.A., Brazil s largest electronics, home appliances and furniture retailer, announces its results in the first quarter of 2017 (1Q17). On November 1, 2016, the Company started
Driving shareholder value
 KONE CMD 2017 Driving shareholder value ILKKA HARA, CFO SEPTEMBER 29, 2017 AGENDA FINANCIAL OVERVIEW BUILDING ON THE STRONG BUSINESS MODEL INVESTING FOR THE FUTURE LOOKING AHEAD Financial overview 3 Sales
FIRST-HALF 2018 RESULTS 30 JULY 2018
 FIRST-HALF 2018 RESULTS 30 JULY 2018 Disclaimer FORWARD LOOKING STATEMENTS This presentation contains certain statements that constitute "forward-looking statements", including but not limited to statements
(a) Gross Profit and Gross Margin without Depreciation allocated to cost
 Gross Profit and Gross Margin without Depreciation allocated to cost") 4Q16 Blumenau, February 23 th, 2017. Cia. Hering (BM&FBOVESPA: HGTX3), one of the largest retail and apparel designer and manufacturer in Brazil, announces the results of the fourth quarter of 2016 (4Q16).
4Q16 Blumenau, February 23 th, 2017. Cia. Hering (BM&FBOVESPA: HGTX3), one of the largest retail and apparel designer and manufacturer in Brazil, announces the results of the fourth quarter of 2016 (4Q16).
Investor Presentation
 Investor Presentation 3Q10 Growth for the next 115 years SULAMÉRICA TODAY A Unique Kind of Insurance Company Ranking as independent pure play Brazilian insurance company not owned by a bank #1 Ranking
Earnings Results 3Q18 October, 26, Q18 Results October 26, 2018
 3Q18 Results October 26, 2018 The multi-channel, multi-format and multi-region portfolio contributed to the sustainability of the Company's performance towards reaching this year's Guidance Gross Sales
HUGO BOSS Investor Day 2013 Financial Strategy. Mr. Mark Langer, Chief Financial Officer November 26, 2013
 HUGO BOSS Investor Day 2013 Financial Strategy Mr. Mark Langer, Chief Financial Officer November 26, 2013 Investor Day 2013 // Financial Strategy HUGO BOSS November 26, 2013 2 / 30 Agenda HUGO BOSS committed