4Q11 RESULTS PRESENTATION
|
|
|
- Cornelia Bradley
- 5 years ago
- Views:
Transcription
1 4Q11 RESULTS PRESENTATION 1 MARCH
2 DISCLAIMER This presentation contains forward looking information, including statements which constitute forward looking statements within the meaning of the U.S. Private Securities Litigation Reform Act of These statements are based on the current beliefs and assumptions of our management and on information available to management only as of the date such statements were made. Forward-looking statements include (a) information concerning strategy, possible or assumed future results of our operations, earnings, industry conditions, demand and pricing for our products and other aspects of our business, possible or future payment of dividends and share buy back program; and (b) statements that are preceded by, followed by or include the words believes, expects, anticipates, intends, is confident, plans, estimates, may, might, could, would, and the negatives of such terms or similar expressions. These statements are not guarantees of future performance and are subject to factors, risks and uncertainties that could cause the assumptions and beliefs upon which the forwarding looking statements were based to substantially differ from the expectation predicted herein. These factors, risks and uncertainties include, but are not limited to, changes in demand for the company s services, technological changes, the effects of competition, telecommunications sector conditions, changes in regulation and economic conditions. Further, certain forward looking statements are based upon assumptions as to future events that may not prove to be accurate. Therefore, actual outcomes and results may differ materially from the plans, strategy, objectives, expectations, estimates and intentions expressed or implied in such forward-looking statements. Additionally, some of these statements refer to board proposals to be submitted to ZON - Multimédia Serviços de Telecomunicações e Multimédia, SGPS, S.A. ( Multimedia or ZON ) AGM and subject to (i) its approval by Multimedia s shareholders, (ii) the market conditions and (iii) the ZON s financial and accounting position as revealed in the financial statements approved by Multimedia s AGM. Forward-looking statements speak only as of the date they are made, and we do not undertake any obligation to update them in light of new information or future developments or to provide reasons why actual results may differ. You are cautioned not to place undue reliance on any forward-looking statements. ZON Multimedia is exempt from filing periodic reports with the United States Securities and Exchange Commission ( SEC ) pursuant to Rule 12g3-2(b) under the Securities Exchange Act of 1934, as amended. The SEC file number for PT Multimedia s exemption is No Under this exemption, ZON Multimedia is required to post on its website English language translations, versions or summaries of certain information that it has made or is required to make public in Portugal, has filed or is required to file with the regulated market Eurolist by Euronext Lisbon or has distributed or is required to distribute to its security holders. This presentation is not an offer to sell or a solicitation of an offer to buy any securities. 2

![[Thousands, %] ZON cable customer profile 4Q11 [%] 642.3 708.7 484.4 55.](/docs-images/93/113864482/images/3-2.jpg "2% 60.1% Single Play 24.2% 41.0% Double Play 15.7% Triple Play 60.")
3 % 130% 110% 90% 70% 50% 30% Leading in Triple Play with 60% penetration Growth in 3P customers / Penetration [Thousands, %] ZON cable customer profile 4Q11 [%] % 60.1% Single Play 24.2% 41.0% Double Play 15.7% Triple Play 60.1% 4Q09 4Q10 4Q11 3
4 4Q Q08 2Q08 3Q08 4Q08 1Q09 2Q09 3Q09 4Q09 1Q10 2Q10 3Q10 4Q10 1Q11 2Q11 3Q11 4Q11 90% 80% 70% 60% 50% 40% 30% 20% 10% 00% Resilience in ARPU supported by growth in core basic Triple Play revenues Blended ARPU, Triple Play Penetration [Euros, %] ARPU Evolution [4Q10 = Base 1] % Blended ARPU 3Play Penetration % Q10 1Q11 2Q11 3Q11 4Q11 Blended ARPU Basic ARPU Premium ARPU +4.4% +1.2% -13.2% Basic ARPU growth of 4.4% 4

![4Q11 [Thousands] 12.8 1,567 1.4 1,042-1.5-1.6-17.](/docs-images/93/113864482/images/5-1.jpg "1 4Q10 1Q11 2Q11 3Q11 4Q11 256 74 Others Source: ZON, ANACOM,")
5 Maintaining leadership in Pay TV Growth in Cable platform Pay TV Net Adds [Thousands] Relative size of Pay TV customer base 4Q11 [Thousands] , , Q10 1Q11 2Q11 3Q11 4Q Others Source: ZON, ANACOM, Company Reports 5
6 Maintaining leadership in Pay TV Leadership in Triple Play Pay TV Market Share Evolution [%] Triple Play Market Share 4Q11 [%] 2,976 2,775 2, % 2, % 10.2% 12.4% 13.7% 23.0% 29.9% 35.0% 72.3% 64.4% 57.9% 53.9% Others 54% ZON 46% ZON PT Cabovisão Others Source: ZON, ANACOM 6
![Digital services still growing well ZON HD Boxes Installed [Thousands] +11.5% 884.7 910.3 928.9 949.9 986.](/docs-images/93/113864482/images/7-1.jpg "5 4Q10 1Q11 2Q11 3Q11 4Q11 88% of ZON customers receive digital services, and the almost 987 thousand HD set top boxes installed (around 10% of which are IRIS-enabled) are driving the use of higher")
7 Digital services still growing well ZON HD Boxes Installed [Thousands] +11.5% Q10 1Q11 2Q11 3Q11 4Q11 88% of ZON customers receive digital services, and the almost 987 thousand HD set top boxes installed (around 10% of which are IRIS-enabled) are driving the use of higher value services, such as VOD Recovery of average number of Premium subscribers vs. Previous quarter 7


8 Latest Launches: ZON Online & ZON Phone App ZON Online is a free service which allows IRIS customers access to ZON BOX features and functionalities on their laptop and ipad The ZON Phone APP enables customers to take their unlimited Fixed Voice tariff plans with them on their smartphone or tablet 8
9 Continuing quarterly sequential growth in BB reinforcing position as leading NGN operator Broadband customer mix Broadband Market and Market ZON@FON Hotspots and Usage [%] Shares [%] [Thousands, Millions of Minutes] ZON Fibra 29% 739k subs 2 Mbps 3% 6-15 Mbps 47% , % 12.3% 42.1% 1, % 9.1% 44.5% 2, % 6.6% 46.9% 2, % 5.4% 49.4% 2,500 2,000 1,500 1, Mbps 22% % 31.9% 32.5% 33.0% ZON PT Sonaecom Others 00 4Q09 1Q10 2Q10 3Q10 4Q10 1Q11 2Q11 3Q11 4Q11 Active Hotspots Usage: Minutes Broadband net adds of 14.2 thousand in 4Q11. Adjusting for network coverage ZON is either #1 or close to #1 in almost all its coverage areas Leadership in WiFi in Portugal Source: ZON, ANACOM 9
10 % 75% 70% 65% 60% 55% 50% 45% 40% Continued Fixed Voice subscriber growth Fixed Voice Subs and Penetration [Thousands, %] Fixed Voice Market and Market Shares [Thousands, %] Mobile Subscribers [Thousands] +13.7% +15.8% % % , % 18.0% 3, % 16.0% 3,664 3, % 11.5% 14.5% 14.0% % 55.5% 52.6% 51.6% % 16.8% 21.2% 22.8% M11 4Q10 4Q11 ZON PT Sonaecom Others 4Q10 4Q11 ZON is the only relevant operator growing in the Fixed Voice market, recording net adds of 40 thousand in 4Q11, the best quarter of the year Source: ZON, ANACOM 10
![300 2500 200 1500 100 50 0 07 07 06 06 05 05 04 04 03 A good quarter in Cinemas, outperforming the market once more Cinema Tickets Sold and Average Revenue Per Ticket [Thousands, Euros] Gross Revenue](/docs-images/93/113864482/images/11-2.jpg "& Attendance Performance 2011 [%] Share of cinema distribution revenues 2011 [%] 2,242 2,016 2,094 4.7 4.7 4.9 2,372 2,260 5.1 4.8 0.6% -2.9% -3.9% -5.2% Castello Lopes 9.2% Others 10.7% ZON 52.")
11 A good quarter in Cinemas, outperforming the market once more Cinema Tickets Sold and Average Revenue Per Ticket [Thousands, Euros] Gross Revenue & Attendance Performance 2011 [%] Share of cinema distribution revenues 2011 [%] 2,242 2,016 2, ,372 2, % -2.9% -3.9% -5.2% Castello Lopes 9.2% Others 10.7% ZON 52.0% 4Q10 1Q11 2Q11 3Q11 4Q11 Gross Revenue Attendance Columbia 28.1% Tickets Sold Avg. Revenue Per Ticket ZON Market 4Q11 an improvement YoY, with 2.26 million tickets sold Average revenue per ticket of 4.8 euros, +1.7% yoy Performance in Gross Revenues and Attendance well above the total market in 2011, according to data from the Institute For Cinema and Audiovisuals ZON Lusomundo distributed 5 of the top 10 movies in 2011, with its share of revenues reaching 52% Source: ZON, ICA [Portuguese Institute For Cinema and Audiovisuals] 11


12 ZAP posting good results in Angola ZAP Subscribers Number of ZAP stores Q10 1Q11 2Q11 3Q11 4Q11 4Q10 1Q11 2Q11 3Q11 4Q11 Increasing the pace of customer acquisition ARPU > 30 USD On track to reach operational break-even in 2012 Strong growth of commercial network: 10 ZAP stores in Angola and 3 in Mozambique 430 agent stores in Angola and 60 in Mozambique Door-to-door sales force with 200 people in Angola 12
13 Financial Review 13

![[Millions of Euros] Consolidated Operating](/docs-images/93/113864482/images/14-4.jpg "Revenues 2011 / 2010 [Millions of Euros] (2.")

14 Slight decline of Total Operating Revenues Consolidated Operating Revenues 4Q11 / 4Q10 [Millions of Euros] Consolidated Operating Revenues 2011 / 2010 [Millions of Euros] (2.5)% (2.0)% Q10 1Q11 2Q11 3Q11 4Q
15 Good performance of core Triple Play revenues excluding impact of Premium channel revenues, with qoq evolution recovery Pay TV, Broadband and Voice Revenues [Millions of Euros] ARPU Revenues Growth [4Q10 = Base 1] (2.8%) +1.2% Q10 1Q11 2Q11 3Q11 4Q Q10 1Q11 2Q11 3Q11 4Q11 Total Basic Premium +3.5% +0.3% -13.9% Flat qoq performance 15
16 Positive quarter in Audiovisuals and negative quarter in Cinemas yoy Cinema Revenues [Millions of Euros] Audiovisuals Revenues [Millions of Euros] (3.8)% +9.2% Q10 4Q11 4Q10 4Q11 (3.7)% (0.8)%
![Cost savings materializing, with reduced levels of churn and commercial activity Operating Costs 4Q11 / 4Q10 [Millions of Euros] Operating Costs 2011 / 2010 [Millions of Euros] (3.9)% (4.6)% 147.](/docs-images/93/113864482/images/17-3.jpg "7 142.0 570.0 543.6 4Q10 4Q11 2010 2011 Operating Costs (millions of euros) 2011 Δ % Drivers W&S (59.3) 1.7% Marginal increase in W&S of 1 million euros in 2011 Direct Costs (243.9) (3.")
17 Cost savings materializing, with reduced levels of churn and commercial activity Operating Costs 4Q11 / 4Q10 [Millions of Euros] Operating Costs 2011 / 2010 [Millions of Euros] (3.9)% (4.6)% Q10 4Q Operating Costs (millions of euros) 2011 Δ % Drivers W&S (59.3) 1.7% Marginal increase in W&S of 1 million euros in 2011 Direct Costs (243.9) (3.1%) Commercial Costs (62.1) (17.0%) Other Operating Costs (178.3) (3.7%) Reduction resulting from a decrease in programming costs, due to lower average premium channel subscriptions and a reduction in the total costs in certain channels contracted; and also of lower interconnection and advertising shared revenue costs Significant decline in Commercial Costs linked to a less aggressive competitive and promotional environment, driving lower churn and lower sales related costs and to the lower level of commercial activity; and also to a more efficient use of available sales channels Other operating costs posted a 3.7% decline due to significant savings in customer service, maintenance and repair related costs as a result of the implementation of a number of efficiency improvement measures at the contact center level 17

![4Q11 / 4Q10 [Millions of Euros, %] EBITDA and EBITDA Margin 2011 / 2010 [Millions of Euros, %]](/docs-images/93/113864482/images/18-3.jpg "EBITDA Margin q.o.q. [%] +1.0pp +2.9% 302.4 311.2 37.1% 37.1% 37.2% 35.3% 35.9% 73.3 79.5 78.5 79.")

18 % 43% 41% 39% 37% 35% 33% 31% 29% 27% % 90% 80% 70% 60% 50% 40% 30% 20% 10% 0% Continued strong margin improvement EBITDA and EBITDA Margin 4Q11 / 4Q10 [Millions of Euros, %] EBITDA and EBITDA Margin 2011 / 2010 [Millions of Euros, %] EBITDA Margin q.o.q. [%] +1.0pp +2.9% % 37.1% 37.2% 35.3% 35.9% % 37.1% 37.2% % 36.4% 34.3% 31.7% 33.3% 34.1% 34.1% 33.2% 33.2% 34.1% 30.1% 4Q10 1Q11 2Q11 3Q11 4Q Q 2Q 3Q 4Q EBITDA Margin 2009 EBITDA Margin 2010 EBITDA Margin
![Net Income growth in 4Q11 Net Income 4Q11 / 4Q10 [Millions of Euros] Net Income 2011 / 2010 [Millions of Euros] Net Income 2011 / 2010 without impact of Angolan operations [Millions of Euros] +46.](/docs-images/93/113864482/images/19-1.jpg "4% (3.5)% +2.1% 35.4 34.2 43.5 44.4 5.7 3.9 4Q10 4Q11 2010 2011 2010 2011 (millions of euros) 2011 Δ % Drivers D&A (217.6) (0.")
19 Net Income growth in 4Q11 Net Income 4Q11 / 4Q10 [Millions of Euros] Net Income 2011 / 2010 [Millions of Euros] Net Income 2011 / 2010 without impact of Angolan operations [Millions of Euros] +46.4% (3.5)% +2.1% Q10 4Q (millions of euros) 2011 Δ % Drivers D&A (217.6) (0.9)% Level of Depreciation and Amortization is still relatively high due to the significant CAPEX of the previous three years Net Financial Expenses (43.0) 19.2% Net Interest charges and other financial expenses of 32.7 million euros Negative contribution in FY11 of the Equity Consolidation of Angolan operation in the amount of 10.2 million euros, decreasing from 2.8 million euros in 1Q11 to 2.3 million euros in 2Q11 and 2.0 million euros in 3Q11, with a hike to 3.1 million euros in 4Q11 due to subscriber growth which led to higher commercial and activation-related costs Income Taxes (14.8) 58.2% Normalized level of tax rate at 29.8% 19
20 Continued reduction of CAPEX to more normalized levels as forecast Total CAPEX 4Q11 / 4Q10 [Millions of Euros] Total CAPEX 2011 / 2010 [Millions of Euros] (48.4)% (39.6)% Q10 1Q11 2Q11 3Q11 4Q Baseline CAPEX Non-Recurrent CAPEX Baseline CAPEX Non-Recurrent CAPEX 20
![Strong improvement in EBITDA CAPEX with the end of strong investment cycle EBITDA Total CAPEX & OCF After Investment [Millions of Euros] Free Cash Flow [Millions of Euros] 80 70 60 50 40 30 20 10](/docs-images/93/113864482/images/21-1.jpg "0-10 4Q09 1Q10 2Q10 3Q10 4Q10 1Q11 2Q11 3Q11 4Q11 48.5 33.1 37.9 30.8 6.0 3.4 (2.0) (8.7) (7.0) (15.1) (35.")
21 Strong improvement in EBITDA CAPEX with the end of strong investment cycle EBITDA Total CAPEX & OCF After Investment [Millions of Euros] Free Cash Flow [Millions of Euros] Q09 1Q10 2Q10 3Q10 4Q10 1Q11 2Q11 3Q11 4Q (2.0) (8.7) (7.0) (15.1) (35.5) 4Q09 1Q10 2Q10 3Q10 4Q10 1Q11 2Q11 3Q11 4Q11 EBITDA- Total CAPEX OCF After Investment Very strong FCF generation momentum 21
![Solid capital structure, 2.0x Net Financial Debt / EBITDA Change in Net Financial Debt [Millions of Euros] 2010 EBITDA-CAPEX 639.7 161.](/docs-images/93/113864482/images/22-1.jpg "4 Improvement led by solid EBITDA and decline in CAPEX Non-Cash Items and Working Capital Long Term Contracts 11.5 65.")
22 Solid capital structure, 2.0x Net Financial Debt / EBITDA Change in Net Financial Debt [Millions of Euros] 2010 EBITDA-CAPEX Improvement led by solid EBITDA and decline in CAPEX Non-Cash Items and Working Capital Long Term Contracts Continued reversal of the Change in WK in 2H11 after a peak in 2010 due to accelerated CAPEX programme Net Interest Paid 21.3 Income Taxes Paid 16.5 Net Dividends Paid 49.4 Other Items x Net Financial Debt / EBITDA at the end of
23 Wrap-up 23
24 Wrap-up Despite the difficult macroeconomic environment, ZON continues to post good results in its domestic businesses Good operational performance of the core Triple Play business with good growth in cable base Despite slowdown of Premium subscriptions, optimization of cost structure has enabled continued EBITDA growth Strong FCF with very strong quarterly Cash Flow momentum. Positive FCF after dividend payments, allowing for reduction in Net Financial Debt; Excellent results of the Angolan business, on track for EBITDA breakeven in
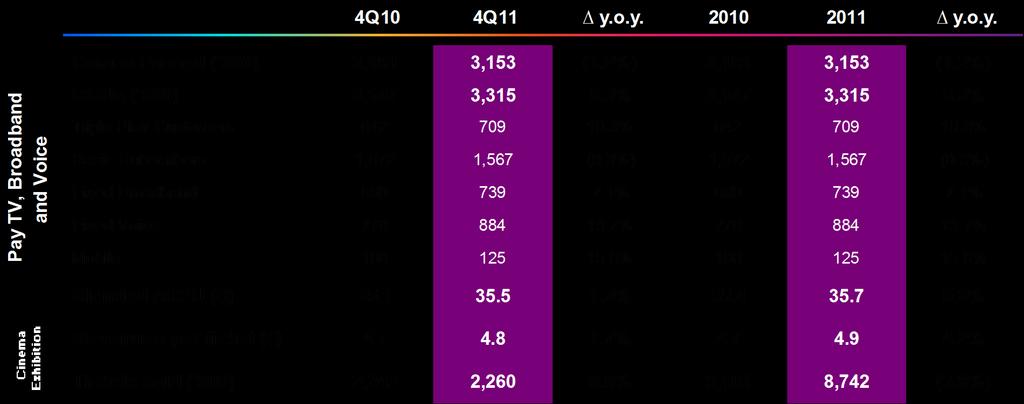
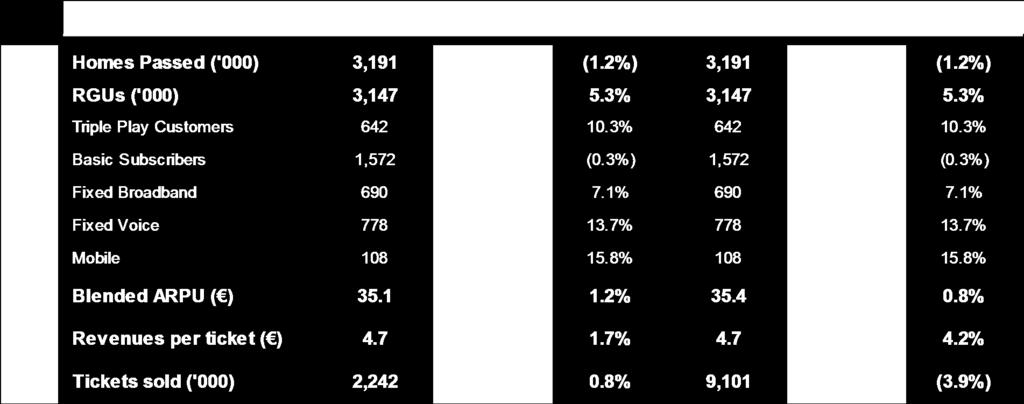
25 Appendix Financial Highlights Operational Highlights 25
26 Financial Highlights (Millions of Euros) 4Q10 4Q11 y.o.y y.o.y. Operating Revenues (2.5%) (2.0%) Pay TV, Broadband and Voice (2.8%) (1.7%) Audiovisuals % (0.8%) Cinema Exhibition (3.8%) (3.7%) Other (11.9) (12.9) 8.2% (48.0) (49.2) 2.5% EBITDA % % Income from Operations % % Net Income % (3.5%) CAPEX (48.4%) (39.6%) EBITDA minus CAPEX (5.2) 33.1 n.a % Net Financial Debt (0.3%) (0.3%) EBITDA margin (%) 33.2% 34.1% 1.0pp 34.7% 36.4% 1.7pp CAPEX as % of Revenues 35.5% 18.8% (16.7pp) 28.4% 17.5% (10.9pp) Net Financial Debt / EBITDA [x] 2.1x 2.0x n.a. 2.1x 2.0x n.a. 26
27 Operational Highlights 27


28 Contacts José Pedro Pereira da Costa CFO Maria João Carrapato Head of Investor Relations ZON Multimedia Avenida 5 de Outubro, Lisboa, Portugal Tel.: Fax:

29 29
9M09 RESULTS ANNOUNCEMENT PRESENTATION
 9M09 RESULTS ANNOUNCEMENT PRESENTATION 18 NOVEMBER 2009 DISCLAIMER This presentation contains forward looking information, including statements which constitute forward looking statements within the meaning
ZON Multimédia Serviços de Telecomunicações e Multimédia, SGPS, S.A.
 1 First Quarter 2012 Earnings Announcement 1 1Q12 HIGHLIGHTS Very resilient core Triple Play business, despite tough macroeconomic headwinds Efforts to contains costs and cut CAPEX are clear in solid quarterly
1. 2Q11 HIGHLIGHTS TRIPLE PLAY SERVICES POST SOLID PERFORMANCE STRONG PICK-UP IN OPERATING CASH FLOW AFTER CAPEX DECLINES MATERIALLY
 1. 2Q11 HIGHLIGHTS Table 1. Highlights of 2Q11 Results 2Q10 2Q11 2Q11 / 2Q10 1H10 1H11 1H11 / 1H10 Operational ('000) Triple Play Customers 571.9 678.5 18.6% 571.9 678.5 18.6% Triple Play Penetration (%)
Highlights of 1Q11 Results 1Q10 1Q11 1Q11 / 1Q10
 1. 1Q11 HIGHLIGHTS Table 1. Highlights of 1Q11 Results 1Q10 1Q11 1Q11 / 1Q10 Operational ('000) Triple Play Customers 536.7 666.0 24.1% Triple Play Penetration (%) 45.6% 57.6% 12.0pp RGUs (1) 2,950.5 3,181.3
RGU growth in a mature market, accompanied by solid revenue and strong FCF performance.
 oper 1Q17 Highlights RGU growth in a mature market, accompanied by solid revenue and strong FCF performance. + 78.5 thousand RGU net adds: + 7.9 thousand pay TV; +13.3 thousand fixed voice; + 24.9 thousand
ZAP continues to see very strong growth with 2Q13 Revenues up by 51.6% yoy and EBITDA margin of 29.6%
 1 2Q13 HIGHLIGHTS Table 1. Highlights of 2Q13 Results 2Q12 2Q13 2Q13 / 2Q12 1H12 1H13 1H13 / 1H12 Operational ('000) RGUs (1) 3,414.1 3,478.5 1.9% 3,414.1 3,478.5 1.9% Basic Subscribers 1,586.3 1,543.3
2Q16 Highlights. Highlights 2Q16
 2Q16 Highlights Highlights 2Q16 Strong yoy growth in core telco operating revenues and EBITDA. Slowdown in yoy Cinema and Audiovisuals growth, as expected after extraordinarily high growth in 2015. Consolidated
Table % % Operational Highlights (EoP)
") 1 Table 1. 3Q17 Highlights 3Q16 3Q17 3Q17 / 3Q16 9M16 9M17 9M17 / 9M16 Financial Highlights Operating Revenues 381.0 393.1 3.2% 1,124.1 1,162.5 3.4% Telco Revenues 360.4 374.0 3.8% 1,070.9 1,105.8 3.3%
1 Table 1. 3Q17 Highlights 3Q16 3Q17 3Q17 / 3Q16 9M16 9M17 9M17 / 9M16 Financial Highlights Operating Revenues 381.0 393.1 3.2% 1,124.1 1,162.5 3.4% Telco Revenues 360.4 374.0 3.8% 1,070.9 1,105.8 3.3%
ZON Multimédia Serviços de Telecomunicações e Multimédia, SGPS, S.A. 1/22
 ZON Multimédia Serviços de Telecomunicações e Multimédia, SGPS, S.A. 1/22 Table of Contents 01. Foreword... 3 02. Why ZON?... 3 03. Strong Growth Momentum...4 04. CEO Statement... 6 05. Business Review...
Profitability growth driving operating FCF and supportive of shareholder returns.
 1 Lisbon, 8 November 2018 Profitability growth driving operating FCF and supportive of shareholder returns. Technological and operating transformation on track, laying the foundations for long term value
Completion of Merger on 27 August and election of new Management team on 1 October;
 1 Highlights Table 1. Highlights of 3Q13 Results 3Q12 3Q13 3Q13 / 3Q12 9M12 9M13 9M13 / 9M12 ZON OPTIMUS Combined Operating Highlights ('000) RGUs 7,349.6 7,266.3 (1.1%) 7,349.6 7,266.3 (1.1%) TV Accesses
Earnings Announcement
 Earnings Announcement INTENSE GROWTH DRIVING OPERATIONAL PERFORMANCE AND ACCELERATING FINANCIAL TURNAROUND, SUPPORTED BY STRONG INVESTMENT CONSOLIDATED RESULTS Acceleration in yoy financial trends led
Earnings Announcement
 Earnings Announcement 0 Strong KPI performance driving market share and a return to revenue growth; Convergent customers grew by an additional 72.2 thousand in 1Q15 to 456.8 thousand; 32.2% of fixed access
1.HIGHLIGHTS of 2Q10 FOCUS ON PROFITABLE GROWTH ALMOST 50% PENETRATION OF TRIPLE PLAY SERVICES, DRIVING STRONG ARPU
 1.HIGHLIGHTS of 2Q10 Table 1. Highlights of 2Q10 Results 2Q09 2Q10 2Q10 / 2Q09 Operational ('000) Triple Play Customers 391.0 571.9 46.3% Triple Play Penetration (%) 33.2% 49.0% 15.9pp RGUs (1) 3,250.8
Earnings Announcement
 Earnings Announcement Strong growth across all core telco services, acceleration in positive yoy financial trends Higher yoy (+1.9%) Pay TV customer base for the first time since 4Q12: positive trend in
New organizational structure in place since the end of the year and restructuring process initiated and well underway;
 FY13 Highlights Table 1. 2013 Highlights 2012 2013 2013 / 2012 Financial Highlights Operating Revenues 1,473.7 1,426.8 (3.2%) EBITDA 541.4 536.6 (0.9%) EBITDA Margin 36.7% 37.6% 0.9pp (Other Expenses)
Table of Contents. 1Q16 Highlights 4. Corporate. Management. Consolidated Financial. Bodies 5. Report 6. Statements 21
 1 2 Table of Contents 1Q16 Highlights 4 Corporate Bodies 5 Management Report 6 Consolidated Financial Statements 21 3 1Q16 Highlights Continued quarterly acceleration in yoy financial trends led by strong
RELEASE. PT Multimedia 2005 Full Year Audited Results
 RELEASE PT Multimedia 2005 Full Year Audited Results Lisbon, Portugal, 6 March 2006 PT Multimedia announced today its audited results for the year ended 31 December 2005. Operating revenues increased by
1Q14 Highlights. Decline in Net Financial Debt of 16 million euros to 923 million euros in 1Q14, bringing the ratio of Net Debt to EBITDA to 1.7x.
 1Q14 Highlights Table 1. 1Q14 Highlights 1Q13 4Q13 1Q14 1Q14 / 4Q13 1Q14 / 1Q13 Operational Highlights Total RGUs 7,295.4 7,213.0 7,215.2 0.0% (1.1%) Convergent RGUs 0.0 212.4 555.8 161.6% n.a. % 3P&4P
Ziggo N.V. Q Results. October 19, 2012
 Ziggo N.V. Q3 2012 Results October 19, 2012 Disclaimer This document does not constitute or form a part of any offer or solicitation to purchase or subscribe for securities in the United States or any
RESULTS 2Q16. Investor Relations Telefônica Brasil S.A. July, 2016
 RESULTS Investor Relations Telefônica Brasil S.A. July, 2016 DISCLAIMER This presentation may contain forward-looking statements concerning future prospects and objectives regarding growth of the subscriber
Ziggo Q Results. October 14, 2011
 Ziggo Q3 2011 Results October 14, 2011 Disclaimer Various statements contained in this document constitute forward-looking statements as that term is defined by U.S. federal securities laws. Words like
Investor Presentation November 2013
 Investor Presentation November 2013 Disclaimer This material contains forward-looking statements with respect to the financial condition, results of operations and business of SK Telecom and its subsidiaries
2015 Q4 and FY Results. Mauricio Ramos, CEO Tim Pennington, CFO 10 February 2016
 2015 Q4 and FY Results Mauricio Ramos, CEO Tim Pennington, CFO 10 February 2016 Disclaimer This presentation may contain certain forward-looking statements with respect to Millicom s expectations and plans,
2Q15 RESULTS RIO DE JANEIRO, 13 AUGUST 2015
 RESULTS RIO DE JANEIRO, 13 AUGUST 2015 IMPORTANT NOTICE This release contains forward-looking statements, according to the U.S. Private Securities Litigation Reform Act of 1995. Statements that are not
PORTUGAL. Merger brings cash flow boost, but competitive dynamics are tough COMPANY UPDATE
 Millennium investment banking TELECOM PORTUGAL Zon Optimus 21 Feb 2014 Zon Optimus Valuation update Merger brings cash flow boost, but competitive dynamics are tough COMPANY UPDATE Alexandra Delgado, CFA
TURKCELL GROUP. Q July 27, 2017
 TURKCELL GROUP Q2 2017 July 27, 2017 BUSINESS OVERVIEW Kaan Terzioğlu Turkcell CEO 3 TURKEY S DIGITAL OPERATOR INTERACT, READ, LISTEN, WATCH AND STORE INSTANT MESSAGING CALL MANAGEMENT (UPCALL) DIGITAL
Results presentation 1H July 2018
 Results presentation 1H18 27 July 2018 Disclaimer This presentation (the "Presentation") has been prepared and is issued by, and is the sole responsibility of Euskaltel, S.A. ("Euskaltel" or "the Company").
Fourth Quarter & Fiscal Year 2012 Earnings Results. Conference Call Presentation
 Fourth Quarter & Fiscal Year 2012 Earnings Results Conference Call Presentation Disclaimer This presentation is based on audited financial statements and may include statements that could constitute forward-looking
RESULTS 3Q17. Investor Relations Telefônica Brasil S.A. October, 2017
 RESULTS 3Q17 Investor Relations Telefônica Brasil S.A. October, 2017 DISCLAIMER This presentation may contain forward-looking statements concerning future prospects and objectives regarding growth of the
3Q15 RESULTS RIO DE JANEIRO, NOVEMBER 12, 2015
 RESULTS RIO DE JANEIRO, NOVEMBER 12, 2015 IMPORTANT NOTICE This release contains forward-looking statements, according to the U.S. Private Securities Litigation Reform Act of 1995. Statements that are
Disclaimer. Forward Looking Statements
 Q3 2016 Results PLAY Investor Presentation November 22, 2016 Disclaimer This presentation has been prepared by P4 Sp. z o.o. ( PLAY ). The information contained in this presentation is for information
TELECOM ITALIA GROUP dbaccess TMT Conference London, September 4th, Telecom Italia Group. Marco Patuano
 TELECOM ITALIA GROUP London, September 4th, 2015 Telecom Italia Group Safe Harbour This presentation contains statements that constitute forward looking statements within the meaning of the Private Securities
Financial data prepared under IFRS
 First Quarter of Fiscal Year 2012 Earnings Results Conference Call Presentation Financial data prepared under IFRS Disclaimer This presentation is based on audited financial statements and may include
Disclaimer. Forward Looking Statements
 Q4 and Full Year 2016 Results PLAY Investor Presentation February 28, 2017 Disclaimer This presentation has been prepared by P4 Sp. z o.o. ( PLAY ). The information contained in this presentation is for
Q Results Conference Call. August 3, 2017
 Q2 2017 Results Conference Call August 3, 2017 Safe harbour notice Certain statements made in this presentation are forward-looking statements. These statements include, without limitation, statements
Investor Presentation May 2015
 Top ranking in the Customer Satisfaction Index for 17 consecutive years Investor Presentation May 2015 Disclaimer This material contains forward-looking statements with respect to the financial condition,
Hellas Group 4th Quarter 2007 Results. February 19, 2008
 Hellas Group 4th Quarter 2007 Results February 19, 2008 Forward looking statement This presentation includes forward-looking statements. These forward-looking statements include all matters that are not
First quarter 2017 results
 [DRAFT 21-04-2017] First quarter 2017 results 28 April 2017 Key highlights 1 2 3 Market context Host migration for R cable customers finished with a successful outcome and certain one-off impact KPI performance
TURKCELL GROUP. Q April 26, 2017
 TURKCELL GROUP Q1 2017 April 26, 2017 1 BUSINESS OVERVIEW Kaan Terzioğlu Turkcell CEO 2 TURKCELL GROUP DELIVERING ON OUR STRATEGY GSM 3G Fiber 2G 4.5G DIGITAL SERVICES COMPANY 3 WITH GLOBAL BRANDS TURKCELL
Q Results Investor Presentation. PLAY Communications 12 November 2018
 Q3 2018 Results Investor Presentation PLAY Communications 12 November 2018 Disclaimer This presentation has been prepared by Play Communications S.A. s and its subsidiaries (together the PLAY Group ).
Investor. Presentation. May 2013
 Investor Presentation May 2013 0 Disclaimer This material contains forward-looking statements with respect to the financial condition, results of operations and business of SK Telecom and its subsidiaries
1H 2009 Results & Strategy Presentation. August 27th, 2009
 1H 2009 Results & Strategy Presentation August 27th, 2009 Disclaimer This document has been prepared by ILIAD S.A. (the «Company») and is being furnished to you personally solely for your information.
MANAGEMENT S DISCUSSION AND ANALYSIS OF FINANCIAL CONDITION AND RESULTS OF OPERATIONS
 MANAGEMENT S DISCUSSION AND ANALYSIS OF FINANCIAL CONDITION AND RESULTS OF OPERATIONS TELEFONICA CELULAR DEL PARAGUAY S.A. As at and for the year ended 31 December 2016 1. Overview We are a leading multinational
Results presentation 1Q18. 3 May 2018
 Results presentation 1Q18 3 May 2018 Disclaimer This presentation (the "Presentation") has been prepared and is issued by, and is the sole responsibility of Euskaltel, S.A. ("Euskaltel" or "the Company").
1 - ZON OPTIMUS in Numbers Highlights Governing Bodies Corporate Developments Subsequent Events 9
 Table of Contents 1 - ZON OPTIMUS in Numbers 2 2 - Highlights 5 3 - Governing Bodies 6 4 - Corporate Developments 8 5 - Subsequent Events 9 6 - Management Report 11 7 - Consolidated Financial Statements
Notice to the Market disclosed by Oi - 3Q17 Results
 Announcement Lisbon 14 November 2017 Notice to the Market disclosed by Oi - 3Q17 Results PHAROL, SGPS S.A. hereby informs on the 2017 second quarter results disclosed by Oi, S.A., as detailed in the company's
SONAECOM_RESULTS ANNOUNCEMENT RESULTS ANNOUNCEMENT 2013
 RESULTS ANNOUNCEMENT 2013 1 Introductory notes Until 26 August 2013, Optimus SGPS, S.A. was fully owned by Sonaecom, SGPS, S.A.. Following the completion of the merger between Optimus SGPS, S.A. and ZON
Q4FY17 Financial Results Presentation
 Q4FY17 Financial Results Presentation For the quarter ended 31 Mar 2017 Chua Sock Koong, Group CEO 18 May 2017 Forward looking statement Important note The following presentation contains forward looking
PT Indosat Tbk 9M 2010 Results. Indosat Presentation 9M 2010 page 1
 PT Indosat Tbk 9M 2010 Results Indosat Presentation 9M 2010 page 1 Disclaimer PT Indosat Tbk cautions investors that certain statements contained in this document state management's intentions, hopes,
Dialog Axiata PLC Sri Lanka's Premier Connectivity Provider
 Dialog Axiata PLC Sri Lanka's Premier Connectivity Provider Q4 2015 Results 17 th February 2016 an axiata company Dialog Group Performance Dialog Axiata Company Performance Subsidiary Performance 2 Dialog
RESULTS 1Q17. Investor Relations Telefônica Brasil S.A. May, 2017
 RESULTS Investor Relations Telefônica Brasil S.A. May, 2017 DISCLAIMER This presentation may contain forward-looking statements concerning future prospects and objectives regarding growth of the subscriber
TÜRK TELEKOM GROUP. Q2 Results
 Q2 Results 2015 Notice 02 The information contained herein has been prepared by Türk Telekom (the Company). The opinions presented herein are based on general information gathered at the time of writing
TÜRK TELEKOM GROUP. YE Results
 YE Results Notice 02 The information contained herein has been prepared by Türk Telekom (the Company). The opinions presented herein are based on general information gathered at the time of writing and
MAGYAR TELEKOM GROUP Q RESULTS PRESENTATION MAY 10, 2017
 MAGYAR TELEKOM GROUP Q1 217 RESULTS PRESENTATION MAY 1, 217 Q1 217 FINANCIAL RESULTS AND 217 TARGETS* REVENUE EBITDA CAPEX Q1 217 vs. Q1 216 HUF 14.5 bn (+1.6%) Revenue growth in mobile driven by mobile
Investor Presentation. February 2014
 Investor Presentation February 2014 Disclaimer This material contains forward-looking statements with respect to the financial condition, results of operations and business of SK Telecom and its subsidiaries
Oi discloses the 2014 fourth quarter results
 Announcement Lisbon 27 March 2014 Oi discloses the 2014 fourth quarter results PT SGPS, S.A. hereby informs on the material fact disclosed by Oi, S.A. on the 2014 fouth quarter results, as detailed in
4Q09 Results. Presentation. Rio de Janeiro, February 24 th TIM PARTICIPAÇÕES S.A. Investors Relations
 4Q09 Results Presentation Rio de Janeiro, February 24 th 200 Additional Disclaimer to the Presentation In the following slides we will present the financial statement analysis. For the sake of simplicity,
Hellas Group 3nd Quarter 2007 Results. November 15, 2007
 Hellas Group 3nd Quarter 2007 Results November 15, 2007 Forward looking statement This presentation includes forward-looking statements. These forward-looking statements include all matters that are not
Notice to the Market disclosed by Oi - 1Q17 Results
 Announcement Lisbon 11 May 2017 Notice to the Market disclosed by Oi - 1Q17 Results PHAROL, SGPS S.A. hereby informs on the 2017 fourth quarter results disclosed by Oi, S.A., as detailed in the company's
MD&A. Executive Summary. Operational Summary MANAGEMENT DISCUSSION AND ANALYSIS THIRD QUARTER 2017
 MD&A Executive Summary In Q317, we managed to maintain EBITDA margin at 41% level for second consecutive quarters, on the back of improvement in operational efficiency and lower subsidy level. We have
4Q17/2017 RESULTS. Rio de Janeiro, April 12, 2018
 / RESULTS Rio de Janeiro, April 12, 2018 IMPORTANT NOTICE This presentation contains forward-looking statements within the meaning of the U.S. Private Securities Litigation Reform Act of 1995 and the applicable
MD&A. Executive Summary. Operational Summary MANAGEMENT DISCUSSION AND ANALYSIS SECOND QUARTER 2017
 MD&A Executive Summary In Q217, dtac reported service revenue growth (excluding IC) of 2.3%YoY and 1.1%QoQ, and continued to build momentum on the successful network perception campaign, the Go No Limit
SEHK: Interim Results. 12 August 2009
 SEHK: 215 29 Interim Results 12 August 29 Disclaimer These materials have been prepared by Hutchison Telecommunications Hong Kong Holdings Limited (HTHKH) solely for use at this presentation and have not
BEZEQ (TASE: BEZQ) Investor Presentation Q Results
 Investor Presentation Q Results") BEZEQ (TASE: BEZQ) Investor Presentation Q1 2014 Results Forward-Looking Information and Statement This presentation contains general data and information as well as forward looking statements about Bezeq
BEZEQ (TASE: BEZQ) Investor Presentation Q1 2014 Results Forward-Looking Information and Statement This presentation contains general data and information as well as forward looking statements about Bezeq
TURKCELL GROUP. Q October 25, 2017
 TURKCELL GROUP Q3 2017 October 25, 2017 BUSINESS OVERVIEW Kaan Terzioğlu Turkcell CEO TURKCELL GROUP THIRD QUARTER HIGHLIGHTS FINANCIAL OPERATIONAL Record top-line at 4.6bn TL, up 26% yoy EBITDA margin
Grameenphone Ltd. Business highlights. Michael Patrick Foley, CEO
 Grameenphone Ltd. Business highlights Michael Patrick Foley, CEO Disclaimer The following presentation is being made only to, and is only directed at, persons to whom such presentation may lawfully be
First half Earnings Release. Portugal Telecom
 First half 2008 Earnings Release Portugal Telecom Earnings Release Lisbon, Portugal, 7 August 2008 Portugal Telecom announced today its results for the second quarter and first half, ended 30 June 2008.
MANAGEMENT S DISCUSSION AND ANALYSIS OF FINANCIAL CONDITION AND RESULTS OF OPERATIONS
 MANAGEMENT S DISCUSSION AND ANALYSIS OF FINANCIAL CONDITION AND RESULTS OF OPERATIONS TELEFONICA CELULAR DEL PARAGUAY S.A. As at and for the three month period ended 31 March 2017 1. Overview We are a
MD&A. Executive Summary. Operational Summary MANAGEMENT DISCUSSION AND ANALYSIS FIRST QUARTER 2018
 MD&A Executive Summary In Q118, dtac reported strong EBITDA growth of 21% YoY and EBITDA margin of 43.8%, mainly driven by lower handset subsidies and regulatory cost, despite 1.1%YoY decline in service
Results for the Year Ended December 31, 2017
 Results for the Year Ended December 31, 2017 K-IFRS, Non-audited February 5, 2018 Disclaimer This presentation contains forward-looking statements with respect to the financial condition, results of operations
2Q18 RESULTS. Rio de Janeiro, August 13, 2018
 RESULTS Rio de Janeiro, August 13, 2018 IMPORTANT NOTICE This presentation contains forward-looking statements within the meaning of the U.S. Private Securities Litigation Reform Act of 1995 and the applicable
Telecom Argentina S.A. announces consolidated nine month period ( 9M13 ) and third quarter ( 3Q13 ) results for fiscal year 2013*
 and third quarter ( 3Q13 ) results for fiscal year 2013*") FOR IMMEDIATE RELEASE Contacts: Pedro Insussarry Solange Barthe Dennin (54-11) 4968-3743/3752 Market Cap P$34.0 billion October 30 th, 2013 Telecom Argentina S.A. announces consolidated nine month period
FOR IMMEDIATE RELEASE Contacts: Pedro Insussarry Solange Barthe Dennin (54-11) 4968-3743/3752 Market Cap P$34.0 billion October 30 th, 2013 Telecom Argentina S.A. announces consolidated nine month period
Hutchison Telecommunications Hong Kong Holdings Limited (Stock Code: 215) 2014 Interim Results Presentation. 30 July 2014
 2014 Interim Results Presentation. 30 July 2014") Hutchison Telecommunications Hong Kong Holdings Limited (Stock Code: 215) 214 Interim Results Presentation 3 July 214 Disclaimer These materials have been prepared by Hutchison Telecommunications Hong
Hutchison Telecommunications Hong Kong Holdings Limited (Stock Code: 215) 214 Interim Results Presentation 3 July 214 Disclaimer These materials have been prepared by Hutchison Telecommunications Hong
Consolidated Financial. Statements First Quarter
 Consolidated Financial 09 Statements First Quarter ZON Multimédia Serviços de Telecomunicações e Multimédia, SGPS, S.A. Open company Registered office: Av. 5 de Outubro, n.º 208, Lisbon Share capital:
Results for the Year Ended December 31, 2016
 Results for the Year Ended December 31, 2016 K-IFRS, Non-audited February 3rd, 2017 0 Disclaimer This presentation contains forward-looking statements with respect to the financial condition, results of
Corporate Presentation. Investor Relations Telefônica Brasil S.A. March, 2017
 Corporate Presentation Investor Relations Telefônica Brasil S.A. March, 2017 DISCLAIMER This presentation may contain forward-looking statements concerning future prospects and objectives regarding growth
TIM Participações S.A. 9ª Conferência Anual Santander - Brasil Agosto/2008
 TIM Participações S.A. 9ª Conferência Anual Santander - Brasil Agosto/2008 Market overview Operation 2Q08 highlights 2H08 perspectives Financials 2 Telecom Industry Overview Mobile Fixed Broadband 56%
TURKCELL GROUP. Q4 & FY 2016 February 15, 2017
 TURKCELL GROUP Q4 & FY 2016 February 15, 2017 1 BUSINESS OVERVIEW Kaan Terzioğlu Turkcell CEO 2 TURKCELL GROUP FOURTH QUARTER HIGHLIGHTS 291K Highest mobile net add since 2013 1.0mn Fiber customers exceeded
Results 3Q18. Investor Relations Telefônica Brasil S.A. October, 2018
 Results Investor Relations Telefônica Brasil S.A. October, 2018 Disclaimer This presentation may contain forwardlooking statements concerning future prospects and objectives regarding growth of the subscriber
Interim Report as of December 31, NorCell Sweden Holding 2 AB (publ) Group
 Group") Interim Report as of December 31, 2012 NorCell Sweden Holding 2 AB (publ) Group FOR IMMEDIATE RELEASE Date: February 20, 2013 Time: 9:30 CET IMPORTANT INFORMATION For investors and prospective investors
Interim Report as of December 31, 2012 NorCell Sweden Holding 2 AB (publ) Group FOR IMMEDIATE RELEASE Date: February 20, 2013 Time: 9:30 CET IMPORTANT INFORMATION For investors and prospective investors
Swisscom results: And the winner is: Q November 2010
 Swisscom results: And the winner is: Q3 2010 9 November 2010 Agenda 2 1 And the winner is: Q3 2010 Carsten Schloter, CEO 2 Q3 highlights 3 Offer to Fastweb minority shareholders 4 Segmental results 9 months
Letter to the owners of PT Multimedia
 PT-Multimédia - Serviços de Telecomunicações e Multimédia, SGPS, SA Public Company Registered Office: Av. 5 de Outubro, no. 208, Lisbon Legal Entity: 504 453 513 Share Capital: 77,274,207 Euros Registered
Announcement of Audited Results for the Full Year ended 31 December 2012
 StarHub Ltd Reg. No.:199802208C 67 Ubi Avenue 1 #05-01 StarHub Green Singapore 408942 Tel (65) 6825 5000 Fax (65) 6721 5000 STARHUB LTD Announcement of Audited Results for the Full Year ended 31 December
Neither this presentation nor any of the information contained herein constitutes an offer of purchase, sale or exchange, nor a
 Disclaimer This document contains statements that constitute forward looking statements about Telefónica Group (going forward, the Company or Telefónica) including financial projections and estimates and
TURKCELL GROUP Q October 24, 2018
 TURKCELL GROUP Q3 2018 October 24, 2018 BUSINESS OVERVIEW Kaan Terzioğlu Turkcell CEO THIRD QUARTER HIGHLIGHTS FINANCIAL Record top line at 5.8 bn TL, up 26.1% yoy, 59% 2yr growth EBITDA Margin at 41.3%
China Telecom. JP Morgan China Conference Ms. Wu Andi. CFO of China Telecom 26 April 2006 Beijing
 China Telecom JP Morgan China Conference 2006 Ms. Wu Andi CFO of China Telecom 26 April 2006 Beijing Forward-Looking Statements Certain statements contained in this document may be viewed as forward-looking
4th Quarter Results for the period ending December 31, 2017
 4th Quarter Results for the period ending December 31, 2017 TWM Consolidated February 1, 2018 Topics in This Report Revenue Analysis EBITDA Analysis Income Statement Analysis Cash Flow Analysis Balance
Forward-looking Statements
 StarHub 4Q & FY2012 Results 7 February 2013 Forward-looking Statements The following presentation may contain forward-looking statements by StarHub Ltd ( StarHub ) relating to financial trends for future
Q Results PLAY Investor Presentation. PLAY, November 2017
 Q3 2017 Results PLAY Investor Presentation PLAY, November 2017 Disclaimer This presentation has been prepared by Communications S.A. s and its subsidiaries (together the PLAY Group ). The information contained
2nd Quarter Results for the period ended June 30, 2013
 2nd Quarter Results for the period ended June 30, 2013 TWM consolidated July 30, 2013 QoQ YoY Topics in This Report Revenue Analysis EBITDA Analysis Income Statement Analysis Cash Flow Analysis Balance
DEUTSCHE TELEKOM Q2/2018 RESULTS
 DEUTSCHE TELEKOM Q2/2018 RESULTS DISCLAIMER This presentation contains forward-looking statements that reflect the current views of Deutsche Telekom management with respect to future events. These forward-looking
Highlights on results
 Page 1 Highlights on results Excellent financial performance Fixed revenue decreased by 0.5% yoy, EBITDA margin increased to 31.6% Growth in internet, TV and ICT services more than compensates for declining
Earnings Release March 2018
 TELECOM ARGENTINA Earnings Release March 2018 FY2017 This presentation may include statements that could constitute forward-looking statements, including, but not limited to, the Company s and it s management
Q results and business update
 Q1 2018 results and business update Amsterdam 14 May 2018 Vincenzo Nesci Chief Executive Officer Gerbrand Nijman Chief Financial Officer 1 Disclaimer This presentation is for information purposes only
Telefónica Deutschland releases first quarter 2013 results
 3 rd May 2013 Telefónica Deutschland releases first quarter 2013 results MUNICH. Telefónica Deutschland continued delivering on its strategy in a more active and competitive environment focused on smartphones.
VODACOM GROUP (PROPRIETARY) LIMITED INTERIM RESULTS FOR THE SIX MONTHS ENDED SEPTEMBER 30, 2007
 LIMITED INTERIM RESULTS FOR THE SIX MONTHS ENDED SEPTEMBER 30, 2007") VODACOM GROUP (PROPRIETARY) LIMITED INTERIM RESULTS FOR THE SIX MONTHS ENDED SEPTEMBER 30, 2007 Operational highlights Alan Knott-Craig Chief Executive Officer Group highlights For the six months ended
VODACOM GROUP (PROPRIETARY) LIMITED INTERIM RESULTS FOR THE SIX MONTHS ENDED SEPTEMBER 30, 2007 Operational highlights Alan Knott-Craig Chief Executive Officer Group highlights For the six months ended
Preliminary Results January March 2014
 Preliminary Results January March 2014 Telefónica Deutschland Holding AG Disclaimer The financial information contained in this document (in general prepared under International Financial Reporting Standards
First Quarter 2011 Results. Emirates Integrated Telecommunications Company PJSC April 2011
 First Quarter 2011 Results Emirates Integrated Telecommunications Company PJSC April 2011 Disclaimer Emirates Integrated Telecommunications Company PJSC (hereafter du ) is a telecommunication services
Q Investor Call. August 2, 2013
 Q2 2013 Investor Call August 2, 2013 Safe Harbor Safe Harbor Statement Under the Private Securities Litigation Reform Act of 1995: This presentation contains forward-looking statements within the meaning