Sustainable profitable growth continues. CFO Seppo Parvi SVP, Investor Relations Ulla Paajanen-Sainio 8 August 2018
|
|
|
- Gervase Bruce
- 5 years ago
- Views:
Transcription
1 Sustainable profitable growth continues CFO Seppo Parvi SVP, Investor Relations Ulla Paajanen-Sainio
2 Disclaimer It should be noted that and its business are exposed to various risks and uncertainties and certain statements herein which are not historical facts, including, without limitation those regarding expectations for market growth and developments; expectations for growth and profitability; and statements preceded by believes, expects, anticipates, foresees, or similar expressions, are forward-looking statements. Since these statements are based on current plans, estimates and projections, they involve risks and uncertainties which may cause actual results to materially differ from those expressed in such forward-looking statements. Such factors include, but are not limited to: (1) operating factors such as continued success of manufacturing activities and the achievement of efficiencies therein, continued success of product development, acceptance of new products or services by the group s targeted customers, success of the existing and future collaboration arrangements, changes in business strategy or development plans or targets, changes in the degree of protection created by the group s patents and other intellectual property rights, the availability of capital on acceptable terms; (2) industry conditions, such as strength of product demand, intensity of competition, prevailing and future global market prices for the group s products and the pricing pressures thereto, price fluctuations in raw materials, financial condition of the customers and the competitors of the group, the potential introduction of competing products and technologies by competitors; and (3) general economic conditions, such as rates of economic growth in the group s principal geographic markets or fluctuations in exchange and interest rates. All statements are based on management s best assumptions and beliefs in light of the information currently available to it and assumes no obligation to publicly update or revise any forward-looking statement except to the extent legally required. 2


3 The renewable materials company Everything that s made with fossil-based materials today can be made from a tree tomorrow 3
4 at a glance Leading producer of board, pulp, wood products and paper We know the origin of all the wood we use. 100% comes from sustainable sources. 30 countries 10 BEUR sales % Operational ROCE excl. Beihai operations % EBIT margin Q2/ Net debt to operational EBITDA Q2/18 71% of sales from growth businesses in 2017 We employ people
5 We are well-positioned for profitable growth Consumer Board Packaging Solutions Biomaterials Wood Products Sales Sales 2017 EUR and % of group s sales 2.5 BEUR 1.3 BEUR 1.5 BEUR 1.7 BEUR Market growth for virgin board: Europe 1.8%, North America 1.2%, Latin America 3.3%, China 4.3%, Rest of Asia 3.4%, Africa 2.5% High quality SC fluting 1-3%; Kraftliner 2 3% excl. North Am; Testliner 3 4% Eastern Europe 1st Qtr 2nd Qtr Market pulp 2.5% or 1.7 Mt/year; Fastest growth 3rd Qtr in textiles (3%) and hygiene (3.6%) 4th Qtr Global sawn softwood 2 3%, European new construction 3.5% Paper 2.9 BEUR 29% Declining 3 5% annually 25% 12% 15% 17% 5
 Tornator, Finland 600 000 ha of land in Finland, 60 000 ha in Estonia, and 12 000 ha in Romania (ownership 41%) Guangxi,")
6 Forest assets Northern and Southern hemisphere Fair value of 3.3 BEUR forest areas as 1 May 2018 Bergvik Skog, Sweden 2.3 million ha of land in Sweden, ha in Latvia (ownership of 49%) Tornator, Finland ha of land in Finland, ha in Estonia, and ha in Romania (ownership 41%) Guangxi, Southern China (leased) ha of land of which ha planted Note: Fair value of Biological assets and Group s indirect share of forest assets is as of 31 Dec 2017, in total MEUR 6 Veracel plantations, Brazil ha of land of which ha eucalyptus plantations (ownership of 50%) Montes del Plata, Uruguay ha of land of which ha planted (ownership of 50%) In addition, leased plantations: - Laos: trial plantation, ha - Russia: ha
7 intends to acquire forest assets of Bergvik Skog To secure our competitive raw material supply in the long term would transform 49% ownership to approximately 70% of the value of the forest assets in Bergvik Väst Financial impacts estimate for Bergvik Väst consolidated as a subsidiary Cash out effect of MEUR Debt would increase by 800 MEUR Net debt to operational EBITDA ratio would increase by 0.6 Capital employed would increase by 1 BEUR resulting a decrease in ROCE of 1%-point 7
8 Profitable growth Improving sales and innovation Montes del Plata Mill investment Beihai Mill investment Varkaus Mill conversion Murów sawmill investment Varkaus LVL investment Imatra de-bottlenecking Sunila bio-refinery Innovation Centre Helsinki Innovation Centre Stockholm NXP JDA Launch of first MFC product Intelligent packaging Launches of: Performa Brilliance by CKB Nude by Natura Life by Fibre Cup Multicopy Zero by FlyoBrite by Bio-based lignin Lineo by Biocomposites - DuraSense by Product & Sales Management, S&OP, CRM Accelerator programme Asset transformation Innovation & customer focus 8


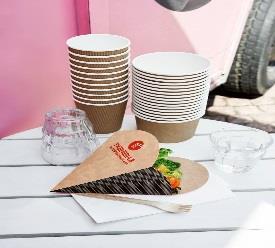
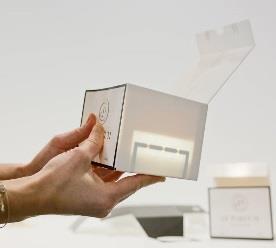

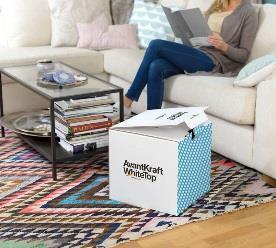

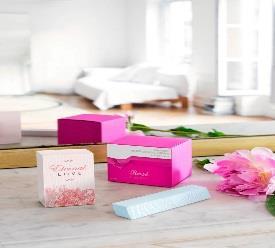
9 These are our drivers for accelerating renewable growth Biocomposites Intelligent packaging 7% of our sales came from NEW products and services In 2017 High-quality packaging solutions Bio barriers Building components and systems Future biochemicals Next generation liquid and food packaging 9


10 Renewable products to replace fossil-based materials Lineo TM by Wood-based lignin is a renewable, non-toxic, traceable material Today as a replacement for oil-based phenolic materials in glues for example in plywood and paper lamination DuraSense TM by for wood-based biocomposites Raw material for markets where plastics dominate Use in products, such as disposable cutlery, furniture, as well as storage and logistics goods signed a joint development agreement with the Finnish start-up Sulapac To license its materials and technology To begin the development of fully renewable caps and closures for liquid packages 10
11 Consumer Board s virgin fibre board grades 2.6% CAGR until % (5.3 mt) +1.2% (6.9 mt) +4.3% (7.3 mt) +3.3% (1.4 mt) +2.5% (0.2 mt) +3.4% (3.3 mt) Virgin fibre board grades: Coated Unbleached Kraft (CUK) Solid Bleached Sulphate (SBS) Liquid Packaging Board (LPB) Folding Box Board (FBB) Food Service Boards (FSB) Source: Pöyry 11


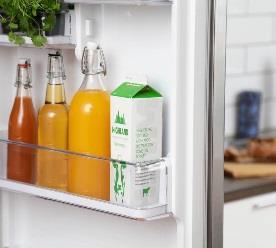
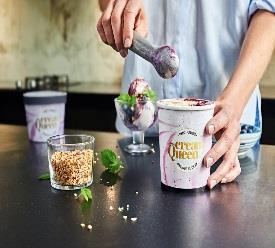
12 Fibre-based beverage carton has 45% lower CO 2 emissions than a PET plastic bottle The new board has 24% less negative influence on the climate compared to the old one Liquid packaging board market size ~5 Mt 12

 Bio-barriers based on")
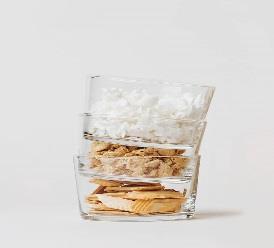
13 Future growth is coming from innovations in renewable materials in Consumer Board Micro-fibrillated cellulose (MFC) Bio-barriers based on MFC Biocomposites 13


14 We have strong market position and growth in our home packaging markets in Packaging Solutions Europe China Using virgin fibre boards from Beihai and Europe Nordics Nordics 0.7 BEUR 0 1% CAGR #1 107%* Source: analysis Note: CAGR * Relative market share, measured as a share of largest competitor 14 Poland & Baltics 1.5 BEUR 3 5% CAGR #2 85%* Corrugated packaging Russia Russia 1.7 BEUR 3% CAGR #4 62%* China Russia 1.8 BEUR 5 6% CAGR #5 ~20%* Corrugated & consumer packaging
 Kraftliner line (400 000 t/a) Integrated kraft pulp (500 000 t/a) Integrated new CTMP plant (350 000 t/a) Products CUK")
15 Conversion opportunity at Oulu Mill Potential reduction of paper capacity by 20% A feasibility study to convert to board grades expected to be concluded by the end of 2018-early 2019 The potential 700 MEUR investment would include Brown-based cartonboard line ( t/a) Kraftliner line ( t/a) Integrated kraft pulp ( t/a) Integrated new CTMP plant ( t/a) Products CUK Kraftliner Production of the potential new lines would start 2020 The other option is to continue the current fine paper production 15

 42% Softwood Hardwood")
16 Biomaterials is differentiating pulp mix - Skutskär fluff investment in Sweden completed Maximize value from eucalyptus pulp Today Target % 15% 37% 42% Improve competitiveness of our Nordic mills (Fluff and dissolving) 42% Softwood Hardwood Fluff/dissolving 43% 16
17 Balanced market expected in pulp Hardwood and softwood average capacity growth (Mt/year) Mt/y (90% ratios) Mt/y Announced capacity growth : 2.8 Mt (0.56 Mt/year) Cash cost CIF Europe (USD/tonne) Best in class Cash cost by country Solid Not sustainable Pulp (softwood and hardwood) delivered cost Cumulative capacity, thousand tonnes/y Softwood 0.8Mt Source: Hawkins Wright (April 2018) Hardwood 2.0Mt Pulp demand : Mt/year (2.5% CAGR) No new major projects announced 17


 Synthetics: 64.")
 Wood fibres: 6.5 Mt (+5.")
 - Tree to Textile -")

 Brand Owners Textile")
18 Developing new technologies for using wood fibre in textiles Regenerated cellulose Development of new technologies for using wood fibre in textile Growing interest from global brand owners increases demand for renewable fibres Leverage on existing assets Textile value chain Synthetic fibres (98.3 B USD market) 68.2% 25.0% Cotton (63.5 B USD market) Raw Material 2016 volume (CAGR 16-21) Synthetics: 64.8 Mt (+3.75%) Cotton: 22.8 Mt (-0.5%) Wood fibres: 6.5 Mt (+5.5%) Dissolving pulp (6.1 B USD market) - Tree to Textile - Spinnova - Ioncell-F - CCA Wood based fibre (15.8 B USD market) Yarn Fabric (439 B USD market) Brand Owners Textile industry 2016: 100 Mt 2022: 124 Mt Source: Hawkins & Wright, RISI, The Global Textile Material Markets April


19 Innovations taking wood to new heights in Wood Products Trafalgar Place, Elephant and Castle, London Ris de Orangis, Paris France International House, Barangaroo Sydney Peter-Rosegger Strasse, Graz, Austria Joensuu Tower, Joensuu, Finland Crome Court UK Geological Research Base Svalbard Wine Museum Bordeaux 19
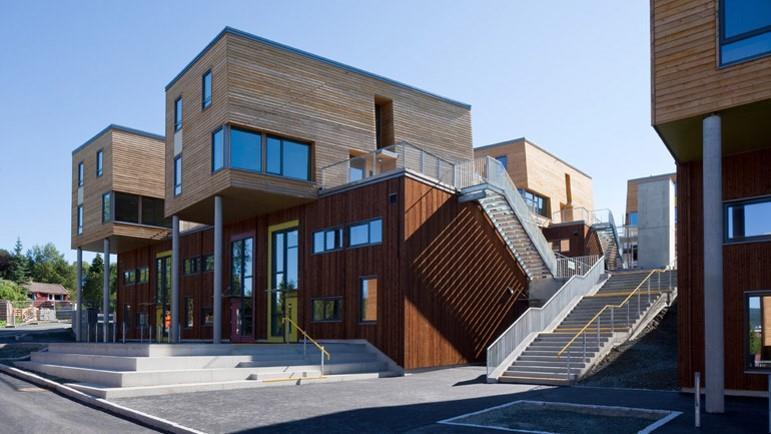
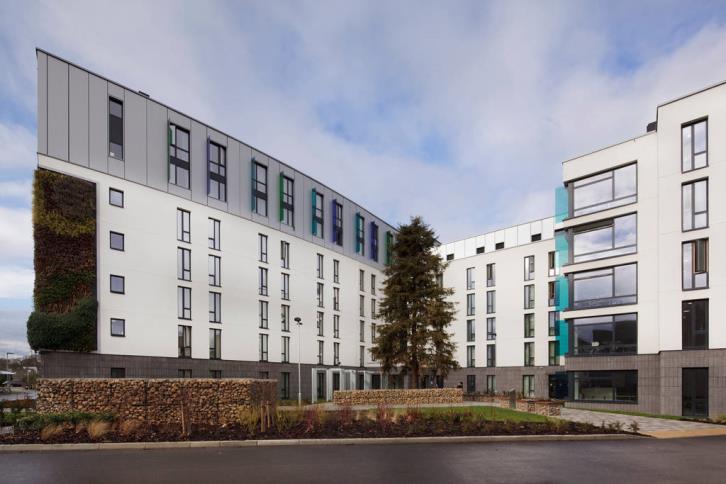
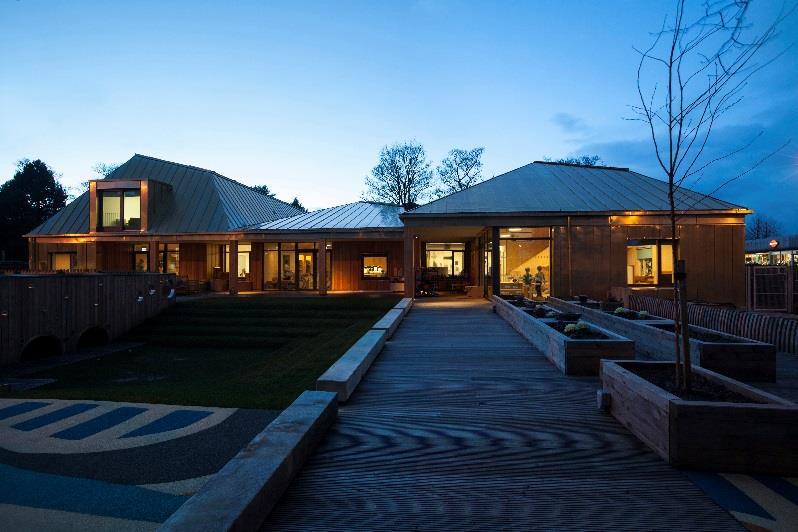
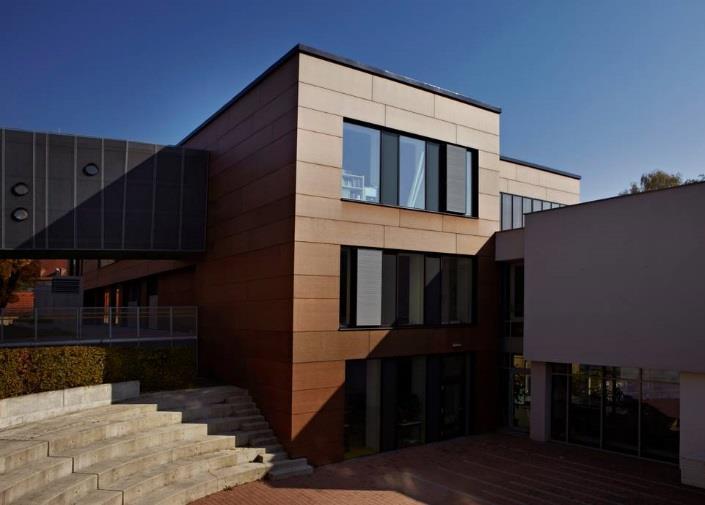
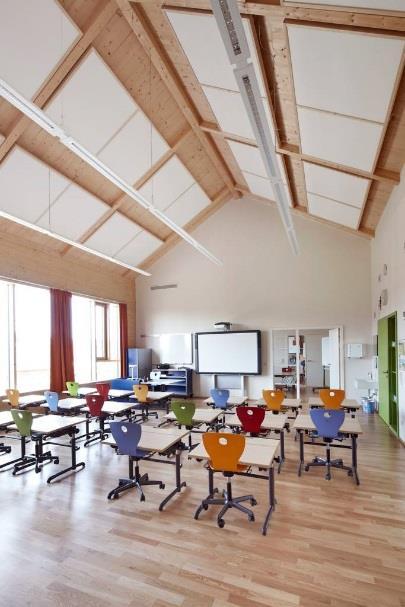
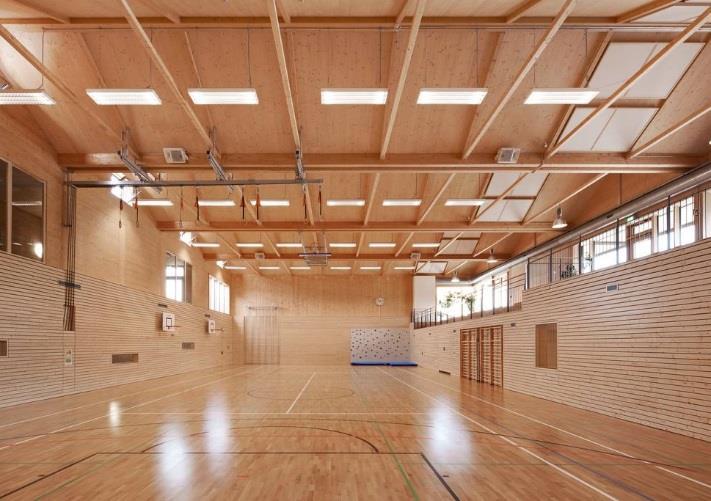
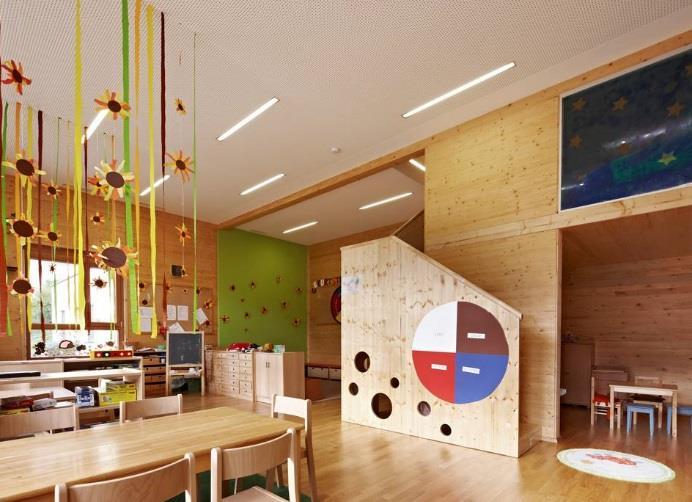
20 Short construction times, high functionality and increased well being perfect for schools 20
21 Clear improvement year-on-year Summary financials Q Change% Change% EUR million Q2/18 Q2/17 Q2/18- Q2/17 Q1/18 Q2/18- Q1/18 Sales % % Operational EBITDA % % Operational EBITDA margin 17.5% 14.2% 19.5% Operational EBIT % % Operational EBIT margin 12.3% 8.7% 14.3% Profit before tax excl. IAC % % EPS excl. IAC, EUR % % EPS (basic), EUR % % Operational ROCE 15.5% 10.3% 50.5% 17.7% -12.4% Cash Flow from Operations % % Net debt/last 12 months operational EBITDA
22 Fourth consecutive quarter above the strategic target of 13% Operational ROCE 22
23 Strategic targets in good progress still more potential Group strategic targets Q2 17 Q2 18 Dividend To distribute 50% of net income over the cycle Growth* To grow faster than the relevant market 7.1% (YoY) 5.4% (YoY) Net debt to operational EBITDA <2.0x new target Fixed costs to sales <20% 25.6% 23.5% Debt to equity <60% new target 49% 40% Operational ROCE >13% 10.3% 15.5% Divisional strategic targets Q2 17 Q2 18 Consumer Board Operational ROOC > 20% 13.9% 13.1% Packaging Solutions Operational ROOC > 20% 18.3% 25.6% Biomaterials Operational ROOC > 15% 9.8% 18.6% Wood Products Operational ROOC > 20% 25.5% 31.7% Paper Cash flow after investing activities to sales > 7% 10.6% 5.7% * Excluding Paper 23

24 Guidance for Q Compared to Q Sales are estimated to be similar to the amount of MEUR recorded in Q2/2018 Operational EBIT is expected to be in line with the 327 MEUR recorded in Q2/2018 The impact of annual maintenance shutdowns is expected to be approximately 5 MEUR lower than in Q2/2018. Second quarter maintenance impact was 15 MEUR higher than initially forecast. The Nordic wood supply situation is expected to continue tight due to the risk of forest fires affecting harvesting conditions. The wood supply impact is expected to be approximately 10 MEUR negative in the Q3/2018. These impacts are included in the above outlook Annual maintenance Q Q Consumer Board Imatra and Ingerois mills Beihai Mill Packaging Solutions Ostrołęka Mill Heinola and Varkaus mills Biomaterials Sunila Mill Enocell Mill Paper Veitsiluoto Mill Oulu Mill 24
 and Debt/equity Ratio (<0.")
25 Sustainable profitable growth continues Sixth consecutive quarter of sales growth Fourth consecutive quarter of double digit operational EBIT margin Operational ROCE above the strategic target of 13% for the fourth consecutive quarter sets new targets levels for Net Debt / Operational EBITDA (<2.0) and Debt/equity Ratio (<0.6) Wood sourcing still challenging Moving from asset transformation to innovation and sales transformation 25


26 Welcome to CMD on 7 November 2018 in Helsinki Followed by Packaging Solutions visit in Design Studio Lahti and SC fluting mill in Heinola on 8 November
27 Sponsored ADR Programme has established a sponsored Level I ADR programme in the US. The ADRs trade on the premier tier of Over-The-Counter ( OTC ) market in the US. Details are as follows: Ticker Symbol CUSIP Ratio ADR depositary SEOAY 86210M106 1 ADR : 1 Ordinary Shares Citibank Share price information or Please contact the Citibank s dedicated ADR broker desks: Scott Pollak (New York) Mike Woods (London) Tel: Tel: scott.h.pollak@citi.com michael.woods@citi.com 27


28
Accelerating our renewable future. CFO Seppo Parvi 29 November 2017
 Accelerating our renewable future CFO Seppo Parvi Disclaimer It should be noted that and its business are exposed to various risks and uncertainties and certain statements herein which are not historical
Transformation driving sales growth
 Transformation driving sales growth CEO Karl-Henrik Sundström Disclaimer It should be noted that and its business are exposed to various risks and uncertainties and certain statements herein which are
Stora Enso Profitable growth
 Stora Enso Profitable growth SVP, Investor Relations Ulla Paajanen-Sainio 9 March 2016 Disclaimer It should be noted that certain statements herein which are not historical facts, including, without limitation
Transformation driving sales growth
 Transformation driving sales growth Martin Ros SVP, Group Treasurer Disclaimer It should be noted that Stora Enso and its business are exposed to various risks and uncertainties and certain statements
CEO s report. Karl-Henrik Sundström
 CEO s report Karl-Henrik Sundström Congratulations Finland 100 years! 10 The renewable materials growth company Everything that s made with fossil-based materials today can be made from a tree tomorrow.
Creating value in the bioeconomy. CEO Karl-Henrik Sundström
 Creating value in the bioeconomy CEO Karl-Henrik Sundström We are perfectly positioned to benefit from the megatrends Global warming Growing middle class Eco awareness Changing lifestyles Increasing demand
Stora Enso s strategy and market environment. Nordea Forest Products & Paper Seminar, 28 May 2014 CFO Seppo Parvi Stora Enso
 s strategy and market environment Nordea Forest Products & Paper Seminar, 28 May 2014 CFO Seppo Parvi It should be noted that certain statements herein which are not historical facts, including, without
Stora Enso strategy and Q3 results. SVP, Head of Investor Relations, Ulla Paajanen-Sainio
 strategy and Q3 results SVP, Head of Investor Relations, Ulla Paajanen-Sainio It should be noted that certain statements herein which are not historical facts, including, without limitation those regarding
Sustainable profitable growth continues despite temporary headwinds Financial results for Q2 2018
 Sustainable profitable growth continues despite temporary headwinds Financial results for Q2 2018 CEO Karl-Henrik Sundström CFO Seppo Parvi Disclaimer It should be noted that Stora Enso and its business
Promising start of the year Financial results for Q CEO Karl-Henrik Sundström CFO Seppo Parvi. 27 April 2018
 Promising start of the year Financial results for Q1 2018 CEO Karl-Henrik Sundström CFO Seppo Parvi Disclaimer It should be noted that Stora Enso and its business are exposed to various risks and uncertainties
Karl-Henrik Sundström, CEO
 Karl-Henrik Sundström, CEO Have you ever thought about what a tree can do? STEFORSSLO Stora Enso celebrating 100 years on the Helsinki Stock Exchange Full year 2016 results EUR Million 2016 2015 Change
Stora Enso strategy and market environment. CEO Karl-Henrik Sundström
 strategy and market environment CEO Karl-Henrik Sundström Finnish Large Cap Summit 214 2 November 214 It should be noted that certain statements herein which are not historical facts, including, without
Financial results for Q3 2017
 Financial results for Q3 2017 CEO Karl-Henrik Sundström CFO Seppo Parvi Disclaimer It should be noted that Stora Enso and its business are exposed to various risks and uncertainties and certain statements
Financial results for Q1 2017
 Financial results for Q1 2017 CEO Karl-Henrik Sundström CFO Seppo Parvi Disclaimer It should be noted that Stora Enso and its business are exposed to various risks and uncertainties and certain statements
Financial results for Q4 and full year 2016
 Financial results for Q4 and full year 2016 CEO Karl-Henrik Sundström CFO Seppo Parvi Disclaimer It should be noted that Stora Enso and its business are exposed to various risks and uncertainties and certain
Financial results for Q4 and full year 2017
 Financial results for Q4 and full year 2017 CEO Karl-Henrik Sundström CFO Seppo Parvi Disclaimer It should be noted that Stora Enso and its business are exposed to various risks and uncertainties and certain
Financial results for Q3 2016
 Financial results for Q3 2016 CEO Karl-Henrik Sundström CFO Seppo Parvi Disclaimer It should be noted that Stora Enso and its business are exposed to various risks and uncertainties and certain statements
Welcome to the Annual General Meeting
 Welcome to the Annual General Meeting Headphones Kielikanavat Choose your language / Valitse kielikanava English Svenska Suomi No photography or video or audio recording Welcome! Jorma Eloranta, Chairman
Stora Enso Biomaterials growth based on customer focus and innovation
 Stora Enso Biomaterials growth based on customer focus and innovation Juan Bueno, EVP, Biomaterials 8 March 2012 It should be noted that certain statements herein which are not historical facts, including,
Financial Results Q CEO Karl-Henrik Sundström and CFO Seppo Parvi
 Financial Results Q3 2014 CEO Karl-Henrik Sundström and CFO Seppo Parvi 22 October 2014 It should be noted that certain statements herein which are not historical facts, including, without limitation those
Stora Enso s transformation to renewable materials company. Acting CFO Jyrki Tammivuori
 Stora Enso s transformation to renewable materials company Acting CFO Jyrki Tammivuori 09 September 2013 It should be noted that certain statements herein which are not historical facts, including, without
Financial Results for Q CEO Karl-Henrik Sundström and CFO Seppo Parvi
 Financial Results for Q1 2015 CEO Karl-Henrik Sundström and CFO Seppo Parvi 22 April 2015 It should be noted that certain statements herein which are not historical facts, including, without limitation
Stora Enso Half year financial report Q2. 1 January 30 June 2016
 Stora Enso Half year financial report Q2 1 January 30 June 2016 Results summary Accelerated transformation High activity during the quarter Q2/2016 (compared with Q2/2015) Sales EUR 2 526 (EUR 2 562) million
Stora Enso Interim Report Q3. 1 January 30 September 2016
 Stora Enso Interim Report Q3 1 January 30 September 2016 Results summary Another quarter of solid performance Q3/2016 (compared with Q3/2015) Sales EUR 2 393 (EUR 2 500) million decreased 4.3%. Sales excluding
Stora Enso transformation. CFO Karl-Henrik Sundström
 Stora Enso transformation CFO Karl-Henrik Sundström 7 May 2013 It should be noted that certain statements herein which are not historical facts, including, without limitation those regarding expectations
Navigating through the storm
 Navigating through the storm Markus Rauramo, CFO 4 June 2009 It should be noted that certain statements herein which are not historical facts, including, without limitation those regarding expectations
Stora Enso Q4 and full year results
 Stora Enso Q4 and full year results 1 January 31 December 2015 Solid performance continues; proposal to increase dividend to 0.33 euros per share Results summary Q4/2015 (compared with Q4/2014) Sales EUR
Stora Enso Interim Report. January March 2017
 Stora Enso Interim Report January March 207 Q Results summary Transformation driving sales growth Q/207 (compared with Q/206) Sales EUR 2 497 (EUR 2 445) million increased 2.%. Sales excluding the paper
Stora Enso Half year financial report. January June 2018 Q2
 Stora Enso Half year financial report January June 208 Q2 Results summary Sustainable profitable growth continues despite temporary headwinds Q2/208 (compared with Q2/207) Sales increased 5.4% to EUR 2
Cash and Growth Engines - transforming Stora Enso. CEO Jouko Karvinen
 Cash and Growth Engines - transforming Stora Enso CEO Jouko Karvinen 24 May 2012 It should be noted that certain statements herein which are not historical facts. including. without limitation those regarding
Financial Results for Q4 and Full Year CEO Karl-Henrik Sundström and CFO Seppo Parvi
 Financial Results for Q4 and Full Year 2014 CEO Karl-Henrik Sundström and CFO Seppo Parvi 4 February 2015 It should be noted that certain statements herein which are not historical facts, including, without
Growth Engine. Juan Bueno, EVP, Biomaterials
 Growth Engine Juan Bueno, EVP, Biomaterials Biomaterials 2 Why? 3 Population Growth Growing Environmental Pressures Doing more with less 4 Sustainability 5 Pulp market outlook 6 Global Market Pulp demand
Financial Results Q CEO Jouko Karvinen and EVP Karl-Henrik Sundström
 Financial Results Q2 2013 CEO Jouko Karvinen and EVP Karl-Henrik Sundström 19 July 2013 It should be noted that certain statements herein which are not historical facts, including, without limitation those
Driving performance in the bioeconomy. CFO Seppo Parvi
 Driving performance in the bioeconomy CFO Seppo Parvi Driving performance Digitalise and automate to drive efficiency and cost savings Make selective investments meeting strategic criteria Ensure sustainable,
Accelerating our renewable future. Stora Enso CMD London 2017
 Accelerating our renewable future Stora Enso CMD London 2017 Our road to success in the bioeconomy Introducing Addressing Delivering Generating xxxx xxxx new products xxxx superior xxxx and services ROCE
Financial results Q April 2011
 Financial results Q1 2011 20 April 2011 It should be noted that certain statements herein which are not historical facts, including, without limitation those regarding expectations for market growth and
Financial Results Q CEO Jouko Karvinen and CFO Markus Rauramo
 Financial Results Q1 2012 CEO Jouko Karvinen and CFO Markus Rauramo 24 April 2012 It should be noted that certain statements herein which are not historical facts. including. without limitation those regarding
Navigating through the storm
 Navigating through the storm Jouko Karvinen, CEO 27 May 2009 It should be noted that certain statements herein which are not historical facts, including, without limitation those regarding expectations
Stock Exchange Release
 Stock Exchange Release 22 October 2013 at 13.00 EET STORA ENSO OYJ INTERIM REVIEW 22 October 2013 at 13.00 EET Stora Enso Interim Review January September 2013 Firm operational EBIT, solid cash flow Q3/2013
Stora Enso Interim Review January March 2015 Solid quarter supported by foreign exchange tailwinds
 Stora Enso Interim Review January March 2015 Solid quarter supported by foreign exchange tailwinds Q1/2015 ( Q1/2014) Sales at EUR 2 491 (EUR 2 568) million declined by 3.0%; sales excluding the structurally
Stora Enso Interim Review January September 2015 Solid performance supported by currencies
 STORA ENSO OYJ INTERIM REVIEW 23 October 2015 at 13.00 EET Stora Enso Interim Review January September 2015 Solid performance supported by currencies Q3/2015 ( Q3/2014) Sales EUR 2 500 (EUR 2 514) million
Carnegie Pulp & Paper Seminar March 2016 Susanne Lithander, CFO
 WE PACKAGING FOR A Carnegie Pulp & Paper Seminar March 2016 Susanne Lithander, CFO PURE PLAY PACKAGING MATERIALS COMPANY High performance packaging materials Target customer segments requiring strong,
Financial Insights. Finnish and Swedish Forest Industry Q Tieto Forest Industry Consulting
 Financial Insights Finnish and Swedish Forest Industry Q3 Tieto Forest Industry Consulting www.tieto.com Executive summary In the manufacturing and forest sector, there is a strong digitalization trend
Nordea Forest Products & Paper Seminar 11 May 2016 Susanne Lithander, CFO
 WE PACKAGING FOR A Nordea Forest Products & Paper Seminar 11 May 2016 Susanne Lithander, CFO PURE PLAY PACKAGING MATERIALS COMPANY High performance packaging materials Target customer segments requiring
RISI International Containerboard Conference 2018
 RISI International Containerboard Conference 2018 The European Containerboard Market Florian Stockert November 2018 The image part with relationship ID rid10 was not found in the file. The image part with
Stora Enso Interim Review January June 2015 Transformation continues with strong cash flow, despite some operational challenges
 STORA ENSO OYJ INTERIM REVIEW 21 July 2015 at 13.00 EET Stora Enso Interim Review January June 2015 Transformation continues with strong cash flow, despite some operational challenges Q2/2015 ( Q2/2014)
Stock Exchange Release
 Stock Exchange Release 20 July 2012 at 13.00 EET STORA ENSO OYJ INTERIM REVIEW 20 July 2012 at 13.00 EET Stora Enso Interim Review January June 2012 Quarterly performance as anticipated, European paper
Nedbank Capital 2010 Investment Conference. 22 September 2010
 Nedbank Capital 2010 Investment Conference 22 September 2010 Agenda Mondi at a glance Group strategy Segment review Summary Presenter David Hathorn Chief Executive Officer Mondi Nedbank Capital 2010 Investment
3rd Quarter of October/08
 3rd Quarter of 2008 October/08 1 Forward Looking Statement The statements contained in this presentation related to the business outlook, operating and financial projections, and growth prospects of Klabin
Karl-Henrik Sundström, CEO
 Karl-Henrik Sundström, CEO Our progress Full year 2014 results EUR million FY 2014 FY 2013 Change Sales 10 213 10 563-3.3% Operational EBIT 810 578 40.1% Operational ROCE 9.5% 6.5% Cash flow from operations
Mondi Group Capital Markets Day October 2017
 Mondi Group Capital Markets Day October 2017 Agenda for the day 9:00-9:35 Welcome and Mondi Group overview 9:35-10:05 Packaging Paper 10:05-10:30 Fibre Packaging 10:30-10:55 Break 10:55-11:30 Consumer
Mondi Group Full year results for the year ended 31 December February 2015
 Mondi Group Full year results for the year ended 31 December 2014 24 February 2015 Agenda Highlights Financial overview Operational overview Delivering on our strategy Outlook Appendices 2 Highlights million
Metsä Board Presentation material Jussi Noponen, CFO Katri Sundström, Head of IR
 Metsä Board Presentation material Jussi Noponen, CFO Katri Sundström, Head of IR Jefferies Industrials Conference 2017 New York, US Contents Company highlights....... 3 Husum investment programme and update
UPM Q4 RESULTS Jussi Pesonen President and CEO 31 January 2013
 UPM Q4 RESULTS 212 Jussi Pesonen President and CEO 31 January 213 Q4 212 highlights Stable financial performance compared with Q3 212 and Q4 211 Operating cash flow continued strong at EUR 352m in Q4 212
ANNUAL GENERAL MEETING President and CEO Jussi Pesonen
 ANNUAL GENERAL MEETING 2014 President and CEO Jussi Pesonen Contents Year 2013 in transformation strategy Sustainable competitiveness Summary 2 3 YEAR 2013 Profitability over two economic slowdowns Europe
INTERIM REPORT 1 JANUARY 30 SEPTEMBER 2011
 INTERIM REPORT 1 JANUARY 30 SEPTEMBER 2011 1 2 3 4 UPM INTERIM REPORT 1 JANUARY 30 SEPTEMBER 2011 Q3/2011 Earnings per share excluding special items were EUR 0.19 (0.28), and reported EUR 0.21 (0.34) EBITDA
Metsä Board. Interim report 1 3/2017 Presentation material
 Metsä Board Interim report 1 3/217 Presentation material Q1 217 in summary Good demand for high-quality paperboards continued Stable or rising market price levels Metsä Board s paperboard and market pulp
Stora Enso expands business in Pakistan
 Stora Enso expands business in Pakistan Mats Nordlander, Executive Vice President Renewable Packaging September 18 2012 1 Stora Enso portfolio FY 2011 Group Sales, EUR 10 964.9 million Operational EBIT,
Institutional Presentation
 Institutional Presentation 3Q09 October, 2009 years old Shareholder Structure 09/30/2009 Family control + Professional management Monteiro Aranha ; 20% Brazilian Investors ; 21% Common Klabin Irmãos; 59%
Interim Review Q2. Stora Enso in brief
 SE-107 24 Stockholm, Sweden Stora Enso International Office FI-00101 Helsinki, Finland Visiting address: World Trade Center, 9 South Street Visiting address: Kanavaranta 1 Klarabergsviadukten 70 London
4 th Quarter 2014 Financial Results Celulosa Arauco y Constitución S.A.
 Conference Call Presentation 4 th Quarter 2014 Financial Results Celulosa Arauco y Constitución S.A. Gianfranco Truffello, C.F.O. Santiago, March 13 th, 2015 Disclaimer Forward-looking statements are based
Third Quarter 2018 Earnings Results
 Third Quarter 2018 Earnings Results Second Quarter 2018 Earnings Results Forward-Looking Statements This presentation may contain forward-looking statements that should be considered as good faith estimates.
UPM-Kymmene. Interim Review
 UPM-Kymmene Interim Review 1 6/2002 UPM-Kymmene Interim Review 1 January 30 June 2002 Second-quarter earnings per share, excluding capital gains/losses, were 0.49 (0.60 for the first quarter). Operating
UPM-KYMMENE INTERIM REVIEW 1 JANUARY 30 JUNE 2001
 UPM-KYMMENE INTERIM REVIEW 1 JANUARY 30 JUNE 2001 Earnings per share, excluding net capital gains, improved to EUR 1.91 (1 6/2000: 1.80). Profit before extraordinary items and net capital gains was EUR
Fourth Quarter 2017 Earnings Results
 Fourth Quarter 2017 Earnings Results Forward-Looking Statements This presentation may contain forward-looking statements, that should be considered as good faith estimates. Such statements are subject
Third Quarter 2017 Earnings Results
 Third Quarter 2017 Earnings Results Forward-looking Statements This presentation may contain forward-looking statements, that should be considered as good faith estimates. Such statements are subject to
Interim report presentation Q October 31, 2017
 Interim report presentation 2017 October 31, 2017 Ulf Larsson, CEO Summary 2017 Strong market with increasing prices Sales growth of 12% vs 2016 Volumes +11%, price/mix +3%, currency -2% EBITDA 1) up 25%
Metsä Group Interim Report Q3/2016
 Metsä Group Interim Report Q3/2016 Kari Jordan President and CEO Metsä Group Q3 Business developed as expected Sales EUR 3,483 million (1 9/2016: EUR 3,811 million) Comparable operating result EUR 332
Valmet unique offering with process technology, automation and services. SEB Nordic Seminar January 8, 2019
 Valmet unique offering with process technology, automation and services SEB Nordic Seminar January 8, 2019 Agenda Valmet roadshow presentation 1 Valmet in brief 2 Investment highlights 3 Financials 4 Conclusion
Corporate Presentation. June 2018
 Corporate Presentation June 2018 Forward-looking Statements This presentation may contain forward-looking statements, that should be considered as good faith estimates. Such statements are subject to risks
INSTITUTIONAL PRESENTATION 2Q15
 INSTITUTIONAL PRESENTATION 2Q15 AUGUST, 2015 KLBN11 KLBN11 / KLBAY DISCLAIMER The statements contained in this presentation related to the business outlook, operating and financial projections, and growth
Metsä Board. Investor presentation January December 2018
 Metsä Board January December 2018 Contents Metsä Board in brief 3 Operating environment and demand drivers 15 Main contributors in Metsä Board s profitability 23 Results: January September 2018 29 Balance
Metsä Board. Interim Report 1 9/2017 Presentation material
 Metsä Board Interim Report 1 9/217 Presentation material January September 217: Increasing sales and improved operating result EUR million Sales EUR million 5 4 3 2 1 436 423 44 422 445 474 479 Q1 16 Q2
INTERIM REPORT 1 JANUARY 30 JUNE 2009
 1 2 3 4 INTERIM REPORT 1 JANUARY 30 JUNE 2009 UPM Interim Report 1 January 30 June 2009 Earnings per share for the second quarter were 0.02 (0.18), and excluding special items 0.03 (0.17) Operating profit
MONDI GROUP Deutsche Bank 9 th European Paper Seminar. 8 November 2011 London
 MONDI GROUP Deutsche Bank 9 th European Paper Seminar 8 November 2011 London Mondi s strategic positioning Current trading update Medium term sector fundamentals Cash flow prioritisation Appendices Mondi
Technology solutions for veneer, plywood and LVL industries globally
 Technology solutions for veneer, plywood and LVL industries globally May 18, 2016 Tapani Kiiski, President and CEO Raute s business today Wood products industry Raute s customers Plywood consumption 2014
Carnegie Small & Mid Cap Seminar September Per Lindberg, CEO and President, and Susanne Lithander, CFO
 Carnegie Small & Mid Cap Seminar September 2014 Per Lindberg, CEO and President, and Susanne Lithander, CFO 1 WE PACKAGING FOR A 2 BILLERUDKORSNÄS IN FACTS & FIGURES NET SALES (2013) 20 Billion SEK OPERATING
Institutional Presentation. May 2012
 Institutional Presentation May 2012 1 Forward looking statement The statements contained in this presentation related to the business outlook, operating and financial projections, and growth prospects
UBS European Conference
 UBS European Conference Mondi Group Andrew King 14 November 2017 Group overview Highlights from H1 2017 Q3 trading update and Business Unit reviews 2 Mondi at a glance Packaging Paper 1 Fibre Packaging
Corporate Presentation. November 2018
 Corporate Presentation November 2018 Forward-Looking Statements This presentation may contain forward-looking statements that should be considered as good faith estimates. Such statements are subject to
Corporate Presentation. April 2017
 Corporate Presentation April 2017 Forward-looking Statements This presentation may contain forward-looking statements, that should be considered as good faith estimates. Such statements are subject to
Metsäliitto Group s operating profit excluding non-recurring items EUR 178 million in the first half of the year
 1/16 Metsäliitto Group Interim Report January June Metsäliitto Group s operating profit excluding non-recurring items EUR 178 million in the first half of the year Result for the first six months of Sales
Corporate Presentation. March 2018
 Corporate Presentation March 2018 Forward-looking Statements This presentation may contain forward-looking statements, that should be considered as good faith estimates. Such statements are subject to
Metsä Group s operating result excluding non-recurring items in January September was EUR 256 million
 Metsä Group Interim Report 1 January 30 September Stock Exchange Release 1 (28) Metsä Group s operating result excluding non-recurring items in January September was EUR 256 million Result for January
MONDI GROUP RESULTS FOR THE YEAR ENDED 31 DECEMBER February 2011
 MONDI GROUP RESULTS FOR THE YEAR ENDED 31 DECEMBER 21 February 2011 Agenda Highlights Financial overview Operational review Summary Appendices Page 2 Key financial highlights Earnings significantly up
First Quarter 2018 Earnings Results
 First Quarter 2018 Earnings Results Forward-Looking Statements This presentation may contain forward-looking statements that should be considered as good faith estimates. Such statements are subject to
Marianne M. Parrs Executive VP. Goldman Sachs Basic Materials Conference May 16, 2005
 Marianne M. Parrs Executive VP Goldman Sachs Basic Materials Conference May 16, 2005 Forward Looking Statements Statements on these slides or in this presentation that are not historical are forward-looking.
WITH BIOFORE HALF YEAR FINANCIAL REPORT 2017
 WITH BIOFORE HALF YEAR FINANCIAL REPORT 2 UPM Half Year Financial Report 2: UPM s good performance and favourable market demand continued 2 highlights Comparable EBIT increased by 2% to EUR 27 million
UBS European Conference
 UBS European Conference Mondi Group Andrew King 16 November 2016 Group overview Highlights from H1 2016 Q3 trading update and Business Unit reviews 2 Mondi at a glance 2015 Revenue 1 & ROCE Packaging Paper
INVESTOR PRESENTATION Q Lennart Eberleh
 INVESTOR PRESENTATION Q4 2017 Lennart Eberleh 1 CONTENTS Rottneros in brief: Sustainable growth in selected niches The market Q4 and full year 2017 The way forward 2 SUSTAINABLE GROWTH IN SELECTED NICHES
Metsä Board Interim report Q3/2015
 Metsä Board Interim report Solid performance in Profitability improved from the previous quarter Paperboard delivery volumes grew and price levels remained stable Production of coated paper ended at Husum
Corporate Presentation. September 2018
 Corporate Presentation September 2018 Forward-Looking Statements This presentation may contain forward-looking statements, that should be considered as good faith estimates. Such statements are subject
Corporate Presentation. October 2018
 Corporate Presentation October 2018 Forward-Looking Statements This presentation may contain forward-looking statements that should be considered as good faith estimates. Such statements are subject to
WITH BIOFORE INTERIM REPORT 1 JANUARY 30 JUNE
 WITH BIOFORE INTERIM REPORT 1 JANUARY 3 JUNE 216 Interim report Q2/216: UPM s comparable EBIT increased by 21%, cash flow reaching new highs Q2 216 highlights Comparable EBIT increased by 21% to EUR 264
Metsä Board. Q4 and FY 2016 Results
 Metsä Board Q4 and FY 216 Results Q4 216 in summary Sales declined moderately, and comparable EBIT remained roughly at the same level as in Q3 216 Delivery volumes in paperboard and market pulp declined
INTERIM REPORT 1 JANUARY 31 MARCH 2005
 1 UPM First-quarter earnings per share were 0.39 (0.09 for the first quarter of 2004), excluding non-recurring items 0.20 (0.09). First-quarter operating profit was 173 million (99 million). Profit before
Facts & Figures. Stora Enso 2012
 Facts & Figures Stora Enso 2012 2 Key figures 3 Stora Enso in brief 4 Business Areas 6 Map 8 Board of Directors and Group Executive Team 10 Extract of the Consolidated Financial Statements 14 Auditor s
UPM Financial Review Jussi Pesonen President and CEO 2 February 2011
 UPM Financial Review 2 Jussi Pesonen President and CEO 2 February 211 2 in brief Solid top-line recovery in all businesses 2 UPM - 2 sales grew by 16%, driven by volumes - sales grew by 12%, driven by
Metsä Board Investor presentation January-September 2016
 Metsä Board Investor presentation January-September 2016 Contents Investment highlights 3 Strategic cornerstones and financial targets 12 Operating environment and market position 22 Q3/2016 results and
Metsä Board Investor presentation 1 6/ August 2018
 Metsä Board 2 August 2018 Contents This is Metsä Board 3 Strategy and financial targets 14 Operating environment and market position 21 Growth in the paperboard business 32 2018 Half-Year Financial Report