UNITED STATES SECURITIES AND EXCHANGE COMMISSION. Washington, D.C FORM 8-K CURRENT REPORT
|
|
|
- Steven Miles
- 5 years ago
- Views:
Transcription
1 UNITED STATES SECURITIES AND EXCHANGE COMMISSION Washington, D.C FORM 8-K CURRENT REPORT Pursuant to Section 13 or 15(d) of the Securities Exchange Act of 1934 Date of Report (Date of earliest event reported): November 2, 2017 DIVERSIFIED RESTAURANT HOLDINGS, INC. (Name of registrant in its charter) Nevada (State or other jurisdiction of incorporation) (Commission File Number) Franklin Road Southfield, MI (Address of principal executive offices) Registrant's telephone number: (248) (IRS Employer Identification No.) Check the appropriate box below if the Form 8-K is intended to simultaneously satisfy the filing obligation of the registrant under any of the following provisions: [ ] Written communications pursuant to Rule 425 under the Securities Act [ ] Soliciting material pursuant to Rule 14a-12 under the Exchange Act [ ] Pre-commencement communications pursuant to Rule 14d-2(b) under the Exchange Act [ ] Pre-commencement communications pursuant to Rule 13e-4(c) under the Exchange Act Indicate by check mark whether the registrant is an emerging growth company as defined in Rule 405 of the Securities Act of 1933 (17 CFR ) or Rule 12b-2 of the Securities Exchange Act of 1934 (17 CFR b-2). Emerging growth company If an emerging growth company, indicate by check mark if the registrant has elected not to use the extended transition period for complying with any new or revised financial accounting standards provided pursuant to Section 13(a) of the Exchange Act.
2 Item 2.02 Results of Operations and Financial Condition EarningsRelease On November 2, 2017, Diversified Restaurant Holdings, Inc. (NASDAQ: SAUC) (the "Company") issued a press release announcing earnings and other financial results for the quarter ended September 24, A copy of the press release is furnished as Exhibit 99.1 to this report and incorporated here by reference. Item Regulation FD Disclosure The Company has prepared presentation materials (the Investor Presentation ) that management intends to use during its previously announced Third Quarter 2017 Conference call on Friday, November 3, 2017 at 10:00 am Eastern Time, and from time to time thereafter in presentations about the Company s operations and performance. The Company may use the Investor Presentation, possibly with modifications, in presentations to current and potential investors, analysts, lenders, business partners, acquisition candidates, customers, employees and others with an interest in the Company and its business. A copy of the Investor Presentation is furnished as Exhibit 99.2 to this Current Report on Form 8-K and is available on the Company's website at Materials on the Company's website are not part of or incorporated by reference into this Form 8-K. In accordance with General Instruction B.2 of Form 8-K, the information in this Current Report on Form 8-K, including Exhibits 99.1 and 99.2, shall not be deemed to be filed for purposes of Section 18 of the Securities Exchange Act of 1934, as amended (the Exchange Act ), or otherwise subject to the liability of that section, and shall not be incorporated by reference into any registration statement or other document filed under the Securities Act of 1933, as amended, or the Exchange Act, except as shall be expressly set forth by specific reference in such filing. Item 9.01 Financial Statement and Exhibits (d) Exhibits Exhibit No. Description 99.1 Press Release of Diversified Restaurant Holdings, Inc. reporting financial results and earnings for the quarter ended September 24, Diversified Restaurant Holdings, Inc. Investor Presentation dated November 2, 2017 SIGNATURES In accordance with Section 13 or 15(d) of the Securities Exchange Act of 1934, the registrant has duly caused this report to be signed on its behalf by the undersigned, thereunto duly authorized.
3 DIVERSIFIED RESTAURANT HOLDINGS, INC. Dated: November 2, 2017 By: /s/ Phyllis A. Knight Name: Phyllis A. Knight Title: Chief Financial Officer (Principal Financial and Accounting Officer)
4 EXHIBIT INDEX Exhibit No. Description 99.1 Press Release of Diversified Restaurant Holdings, Inc. reporting financial results and earnings for the quarter ended September 24, Diversified Restaurant Holdings, Inc. Investor Presentation dated November 2, 2017
5 FOR IMMEDIATE RELEASE Diversified Restaurant Holdings Reports Third Quarter 2017 Results SOUTHFIELD, MI, November 2, Diversified Restaurant Holdings, Inc. (NASDAQ: SAUC) ("DRH" or the "Company"), the largest franchisee for Buffalo Wild Wings ("BWW") with 65 stores across five states, today announced results for its third quarter ended September 24, Third Quarter and Year-to-date Key Information (from continuing operations) Revenue for the quarter totaled $39.3 million, down 5.7% Same-store sales declined 4.4% and are down 2.7% for the year Net loss was $0.5 million in the quarter; near breakeven for the year-to-date period Restaurant-level EBITDA (1) was $6.2 million, or 15.9% of sales, and stands at $21.1 million for the year, or 17.1% of sales Adjusted EBITDA (1) was $4.3 million for the quarter and $14.9 million for the year Cash generated from operations totaled $3.3 million for the quarter and $9.8 million for the year (1) See attached table for a reconciliation of GAAP net loss to Restaurant-level EBITDA and Adjusted EBITDA Total sales during the quarter were reduced by approximately $0.6 million related to Hurricane Irma, and an additional $0.3 million as a result of deferrals recorded related to the Blazin Rewards loyalty program. While facing multiple headwinds during the quarter, we focused our efforts on operational excellence to increase efficiency and run a leaner organization, commented David G. Burke, President and CEO. While cost of sales increased over 200 basis points as a direct result of record high chicken wing prices, we controlled our labor and other operating expenses despite lower sales. Mr. Burke added, We also had some solid wins in the quarter and are making great progress with our productivity initiatives. We continued our BOGO traditional wing promotional test in our captive markets, which replaced the half-off promotion with a buy one, get one offer limited to smaller order sizes. The test continues to demonstrate improved sales and average check with lower wing costs as a percent of sales. We intend to invest more in revenue-driving initiatives in the fourth quarter in addition to our delivery and loyalty programs. We also expect to benefit from a new corporate promotional campaign that is slated to kick off in the second half of the fourth quarter. 1
6 Third Quarter Results (from continuing operations) (Unaudited, $ in thousands) Q Q Change % Change Revenue $ 39,262.9 $ 41,625.3 $ (2,362.4) (5.7)% Operating income $ $ 1,946.6 $ (1,626.1) (83.4)% Operating margin 0.8 % 4.7 % Net income (loss) $ (543.2) $ $ (1,139.9) (191.0)% Diluted net income (loss) per share $ (0.02) $ 0.02 $ (0.04) (200.0)% Same-store sales (1) (4.4)% (1.8)% Restaurant-level EBITDA (2) $ 6,246.5 $ 8,112.4 $ (1,865.9) (23.0)% Restaurant-level EBITDA margin 15.9 % 19.5 % Adjusted EBITDA (2) $ 4,322.0 $ 5,746.0 $ (1,424.0) (24.8)% Adjusted EBITDA margin 11.0 % 13.8 % Year-to-date Results (from continuing operations) (Unaudited, $ in thousands) YTD 2017 YTD 2016 Change % Change Revenue $ 123,535.5 $ 125,719.7 $ (2,184.2) (1.7)% Operating income $ 3,408.4 $ 6,449.7 $ (3,041.3) (47.1)% Operating margin 2.8 % 5.1 % Net income (loss) $ (39.0) $ 2,123.5 $ (2,162.5) (101.8)% Diluted net income (loss) per share $ $ 0.08 $ (0.08) (100.0)% Same-store sales (1) (2.7)% (2.6)% Restaurant-level EBITDA (2) $ 21,121.0 $ 25,547.7 $ (4,426.7) (17.3)% Restaurant-level EBITDA margin 17.1 % 20.3 % Adjusted EBITDA (2) $ 14,934.6 $ 18,885.3 $ (3,950.7) (20.9)% Adjusted EBITDA margin 12.1 % 15.0 % (1) Same store sales calculations exclude related closures in September from Hurricane Irma (2) Please see attached table for a reconciliation of GAAP net loss to Restaurant-level EBITDA and Adjusted EBITDA 2
7 Balance Sheet Highlights - Continuing Operations Cash and cash equivalents were $4.7 million at September 24, 2017, compared with $4.0 million at 2016 year-end. Capital expenditures were $4.5 million during the first nine months of 2017 and were primarily for one new restaurant, restaurant refreshes and remodels. Capital expenditures were $12.2 million in the first nine months of Total debt was $116.8 million at the end of the quarter, down $4.4 million for the year. Updated Fiscal 2017 Guidance Reducing revenue guidance to $166 million to $168 million Targeting restaurant-level EBITDA of $28 million to $29 million Expect adjusted EBITDA of approximately $20 million Planned capital expenditures of approximately $5 million Board of Directors Exploring Strategic Alternatives DRH also announced that its Board of Directors, working together with management, is exploring strategic alternatives to enhance shareholder value. These alternatives could include, among other things, financial restructuring or a possible sale, merger or other strategic transaction. The Company is working with Duff & Phelps Securities, LLC as financial advisor to assist in this evaluation. The Company stated that no decision has been made with regard to any alternatives and that there can be no assurance that the Board s exploration of strategic alternatives will result in any transaction being entered into or consummated. DRH does not intend to discuss or disclose developments with respect to this process until the Board has approved a definitive course of action or otherwise concludes the review. Webcast, Conference Call and Presentation DRH will host a conference call and live webcast on Friday, November 3, 2017 at 10:00 A.M. Eastern Time, during which management will review the financial and operating results for the third quarter, and discuss its corporate strategies and outlook. A question-and-answer session will follow. The teleconference can be accessed by calling (201) The webcast can be monitored at A presentation that will be referenced during the conference call is also available on the website. A telephonic replay will be available from 1:00 P.M. ET on the day of the call through Friday, November 10, To listen to the archived call, dial (412) and enter replay pin number , or access the webcast replay at where a transcript will also be posted once available. About Diversified Restaurant Holdings, Inc. Diversified Restaurant Holdings, Inc. is the largest franchisee for Buffalo Wild Wings with 65 franchised restaurants in key markets in Florida, Illinois, Indiana, Michigan and Missouri. DRH s strategy is to generate cash, reduce debt and leverage its strong franchise operating capabilities for future growth. The Company routinely posts news and other important information on its website at 3
8 Safe Harbor Statement The information made available in this news release and the Company s November 3, 2017 earnings conference call contain forward-looking statements which reflect DRH's current view of future events, results of operations, cash flows, performance, business prospects and opportunities. Wherever used, the words "anticipate," "believe," "expect," "intend," "plan," "project," "will continue," "will likely result," "may," and similar expressions identify forward-looking statements as such term is defined in the Securities Exchange Act of Any such forward-looking statements are subject to risks and uncertainties, actual growth, results of operations, financial condition, cash flows, performance, business prospects and opportunities could differ materially from historical results or current expectations. Some of these risks include, without limitation, the impact of economic and industry conditions, competition, food safety issues, store expansion and remodeling, labor relations issues, costs of providing employee benefits, regulatory matters, legal and administrative proceedings, information technology, security, severe weather, natural disasters, accounting matters, other risk factors relating to business or industry and other risks detailed from time to time in the Securities and Exchange Commission filings of DRH. Forward-looking statements contained herein speak only as of the date made and, thus, DRH undertakes no obligation to update or publicly announce the revision of any of the forward-looking statements contained herein to reflect new information, future events, developments or changed circumstances or for any other reason. Investor and Media Contact: Deborah K. Pawlowski Kei Advisors LLC dpawlowski@keiadvisors.com FINANCIAL TABLES FOLLOW 4
9 DIVERSIFIED RESTAURANT HOLDINGS, INC. AND SUBSIDIARIES CONSOLIDATED STATEMENTS OF OPERATIONS (Unaudited) September 24, 2017 Three Months Ended Nine Months Ended September 25, 2016 September 24, 2017 September 25, 2016 Revenue $ 39,262,940 $ 41,625,312 $ 123,535,506 $ 125,719,745 Operating expenses Restaurant operating costs (exclusive of depreciation and amortization shown separately below): Food, beverage, and packaging costs 11,569,925 11,402,389 36,529,901 34,881,667 Compensation costs 9,991,381 10,288,623 31,125,287 31,112,586 Occupancy costs 2,969,250 2,899,508 8,701,927 8,440,075 Other operating costs 8,770,406 8,922,440 26,188,432 25,808,943 General and administrative expenses 2,301,061 2,375,476 6,724,436 6,896,819 Pre-opening costs 79,605 84, , ,034 Depreciation and amortization 3,244,255 3,626,377 10,149,050 11,212,555 Loss on asset disposal 16,578 79, , ,371 Total operating expenses 38,942,461 39,678, ,127, ,270,050 Operating profit 320,479 1,946,629 3,408,373 6,449,695 Interest expense (1,822,876) (1,439,273) (5,041,136) (4,324,765) Other income, net 26,000 11,849 78,307 87,856 Income (loss) from continuing operations before income taxes (1,476,397) 519,205 (1,554,456) 2,212,786 Income tax benefit (expense) of continuing operations 933,157 77,504 1,515,453 (89,304) Income (loss) from continuing operations (543,240) 596,709 $ (39,003) $ 2,123,482 Discontinued operations Loss from discontinued operations before income taxes (22,960) (2,748,012) $ (155,552) $ (4,593,907) Income tax benefit of discontinued operations 7, ,178 58,191 1,329,278 Loss from discontinued operations (15,154) (1,985,834) (97,361) (3,264,629) Net Loss $ (558,394) $ (1,389,125) $ (136,364) $ (1,141,147) Basic earnings (loss) per share from: Continuing operations $ (0.02) $ 0.02 $ $ 0.08 Discontinued operations $ $ (0.07) $ $ (0.12) Basic net earnings (loss) per share $ (0.02) $ (0.05) $ $ (0.04) Diluted earnings (loss) per share from: Continuing operations $ (0.02) $ 0.02 $ $ 0.08 Discontinued operations $ $ (0.07) $ $ (0.12) Diluted net earnings (loss) per share $ (0.02) $ (0.05) $ $ (0.04) Weighted average number of common shares outstanding Basic 26,764,776 26,625,615 26,672,057 26,434,238 Diluted 26,764,776 26,625,615 26,672,057 26,434,238 5
10 DIVERSIFIED RESTAURANT HOLDINGS, INC. AND SUBSIDIARIES ASSETS Current assets CONSOLIDATED BALANCE SHEETS (Unaudited) September 24, 2017 (UNAUDITED) December 25, 2016 Cash and cash equivalents $ 4,665,491 $ 4,021,126 Accounts receivable 103, ,238 Inventory 1,503,617 1,700,604 Prepaid and other assets 1,171,343 1,305,936 Total current assets 7,444,294 7,303,904 Deferred income taxes 18,020,997 16,250,928 Property and equipment, net 50,684,927 56,630,031 Intangible assets, net 2,493,602 2,666,364 Goodwill 50,097,081 50,097,081 Other long-term assets 187, ,539 Total assets $ 128,927,985 $ 133,181,847 LIABILITIES AND STOCKHOLDERS' DEFICIT Current liabilities Accounts payable $ 5,135,349 $ 3,995,846 Accrued compensation 1,640,664 2,803,549 Other accrued liabilities 2,544,416 2,642,269 Current portion of long-term debt 11,375,468 11,307,819 Current portion of deferred rent 471, ,206 Total current liabilities 21,167,262 20,943,689 Deferred rent, less current portion 2,103,398 2,020,199 Unfavorable operating leases 531, ,247 Other long-term liabilities 3,316,271 3,859,231 Long-term debt, less current portion 105,381, ,878,201 Total liabilities 132,498, ,292,567 Commitments and contingencies (Notes 3, 10 and 11) Stockholders' deficit Common stock - $ par value; 100,000,000 shares authorized; 26,848,507 and 26,632,222, respectively, issued and outstanding 2,623 2,610 Additional paid-in capital 21,624,434 21,355,270 Accumulated other comprehensive loss (795,281) (934,222) Accumulated deficit (24,402,742) (24,534,378) Total stockholders' deficit (3,570,966) (4,110,720) Total liabilities and stockholders' deficit $ 128,927,985 $ 133,181,847 6
11 DIVERSIFIED RESTAURANT HOLDINGS, INC. AND SUBSIDIARIES CONSOLIDATED STATEMENTS OF CASH FLOWS (Unaudited) Nine Months Ended September 24, 2017 September 25, 2016 Cash flows from operating activities Net loss $ (136,364) $ (1,141,147) Net loss from discontinued operations (97,361) (3,264,629) Net income (loss) from continuing operations (39,003) 2,123,482 Adjustments to reconcile net income (loss) to net cash provided by operating activities Depreciation and amortization 10,149,050 11,212,555 Amortization of debt discount and loan fees 156, ,287 Amortization of gain on sale-leaseback (99,657) (95,878) Loss on asset disposals 302, ,371 Share-based compensation 284, ,377 Deferred income taxes (1,573,644) (100,119) Changes in operating assets and liabilities that provided (used) cash Accounts receivable 172,395 (56,139) Inventory 196, ,837 Prepaid and other assets 134,593 (704,206) Intangible assets (28,729) 31,763 Other long-term assets 46, ,772 Accounts payable 1,228,025 (1,049,207) Accrued liabilities (1,270,506) (1,049,327) Deferred rent 137,342 81,177 Net cash provided by operating activities of continuing operations 9,797,011 12,069,745 Net cash used in operating activities of discontinued operations (97,361) (3,859,500) Net cash provided by operating activities 9,699,650 8,210,245 Cash flows from investing activities Purchases of property and equipment (4,453,861) (12,161,596) Net cash used in investing activities of continuing operations (4,453,861) (12,161,596) Net cash used in investing activities of discontinued operations (640,655) Net cash used in investing activities (4,453,861) (12,802,251) Cash flows from financing activities Proceeds from issuance of long-term debt 4,650,965 8,609,154 Repayments of long-term debt (9,237,466) (13,634,717) Proceeds from employee stock purchase plan 45,005 31,223 Tax withholdings for restricted stock units (59,928) (9,326) Net cash used in financing activities (4,601,424) (5,003,666) Net increase (decrease) in cash and cash equivalents 644,365 (9,595,672) Cash and cash equivalents, beginning of period 4,021,126 13,499,890 Cash and cash equivalents, end of period $ 4,665,491 $ 3,904,218 7
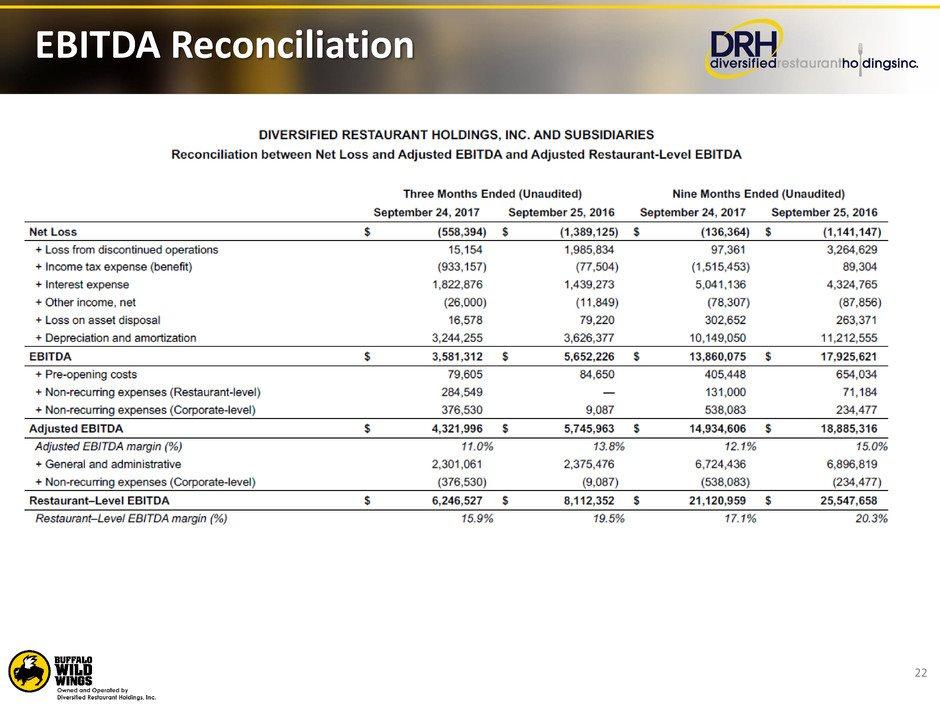
12 DIVERSIFIED RESTAURANT HOLDINGS, INC. AND SUBSIDIARIES Reconciliation between Net Loss and Adjusted EBITDA and Adjusted Restaurant-Level EBITDA Three Months Ended (Unaudited) Nine Months Ended (Unaudited) September 24, 2017 September 25, 2016 September 24, 2017 September 25, 2016 Net Loss $ (558,394) $ (1,389,125) $ (136,364) $ (1,141,147) + Loss from discontinued operations 15,154 1,985,834 97,361 3,264,629 + Income tax expense (benefit) (933,157) (77,504) (1,515,453) 89,304 + Interest expense 1,822,876 1,439,273 5,041,136 4,324,765 + Other income, net (26,000) (11,849) (78,307) (87,856) + Loss on asset disposal 16,578 79, , ,371 + Depreciation and amortization 3,244,255 3,626,377 10,149,050 11,212,555 EBITDA $ 3,581,312 $ 5,652,226 $ 13,860,075 $ 17,925,621 + Pre-opening costs 79,605 84, , ,034 + Non-recurring expenses (Restaurant-level) 284, ,000 71,184 + Non-recurring expenses (Corporate-level) 376,530 9, , ,477 Adjusted EBITDA $ 4,321,996 $ 5,745,963 $ 14,934,606 $ 18,885,316 Adjusted EBITDA margin (%) 11.0% 13.8% 12.1% 15.0% + General and administrative 2,301,061 2,375,476 6,724,436 6,896,819 + Non-recurring expenses (Corporate-level) (376,530) (9,087) (538,083) (234,477) Restaurant Level EBITDA $ 6,246,527 $ 8,112,352 $ 21,120,959 $ 25,547,658 Restaurant Level EBITDA margin (%) 15.9% 19.5% 17.1% 20.3% Restaurant-Level EBITDA represents net income (loss) plus the sum of non-restaurant specific general and administrative expenses, restaurant pre-opening costs, loss on property and equipment disposals, depreciation and amortization, other income and expenses, interest, taxes, and non-recurring expenses. Adjusted EBITDA represents net income (loss) plus the sum of restaurant pre-opening costs, loss on property and equipment disposals, depreciation and amortization, other income and expenses, interest, taxes, and non-recurring expenses. We are presenting Restaurant-Level EBITDA and Adjusted EBITDA, which are not presented in accordance with GAAP, because we believe they provide additional metrics by which to evaluate our operations. When considered together with our GAAP results and the reconciliation to our net income, we believe they provide a more complete understanding of our business than could be obtained absent this disclosure. We use Restaurant-Level EBITDA and Adjusted EBITDA together with financial measures prepared in accordance with GAAP, such as revenue, income from operations, net income, and cash flows from operations, to assess our historical and prospective operating performance and to enhance the understanding of our core operating performance. Restaurant-Level EBITDA and Adjusted EBITDA are presented because: (i) we believe they are useful measures for investors to assess the operating performance of our business without the effect of non-cash depreciation and amortization expenses; (ii) we believe investors will find these measures useful in assessing our ability to service or incur indebtedness; and (iii) they are used internally as benchmarks to evaluate our operating performance or compare our performance to that of our competitors. 8
13 Additionally, we present Restaurant-Level EBITDA because it excludes the impact of general and administrative expenses and restaurant pre-opening costs, which is non-recurring. The use of Restaurant-Level EBITDA thereby enables us and our investors to compare our operating performance between periods and to compare our operating performance to the performance of our competitors. The measure is also widely used within the restaurant industry to evaluate restaurant level productivity, efficiency, and performance. The use of Restaurant-Level EBITDA and Adjusted EBITDA as performance measures permits a comparative assessment of our operating performance relative to our performance based on GAAP results, while isolating the effects of some items that vary from period to period without any correlation to core operating performance or that vary widely among similar companies. Companies within our industry exhibit significant variations with respect to capital structure and cost of capital (which affect interest expense and tax rates) and differences in book depreciation of property and equipment (which affect relative depreciation expense), including significant differences in the depreciable lives of similar assets among various companies. Our management team believes that Restaurant-Level EBITDA and Adjusted EBITDA facilitate company-to-company comparisons within our industry by eliminating some of the foregoing variations. Restaurant-Level EBITDA and Adjusted EBITDA are not determined in accordance with GAAP and should not be considered in isolation or as an alternative to net income, income from operations, net cash provided by operating, investing, or financing activities, or other financial statement data presented as indicators of financial performance or liquidity, each as presented in accordance with GAAP. Neither Restaurant-Level EBITDA nor Adjusted EBITDA should be considered as a measure of discretionary cash available to us to invest in the growth of our business. Restaurant-Level EBITDA and Adjusted EBITDA as presented may not be comparable to other similarly titled measures of other companies and our presentation of Restaurant-Level EBITDA and Adjusted EBITDA should not be construed as an inference that our future results will be unaffected by unusual items. Our management recognizes that Restaurant-Level EBITDA and Adjusted EBITDA have limitations as analytical financial measures. ### 9

14 Q Financial Results November 3, 2017

15 Safe Harbor 2 The information made available in this presentation contains forward-looking statements which reflect the Company s current view of future events, results of operations, cash flows, performance, business prospects and opportunities. Wherever used, the words "anticipate," "believe," "expect," "intend," "plan," "project," "will continue," "will likely result," "may," and similar expressions identify forward-looking statements as such term is defined in the Securities Exchange Act of Any such forward-looking statements are subject to risks and uncertainties and the Company's actual growth, results of operations, financial condition, cash flows, performance, business prospects and opportunities could differ materially from historical results or current expectations. Some of these risks include, without limitation, the impact of economic and industry conditions, competition, food and drug safety issues, store expansion and remodeling, labor relations issues, costs of providing employee benefits, regulatory matters, legal and administrative proceedings, information technology, security, severe weather, natural disasters, accounting matters, other risk factors relating to our business or industry and other risks detailed from time to time in the Securities and Exchange Commission filings of DRH. Forward-looking statements contained herein speak only as of the date made and, thus, DRH undertakes no obligation to update or publicly announce the revision of any of the forward- looking statements contained herein to reflect new information, future events, developments or changed circumstances or for any other reason.

16 Who We Are NASDAQ: SAUC IPO: 2008 Market capitalization $43M Largest Buffalo Wild Wings Franchisee Leading operator Strong cash generator 65 BWW locations Recent share price $ week range $ $4.12 Insider ownership 50% Institutional ownership 17% Shares outstanding 26.7M 3 Pure play franchisee with scale and track record of accretive acquisitions Market data as of November 1, 2017 (Source: S&P Capital IQ); Ownership as of most recent filing
 Adjusted EBITDA of $4.3M, 11.0% of sales Restaurant-level EBITDA of $6.2M, 15.9% of sales Strong cash from operations and FCF Net cash from operations of $3.3M, up from $2.")
17 Third Quarter Key Information Sales of $39.3M, down $2.4M vs. last year Negative impact from Hurricane Irma and revenue deferral related to new loyalty program Same Store Sales off 4.35% (-2.73% YTD) Adjusted EBITDA of $4.3M, 11.0% of sales Restaurant-level EBITDA of $6.2M, 15.9% of sales Strong cash from operations and FCF Net cash from operations of $3.3M, up from $2.1M last quarter; LTM free cash flow of $8.3M Cost of sales up 180 basis points vs. Q as wing prices were high throughout the quarter Lower margin on higher restaurant-level costs, particularly cost of sales Difficult comps due to 2016 Summer Olympics; overall slower traffic environment, particularly in July and August 4 Sales S-S-S EBITDA Margins Cashflow
18 Sales and Traffic 5

19 Average Check and Traffic Trends 6 NOTE: Average check is predominantly driven by price but is also influenced by product mix and, to a lesser extent, average guests per check. 2.6% 2.9% 5.5% 5.9% 7.7% 4.1% 1.3% 0.8% -2.2% -2.7% -1.8% -5.4% -0.3% -3.7% -4.4% -4.3% -7.9% -1.6% 4.3% 3.0% -3.1% -2.7% 0.9% 1.1% 2.2% 0.2% 0.6% -2.5% -1.8% -2.0% -2.0% -3.0% -3.3% -4.3% 2.0% -1.9% -6.3% -5.0% -10.0% -4.1% 1.1% -3.0% -3.2% -2.0% 1.7% 1.7% 3.3% 5.7% 7.1% 6.6% 3.1% 2.8% -0.2% 0.2% 1.4% -1.1% -2.3% -1.8% 1.9% 0.7% 2.1% 2.6% 3.2% 6.1% 0.1% -0.7% Q Q Q Q Q Q Q Q Q Q Q Q Q Q Q Jul 2017 Aug 2017 Sep 2017 FY 2014 FY 2015 FY 2016 YTD 2017 SSS% Traffic % Avg Check % Higher check averages during the quarter helped to partially offset slower summer traffic, particularly in July and August

20 Same-Store-Sales Performance 7 Our Q SSS % underperformed relative to BWLD and other BWLD franchisees as a result of our regional mix Casual dining same store sales were negative across all regions of the United States in Q Over half of DRH restaurants are located in the weakest regions of the Plains states and Florida - Over half of BWLD locations are located in the strongest regions of the United States - Over half of BWLD franchisee locations are located in moderate performance regions Distribution of Locations and Casual Dining Relative SSS Performance by Region Heat Map of Casual Dining Regional Relative SSS Performance Sources: BWLD K, DRH data Note: Distribution data based on 2016 YE portfolios for BWLD and BWLD Franchisees, for illustrative purposes. Excludes international. West/Southwest Plains Midwest Southeast Better Worse CDR Relative Region Performance BWLD BWLD-FR DRH West/SW 37% 19% 0% Southeast 14% 11% 0% NE/Mid-Atlantic 14% 20% 0% Midwest 19% 38% 49% Florida 5% 4% 28% Plains 12% 8% 23% Weak SSS % 51% 30% 0% Weaker SSS% 32% 58% 49% Weakest SSS% 16% 12% 51% Q3 SSS % -2.3% -3.2% -4.4% Distribution of Locations by Region

21 Q3 Sales Bridge ($M) 8 Sales declines were driven by Hurricane Irma, the impact of changes in promotional activity, the Blazin Rewards loyalty initial deferral and a decline in traffic; offset by a new restaurant opening and higher average ticket *Promotional activity includes successful T Mobile promotion in 2016, change to less favorable promotion for National Wing Day in 2017, anniversary of ½ price wing Tuesday offset by Blitz offerings in 2017 **Clinton Township, MI significantly impacted by a major sinkhole that, since 12/27/16, has been blocking access to the restaurant ( Fraser Sinkhole ); University Park, FL access blocked for much of FY 2017 by new diamond interchange construction (I-75 & University Parkway) $42.1 $41.9 $41.6 $41.2 $39.3 $0.3 $0.6 $0.2 $0.3 $0.1 $0.3 $1.9 $41.6 $0.8 $0.6 $0.1 Q Revenue NRO Avg Ticket Mc Gregor vs. Mayweather/ 2016 UFC *Promotional Activity IRMA **Construction Cape Coral Honeymoon College Football Schedule Loyalty Program Deferred Rev Traffic/Other Q Revenue
 2017 delivery sales are expected to reach $1.")
22 Sales Driving Initiatives: Delivery 9 Delivery and Carry-Out Sales as % of Total The delivery channel continues to show strong growth and to date we see no evidence that delivery sales cannibalize higher margin carry-out business Delivery Drives Incremental Sales 38 locations now offer delivery service through third parties (up from 26 last year) 2017 delivery sales are expected to reach $1.5-$2M Average delivery check is 13% higher than dine-in and 17% higher than carry-out 20.6% 19.3% 19.5% 20.4% 21.9% 21.4% 20.3% 1.9% 2.7% 2.8% 3.1% 2.7% Q Q Q Q Q Q Q % of Carry-Out Sales % of Delivery Sales

23 Sales Driving Initiatives: Blazin Rewards Loyalty 10 Blazin Rewards Members Roll-out began in St. Louis market in mid-2016 and ramped up with remaining locations in Q1 2017, with the average loyalty check currently 17% higher than non-loyalty targeting 20% attachment by the end of 2017 *Loyalty Attachment Rates * Loyalty attachment rate = loyalty checks as a percentage of total checks 0.0% 2.0% 4.0% 6.0% 8.0% 10.0% 12.0% 14.0% Jul Aug Sep Oct Nov Dec Jan Feb Mar Apr May Jun Jul Aug Sep ,000 40,000 60,000 80, , , ,000 Jul Aug Sep Oct Nov Dec Jan Feb Mar Apr May Jun Jul Aug Sep

24 Sales Driving Initiatives: Promotions 11 Testing New Promotions Half-Price Wing Tuesday vs. BOGO The Tuesday wing promotion has proven to drive significant traffic throughout all dayparts on an otherwise low volume day; we re testing a BOGO offer in captive markets with promising early results * Excludes July 4th holiday ** Check Count may not be a good proxy for traffic given the nature of the BOGO promotion *** COS % excludes waste and cost that is not attached to a menu item (i.e. fryer oil) Offering BOGO Traditional on Tuesdays in select markets: Throughout Michigan (just rolling out SE-MI) Most of Florida Planning to offer BOGO boneless in Chicago and northern Michigan markets Testing new promotion in one of the Florida markets in November: The original price per piece Tuesday promotion

25 Margins and EBITDA 12

26 Quarterly Restaurant EBITDA Trends 13 1 On June 29, 2015, we acquired 18 locations in the St. Louis market to add to our existing 44 units, which had a dilutive AUV of $2.3 million 2 FF = Franchise-related fees which includes 5.0% royalty and % NAF (national advertising fund) Record high chicken wing prices coupled with sales deleveraging placed added pressure on recent margins AUV ($M) $3.1 $2.8 $2.7 $2.7 $2.7 $2.6 $2.6 $2.6 $2.8 $2.5 $2.4 $2.8 $2.8 $2.6 $ % 20.6% 19.4% 20.3% 21.5% 20.0% 19.6% 16.5% 19.0% 16.6% 15.9% 21.2% 20.4% 19.4% 17.1% 5.5% 5.9% 6.4% 6.6% 6.5% 6.8% 7.0% 7.2% 6.5% 7.1% 7.6% 5.2% 6.2% 6.8% 7.0% 8.0% 8.0% 8.0% 8.0% 8.2% 8.1% 8.1% 8.1% 8.0% 8.1% 8.2% 8.0% 8.0% 8.1% 8.1% 12.6% 13.4% 13.0% 12.7% 11.5% 12.1% 13.3% 14.0% 12.3% 12.9% 13.8% 13.2% 12.9% 12.7% 12.9% 23.3% 23.9% 25.1% 24.8% 24.4% 25.2% 24.7% 25.0% 24.7% 25.5% 25.4% 23.8% 24.4% 24.8% 25.2% 28.8% 28.1% 28.1% 27.6% 28.0% 27.9% 27.4% 29.2% 29.4% 29.9% 29.2% 28.5% 28.1% 28.1% 29.5% KEY Q Q Q Q Q Q Q Q Q Q Q FY2014 FY 2015 FY 2016 YTD 2017 C O S LA B O R O PE X FF2 OCC R ES T. EB IT D A 1 1

27 EBITDA Impacts 14 $6.1 $6.2 $0.7 $0.8 $0.3 $0.1 $0.1 $8.1 $0.1 Q Restaurant-Level EBITDA Sales Impact COS Irma Impact Labor Occupancy Opex Q Restaurant-Level EBITDA Cost of sales, driven by record high chicken wing prices, accounted for over 40% of the year-over- year decline, followed closely by the impact of slower traffic and Hurricane Irma related closures; operating expenses were held in check despite the sales headwinds

28 Cost of Sales Impacts 15 Historically high traditional chicken wing costs and lower wing yields, coupled with the Tuesday wing promotions, were responsible for a 209 bp increase in cost of sales in Q vs. Q % 0.30% 27.4% 2.09% Q COS % Traditional Wings Food/Beverage/Other Q COS %

29 28.8% 28.1% 28.1% 27.6% 28.0% 27.9% 27.4% 29.2% 29.4% 29.9% 29.2% 28.5% 28.1% 28.1% 29.5% 21.7% 20.1% 20.4% 19.5% 20.3% 20.9% 19.5% 23.5% 24.0% 24.9% 25.3% 18.4% 20.4% 21.1% 24.7% $1.89 $1.77 $1.80 $1.79 $1.92 $1.92 $1.70 $1.95 $2.02 $2.03 $2.14 $1.53 $1.81 $1.87 $2.06 Q1 2015Q2 2015Q3 2015Q4 2015Q1 2016Q2 2016Q3 2016Q4 2016Q1 2017Q2 2017Q FY 2014 FY 2015 FY 2016 YTD 2017 Total COS % Wing Cost % of Total COS Wing Cost/Lb COS Trends and Wing Impact 16 NOTE: Wing prices shown are the average price paid per pound of fresh, jumbo chicken wings including distribution costs of approximately $0.29 per pound Traditional wing costs hit record highs in Q but have recently begun to moderate; wings as % of total COS spiked to 25.3%

30 Historical Wing Prices 17 $ / lb. Fresh Jumbo Northeast Chicken Wing Spot Prices Source: Urner Barry Comtell UB Chicken Northeast Jumbo Wings NOTE: Logistics cost to restaurants is $0.29 / lb. over the spot price Volatile fresh wing spot prices have ranged between $1.41 and $2.16/lb. since 2015; prices have declined for 5 consecutive weeks since peaking in mid-september, now at $1.90

31 Total Labor Trends 18 NOTE: OH = Overhead labor costs including payroll taxes, FUTA, SUTA, health benefits and retirement plan. Bonus is typically between % of sales. Hourly and total labor costs continue to be held in check as we push productivity initiatives as a means of offsetting wage inflation 23.3% 23.9% 25.1% 24.8% 24.4% 25.2% 24.7% 25.0% 24.7% 25.5% 25.4% 24.4% 24.8% 25.2% 12.5% 13.2% 13.8% 13.3% 13.1% 13.6% 13.3% 13.6% 13.1% 13.8% 13.6% 13.2% 13.4% 13.5% 5.6% 6.0% 6.4% 6.4% 6.2% 6.4% 6.6% 6.6% 6.6% 6.8% 7.1% 6.1% 6.5% 6.8% 5.2% 4.7% 4.9% 5.2% 5.1% 5.1% 4.8% 4.8% 5.1% 4.8% 4.7% 5.0% 4.9% 4.9% Q Q Q Q Q Q Q Q Q Q Q FY 2015 FY 2016 YTD 2017 Hourly Labor % of Sales Mgmt Labor % of Sales Bonus & OH % of Sales AUV ($M) $3.1 $2.8 $2.7 $2.7 $2.7 $2.6 $2.6 $2.6 $2.8 $2.5 $2.4 $2.8 $2.6 $2.6

32 Adjusted EBITDA Trends % 20.6% 19.4% 20.3% 21.5% 20.0% 19.6% 16.5% 19.0% 16.6% 15.9% 21.2% 20.4% 19.4% 17.1% 4.3% 8.0% 5.8% 5.1% 5.0% 5.7% 5.7% 5.8% 5.3% 5.2% 4.9% 5.1% 5.7% 5.7% 5.1% Key Q Q Q Q Q Q Q Q Q Q Q FY2014 FY 2015 FY 2016 YTD 2017 G& A R ES T. EB IT D A AUV ($M) $3.1 $2.8 $2.7 $2.7 $2.7 $2.6 $2.6 $2.6 $2.8 $2.5 $2.4 $2.8 $2.8 $2.6 $2.6 G&A expenses have seen ongoing reductions, partially offsetting the impact of lower store level margins on higher cost of sales
 $2.38 $2.37 $2.36 $2.07 $1.92 5.7% 5.8% 5.3% 5.2% 4.9% 4.4% 4.6% 4.8% 5.0% 5.2% 5.4% 5.6% 5.8% 6.")
33 G&A Run Rate Trending Down 20 G&A costs continue to trend down as cost savings initiatives take effect; despite top-line softness, Q G&A was below the targeted 5% of net sales NOTE: Q3 G&A Expense excludes Bank Amendment Fees ($0.34) $2.38 $2.37 $2.36 $2.07 $ % 5.8% 5.3% 5.2% 4.9% 4.4% 4.6% 4.8% 5.0% 5.2% 5.4% 5.6% 5.8% 6.0% Q Q Q Q *Q G&A $ G&A %
34 Exhibits 21
35 EBITDA Reconciliation 22
 plus the sum of non-restaurant specific general and administrative expenses, restaurant pre- opening costs, loss on property and equipment")
36 EBITDA Reconciliation cont. 23 Restaurant-Level EBITDA represents net income (loss) plus the sum of non-restaurant specific general and administrative expenses, restaurant pre- opening costs, loss on property and equipment disposals, depreciation and amortization, other income and expenses, interest, taxes, and non-recurring expenses related to acquisitions, equity offerings or other non-recurring expenses. Adjusted EBITDA represents net income (loss) plus the sum of restaurant pre-opening costs, loss on property and equipment disposals, depreciation and amortization, other income and expenses, interest, taxes, and non-recurring expenses. We are presenting Restaurant-Level EBITDA and Adjusted EBITDA, which are not presented in accordance with GAAP, because we believe they provide an additional metric by which to evaluate our operations. When considered together with our GAAP results and the reconciliation to our net income, we believe they provide a more complete understanding of our business than could be obtained absent this disclosure. We use Restaurant-Level EBITDA and Adjusted EBITDA together with financial measures prepared in accordance with GAAP, such as revenue, income from operations, net income, and cash flows from operations, to assess our historical and prospective operating performance and to enhance the understanding of our core operating performance. Restaurant-Level EBITDA and Adjusted EBITDA are presented because: (i) we believe they are useful measures for investors to assess the operating performance of our business without the effect of non-cash depreciation and amortization expenses; (ii) we believe investors will find these measures useful in assessing our ability to service or incur indebtedness; and (iii) they are used internally as benchmarks to evaluate our operating performance or compare our performance to that of our competitors. Additionally, we present Restaurant-Level EBITDA because it excludes the impact of general and administrative expenses and restaurant pre-opening costs, which is non-recurring. The use of Restaurant-Level EBITDA thereby enables us and our investors to compare our operating performance between periods and to compare our operating performance to the performance of our competitors. The measure is also widely used within the restaurant industry to evaluate restaurant level productivity, efficiency, and performance. The use of Restaurant-Level EBITDA and Adjusted EBITDA as performance measures permits a comparative assessment of our operating performance relative to our performance based on GAAP results, while isolating the effects of some items that vary from period to period without any correlation to core operating performance or that vary widely among similar companies. Companies within our industry exhibit significant variations with respect to capital structure and cost of capital (which affect interest expense and tax rates) and differences in book depreciation of property and equipment (which affect relative depreciation expense), including significant differences in the depreciable lives of similar assets among various companies. Our management team believes that Restaurant-Level EBITDA and Adjusted EBITDA facilitate company-to-company comparisons within our industry by eliminating some of the foregoing variations. Restaurant-Level EBITDA and Adjusted EBITDA are not determined in accordance with GAAP and should not be considered in isolation or as an alternative to net income, income from operations, net cash provided by operating, investing, or financing activities, or other financial statement data presented as indicators of financial performance or liquidity, each as presented in accordance with GAAP. Neither Restaurant-Level EBITDA nor Adjusted EBITDA should be considered as a measure of discretionary cash available to us to invest in the growth of our business. Restaurant-Level EBITDA and Adjusted EBITDA as presented may not be comparable to other similarly titled measures of other companies and our presentation of Restaurant-Level EBITDA and Adjusted EBITDA should not be construed as an inference that our future results will be unaffected by unusual items. Our management recognizes that Restaurant-Level EBITDA and Adjusted EBITDA have limitations as analytical financial measures.
37
Q4 and FY 2017 Financial Results. March 9, 2018
 and Financial Results March 9, 2018 Safe Harbor The information made available in this presentation contains forward looking statements which reflect the Company s current view of future events, results
Q Financial Results. August 3, 2017
 Q2 2017 Financial Results August 3, 2017 Safe Harbor The information made available in this presentation contains forward-looking statements which reflect the Company s current view of future events, results
UNITED STATES SECURITIES AND EXCHANGE COMMISSION. Washington, D.C FORM 8-K CURRENT REPORT
 UNITED STATES SECURITIES AND EXCHANGE COMMISSION Washington, D.C. 20549 FORM 8-K CURRENT REPORT Pursuant to Section 13 or 15(d) of the Securities Exchange Act of 1934 Date of Report (Date of earliest event
UNITED STATES SECURITIES AND EXCHANGE COMMISSION. Washington, D.C FORM 8-K CURRENT REPORT
 UNITED STATES SECURITIES AND EXCHANGE COMMISSION Washington, D.C. 20549 FORM 8-K CURRENT REPORT Pursuant to Section 13 or 15(d) of the Securities Exchange Act of 1934 Date of Report (Date of earliest event
UNITED STATES SECURITIES AND EXCHANGE COMMISSION. Washington, D.C FORM 8-K CURRENT REPORT
 UNITED STATES SECURITIES AND EXCHANGE COMMISSION Washington, D.C. 20549 FORM 8-K CURRENT REPORT Pursuant to Section 13 or 15(d) of the Securities Exchange Act of 1934 Date of Report (Date of earliest event
Dougherty & Company Institutional Investor Conference
 Dougherty & Company Institutional Investor Conference September 19, David Burke, Chief Executive Officer Phyllis Knight, Chief Financial Officer Safe Harbor The information made available in this presentation
Q Financial Results. May 4, 2017
 Q1 2017 Financial Results May 4, 2017 Safe Harbor The information made available in this presentation contains forward-looking statements which reflect the Company s current view of future events, results
UNITED STATES SECURITIES AND EXCHANGE COMMISSION. Washington, D.C FORM 8-K CURRENT REPORT
 UNITED STATES SECURITIES AND EXCHANGE COMMISSION Washington, D.C. 20549 FORM 8-K CURRENT REPORT Pursuant to Section 13 or 15(d) of the Securities Exchange Act of 1934 Date of Report (Date of earliest event
Oppenheimer 18 th Annual Consumer Conference June 20, 2018
 Oppenheimer 18 th Annual Consumer Conference June 20, 2018 David Burke, Chief Executive Officer Phyllis Knight, Chief Financial Officer 1 Safe Harbor Some of the statements contained in this presentation
29 th Annual ROTH Conference March 13, 2017
 29 th Annual ROTH Conference March 13, 2017 David Burke, Chief Executive Officer Phyllis Knight, Chief Financial Officer Safe Harbor The information made available in this presentation contains forward-looking
Q Financial Results. May 8, 2018
 Q1 2018 Financial Results May 8, 2018 Safe Harbor Some of the statements contained in this presentation and the Company s May 9, 2018 earnings conference call may constitute forward-looking statements
NobleCon13 January 30, 2017
 NobleCon13 January 30, 2017 David Burke Chief Executive Officer 2017 by Diversified Restaurant Holdings, Inc. Safe Harbor Statement The information made available in this presentation contains forward
Q Financial Results November 14, 2013
 Q3 2013 Financial Results November 14, 2013 Michael Ansley President, CEO & Board Chairman David G. Burke Chief Financial Officer & Treasurer www.diversifiedrestaurantholdings.com Safe Harbor Statement
Del Taco Restaurants, Inc. (Exact name of registrant as specified in its charter)
") UNITED STATES SECURITIES AND EXCHANGE COMMISSION WASHINGTON, DC 20549 FORM 8-K CURRENT REPORT Pursuant to Section 13 or 15(d) of the Securities Exchange Act of 1934 Date of Report (Date of earliest event
UNITED STATES SECURITIES AND EXCHANGE COMMISSION WASHINGTON, DC 20549 FORM 8-K CURRENT REPORT Pursuant to Section 13 or 15(d) of the Securities Exchange Act of 1934 Date of Report (Date of earliest event
Buffalo Wild Wings, Inc. Announces Third Quarter Earnings per Share of $1.17 and Adjusted Earnings per Share of $1.36
 Buffalo Wild Wings Inc. Logo Buffalo Wild Wings, Inc. Announces Third Quarter Earnings per Share of $1.17 and Adjusted Earnings per Share of $1.36 October 25, 2017 Increasing 2017 Forecasted GAAP EPS to
Buffalo Wild Wings, Inc. Announces Second Quarter Earnings per Share of $0.55 and Adjusted Earnings per Share of $0.66
 July 26, 2017 Buffalo Wild Wings, Inc. Announces Second Quarter Earnings per Share of $0.55 and Adjusted Earnings per Share of $0.66 -FY2017 Guidance Updated to $4.00 to $4.50 GAAP EPS and $4.50 to $5.00
Del Taco Restaurants, Inc. (Exact name of registrant as specified in its charter)
") UNITED STATES SECURITIES AND EXCHANGE COMMISSION WASHINGTON, DC 20549 FORM 8-K CURRENT REPORT Pursuant to Section 13 or 15(d) of the Securities Exchange Act of 1934 Date of Report (Date of earliest event
UNITED STATES SECURITIES AND EXCHANGE COMMISSION WASHINGTON, DC 20549 FORM 8-K CURRENT REPORT Pursuant to Section 13 or 15(d) of the Securities Exchange Act of 1934 Date of Report (Date of earliest event
SECURITIES & EXCHANGE COMMISSION EDGAR FILING. MusclePharm Corp. Form: 8-K. Date Filed:
 SECURITIES & EXCHANGE COMMISSION EDGAR FILING MusclePharm Corp Form: 8-K Date Filed: 2018-11-13 Corporate Issuer CIK: 1415684 Copyright 2018, Issuer Direct Corporation. All Right Reserved. Distribution
Planet Fitness, Inc. (Exact name of registrant as specified in its charter)
") UNITED STATES SECURITIES AND EXCHANGE COMMISSION WASHINGTON, D.C. 20549 FORM 8-K CURRENT REPORT Pursuant to Section 13 or 15(d) of The Securities Exchange Act of 1934 August 9, 2018 Date of Report (Date
UNITED STATES SECURITIES AND EXCHANGE COMMISSION WASHINGTON, D.C. 20549 FORM 8-K CURRENT REPORT Pursuant to Section 13 or 15(d) of The Securities Exchange Act of 1934 August 9, 2018 Date of Report (Date
Planet Fitness, Inc. (Exact name of registrant as specified in its charter)
") UNITED STATES SECURITIES AND EXCHANGE COMMISSION WASHINGTON, D.C. 20549 FORM 8-K CURRENT REPORT Pursuant to Section 13 or 15(d) of The Securities Exchange Act of 1934 February 22, 2018 Date of Report (Date
UNITED STATES SECURITIES AND EXCHANGE COMMISSION WASHINGTON, D.C. 20549 FORM 8-K CURRENT REPORT Pursuant to Section 13 or 15(d) of The Securities Exchange Act of 1934 February 22, 2018 Date of Report (Date
Noodles & Company Announces Third Quarter 2018 Financial Results
 Announces Third Quarter Financial Results October 23, BROOMFIELD, Colo., Oct. 23, (GLOBE NEWSWIRE) -- (Nasdaq: NDLS) today announced financial results for its third quarter ended. Key highlights for the
Q %; 7.1% Q3 106%; 61% Q3 EPS
 At Home Group Inc. Announces Third Quarter Fiscal 2018 Financial Results Q3 net sales grew 25%; comparable store sales increased 7.1% Q3 operating income rose 106%; adjusted operating income 1 increased
Company raises fiscal year 2016 non-gaap diluted EPS guidance range from $1.85 to $2.00, to $1.90 to $2.00
 BOB EVANS REPORTS FISCAL 2016 THIRD-QUARTER RESULTS Q3 2016 net sales total $346.5 million. GAAP and non-gaap net income (1) of $0.62 per diluted share, represents an increase of 148 percent and 3 percent,
UNITED STATES SECURITIES AND EXCHANGE COMMISSION Washington, D.C FORM 8-K
 UNITED STATES SECURITIES AND EXCHANGE COMMISSION Washington, D.C. 20549 FORM 8-K CURRENT REPORT Pursuant to Section 13 or 15(d) of the Securities Exchange Act of 1934 Date of Report (Date of earliest event
DIPLOMAT PHARMACY, INC.
 DIPLOMAT PHARMACY, INC. FORM 8-K (Current report filing) Filed 05/11/15 for the Period Ending 05/11/15 Address 4100 S. SAGINAW ST. FLINT, MI 48507 Telephone 888-720-4450 CIK 0001610092 Symbol DPLO SIC
BOB EVANS REPORTS FISCAL 2017 FIRST-QUARTER RESULTS AND RAISES FISCAL 2017 EPS GUIDANCE
 BOB EVANS REPORTS FISCAL 2017 FIRST-QUARTER RESULTS AND RAISES FISCAL 2017 EPS GUIDANCE Q1 2017 net sales total $306.3 million; GAAP net income of $0.46 per diluted share, non-gaap net income (1) of $0.48
QUEST RESOURCE HOLDING CORPORATION (Exact Name of Registrant as Specified in Charter)
") UNITED STATES SECURITIES AND EXCHANGE COMMISSION Washington, D.C. 20549 FORM 8-K CURRENT REPORT Pursuant to Section 13 or 15(d) of the Securities Exchange Act of 1934 Date of Report (Date of earliest event
UNITED STATES SECURITIES AND EXCHANGE COMMISSION Washington, D.C. 20549 FORM 8-K CURRENT REPORT Pursuant to Section 13 or 15(d) of the Securities Exchange Act of 1934 Date of Report (Date of earliest event
UNITED STATES SECURITIES AND EXCHANGE COMMISSION Washington, D.C FORM 8-K
 UNITED STATES SECURITIES AND EXCHANGE COMMISSION Washington, D.C. 20549 FORM 8-K CURRENT REPORT Pursuant to Section 13 or 15(d) of the Securities Exchange Act of 1934 Date of Report (Date of earliest event
NATURAL GROCERS BY VITAMIN COTTAGE, INC.
 NATURAL GROCERS BY VITAMIN COTTAGE, INC. FORM 8-K (Current report filing) Filed 11/21/13 for the Period Ending 11/21/13 Address 12612 W. ALAMEDA PARKWAY LAKEWOOD, CO, 80228 Telephone 877-986-4600 CIK 0001547459
Del Taco Restaurants, Inc. Reports Fiscal Fourth Quarter and Fiscal Year 2017 Financial Results
 NEWS RELEASE Del Taco Restaurants, Inc. Reports Fiscal Fourth Quarter and Fiscal Year 2017 Financial Results 3/14/2018 System-wide comparable restaurant sales growth of 2.4% in Fiscal Fourth Quarter Announces
UNITED STATES SECURITIES AND EXCHANGE COMMISSION WASHINGTON, DC FORM 8-K
 UNITED STATES SECURITIES AND EXCHANGE COMMISSION WASHINGTON, DC 20549 FORM 8-K CURRENT REPORT Pursuant to Section 13 or 15(d) of the Securities Exchange Act of 1934 Date of Report (Date of earliest event
BOB EVANS REPORTS FISCAL 2015 FOURTH-QUARTER AND FULL-YEAR RESULTS; PROVIDES FISCAL YEAR 2016 OUTLOOK
 BOB EVANS REPORTS FISCAL FOURTH-QUARTER AND FULL-YEAR RESULTS; PROVIDES FISCAL YEAR 2016 OUTLOOK Q4 net sales total $332.4 million, an increase of $6.0 million, or 1.8 percent. GAAP net income of $0.24
Planet Fitness, Inc. (Exact name of registrant as specified in its charter)
") UNITED STATES SECURITIES AND EXCHANGE COMMISSION WASHINGTON, D.C. 20549 FORM 8-K CURRENT REPORT Pursuant to Section 13 or 15(d) of The Securities Exchange Act of 1934 September 2, 2015 Date of Report (Date
UNITED STATES SECURITIES AND EXCHANGE COMMISSION WASHINGTON, D.C. 20549 FORM 8-K CURRENT REPORT Pursuant to Section 13 or 15(d) of The Securities Exchange Act of 1934 September 2, 2015 Date of Report (Date
SNAP INC. (Exact name of Registrant as Specified in Its Charter)
") UNITED STATES SECURITIES AND EXCHANGE COMMISSION WASHINGTON, D.C. 20549 FORM 8-K CURRENT REPORT Pursuant to Section 13 or 15(d) of the Securities Exchange Act of 1934 Date of Report (Date of earliest event
UNITED STATES SECURITIES AND EXCHANGE COMMISSION WASHINGTON, D.C. 20549 FORM 8-K CURRENT REPORT Pursuant to Section 13 or 15(d) of the Securities Exchange Act of 1934 Date of Report (Date of earliest event
UNITED STATES SECURITIES AND EXCHANGE COMMISSION Washington, D.C FORM 8-K
 UNITED STATES SECURITIES AND EXCHANGE COMMISSION Washington, D.C. 20549 FORM 8-K CURRENT REPORT Pursuant to Section 13 or 15(d) of the Securities Exchange Act of 1934 Date of Report (Date of Earliest Event
Williams Industrial Services Group Reports 37% Increase in Revenue for Third Quarter 2018
 Williams Industrial Services Group Reports 37% Increase in Revenue for Third Quarter 2018 November 9, 2018 Revenue increased 37% to $53.5 million driven by nuclear construction projects Gross margin was
Noodles & Company Announces Fourth Quarter and Fiscal Year 2014 Financial Results
 February 19, 2015 Noodles & Company Announces Fourth Quarter and Fiscal Year 2014 Financial Results BROOMFIELD, Colo., Feb. 19, 2015 (GLOBE NEWSWIRE) -- Noodles & Company (Nasdaq:NDLS) today announced
Sprouts Farmers Market, Inc. Reports Fourth Quarter and Full Year 2013 Results
 February 27, 2014 Sprouts Farmers Market, Inc. Reports Fourth Quarter and Full Year Results PHOENIX, Feb. 27, 2014 (GLOBE NEWSWIRE) -- Sprouts Farmers Market, Inc. (the "Company") (Nasdaq:SFM) today reported
GRUBHUB INC. (Exact name of Registrant as Specified in Its Charter)
") UNITED STATES SECURITIES AND EXCHANGE COMMISSION WASHINGTON, D.C. 20549 FORM 8-K CURRENT REPORT Pursuant to Section 13 or 15(d) of the Securities Exchange Act of 1934 Date of Report (Date of earliest event
UNITED STATES SECURITIES AND EXCHANGE COMMISSION WASHINGTON, D.C. 20549 FORM 8-K CURRENT REPORT Pursuant to Section 13 or 15(d) of the Securities Exchange Act of 1934 Date of Report (Date of earliest event
Q %; 7.8% Q2 50%; 35% Q2 EPS
 At Home Group Inc. Announces Second Quarter Fiscal 2018 Financial Results Q2 net sales increased 23%; comparable store sales increased 7.8% Q2 net income increased 50%; pro forma adjusted net income 1
SNAP INC. (Exact name of Registrant as Specified in Its Charter)
") UNITED STATES SECURITIES AND EXCHANGE COMMISSION WASHINGTON, D.C. 20549 FORM 8-K CURRENT REPORT Pursuant to Section 13 or 15(d) of the Securities Exchange Act of 1934 Date of Report (Date of earliest event
UNITED STATES SECURITIES AND EXCHANGE COMMISSION WASHINGTON, D.C. 20549 FORM 8-K CURRENT REPORT Pursuant to Section 13 or 15(d) of the Securities Exchange Act of 1934 Date of Report (Date of earliest event
NATURAL GROCERS BY VITAMIN COTTAGE, INC.
 NATURAL GROCERS BY VITAMIN COTTAGE, INC. FORM 8-K (Current report filing) Filed 08/07/13 for the Period Ending 08/07/13 Address 12612 W. ALAMEDA PARKWAY LAKEWOOD, CO, 80228 Telephone 877-986-4600 CIK 0001547459
REDFIN CORPORATION (Exact name of registrant as specified in its charter)
") UNITED STATES SECURITIES AND EXCHANGE COMMISSION Washington, D.C. 20549 FORM 8-K CURRENT REPORT Pursuant to Section 13 or 15(d) of the Securities Exchange Act of 1934 Date of Report (Date of earliest event
UNITED STATES SECURITIES AND EXCHANGE COMMISSION Washington, D.C. 20549 FORM 8-K CURRENT REPORT Pursuant to Section 13 or 15(d) of the Securities Exchange Act of 1934 Date of Report (Date of earliest event
Buffalo Wild Wings, Inc. Announces Second Quarter Earnings per Share of $1.25
 FOR IMMEDIATE RELEASE Investor Relations Contact: Heather Pribyl 952.253.0731 Buffalo Wild Wings, Inc. Announces Second Quarter Earnings per Share of $1.25 - Net Earnings Growth to Exceed 25% and Could
INVESTOR PRESENTATION JANUARY 2018
 INVESTOR PRESENTATION JANUARY 2018 0 FORWARD-LOOKING STATEMENTS Forward-Looking Statements This presentation contains forward-looking statements that are subject to risks and uncertainties. All statements
UNITED STATES SECURITIES AND EXCHANGE COMMISSION WASHINGTON, D.C FORM 8-K CURRENT REPORT. PURSUANT TO SECTION 13 OR 15(d) OF THE
 OF THE") UNITED STATES SECURITIES AND EXCHANGE COMMISSION WASHINGTON, D.C. 20549 FORM 8-K CURRENT REPORT PURSUANT TO SECTION 13 OR 15(d) OF THE SECURITIES EXCHANGE ACT OF 1934 Date of report (Date of earliest event
UNITED STATES SECURITIES AND EXCHANGE COMMISSION WASHINGTON, D.C. 20549 FORM 8-K CURRENT REPORT PURSUANT TO SECTION 13 OR 15(d) OF THE SECURITIES EXCHANGE ACT OF 1934 Date of report (Date of earliest event
SECURITIES & EXCHANGE COMMISSION EDGAR FILING. MusclePharm Corp. Form: 8-K. Date Filed:
 SECURITIES & EXCHANGE COMMISSION EDGAR FILING MusclePharm Corp Form: 8-K Date Filed: 2018-05-14 Corporate Issuer CIK: 1415684 Copyright 2018, Issuer Direct Corporation. All Right Reserved. Distribution
SECURITIES & EXCHANGE COMMISSION EDGAR FILING. MusclePharm Corp. Form: 8-K. Date Filed:
 SECURITIES & EXCHANGE COMMISSION EDGAR FILING MusclePharm Corp Form: 8-K Date Filed: 2018-08-14 Corporate Issuer CIK: 1415684 Copyright 2018, Issuer Direct Corporation. All Right Reserved. Distribution
UNITED STATES SECURITIES AND EXCHANGE COMMISSION FORM 8-K DASEKE, INC.
 UNITED STATES SECURITIES AND EXCHANGE COMMISSION Washington, D.C. 20549 FORM 8-K CURRENT REPORT PURSUANT TO SECTION 13 OR 15(D) OF THE SECURITIES EXCHANGE ACT OF 1934 May 10, 2017 Date of Report (Date
BOB EVANS REPORTS FISCAL 2017 SECOND-QUARTER RESULTS AND UPDATES FISCAL 2017 GUIDANCE
 BOB EVANS REPORTS FISCAL 2017 SECOND-QUARTER RESULTS AND UPDATES FISCAL 2017 GUIDANCE Q2 2017 net sales total $316.0 million; GAAP net income of $0.01 per diluted share, non-gaap net income (1) of $0.56
CPI Card Group Inc. Reports Fourth Quarter and Full Year 2015 Results
 CPI Card Group Inc. Reports Fourth Quarter and Full Year 2015 Results Fourth Quarter Net Sales of $93.6 million and Pro Forma Adjusted Diluted EPS of $0.16 Initiates Quarterly Dividend Announces 2016 Financial
2018 Second Quarter Earnings Call. May 8, 2018
 2018 Second Quarter Earnings Call May 8, 2018 Forward Looking Statements / Non-GAAP Measures This presentation contains information about management's view of the Company's future expectations, plans and
FORM 8-K EL POLLO LOCO HOLDINGS, INC.
 UNITED STATES SECURITIES AND EXCHANGE COMMISSION Washington, D.C. 20549 FORM 8-K CURRENT REPORT Pursuant to Section 13 OR 15(d) of The Securities Exchange Act of 1934 Date of Report (Date of earliest event
UNITED STATES SECURITIES AND EXCHANGE COMMISSION Washington, D.C FORM 8-K
 UNITED STATES SECURITIES AND EXCHANGE COMMISSION Washington, D.C. 20549 FORM 8-K CURRENT REPORT Pursuant to Section 13 or 15(d) of the Securities Exchange Act of 1934 Date of Report (Date of earliest event
UNITED STATES SECURITIES AND EXCHANGE COMMISSION WASHINGTON, D.C FORM 8-K
 UNITED STATES SECURITIES AND EXCHANGE COMMISSION WASHINGTON, D.C. 20549 FORM 8-K CURRENT REPORT Pursuant to Section 13 or 15(d) of the Securities Exchange Act of 1934 Date of Report (Date of earliest event
Acushnet Holdings Corp.
 UNITED STATES SECURITIES AND EXCHANGE COMMISSION WASHINGTON, D.C. 20549 FORM 8-K CURRENT REPORT Pursuant to Section 13 or 15(d) of the Securities Exchange Act of 1934 Date of Report (Date of Earliest Event
CLARUS CORPORATION (Exact name of registrant as specified in its charter)
") United States Securities and Exchange Commission Washington, D.C. 20549 Form 8-K Current Report Pursuant to Section 13 or 15(d) of the Securities Exchange Act of 1934 Date of Report (Date of earliest event
United States Securities and Exchange Commission Washington, D.C. 20549 Form 8-K Current Report Pursuant to Section 13 or 15(d) of the Securities Exchange Act of 1934 Date of Report (Date of earliest event
Buffalo Wild Wings, Inc. Announces Fourth Quarter Earnings per Share of $0.89 and Annual Net Earnings Growth of Over 13% for 2012
 FOR IMMEDIATE RELEASE Investor Relations Contact: Mary Twinem 952.253.0731 Mary Twinem CFO Buffalo Wild Wings, Inc. Announces Fourth Quarter Earnings per Share of $0.89 and Annual Net Earnings Growth of
Capital Senior Living Corporation
 UNITED STATES SECURITIES AND EXCHANGE COMMISSION Washington, D.C. 20549 FORM 8-K CURRENT REPORT Pursuant to Section 13 OR 15(d) of The Securities Exchange Act of 1934 Date of Report (Date of earliest event
Luby s Reports Second Quarter Fiscal 2011 Results
 For additional information contact: FOR IMMEDIATE RELEASE DRG&L / 713-529-6600 Ken Dennard / Sheila Stuewe Investor Relations Luby s Reports Second Quarter Fiscal 2011 Results HOUSTON, TX March 10, 2011
Advanced Disposal Services, Inc. (Exact name of registrant as specified in its charter)
") UNITED STATES SECURITIES AND EXCHANGE COMMISSION Washington, D.C. 20549 FORM 8-K CURRENT REPORT Pursuant to Section 13 or 15(d) of The Securities Exchange Act of 1934 Date of Report: February 21, 2019
UNITED STATES SECURITIES AND EXCHANGE COMMISSION Washington, D.C. 20549 FORM 8-K CURRENT REPORT Pursuant to Section 13 or 15(d) of The Securities Exchange Act of 1934 Date of Report: February 21, 2019
Domino s Pizza, Inc. (Exact name of registrant as specified in its charter)
") SECURITIES AND EXCHANGE COMMISSION Washington, D.C. 20549 FORM 8-K Current Report Pursuant to Section 13 or 15(d) of the Securities Exchange Act of 1934 Date of report (Date of earliest event reported):
SECURITIES AND EXCHANGE COMMISSION Washington, D.C. 20549 FORM 8-K Current Report Pursuant to Section 13 or 15(d) of the Securities Exchange Act of 1934 Date of report (Date of earliest event reported):
Bob Evans Express expects to open three new locations during Q2 2015; up to ten new locations expected for fiscal 2015
 BOB EVANS REPORTS FISCAL 2015 FIRST-QUARTER RESULTS Q1 2015 net sales total $326.3 million, a decline of $3.1 million, or 0.9 percent, compared to prior year first-quarter results. GAAP net loss of $0.04
FOR IMMEDIATE RELEASE. Investor Contact: Carol DiRaimo, (858) Media Contact: Brian Luscomb, (858)
 Media Contact: Brian Luscomb, (858)") Investor Contact: Carol DiRaimo, (858) 571-2407 FOR IMMEDIATE RELEASE Media Contact: Brian Luscomb, (858) 571-2291 Jack in the Box Inc. Reports Second Quarter FY Earnings; Updates Guidance for FY ; Declares
Investor Contact: Carol DiRaimo, (858) 571-2407 FOR IMMEDIATE RELEASE Media Contact: Brian Luscomb, (858) 571-2291 Jack in the Box Inc. Reports Second Quarter FY Earnings; Updates Guidance for FY ; Declares
R. R. DONNELLEY & SONS COMPANY (Exact name of Registrant as Specified in Its Charter)
") UNITED STATES SECURITIES AND EXCHANGE COMMISSION WASHINGTON, D.C. 20549 FORM 8-K CURRENT REPORT Pursuant to Section 13 or 15(d) of the Securities Exchange Act of 1934 Date of Report (Date of earliest event
UNITED STATES SECURITIES AND EXCHANGE COMMISSION WASHINGTON, D.C. 20549 FORM 8-K CURRENT REPORT Pursuant to Section 13 or 15(d) of the Securities Exchange Act of 1934 Date of Report (Date of earliest event
Milacron Holdings Corp. Reports Full Year & Fourth Quarter 2018 Results
 Exhibit 99.1 Milacron Holdings Corp. Reports Full Year & Fourth Quarter 2018 Results Milacron closes 2018 with strong cash flow and concludes its multi-year restructuring initiative Full Year 2018: Sales
Del Taco Restaurants, Inc. (Exact name of registrant as specified in its charter)
") UNITED STATES SECURITIES AND EXCHANGE COMMISSION WASHINGTON, DC 20549 FORM 8-K CURRENT REPORT Pursuant to Section 13 or 15(d) of the Securities Exchange Act of 1934 Date of Report (Date of earliest event
UNITED STATES SECURITIES AND EXCHANGE COMMISSION WASHINGTON, DC 20549 FORM 8-K CURRENT REPORT Pursuant to Section 13 or 15(d) of the Securities Exchange Act of 1934 Date of Report (Date of earliest event
UNITED STATES SECURITIES AND EXCHANGE COMMISSION WASHINGTON, D.C FORM 8-K
 UNITED STATES SECURITIES AND EXCHANGE COMMISSION WASHINGTON, D.C. 20549 FORM 8-K CURRENT REPORT Pursuant to Section 13 or 15(d) of the Securities Exchange Act of 1934 Date of Report (Date of earliest event
CLAIRE S STORES, INC. (Exact name of registrant as specified in its charter)
") UNITED STATES SECURITIES AND EXCHANGE COMMISSION Washington, D.C. 20549 FORM 8-K CURRENT REPORT Pursuant to Section 13 or 15(d) of the Securities Exchange Act of 1934 Date of Report (Date of earliest event
UNITED STATES SECURITIES AND EXCHANGE COMMISSION Washington, D.C. 20549 FORM 8-K CURRENT REPORT Pursuant to Section 13 or 15(d) of the Securities Exchange Act of 1934 Date of Report (Date of earliest event
UNITED STATES SECURITIES AND EXCHANGE COMMISSION WASHINGTON, D.C FORM 8-K CURRENT REPORT
 UNITED STATES SECURITIES AND EXCHANGE COMMISSION WASHINGTON, D.C. 20549 FORM 8-K CURRENT REPORT Pursuant to Section 13 or 15(d) of the Securities Exchange Act of 1934 Date of Report (Date of earliest event
UNITED STATES SECURITIES AND EXCHANGE COMMISSION Washington, D.C FORM 8-K
 UNITED STATES SECURITIES AND EXCHANGE COMMISSION Washington, D.C. 20549 FORM 8-K Current Report Pursuant to Section 13 or 15(d) of the Securities Exchange Act of 1934 Date of Report (date of earliest event
Domino s Pizza Financial Results Demonstrate Global Momentum Delivers 21.9% EPS Growth in the Fourth Quarter; Dividend Increases 25%
 For Immediate Release EXHIBIT 99.1 Contact: Lynn Liddle, Executive Vice President, Communications, Investor Relations and Legislative Affairs (734) 930-3008 Domino s Pizza Financial Results Demonstrate
TELENAV, INC. FORM 8-K. (Current report filing) Filed 10/30/14 for the Period Ending 10/30/14
 Filed 10/30/14 for the Period Ending 10/30/14") TELENAV, INC. FORM 8-K (Current report filing) Filed 10/30/14 for the Period Ending 10/30/14 Address 4655 GREAT AMERICA PARKWAY SUITE 300 SANTA CLARA, CA, 95054 Telephone (408) 245-3800 CIK 0001474439
TELENAV, INC. FORM 8-K (Current report filing) Filed 10/30/14 for the Period Ending 10/30/14 Address 4655 GREAT AMERICA PARKWAY SUITE 300 SANTA CLARA, CA, 95054 Telephone (408) 245-3800 CIK 0001474439
InfraREIT, Inc. (Exact name of registrant as specified in its charter)
") UNITED STATES SECURITIES AND EXCHANGE COMMISSION WASHINGTON, D.C. 20549 FORM 8-K CURRENT REPORT Pursuant to Section 13 or 15(d) of the Securities Exchange Act of 1934 Date of Report (date of earliest event
UNITED STATES SECURITIES AND EXCHANGE COMMISSION WASHINGTON, D.C. 20549 FORM 8-K CURRENT REPORT Pursuant to Section 13 or 15(d) of the Securities Exchange Act of 1934 Date of Report (date of earliest event
Papa John's Announces Third Quarter Results
 November 3, 2010 Papa John's Announces Third Quarter Results EPS Increased 6.7% over Prior Year, Excluding BIBP; 2010 EPS Guidance Updated to a Range of $1.74 to $1.80, Excluding BIBP LOUISVILLE, Ky.--(BUSINESS
Bandwidth Inc. (Exact name of registrant as specified in its charter)
") UNITED STATES SECURITIES AND EXCHANGE COMMISSION WASHINGTON, D.C. 20549 FORM 8-K CURRENT REPORT PURSUANT TO SECTION 13 OR 15(d) OF THE SECURITIES EXCHANGE ACT OF 1934 Date of Report (Date of earliest event
UNITED STATES SECURITIES AND EXCHANGE COMMISSION WASHINGTON, D.C. 20549 FORM 8-K CURRENT REPORT PURSUANT TO SECTION 13 OR 15(d) OF THE SECURITIES EXCHANGE ACT OF 1934 Date of Report (Date of earliest event
Gardner Denver Holdings, Inc. (Exact name of registrant as specified in its charter)
") UNITED STATES SECURITIES AND EXCHANGE COMMISSION Washington, D.C. 20549 FORM 8-K CURRENT REPORT Pursuant to Section 13 or 15(d) of the Securities Exchange Act of 1934 Date of Report (Date Earliest Event
UNITED STATES SECURITIES AND EXCHANGE COMMISSION Washington, D.C. 20549 FORM 8-K CURRENT REPORT Pursuant to Section 13 or 15(d) of the Securities Exchange Act of 1934 Date of Report (Date Earliest Event
CLARUS CORPORATION (Exact name of registrant as specified in its charter)
") United States Securities and Exchange Commission Washington, D.C. 20549 Form 8-K Current Report Pursuant to Section 13 or 15(d) of the Securities Exchange Act of 1934 Date of Report (Date of earliest event
United States Securities and Exchange Commission Washington, D.C. 20549 Form 8-K Current Report Pursuant to Section 13 or 15(d) of the Securities Exchange Act of 1934 Date of Report (Date of earliest event
UNITED STATES SECURITIES AND EXCHANGE COMMISSION Washington, D.C FORM 8-K
 UNITED STATES SECURITIES AND EXCHANGE COMMISSION Washington, D.C. 20549 FORM 8-K CURRENT REPORT Pursuant to Section 13 or 15(d) of the Securities Exchange Act of 1934 Date of Report (Date of earliest event
UNITED STATES SECURITIES AND EXCHANGE COMMISSION Washington, D.C FORM 8-K
 UNITED STATES SECURITIES AND EXCHANGE COMMISSION Washington, D.C. 20549 FORM 8-K CURRENT REPORT PURSUANT TO SECTION 13 or 15(d) OF THE SECURITIES EXCHANGE ACT OF 1934 DATE OF REPORT (Date of earliest event
Planet Fitness, Inc. Announces Third Quarter 2016 Results
 NEWS RELEASE Planet Fitness, Inc. Announces Third Quarter 2016 Results 10/26/2016 Total Revenue Increased 26.4% to $87.0 Million Third Quarter System-Wide Same Stores Sales Increased 10.0% Company Raises
UNITED STATES SECURITIES AND EXCHANGE COMMISSION Washington, D.C FORM 8-K
 UNITED STATES SECURITIES AND EXCHANGE COMMISSION Washington, D.C. 20549 FORM 8-K CURRENT REPORT Pursuant to Section 13 or 15(d) of the Securities Exchange Act of 1934 Date of report (Date of earliest event
Planet Fitness, Inc. Announces Fourth Quarter and Fiscal Year 2017 Results
 NEWS RELEASE Planet Fitness, Inc. Announces Fourth Quarter and Fiscal Year 2017 Results 2/22/2018 Fourth Quarter System-Wide Same Store Sales Increased 11.6% 210 New Planet Fitness Stores Opened System
Luby s Reports Fourth Quarter and Fiscal 2015 Results
 For additional information contact: FOR IMMEDIATE RELEASE Dennard-Lascar Associates 713-529-6600 Rick Black / Ken Dennard Investor Relations Luby s Reports Fourth Quarter and Fiscal Results HOUSTON, TX
INVESTOR PRESENTATION JUNE 2018
 INVESTOR PRESENTATION JUNE 2018 0 FORWARD-LOOKING STATEMENTS Forward-Looking Statements This presentation contains forward-looking statements that are subject to risks and uncertainties. All statements
Luby s Reports Third Quarter Fiscal 2016 Results
 For additional information contact: FOR IMMEDIATE RELEASE Dennard-Lascar Associates Rick Black / Ken Dennard Investor Relations 713-529-6600 Luby s Reports Third Quarter Fiscal Results Luby s Cafeterias
SEMGROUP CORPORATION
 UNITED STATES SECURITIES AND EXCHANGE COMMISSION WASHINGTON, DC 20549 FORM 8-K CURRENT REPORT Pursuant to Section 13 or 15(d) of the Securities Exchange Act of 1934 Date of report (Date of earliest event
R1 RCM Inc. (Exact Name of Registrant as Specified in Charter)
") UNITED STATES SECURITIES AND EXCHANGE COMMISSION WASHINGTON, D.C. 20549 FORM 8-K CURRENT REPORT Pursuant to Section 13 or 15(d) of the Securities Exchange Act of 1934 Date of Report (Date of earliest event
UNITED STATES SECURITIES AND EXCHANGE COMMISSION WASHINGTON, D.C. 20549 FORM 8-K CURRENT REPORT Pursuant to Section 13 or 15(d) of the Securities Exchange Act of 1934 Date of Report (Date of earliest event
WEEKS ENDED. Adjusted diluted earnings per share* $ 0.46 $ 0.50 $ (0.04)
") May 9, 2014 Bloomin' Brands, Inc. Announces Fiscal 2014 First Quarter Adjusted Diluted Earnings Per Share of $0.46 and GAAP Diluted Earnings Per Share of $0.42; Reaffirms Full-Year 2014 Guidance Including
May 9, 2014 Bloomin' Brands, Inc. Announces Fiscal 2014 First Quarter Adjusted Diluted Earnings Per Share of $0.46 and GAAP Diluted Earnings Per Share of $0.42; Reaffirms Full-Year 2014 Guidance Including
UNITED STATES SECURITIES AND EXCHANGE COMMISSION Washington, D.C FORM 8-K
 UNITED STATES SECURITIES AND EXCHANGE COMMISSION Washington, D.C. 20549 FORM 8-K CURRENT REPORT PURSUANT TO SECTION 13 OR 15(d) OF THE SECURITIES EXCHANGE ACT OF 1934 Date of Report (Date of earliest event
R. R. DONNELLEY & SONS COMPANY (Exact name of Registrant as Specified in Its Charter)
") UNITED STATES SECURITIES AND EXCHANGE COMMISSION WASHINGTON, D.C. 20549 FORM 8-K CURRENT REPORT Pursuant to Section 13 or 15(d) of the Securities Exchange Act of 1934 Date of Report (Date of earliest event
UNITED STATES SECURITIES AND EXCHANGE COMMISSION WASHINGTON, D.C. 20549 FORM 8-K CURRENT REPORT Pursuant to Section 13 or 15(d) of the Securities Exchange Act of 1934 Date of Report (Date of earliest event
Facebook, Inc. (Exact Name of Registrant as Specified in Charter)
") UNITED STATES SECURITIES AND EXCHANGE COMMISSION Washington, D.C. 20549 FORM 8-K CURRENT REPORT PURSUANT TO SECTION 13 or 15(d) OF THE SECURITIES EXCHANGE ACT OF 1934 Date of report (Date of earliest event
UNITED STATES SECURITIES AND EXCHANGE COMMISSION Washington, D.C. 20549 FORM 8-K CURRENT REPORT PURSUANT TO SECTION 13 or 15(d) OF THE SECURITIES EXCHANGE ACT OF 1934 Date of report (Date of earliest event
GRUBHUB INC. FORM 8-K. (Current report filing) Filed 02/05/15 for the Period Ending 01/30/15
 Filed 02/05/15 for the Period Ending 01/30/15") GRUBHUB INC. FORM 8-K (Current report filing) Filed 02/05/15 for the Period Ending 01/30/15 Address 1065 AVENUE OF THE AMERICAS NEW YORK, NY 10018 Telephone 646-527-7672 CIK 0001594109 Symbol GRUB SIC
GRUBHUB INC. FORM 8-K (Current report filing) Filed 02/05/15 for the Period Ending 01/30/15 Address 1065 AVENUE OF THE AMERICAS NEW YORK, NY 10018 Telephone 646-527-7672 CIK 0001594109 Symbol GRUB SIC
LKQ CORPORATION (Exact name of registrant as specified in its charter)
") UNITED STATES SECURITIES AND EXCHANGE COMMISSION WASHINGTON, DC 20549 FORM 8-K Current Report Pursuant to Section 13 or 15(d) of The Securities Exchange Act of 1934 Date of Report (Date of earliest event
UNITED STATES SECURITIES AND EXCHANGE COMMISSION WASHINGTON, DC 20549 FORM 8-K Current Report Pursuant to Section 13 or 15(d) of The Securities Exchange Act of 1934 Date of Report (Date of earliest event
Facebook, Inc. (Exact Name of Registrant as Specified in Charter)
") UNITED STATES SECURITIES AND EXCHANGE COMMISSION Washington, D.C. 20549 FORM 8-K CURRENT REPORT PURSUANT TO SECTION 13 or 15(d) OF THE SECURITIES EXCHANGE ACT OF 1934 Date of report (Date of earliest event
UNITED STATES SECURITIES AND EXCHANGE COMMISSION Washington, D.C. 20549 FORM 8-K CURRENT REPORT PURSUANT TO SECTION 13 or 15(d) OF THE SECURITIES EXCHANGE ACT OF 1934 Date of report (Date of earliest event
National Vision Holdings, Inc. Reports Fourth Quarter and Fiscal 2017 Financial Results
 National Vision Holdings, Inc. Reports Fourth Quarter and Fiscal 2017 Financial Results Duluth, Ga. -- Mar. 8, 2018 -- National Vision Holdings, Inc. (NASDAQ: EYE) ( National Vision or the Company ) today
Advanced Disposal Services, Inc. (Exact name of registrant as specified in its charter)
") UNITED STATES SECURITIES AND EXCHANGE COMMISSION Washington, D.C. 20549 FORM 8-K CURRENT REPORT Pursuant to Section 13 or 15(d) of The Securities Exchange Act of 1934 Date of Report: November 1, 2017 (Date
UNITED STATES SECURITIES AND EXCHANGE COMMISSION Washington, D.C. 20549 FORM 8-K CURRENT REPORT Pursuant to Section 13 or 15(d) of The Securities Exchange Act of 1934 Date of Report: November 1, 2017 (Date
UNITED STATES SECURITIES AND EXCHANGE COMMISSION WASHINGTON, DC FORM 8-K
 UNITED STATES SECURITIES AND EXCHANGE COMMISSION WASHINGTON, DC 20549 FORM 8-K CURRENT REPORT Pursuant to Section 13 or 15(d) of the Securities Exchange Act of 1934 Date of Report (Date of earliest event
UNITED STATES SECURITIES AND EXCHANGE COMMISSION FORM 8-K HAYNES INTERNATIONAL, INC.
 hayn_currentfolio_8k Page 1 of 2 2/2/2017 UNITED STATES SECURITIES AND EXCHANGE COMMISSION Washington, D.C. 20549 FORM 8-K CURRENT REPORT Pursuant to Section 13 or 15(d) of the Securities Exchange Act
The ExOne Company Reports 2018 Third Quarter Results
 Reports 2018 Third Quarter Results November 8, 2018 2018 Q3 revenue of $16.6 million; full year 2018 revenue growth goal remains 20% Q3 net loss of $0.3 million, $0.02 loss per share Gross margin improved