FEMSA Announces Third Quarter 2018 Results
|
|
|
- Silvester Boyd
- 5 years ago
- Views:
Transcription
 (NYSE: FMX; BMV: FEMSAUBD) announced today its operational and financial results for the third quarter of 2018.")

1 FEMSA Announces Third Quarter 2018 Results Monterrey, Mexico, October 26, 2018 Fomento Económico Mexicano, S.A.B. de C.V. ( FEMSA ) (NYSE: FMX; BMV: FEMSAUBD) announced today its operational and financial results for the third quarter of As of the third quarter of 2018, we have made a change to the disclosure related to our businesses formerly named as FEMSA Comercio s Retail Division : We have removed those operations that are not directly related to our proximity store business, namely our restaurant and discount retail units, from this segment. The segment is now named the Proximity Division, and will only include proximity and proximity related operations, most of which operate today under the OXXO brand across markets. This change will provide a more accurate picture of the performance of this key, high growth business. FINANCIAL HIGHLIGHTS: 7.9% revenue growth (8.9% on an organic 1 basis) at FEMSA Consolidated 12.1% revenue growth (11.7% on an organic basis) at FEMSA Comercio s Proximity Division 29.5% income from operations growth at FEMSA Comercio s Health Division 41.5% income from operations growth at FEMSA Comercio s Fuel Division 8.2% income from operations growth ( 6.9% on an organic basis) at Coca Cola FEMSA FINANCIAL SUMMARY FOR THE THIRD QUARTER AND FIRST NINE MONTHS OF 2018 Revenues Change vs. same period of last year Gross Profit Income from Operations Same Store Sales 3Q18 YTD18 3Q18 YTD18 3Q18 YTD18 3Q18 YTD18 FEMSA CONSOLIDATED 7.9% 5.1% 9.3% 6.9% 8.1% 6.1% FEMSA COMERCIO Proximity Division 12.1% 12.0% 17.2% 15.7% 8.7% 11.6% 6.2% 5.5% Health Division 10.2% 10.2% 11.8% 14.1% 29.5% 46.0% 6.3% 6.2% Fuel Division 26.7% 21.6% 47.4% 47.0% 41.5% 122.8% 7.1% 5.3% COCA COLA FEMSA (0.7%) (4.7%) 0.6% (2.1%) 8.2% 1.6% Eduardo Padilla, FEMSA s CEO, commented: During the third quarter, we continued to see our business units making steady progress. Store counts, comparable sales and gross margins once again grew across retail formats and markets. However, operating margins were under moderate pressure particularly in Mexico, reflecting tight labor conditions and higher operational costs, as well as OXXO s increased international organic expansion efforts. At Coca Cola FEMSA, we saw positive top line performance in several of our markets, particularly Mexico, as well as encouraging signs of progress in other regions, including the recently acquired operations in Guatemala and Uruguay. On the strategic front, there are interesting news as well. We recently announced our entry into Ecuador through our Health Division, with a transaction that is still subject to regulatory approval, and today we are announcing our 1 Excludes the effects of significant mergers and acquisitions in the last twelve months and the results of Coca Cola FEMSA Venezuela in. For this quarter, it includes the consolidation of Caffenio, our sole coffee supplier in Mexico, which we now control with % share ownership. Follow today s event live 10:00 AM ET Earnings Conference Call 1
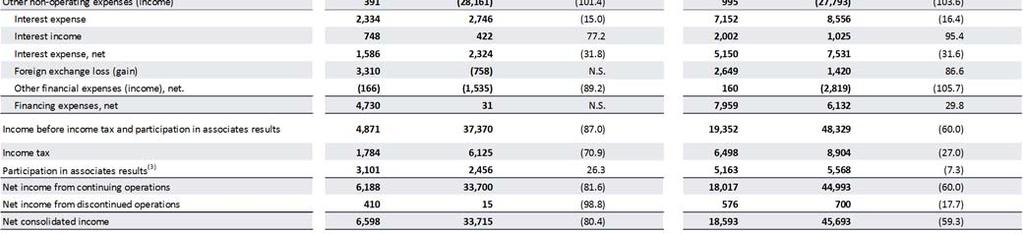
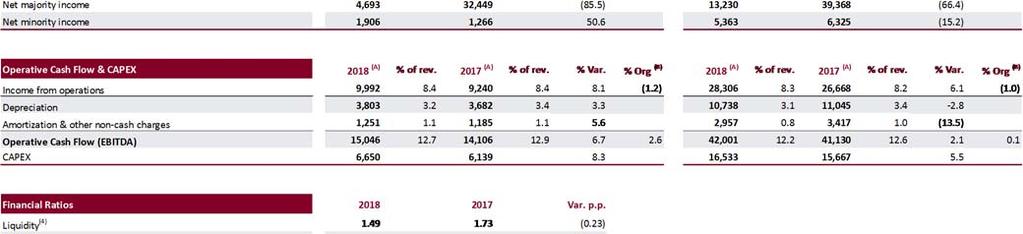
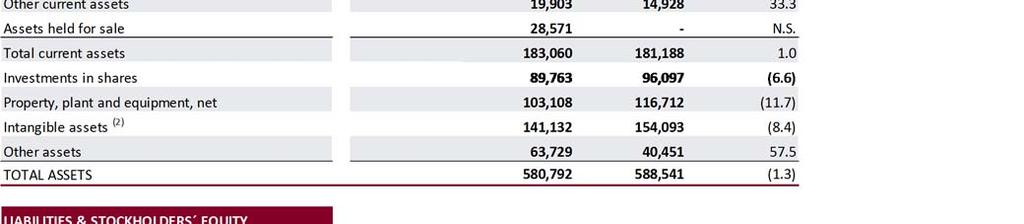
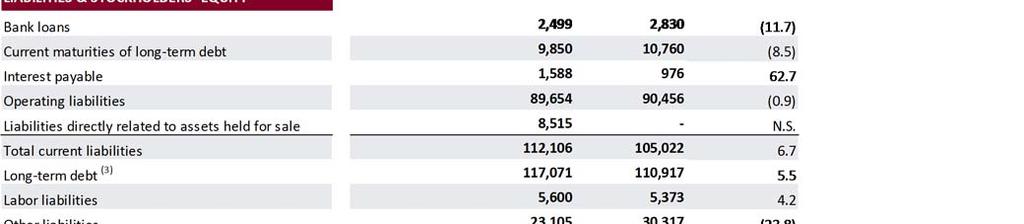
2 entry into Peru through the opening of our first OXXO store in the city of Lima. These two announcements reflect our commitment to continue expanding our small box platform across Latin America. As we look toward the end of 2018 and into next year, we continue to see some macroeconomic uncertainty in many of our markets, including Mexico and Brazil. However, uncertainty can often bring opportunity, and with that view we are optimistic about our possibilities to create value as we chart our strategic path for 2019 and beyond. QUARTERLY RESULTS Results are compared to the same period of previous year FEMSA CONSOLIDATED FEMSA CONSOLIDATED 3Q18 Financial Summary (Millions of Ps.) CONSOLIDATED BALANCE SHEET (Millions of Ps.) 3Q18 3Q17 Var. Org. As of September 30, 2018 Ps. US$ 2 Revenues 118, , % 8.9% Cash 54,166 2,896 Income from Operations 9,992 9, % (1.2%) Short term debt 12, Income from Operations Margin (%) bps Long term debt 117,071 6,259 Operative Cash Flow (EBITDA) 15,046 14, % 2.6% Net debt 3 75,254 4,023 Operative Cash Flow (EBITDA) Margin (%) bps Net Income 6,598 33,715 (80.4%) Total revenues increased 7.9%, reflecting growth across FEMSA Comercio s three business units, partially offset by a slight decrease at Coca Cola FEMSA. On an organic basis, total revenues grew 8.9%. Gross profit grew 9.3%. Gross margin expanded by 50 basis points, reflecting strong margin expansion across all business units. Income from operations increased 8.1%. On an organic basis, income from operations decreased 1.2%, reflecting a decline at Coca Cola FEMSA. Consolidated operating margin remained in line at 8.4% of total revenues, mostly driven by margin expansion at Coca Cola FEMSA reflecting a non cash operating foreign exchange gain in Mexico, and operating expense efficiencies in South America. This expansion was offset by modest margin contraction at FEMSA Comercio s Proximity Division, driven by higher operating expenses. Our effective income tax rate was 36.6% in 3Q18 compared to 16.4% in 3Q17. Net consolidated income decreased 80.4% to Ps. 6,598 million, reflecting a demanding comparison base caused by the extraordinary non operating income generated in 3Q17 from the sale of 5.24% of the combined interest in the Heineken Excludes the effects of significant mergers and acquisitions in the last twelve months and the results of Coca Cola FEMSA Venezuela in. For this quarter, it includes the consolidation of Caffenio, our sole coffee supplier in Mexico, which we now control with % share ownership. The exchange rate published by the Federal Reserve Bank of New York for September, was. MXN per USD. Includes the effect of derivative financial instruments on long term debt. October 26,

3 Group. This decrease also reflected a non cash foreign exchange loss related to FEMSA s U.S. dollar denominated cash position, as impacted by the appreciation of the Mexican peso and partially offset by lower interest expense. Net majority income was Ps per FEMSA Unit 2 and US$ 0.70 per FEMSA ADS. Capital expenditures amounted to Ps. 6,650 million, reflecting higher investments across all business units. FEMSA COMERCIO PROXIMITY DIVISION FEMSA COMERCIO PROXIMITY DIVISION 3Q18 Financial Summary (Millions of Ps. except same stores sales) 3Q18 3Q17 Var. Org. Same store sales (thousands of Ps.) % Revenues 43,967 39, % 11.7% Income from Operations 3,610 3, % 6.3% Income from Operations Margin (%) bps Operative Cash Flow (EBITDA) 4,997 4, % 9.4% Operative Cash Flow (EBITDA) Margin (%) bps Total revenues increased 12.1% in 3Q18 compared to 3Q17. On an organic basis, total revenues grew 11.7%, reflecting the opening of 182 net new OXXO stores in the quarter to reach 1,430 total net new store openings for the last twelve months. As of September 30, 2018, FEMSA Comercio s Proximity Division had a total of 17,478 OXXO stores. OXXO s same store sales increased an average of 6.2%, reflecting resilient consumer demand and the undemanding comparison base that was affected by the natural disasters in central and southern Mexico during September This performance was driven by 3.6% growth in average customer ticket and a robust increase of 2.5% in store traffic. Gross profit increased 17.2%, resulting in a gross margin expansion of 170 basis points to 38.8% of total revenues. This expansion mainly reflects: i) sustained growth of the services category, including income from financial services; ii) increased Excludes the effects of significant mergers and acquisitions in the last twelve months. For this quarter, it includes the consolidation of Caffenio, our sole coffee supplier in Mexico, which we now control with % share ownership. FEMSA Units consist of FEMSA BD Units and FEMSA B Units. Each FEMSA BD Unit is comprised of one Series B Share, two Series D B Shares and two Series D L Shares. Each FEMSA B Unit is comprised of five Series B Shares. The number of FEMSA Units outstanding as of September, was,,,, equivalent to the total number of FEMSA Shares outstanding as of the same date, divided by. October 26,

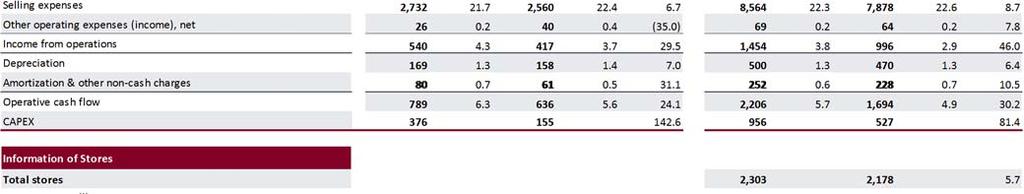
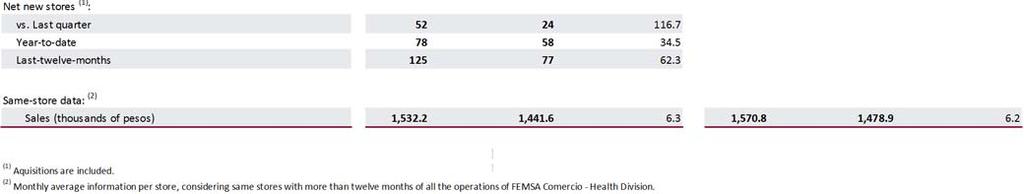
4 and more efficient promotional programs with our key supplier partners; iii) healthy trends in our commercial income activity, and iv) the consolidation of Caffenio. Income from operations increased 8.7%. On an organic basis, income from operations grew 6.3%. Operating expenses increased 19.7% to Ps. 13,440 million, above revenues, mainly reflecting: i) higher secure cash transportation costs driven by increased volume and higher operational costs including fuel prices; ii) our continuing and gradual shift from commissionbased store teams to employee based teams; iii) an increase in electricity tariffs during the last month of the quarter, and iv) organic growth of OXXO s international operations that achieved healthy sales levels per store, but have yet to reach sufficient scale to better absorb overhead. Operating margin contracted 30 basis points to 8.2% of total revenues. FEMSA COMERCIO HEALTH DIVISION FEMSA COMERCIO HEALTH DIVISION 3Q18 Financial Summary (Millions of Ps. except same stores sales) 3Q18 3Q17 Var. Same store sales (thousands of Ps.) 1,532 1, % Revenues 12,562 11, % Income from Operations % Income from Operations Margin (%) bps Operative Cash Flow (EBITDA) % Operative Cash Flow (EBITDA) Margin (%) bps Total revenues increased 10.2% in 3Q18 compared to 3Q17, mainly driven by growth in our South American operations as well as a continuation of gradually improving trends in Mexico. As of September 30, 2018, FEMSA Comercio s Health Division had a total of 2,303 points of sale across our territories. This figure reflects the addition of 52 net new stores, including a small acquisition in Colombia to reach 125 total net new stores for the last twelve months. Same store sales for drugstores increased an average of 6.3%, which includes a positive currency translation effect related to the depreciation of the Mexican peso compared to the Chilean and Colombian pesos in our operations in South America. Excludes the effects of significant mergers and acquisitions in the last twelve months. For this quarter, it includes the consolidation of Caffenio, our sole coffee supplier in Mexico, which we now control with % share ownership. October 26,

5 Gross profit increased 11.8%, resulting in a gross margin expansion of 40 basis points to 30.3% of total revenues. This increase reflects commercial activity driving positive margin mix and volume, as well as more effective execution across markets, mainly in South America. Income from operations grew 29.5%. Operating expenses increased 9.4% to Ps. 3,272 million, below revenues. Operating margin increased 60 basis points to 4.3% of total revenues reflecting the sales growth and gross margin expansion as described above, combined with: i) the strength of the Chilean and Colombian pesos relative to the Mexican peso during the third quarter; and ii) increased operating leverage generated by cost efficiencies and tight expense control. FEMSA COMERCIO FUEL DIVISION FEMSA COMERCIO FUEL DIVISION 3Q18 Financial Summary (Millions of Ps. except same stations sales) 3Q18 3Q17 Var. Same station sales (thousands of Ps.) 8,742 8, % Revenues 12,196 9, % Income from Operations % Income from Operations Margin (%) bps Operative Cash Flow (EBITDA) % Operative Cash Flow (EBITDA) Margin (%) bps Total revenues increased 26.7% in 3Q18 compared to 3Q17, reflecting the addition of 20 net new OXXO GAS stations in the quarter to reach 122 total net new stations in the last twelve months. As of September 30, 2018, FEMSA Comercio s Fuel Division had a total of 519 OXXO GAS service stations. Same station sales increased an average of 7.1%, as average price per liter increased by 19.5%, while average volume decreased 10.4% reflecting consumer reaction to the higher prices and, to a lesser degree, increased competition. Gross profit increased 47.4%, above revenues, resulting in a gross margin expansion of 120 basis points to 8.7% of total revenues, reflecting improved supply terms and a recovery from a low comparable base as gross profit per liter was held flat in 3Q17 in peso terms in some of our territories. Income from operations increased 41.5%. Operating expenses increased 48.3% to Ps. 927 million, above revenues, reflecting higher labor costs implemented to reduce turnover and a one off provision related to institutional customers. In spite of this, operating margin recovered 10 basis points to 1.1% of total revenues. October 26,
6 RESULTS FOR THE FIRST NINE MONTHS OF 2018 Results are compared to the same period of previous year FEMSA CONSOLIDATED FEMSA CONSOLIDATED Financial Summary for the First Nine Months (Millions of Ps.) Var. Org. Revenues 343, , % 7.1% Income from Operations 28,306 26, % (1.0%) Income from Operations Margin (%) bps Operative Cash Flow (EBITDA) 42,001 41, % 0.1% Operative Cash Flow (EBITDA) Margin (%) bps Net Income 18,593 45,693 (59.3%) Total revenues increased 5.1%, mainly reflecting solid growth at FEMSA Comercio s three divisions. On an organic basis, total revenues increased 7.1%. Gross profit increased 6.9%. Gross margin increased 60 basis points to 36.6% of total revenues, reflecting gross margin expansion across all business units. Income from operations increased 6.1%. On an organic basis, 1 income from operations decreased 1.0%. Our consolidated operating margin increased 10 basis points to 8.3% of total revenues, reflecting an increase at Coca Cola FEMSA coupled with margin expansion at FEMSA Comercio s Health and Fuel Divisions. Net consolidated income decreased 59.3% to Ps. 18,593 million, reflecting a demanding comparison base caused by the extraordinary non operating income resulting from the sale of 5.24% of the combined interest in the Heineken Group during 3Q17, offset by growth in our income from operations and lower financing expenses. Net majority income per FEMSA Unit 2 was Ps (US$ 1.98 per ADS). Capital expenditures amounted to Ps. 16,533 million, reflecting higher investments at FEMSA Comercio s three divisions. Excludes the effects of significant mergers and acquisitions in the last twelve months and the results of Coca Cola FEMSA Venezuela in. For this quarter, it includes the consolidation of Caffenio, our sole coffee supplier in Mexico, which we now control with % share ownership. FEMSA Units consist of FEMSA BD Units and FEMSA B Units. Each FEMSA BD Unit is comprised of one Series B Share, two Series D B Shares and two Series D L Shares. Each FEMSA B Unit is comprised of five Series B Shares. The number of FEMSA Units outstanding as of September, was,,,, equivalent to the total number of FEMSA Shares outstanding as of the same date, divided by. October 26,
7 FEMSA COMERCIO PROXIMITY DIVISION FEMSA COMERCIO PROXIMITY DIVISION Financial Summary for the First Nine Months (Millions of Ps. except same stores sales) Var. Org. Same store sales (thousands of Ps.) % Revenues 124, , % 11.8% Income from Operations 9,169 8, % 10.3% Income from Operations Margin (%) bps Operative Cash Flow (EBITDA) 13,055 11, % 12.2% Operative Cash Flow (EBITDA) Margin (%) bps Total revenues increased 12.0%. OXXO s same store sales increased an average of 5.5%, driven by a 3.5% increase in average customer ticket and a 1.9% increase in store traffic. On an organic basis, total revenues increased 11.8%. Gross profit increased 15.7%. Gross margin expanded by 120 basis points to 37.6% of total revenues. Income from operations increased 11.6% resulting in an operating margin of 7.4%, in line with On an organic basis, income from operations increased 10.3%. FEMSA COMERCIO HEALTH DIVISION FEMSA COMERCIO HEALTH DIVISION Financial Summary for the First Nine Months (Millions of Ps. except same stores sales) Var. Same store sales (thousands of Ps.) 1,571 1, % Revenues 38,396 34, % Income from Operations 1, % Income from Operations Margin (%) bps Operative Cash Flow (EBITDA) 2,206 1, % Operative Cash Flow (EBITDA) Margin (%) bps Total revenues increased 10.2%. Same store sales for drugstores increased by an average of 6.2%. Gross profit increased 14.1%. Gross margin expanded by 100 basis points to 30.2% of total revenues, driven by more efficient and effective commercial activity, particularly in South America, and to benefits that are gradually beginning to materialize in Mexico from our integration into a single operating platform. Income from operations increased 46.0% resulting in an operating margin of 3.8%, which represents an expansion of 90 basis points, due to increased operating leverage. Excludes the effects of significant mergers and acquisitions in the last twelve months. For this quarter, it includes the consolidation of Caffenio, our sole coffee supplier in Mexico, which we now control with % share ownership. October 26,
8 FEMSA COMERCIO FUEL DIVISION FEMSA COMERCIO FUEL DIVISION Financial Summary for the First Nine Months (Millions of Ps. except same stations sales) Var. Same station sales (thousands of Ps.) 8,475 8, % Revenues 34,300 28, % Income from Operations % Income from Operations Margin (%) bps Operative Cash Flow (EBITDA) % Operative Cash Flow (EBITDA) Margin (%) bps Total revenues increased 21.6%. Same station sales increased an average of 5.3%, driven by a 14.0% increase in the average price per liter and a decrease of 7.7% in the average volume. Gross profit increased 47.0%. Gross margin expanded by 140 basis points to 8.3% of total revenues, reflecting a recovery from a low comparable base as gross profit per liter was held flat in peso terms for most of the comparable period in 2017 in some of our territories. Income from operations increased 122.8%, resulting in an operating margin of 1.0%, which represents a recovery of 40 basis points. This increase reflects better operating leverage that more than offset higher regulatory and expansion related expenses. COCA COLA FEMSA Coca Cola FEMSA s financial results and discussion thereof are incorporated by reference from Coca Cola FEMSA s press release, which is attached to this press release or may be accessed by visiting RECENT DEVELOPMENTS On September 24, FEMSA Comercio announced that that through its majority owned subsidiary Socofar, it had reached an agreement to acquire Corporación GPF; a leading drugstore operator based in Quito, Ecuador, with almost 90 years of solid trajectory, operating more than 620 points of sale nationwide mainly under the Fybeca and SanaSana banners. This transaction represents a new building block of FEMSA Comercio s drugstore strategy in South America, following its successful acquisition of a controlling stake in the drugstore and distribution platform of Chile based Socofar in The announcement marked another important step for FEMSA Comercio as it brings its considerable retail expertise and Socofar s deep industry knowledge to the Ecuadorian market and its more than 16 million consumers. GPF is a strong local operator with attractive growth prospects, and it will help Socofar as it continues to build a robust base from which to expand further in the region. The transaction is subject to customary regulatory approvals and is expected to close during the first quarter of On October 26, FEMSA Comercio announces that it is opening its first OXXO store in Lima, Peru. OXXO s entry into Peru marks the beginning of a new stage in the format s international growth strategy. Since 2009, when OXXO opened its first five stores in Colombia, OXXO has gradually and consistently improved its capabilities to adjust the value proposition of its stores to better satisfy the needs of different consumers, across different markets. These improved capabilities are already being put to work in Colombia and Chile, and now they will also enable growth at OXXO Peru. This announcement marks another important step for FEMSA Comercio as it brings its considerable expertise in small box retail to the attractive Peruvian market and its more than 32 million consumers. October 26,
9 CONFERENCE CALL INFORMATION: Our Third Quarter 2018 Conference Call will be held on: Friday, October 26, 2018, 10:00 AM Eastern Time (9:00 AM Mexico City Time). To participate in the conference call, please dial: Domestic US: (866) ; International: +1 (323) ; Conference Id: The conference call will be webcast live through streaming audio. For details please visit If you are unable to participate live, the conference call audio will be available on FEMSA is a leading company that participates in the beverage industry through Coca Cola FEMSA, the largest franchise bottler of Coca Cola products in the world by volume; and in the beer industry, through its ownership of the second largest equity stake in Heineken, one of the world's leading brewers with operations in over 70 countries. In the retail industry it participates through FEMSA Comercio, comprising a Proximity Division operating OXXO, a small format store chain, a Health Division, which includes all drugstores and related operations, and a Fuel Division, which operates the OXXO GAS chain of retail service stations. Additionally, through its Strategic Businesses unit, it provides logistics, point of sale refrigeration solutions and plastics solutions to FEMSA's business units and third party clients. The translations of Mexican pesos into US dollars are included solely for the convenience of the reader, using the noon buying rate for Mexican pesos as published by the Federal Reserve Bank of New York on September 28, 2018, which was Mexican pesos per US dollar. FORWARD LOOKING STATEMENTS This report may contain certain forward looking statements concerning our future performance that should be considered as good faith estimates made by us. These forward looking statements reflect management s expectations and are based upon currently available data. Actual results are subject to future events and uncertainties, which could materially impact our actual performance. Seven pages of tables and Coca Cola FEMSA s press release to follow October 26,

10 October 26,

11 October 26,
12 FEMSA Comercio Proximity Division Results of Operations Millions of Pesos For the third quarter of: For the nine months of: 2018 (A) % of rev (A) % of rev. % Var. % Org (B) 2018 (A) % of rev (A) % of rev. % Var. % Org (B) Total revenues 43, , , , Cost of sales 26, , , , Gross profit 17, , , , Administrative expenses 1, , , Selling expenses 12, , , , Other operating expenses (income), net Income from operations 3, , , , Depreciation 1, , , , Amortization & other non cash charges Operative cash flow 4, , , , CAPEX 2,654 2, ,525 5, Information of OXXO Stores Total stores 17,296 15, ,478 16, Net new convenience stores: 13.5 vs. Last quarter (22.6) Year to date Last twelve months 1,430 1, Same store data: (1) Sales (thousands of pesos) Traffic (thousands of transactions) Ticket (pesos) (A) The Proximity Division includes proximity and proximity related operations across markets. (B) Organic basis (% Org.) Excludes the effects of significant mergers and acquisitions in the last twelve months. For this quarter, it includes the consolidation of Caffenio, our sole coffee supplier in Mexico, which we now control with 50% share ownership. (1) Monthly average information per store, considering same stores with more than twelve months of operations, income from services are included. October 26,

13 October 26,
14 FEMSA Comercio Fuel Division Results of Operations Millions of Pesos For the third quarter of: For the nine months of: 2018 % of rev % of rev. % Var % of rev % of rev. % Var. Total revenues 12, , , , Cost of sales 11, , , , Gross profit 1, , , Administrative expenses Selling expenses , , Other operating expenses (income), net (80.0) 3 11 (72.7) Income from operations Depreciation Amortization & other non cash charges (33.3) (24.0) Operative cash flow CAPEX Information of OXXO GAS Service Stations Total service stations Net new service stations vs. Last quarter Year to date N.S. Last twelve months Volume (million of liters) total stations ,093 1, Same stations data: (1) Sales (thousands of pesos) 8, , , , Volume (thousands of liters) (10.4) (7.7) Average price per liter Ticket (pesos) (1) Monthly average information per station, considering same stations with more than twelve months of operations. October 26,
15 Coca Cola FEMSA Results of Operations Millions of Pesos For the third quarter of: For the nine months of: 2018 (A) % of rev (A) % of rev. % Var. % Org (B) 2018 (A) % of rev (A) % of rev. % Var. % Org (B) Total revenues 44, , (0.7) (1.2) 130, , (4.7) (2.4) Cost of sales 23, , (1.8) 70, , (6.8) Gross profit 20, , , , (2.1) Administrative expenses 2, , (1.2) 5, , (3.3) Selling expenses 12, , (2.0) 36, , (5.9) Other operating expenses (income), net (11.8) (76) (0.1) N.S. Income from operations 5, , (6.9) 17, , (9.1) Depreciation 2, , (5.7) 6, , (7.1) Amortization & other non cash charges (43.8) 1, , (41.7) Operative cash flow 8, , (1.1) (1.8) 24, , (5.2) (3.5) CAPEX 3,103 2, ,120 8,485 (16.1) Sales volumes (Millions of unit cases) Mexico and Central America , , South America Brazil , , Total , , (A) The Philippines is presented as a discontinued operation as of January 1, 2018, and the consolidated income statements presented herein are re presented as if the Philippines had been discontinued from February 2017, date of the consolidation of said operation. (B) Organic basis (% Org.) Excludes the effects of significant mergers and acquisitions in the last twelve month and the results of Coca Cola FEMSA Venezuela in October 26,
16 FEMSA Macroeconomic Information Inflation End of period Exchange Rates 3Q 2018 LTM (1) Sep 18 Sep 18 Dec 17 Per USD Per MXN Per USD Per MXN Mexico 2.27% 5.33% Colombia 0.01% 3.08% 2, , Venezuela % % , Brazil 1.01% 3.90% Argentina 13.09% 37.63% Chile 0.52% 2.60% Philippines 2.85% 6.85% Euro Zone 0.38% 1.93% (1) LTM = Last twelve months. October 26,
17 2018 THIRD QUARTER AND FIRST NINE MONTHS RESULTS Mexico City,, Coca Cola FEMSA, S.A.B. de C.V. (BMV: KOFL, NYSE: KOF) ( Coca Cola FEMSA, KOF or the Company ), the largest Coca Cola franchise bottler in the world by sales volume, announces results for the third quarter of Relevant Reporting Information Volumes and financial results of the recently acquired territories in Guatemala and Uruguay were consolidated as of May 1, 2018 and as of July 1, 2018, respectively. Coca Cola FEMSA de Venezuela was deconsolidated as of December 31, On August 16, 2018, KOF announced the exercise of the put option to sell its 51% stake in Coca Cola FEMSA Philippines, Inc. Therefore, the Philippines is now presented as a discontinued operation as of January 1, 2018, and the consolidated income statements presented herein are represented as if the Philippines had been discontinued from February 2017, date of the consolidation of said operation. As a result, the Asia Division is no longer reported. As of July 1, 2018, Argentina is reported as a hyperinflationary subsidiary. Operational and Financial Highlights Volumes increased in Brazil, Central America, Colombia, and Mexico; transactions outperformed volumes in Argentina and Brazil. Revenues decreased 0.7%, as pricing aligned with or ahead of inflation in the Mexico & Central America division and in Argentina, combined with the consolidation of recent acquisitions were offset by unfavorable currency translation effects from the Brazilian Real, hyperinflationary accounting in Argentina and the deconsolidation of Venezuela. Comparable revenues grew 6.5% for the quarter driven by growth in Brazil, Central America, Colombia, and Mexico. Operating income grew 8.2%, while comparable operating income increased 5.5% for the quarter, driven mainly by lower sweetener costs, a favorable currency hedging position in South America, and operating expense efficiencies, partially offset by higher PET prices. Operating cash flow declined 1.2%, while comparable operating cash flow grew 6.2%. Results Summary Year to Date Third Quarter As Reported (1) Comparable (2) As Reported (1) Comparable (2) Expressed in millions of Mexican pesos Total revenues 44,148 (0.7%) 6.5% 130,577 (4.7%) 5.2% Gross profit 20, % 5.8% 60,150 (2.1%) 5.4% Operating income 5, % 5.5% 17, % (0.4%) Operating cash flow (3) 8,492 (1.2%) 6.2% 24,909 (5.2%) 3.8% Net income attributable to equity holders of the company 3, % 8,201 (19.9%) Earnings per share Continued operations Earnings per share (4) (1) 2017 financial information is re presented as if the Philippines had been discontinued from February 2017, date of the consolidation of said operation. (2) Please refer to page 9 for our definition of comparable and a description of the factors affecting the comparability of our financial and operating performance. (3) Operating cash flow = operating income + depreciation + amortization & other operating non cash charges. (4) Quarterly earnings / outstanding shares as of the end of the period. Outstanding shares were 2,100.8 million Message from the Chief Executive Officer Our third quarter results reflect very encouraging positive trends in many of our markets. In Mexico, our revenue management platform s analytics are enabling us to deliver solid top line growth, backed by positive volume performance. In Central America, organic volumes are showing encouraging trends, coupled with the ongoing integration of very promising territories in Guatemala. Importantly, in South America, we continue to gain share in gradually recovering consumer environments as we offer affordability and focus relentlessly on point of sale execution: Colombia is gaining traction; Brazil continues to deliver top and bottom line growth, while Argentina is better than ever prepared to face the challenging macro environment. Finally, this quarter, we welcome Uruguay as the newest territory to our diversified footprint. As we approach the end of the year, we look forward to continue capitalizing on our capabilities to capture the marketplace s many opportunities, while obsessively focusing on serving our customers and consumers. said John Santa Maria Otazua, Chief Executive Officer of the Company. Page 17
18 Consolidated results for the third quarter Comparable (1) figures: Revenues: Comparable total revenues grew 6.5% in the third quarter of 2018 as compared to the same period of 2017, driven by average price per unit case growth aligned with or ahead of inflation in Mexico and Central America, coupled with volume growth in Brazil, Colombia, Central America, and Mexico. Transactions: Comparable number of transactions increased 2.0%. Our sparkling beverage category grew 1.2%, driven by 3.1% growth in our colas portfolio, partially offset by a decline in flavors. Our positive performance in colas was driven by growth across all of our operations. Our still beverage category increased 3.6%, driven mainly by the positive performance of Brazil and Mexico, partially offset by declines in Central America and Colombia. Finally, our water category s transactions increased by 7.4%, driven by growth in Brazil, Colombia, and Mexico, partially offset by a decline in Central America. Volume: Comparable sales volume increased 2.5% in the third quarter of 2018 as compared to the same period in Additionally, excluding jug water, comparable sales volume increased 3.2%. Our sparkling beverage portfolio s volume increased 2.5%, driven by growth in our colas portfolio, partially offset by a decline in our flavors portfolio. Our growth in colas was driven by the positive performance of all of our operations. Our still beverage category s volume grew 3.6%, driven by Central America and Mexico. Our personal water portfolio s volume grew 12.0% due to positive performance across most of our operations. Finally, our bulk water portfolio s volume declined 3.1%, driven mainly by declines in Central America, Colombia, and Mexico, partially offset by growth in the rest of our operations. Gross profit: Comparable gross profit grew 5.8%. Our volume growth, lower sweetener prices in most of our operations, and favorable currency hedging positions in South America were offset by higher PET prices across most of our operations, higher concentrate prices in Mexico, and the depreciation in the average exchange rate of the Brazilian Real as applied to our U.S. dollardenominated raw material costs. Operating Income: Comparable operating income increased 5.5% for the third quarter of 2018 as compared to the same period of Operating cash flow: Comparable operating cash flow increased 6.2% in the third quarter of As reported figures: According to IFRS 5, the Philippines is presented as a discontinued operation as of January 1, 2018 and the consolidated income statements presented herein are re presented as if the Philippines had been discontinued from February Revenues: Total revenues decreased 0.7% to Ps. 44,148 million in the third quarter of 2018, driven mainly by the negative translation effect resulting from the depreciation of the Argentine Peso and the Brazilian Real as compared to the Mexican Peso, combined with a volume decline and hyperinflationary accounting in Argentina and the deconsolidation of Coca Cola FEMSA de Venezuela as of December 31, These factors were partially offset by volume growth in Brazil, Central America, Colombia, and Mexico, price increases aligned with or above inflation in Mexico and Argentina, and the consolidation of recently acquired territories in Guatemala and Uruguay. Transactions: Reported total number of transactions increased 2.2% to 4,973.1 million in the third quarter of 2018 as compared to the same period in Volume: Reported total sales volume increased 2.2% to million unit cases in the third quarter of 2018 as compared to the same period in Gross profit: Gross profit increased 0.6% to Ps. 20,236.7 million, and gross margin expanded 60 basis points to 45.8%. (Continued on next page) (1) Please refer to page 9 for our definition of comparable and a description of the factors affecting the comparability of our financial and operating performance. Page 18
19 Equity method: The reported share of the profits of associates and joint ventures recorded a loss of Ps. 85 million in the third quarter of 2018, compared to a loss of Ps. 6 million recorded in the third quarter of This is mainly due to a loss in our dairy joint venture in Panama, partially offset by gains in our joint ventures in Brazil. Operating Income: Operating income increased 8.2% to Ps. 5,777.5 million, and operating margin expanded 110 basis points to 13.1% during the third quarter of 2018 as compared with the same period of 2017, which included Venezuela. Other non operative expenses, net: Other non operative expenses, net, recorded an expense of Ps. 95 million, compared to an expense of Ps. 597 million during the third quarter of 2017, which mainly resulted from the effects of negative currency fluctuations in Coca Cola FEMSA de Venezuela. Comprehensive financing result: Comprehensive financing result in the third quarter of 2018 recorded an expense of Ps. 1,322 million, compared to an expense of Ps. 341 million in the same period of During the third quarter of 2018, we recorded an interest expense, net, of Ps. 1,558 million, compared to Ps. 1,929 million in the third quarter of This decrease was driven by the decline of short term interest rates in Brazil; the average exchange rate depreciation of the Brazilian Real compared to the Mexican Peso as applied to existing Brazilian Real denominated interest expense; and the reduction of debt in Colombia. However, these effects were partially offset by financing during the previous quarter of Ps. 10,100 million for the acquisition of our new territories in Guatemala and Uruguay. In addition, for the third quarter, we recorded a foreign exchange gain of Ps. 60 million as compared to a gain of Ps. 84 million in the same period of Moreover, due to the reporting of our Argentina operation as a hyperinflationary subsidiary as of the third quarter of 2018, monetary position in inflationary subsidiaries recorded a gain of Ps. 117 million as compared to a gain of Ps. 1,301 million during the same period of 2017, which was generated by Venezuela. Market value on financial instruments recorded a gain of Ps. 59 million as compared to a gain of Ps. 203 million in the third quarter of Income tax: During the third quarter of 2018, reported income tax as a percentage of income before taxes was 31.4%, compared to 25.2% in the same period of The higher tax rate was driven mainly by the increase in the relative weight of Brazil s profits in our consolidated results, coupled with the deconsolidation of Venezuela, which had deferred taxes in the third quarter of Net income: Consolidated net controlling interest income increased 3.6% to Ps. 3,266.1 million in the third quarter 2018, as compared to the same period of the previous year, which included Venezuela; resulting in earnings per share (EPS) of Ps (Ps per ADS). Earnings per share from continuing operations was Ps (Ps per ADS). Operating cash flow: Operating cash flow decreased 1.2% to Ps. 8,491.6 million, and operating cash flow margin contracted 10 basis points to 19.2%. Page 19
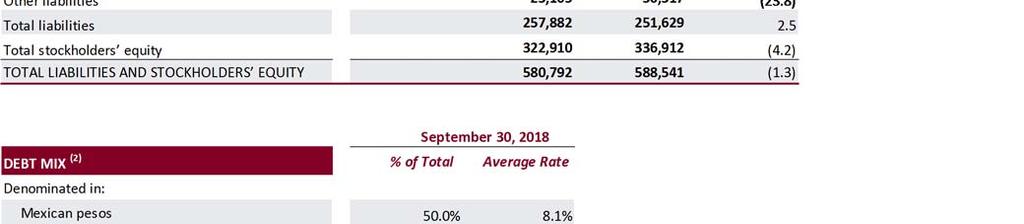
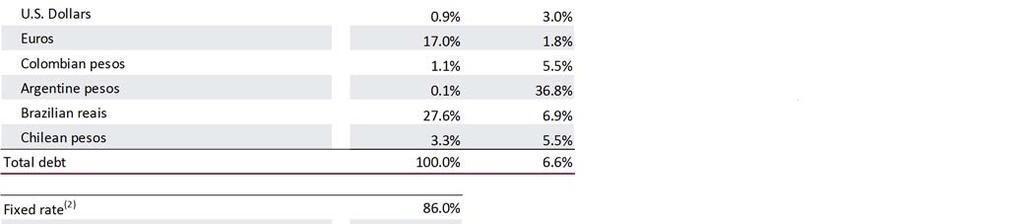
20 Consolidated Balance Sheet (1) As of September 30, 2018, we had a cash balance of Ps. 18,475 million of which US$180 million is denominated in U.S. dollars. This amount excludes the Philippine s cash position of Ps. 5,918 million now that the Philippines operation is classified as assets available for sale. Excluding the Philippine s cash position in 2017, our cash balance increased Ps. 6,007 million compared to yearend 2017, mainly driven by cash flow generation. As of September 30, 2018, total short term debt was Ps. 10,121 million and longterm debt was Ps. 79,840 million. Total debt increased by Ps. 6,601 million and net debt, excluding the Philippine s cash position, increased by Ps. 594 million compared year end 2017, due mainly to financing for the acquisition of our new territories in Guatemala and Uruguay. The weighted average cost of debt for the quarter, including the effect of debt swapped to Brazilian Reals and Mexican Pesos, was 7.71%, a reduction as compared to the fourth quarter of 2017, due mainly to the reduction of interest rates in Brazil. The following charts set forth the Company s debt profile by currency and interest rate type and by maturity date as of September 30, Currency % Total Debt (2) % Interest Rate Floating (2)(3) Mexican Pesos 55.5% 15.0% U.S. Dollars 1.3% 0.0% Colombian Pesos 1.6% 100.0% Brazilian Reals 40.1% 11.6% Uruguayan Pesos 1.4% 0.0% Argentine Pesos 0.2% 0.0% Debt Maturity Profile Maturity Date % of Total Debt 9.4% 14.7% 11.9% 13.2% 1.7% 49.1% (1) See page 15 for detailed information. (2) After giving effect to cross currency swaps. (3) Calculated by weighting each year s outstanding debt balance mix. Selected Financial Ratios LTM 2018 FY 2017 % Net debt including effect of hedges (1)(3) 69,223 68, % Net debt including effect of hedges / Operating cash flow (1)(3) Operating cash flow/ Interest expense, net (1) Capitalization (2) 42.6% 39.3% (1) Net debt = total debt cash (2) Total debt / (long term debt + shareholders' equity) (3) After giving effect to cross currency swaps. Page 20
21 Mexico & Central America Division (Costa Rica, Guatemala, Mexico, Nicaragua, and Panama) Comparable (1) figures: Revenues: Comparable total revenues from our Mexico and Central America division increased 7.3% in the third quarter of 2018 as compared to the same period in 2017, driven by volume growth, coupled with pricing aligned with inflation, partially offset by a mix effect in Mexico and Central America. Transactions: Comparable transactions in our Mexico and Central America division increased 1.7% in the third quarter of Our sparkling beverage portfolio s transactions grew 0.6%, driven by a 1.2% increase in our colas portfolio. Our still beverage category s transactions increased 5.6% in the division, driven by 8.4% growth in Mexico, partially offset by a decline in Central America. Our water transactions, including bulk water, increased 8.1%, driven by 9.5% growth in Mexico. Volume: Total sales volume for the division increased 2.8% in the third quarter of 2018, compared to the same period of Additionally, excluding jug water, total sales volume increased 3.6%. Our sparkling beverage category s volume increased 2.7%, driven by a 3.3% increase in our colas portfolio. Performance in colas for the division was driven by growth in both Mexico and Central America. Our still beverage category s volume increased 10.6%, driven by 11.9% growth in Mexico and 3.6% growth in Central America. Our personal water portfolio s volume increased 8.2%, driven by 9.5% growth in Mexico, partially offset by a 4.1% decline in Central America. Our bulk water portfolio s volume declined 1.8% in the division due to a contraction in Mexico and Central America. Gross profit: Comparable gross profit grew 6.6% in the third quarter of 2018 as compared to the same period in Our pricing initiatives and declining sweetener costs were offset by higher PET prices, higher concentrate costs in Mexico, and the depreciation of the average exchange rates of the Mexican Peso, the Guatemalan Quetzal, and the Nicaraguan Cordoba as applied to U.S. dollardenominated raw material costs. Operating income: Comparable operating income in the division increased 3.9% in the third quarter of 2018 as compared to the same period in 2017, despite higher freight, marketing and maintenance expenses in Mexico; these factors were partially offset by a non cash operating foreign exchange gain in Mexico. Operating cash flow: Comparable operating cash flow increased 4.6% in the third quarter of 2018 as compared to the same period in As reported figures: Revenues: Reported total revenues increased 12.2% to Ps. 26,069 million in the third quarter of 2018 as compared to the same period of 2017, driven by the consolidation of recently acquired territories in Guatemala as of May 1, 2018, volume growth in Central America and Mexico, and pricing aligned with inflation in Mexico, partially offset by a mix effect in Mexico and Central America. Transactions: Reported total number of transactions increased 5.9% to 2,953.8 in the third quarter of 2018 as compared to the same period of Volume: Reported total sales volume increased 5.5% to million unit cases in the third quarter of 2018 as compared to the same period in Gross profit: Reported gross profit increased 11.2% to Ps. 12,566 million in the third quarter of 2018, and gross profit margin contracted 40 basis points to 48.2% during the period. Operating income: Reported operating income increased 5.9% to Ps. 3,750 million in the third quarter of 2018, and operating income margin contracted 80 basis points to 14.4% during the period. Operating cash flow: Reported operating cash flow increased 7.7% to Ps. 5,402 million in the third quarter of 2018, resulting in a margin contraction of 90 basis points to 20.7%. (1) Please refer to page 9 for our definition of comparable and a description of the factors affecting the comparability of our financial and operating performance. Page 21
22 South America Division (Argentina, Brazil, Colombia and Uruguay) Comparable (1) figures: Revenues: Comparable total revenues increased 5.1%, driven by volume growth in Brazil and Colombia, partially offset by unfavorable price mix effects. Transactions: Comparable transactions in the division increased 2.5% during the third quarter of Our sparkling beverage portfolio s transactions increased 2.3%, driven by 6.5% growth in colas, partially offset by a decline in our flavors portfolio. Our positive performance in colas was driven by growth in both Brazil and Colombia. Our still beverage category s transactions remained flat. Our water transactions, including bulk water, increased 6.7%. Volume: Comparable total sales volume in South America increased 1.8% during the third quarter of 2018 as compared to the same period of Excluding the bulk water category, total sales volume increased 2.3%. Our sparkling beverage category s volume increased 2.5%, driven by 6.8% growth in colas, partially offset by a decline in flavors. Colas positive performance was driven by growth in Brazil and Colombia. Our still beverage category s volume decreased 11.5%, driven by declines in Brazil and Colombia. Our personal water category s volume increased 18.5%, driven by growth in Brazil and Colombia. Our bulk water business s volume decreased 18.5%, driven by Colombia. Gross profit: Comparable gross profit increased 4.4% as a result of lower sweetener prices, a favorable currency hedging position in the division, and the appreciation of the Colombian Peso as applied to U.S. dollar denominated raw material costs. These factors were partially offset by higher PET prices in the division, an unfavorable raw material hedging position in Brazil, and the depreciation of the average exchange rate of the Brazilian Real as applied to our U.S. dollar denominated raw material costs. Operating income: Comparable operating income in the division increased 8.7% as compared to the same period in 2017, driven by operating expense efficiencies in Brazil and Colombia. Operating cash flow: Comparable operating cash flow increased 9.6% as compared to the same period of As reported figures: Revenues: Reported total revenues declined 14.8% to Ps. 18,079.2 million in the third quarter of 2018, driven mainly by an unfavorable currency translation effect resulting from the depreciation of the Brazilian Real as compared to the Mexican Peso, the reporting of Argentina as a hyperinflationary subsidiary, and the deconsolidation of Coca Cola FEMSA de Venezuela as of December 31, These factors were partially offset by volume growth in Brazil and Colombia, coupled with the consolidation of the recently acquired territory in Uruguay as of July 1, Transactions: Reported total number of transactions decreased 2.7% to 2,019.3 million in the third quarter of 2018 as compared to the same period in Volume: Reported total sales volume decreased 3.2% to million unit cases in the third quarter of 2018 as compared to the same period in Gross profit: Reported gross profit decreased 12.9% to Ps. 7,671.2 million in the third quarter of 2018, and gross profit margin expanded 90 basis points to 42.4%. Operating income: Reported operating income grew 12.6% to Ps. 2,028.0 million in the third quarter of 2018, resulting in a margin expansion of 270 basis points to 11.2%. Operating cash flow: Reported operating cash flow decreased 13.7% to Ps. 3,089.5 million in the third quarter of 2018, resulting in a margin expansion of 20 basis points to 17.1%. (1) Please refer to page 9 for our definition of comparable and a description of the factors affecting the comparability of our financial and operating performance. Page 22
23 YTD Consolidated Results Comparable (1) figures: Revenues: Comparable total revenues grew 5.2% in the first nine months of 2018 as compared to the same period of 2017, driven by average price per unit case growth aligned with inflation in Mexico, coupled with volume growth in Brazil, Colombia, Central America, and Mexico. Transactions: Comparable number of transactions increased 1.4%. Our sparkling beverage category remained flat, driven by 1.9% growth in our colas portfolio offset by a decline in flavors. Our positive performance in colas was driven by growth in Brazil, Central America, and Colombia. Our still beverage category increased 1.6%, driven mainly by the positive performance of Brazil and Mexico. Finally, our water category s transactions increased by 4.2%, driven by growth across most of our operations, partially offset by a decline in Central America. Volume: Comparable sales volume increased 1.4% in the first nine months of 2018 as compared to the same period in Additionally, excluding jug water volume, comparable sales volume increased 2.2%. Our sparkling beverage portfolio s volume increased 1.3%, driven mainly by 3.4% growth in our colas portfolio across all of our operations, partially offset by a decline in our flavors portfolio. Our still beverage category s volume increased 3.9%, driven by volume growth in Brazil, Central America, and Mexico, which offset negative performance in Colombia. Our personal water portfolio s volume grew 12.8% due to the positive performance of most of our operations. Finally, our bulk water portfolio s volume decreased 5.3%, driven by declines in Colombia and Mexico. Gross profit: Comparable gross profit grew 5.4%. Our pricing initiatives, coupled with lower sweetener prices in most of our operations, were partially offset by higher PET costs across most of our operations, higher concentrate costs in Mexico, and the depreciation in the average exchange rate of the Argentine Peso and the Brazilian Real as applied to our U.S. dollar denominated raw material costs. Operating Income: Comparable operating income remained flat for the first nine months of 2018 as compared to the same period of Operating cash flow: Comparable operating cash flow increased 3.8% in the first nine months of As reported figures: Revenues: Reported total revenues decreased 4.7% to Ps. 130,577 million in the first nine months of 2018, driven by the consolidation of recently acquired territories in Guatemala and Uruguay, volume growth in Brazil, Central America, Colombia, and Mexico, and price increases aligned with or above inflation in Argentina and Mexico. These factors were partially offset by the negative translation effect resulting from the depreciation of the Argentine Peso and the Brazilian Real as compared to the Mexican Peso, the deconsolidation of Coca Cola FEMSA de Venezuela as of December 31, 2017, and the reporting of Argentina as a hyperinflationary subsidiary as of July 1, Transactions: Reported total number of transactions increased 0.5% to 14,539.0 million in the first nine months of 2018 as compared to the same period in Volume: Reported total sales volume remained flat at 2,450.1 million unit cases for the first nine months of 2018 as compared to the same period in Gross profit: Reported gross profit decreased 2.1% to Ps. 60,150 million, and gross margin expanded 130 basis points to 46.1%. Equity method: The reported share of the profits of associates and joint ventures recorded a loss of Ps. 201 million in the first nine months of 2018, compared to a gain of Ps. 5 million recorded in the first nine months of This is due mainly to a loss in our dairy joint venture in Panama, partially offset by gains in our joint ventures in Brazil and in our Jugos del Valle joint venture in Mexico (Continued on next page) (1) Please refer to page 9 for our definition of comparable and a description of the factors affecting the comparability of our financial and operating performance. Page 23
2018 THIRD QUARTER AND FIRST NINE MONTHS RESULTS
 2018 THIRD QUARTER AND FIRST NINE MONTHS RESULTS Mexico City,, Coca-Cola FEMSA, S.A.B. de C.V. (BMV: KOFL, NYSE: KOF) ( Coca-Cola FEMSA, KOF or the Company ), the largest Coca-Cola franchise bottler in
FEMSA Announces Fourth Quarter and Full Year 2016 Results
 FEMSA Announces Fourth Quarter and Full Year 2016 Results Monterrey, Mexico, February 27, 2017 Fomento Económico Mexicano, S.A.B. de C.V. ( FEMSA ) (NYSE: FMX; BMV: FEMSAUBD) announced today its operational
FEMSA Announces Third Quarter 2016 Results
 FEMSA Announces Third Quarter 2016 Results Monterrey, Mexico, October 28, 2016 Fomento Económico Mexicano, S.A.B. de C.V. ( FEMSA ) (NYSE: FMX; BMV: FEMSAUBD) announced today its operational and financial
FEMSA Announces Third Quarter 2015 Results
 FEMSA Announces Third Quarter 2015 Results Monterrey, Mexico, October 28, 2015 Fomento Económico Mexicano, S.A.B. de C.V. ( FEMSA ) announced today its operational and financial results for the third quarter
FEMSA Achieves Double-Digit Revenue and Operating Income Growth Across Operations in 3Q11
 FEMSA Achieves Double-Digit Revenue and Operating Income Growth Across Operations in 3Q11 Monterrey, Mexico, October 28, 2011 Fomento Económico Mexicano, S.A.B. de C.V. ( FEMSA ) announced today its operational
FEMSA Announces First Quarter 2016 Results
 FEMSA Announces First Quarter 2016 Results Monterrey, Mexico, April 28, 2016 Fomento Económico Mexicano, S.A.B. de C.V. ( FEMSA ) announced today its operational and financial results for the first quarter
FEMSA Grows Operating Income High Single Digit in 2Q13
 FEMSA Grows Operating Income High Single Digit in 2Q13 Monterrey, Mexico, July 25, 2013 Fomento Económico Mexicano, S.A.B. de C.V. ( FEMSA ) announced today its operational and financial results for the
First Quarter 2009 Highlights:
 Latin America s Beverage Leader FEMSA Delivers Double-Digit Revenues and Operating Income Growth in 1Q09 Monterrey, Mexico, April 30, 2009 Fomento Económico Mexicano, S.A.B. de C.V. ( FEMSA ) announced
2017 FIRST QUARTER RESULTS
 2017 FIRST QUARTER RESULTS Mexico City,, Coca-Cola FEMSA, S.A.B. de C.V. (BMV: KOFL, NYSE: KOF) ( Coca-Cola FEMSA or the Company ), the largest franchise bottler in the world by sales volume, announces
Second Quarter 2009 Highlights:
 Latin America s Beverage Leader FEMSA Delivers Robust Revenues and Operating Income Growth in 2Q09 Monterrey, Mexico, July 28, 2009 Fomento Económico Mexicano, S.A.B. de C.V. ( FEMSA ) announced today
Fourth Quarter Highlights:
 Latin America s Beverage Leader FEMSA Reports Double-Digit Growth in 2006 Total Revenues increased 13.2% to US$ 11.6 billion for full year Monterrey, Mexico, Fomento Económico Mexicano, S.A.B. de C.V.
2014 SECOND - QUARTER AND FIRST SIX MONTHS RESULTS
 2014 SECOND - QUARTER AND FIRST SIX MONTHS RESULTS Second quarter 2014 2013 Reported Δ% YTD effects Δ% (5) 2014 2013 Reported Δ% effects Δ% (5) Stock Listing Information Total revenues 41,434 36,260 14.3%
Third Quarter 2008 Highlights:
 Latin America s Beverage Leader FEMSA Delivers 8.6% Operating Income Growth in 3Q08 Monterrey, Mexico, October 28, 2008 Fomento Económico Mexicano, S.A.B. de C.V. ( FEMSA ) today announced its operational
2015 THIRD - QUARTER AND FIRST NINE MONTHS RESULTS
 2015 THIRD - QUARTER AND FIRST NINE MONTHS RESULTS Mexico City, October 28, 2015, Coca-Cola FEMSA, S.A.B. de C.V. (BMV: KOFL, NYSE: KOF) ( Coca-Cola FEMSA or the Company ), the largest franchise bottler
2014 THIRD - QUARTER AND FIRST NINE MONTHS RESULTS
 2014 THIRD - QUARTER AND FIRST NINE MONTHS RESULTS Third Quarter 2014 2013 Reported Δ% YTD Effects Δ% (5) 2014 2013 Reported Δ% Effects Δ% (5) Stock Listing Information Total Revenues 41,781 37,494 11.4%
2012 SECOND-QUARTER AND FIRST SIX-MONTH RESULTS
 Stock Listing Information Mexican Stock Exchange Ticker: KOFL 2012 SECOND-QUARTER AND FIRST SIX-MONTH RESULTS NYSE (ADR) Ticker: KOF Second Quarter 2012 2011 Reported Δ% YTD Excluding M&A Effects Δ% (5)
2014 FOURTH - QUARTER AND FULL YEAR RESULTS
 2014 FOURTH - QUARTER AND FULL YEAR RESULTS Mexico City February 25, 2015, Coca-Cola FEMSA, S.A.B. de C.V. (BMV: KOFL, NYSE: KOF) ( Coca-Cola FEMSA or the Company ), the largest franchise bottler in the
2013 FOURTH - QUARTER AND FULL YEAR RESULTS
 2013 FOURTH - QUARTER AND FULL YEAR RESULTS Fourth Quarter 2013 2012 Reported Δ% Full Year Effects Δ% (5) 2013 2012 Reported Δ% Effects Δ% (5) Stock Listing Information Mexican Stock Exchange Ticker: KOFL
Investor Presentation. May 2016
 Investor Presentation May 2016 Safe Harbor Statement During this presentation management may discuss certain forward-looking statements concerning FEMSA s future performance that should be considered as
Safe Harbor Statement
 Investor Presentation May 2017 Safe Harbor Statement During this presentation management may discuss certain forward-looking statements concerning FEMSA s future performance that should be considered as
Financial Review 2009
 Financial Review 2009 T ABLE OF CONTENTS Financial Summary 38 Management s Discussion and Analysis 40 Audit Committee Annual Report 46 Independent Auditors Report 48 Consolidated Balance Sheets 49 Consolidated
Financial Review 2008
 Financial Review 2008 T a b l e o f Co n t e n t s Financial Summary 38 Management s Discussion and Analysis 40 Audit Committee Annual Report 46 Independent Auditors Report 48 Consolidated Balance Sheets
Consolidated Statements of Financial Position
 7 Consolidated Statements of Financial Position FOMENTO ECONÓMICO MEXICANO, S.A.B. DE C.V. AND SUBSIDIARIES MONTERREY, N.L., MEXICO As of December 31, 2015 and 2014. Amounts expressed in millions of U.S.
Business Highlights. Media Contact: Jaime Toussaint (52) Carolina Alvear (52)
 Carolina Alvear (52)") FEMSA reports solid operating results for the third quarter and first nine months of 2004 Monterrey, Mexico, October 27, 2004 Fomento Económico Mexicano, S.A. de C.V. ( FEMSA ) (NYSE: FMX; BMV: FEMSA UBD,
FEMSA reports solid operating results for the third quarter and first nine months of 2004 Monterrey, Mexico, October 27, 2004 Fomento Económico Mexicano, S.A. de C.V. ( FEMSA ) (NYSE: FMX; BMV: FEMSA UBD,
Safe harbor statement
 Safe harbor statement During this presentation management may discuss certain forwardlooking statements concerning FEMSA s future performance that should be considered as good faith estimates made by the
Consolidated Financial Statements
 creating stories 37 Consolidated Financial Statements Contents Financial Summary 38 Management s Discussion and Analysis 40 Audit Committee Annual Report 44 Independent Auditors Report 46 Consolidated
Safe harbor statement
 Safe harbor statement During this presentation management may discuss certain forwardlooking statements concerning FEMSA s future performance that should be considered as good faith estimates made by the
Consolidated Financial Statements
 femsa annual report 2014 39 Consolidated Financial Statements Contents Financial Summary 40 Management s Discussion and Analysis 42 Audit Committee Annual Report 46 Independent Auditors Report 48 Consolidated
Company Overview. August 2006
 Company Overview August 2006 Safe Harbor Statement During this presentation management may discuss certain forwardlooking statements concerning FEMSA s future performance that should be considered as good
FEMSA Releases Audited Financial Results for the Fourth Quarter and Twelve Months ended December 31, 1998
 FOR IMMEDIATE RELEASE FOR FURTHER INFORMATION: Laura E. Solano/María Elena Gutiérrez Investor Relations 011-528-328-6150/011-528-328-6245 e-mail: lsolmar@femsa.com.mx megutsan@femsa.com.mx Friday February
FEMSA REPORTS RECORD REVENUES IN 3 rd QUARTER WITH NET INCOME UP 18%
 FOR IMMEDIATE RELEASE CONTACTS: Juan Fonseca / (52) 81 83 28 62 45 / juan.fonseca@femsa.com.mx Alan Alanís / (52) 81 83 28 62 11 / alan.alanis@femsa.com.mx Emily Klingbeil / (52) 81 83 28 61 89 / emily.klingbeil@femsa.com.mx
Notes to the Consolidated Financial Statements
 Notes to the Consolidated Financial Statements As of December 31, 2013, 2012 and 2011. Amounts expressed in millions of U.S. dollars ($) and in millions of Mexican pesos (Ps.) 1. Activities of the Company
Information considers full-year of KOF s territories and eight months of Grupo Fomento Queretano, S.A.P.I. ( Grupo Fomento Queretano ) (3)
 (3)") financial summary Amounts expressed in millions of U.S. dollars ($) and in millions of Mexican pesos (Ps.), except data per share. U.S. ( * ) 2012 (2) 2011 (1) INCOME STATEMENT Total revenues $ 11,396
financial summary Amounts expressed in millions of U.S. dollars ($) and in millions of Mexican pesos (Ps.), except data per share. U.S. ( * ) 2012 (2) 2011 (1) INCOME STATEMENT Total revenues $ 11,396
Consolidated Financial Statements
 Consolidated Financial Statements 1 CONTENTS Annual Report of the Audit Committee...3 Independent Auditors Report... 6 Consolidated Statements of Financial Position... 11 Consolidated Income Statements...12
NET INCOME INCREASED 15% WITH EBITDA MARGIN GROWTH OF 70BPS IN 3Q13
 NET INCOME INCREASED 15% WITH EBITDA MARGIN GROWTH OF 70BPS IN 3Q13 Monterrey, Mexico, October 28, 2013 Arca Continental, S.A.B. de C.V. (BMV: AC*), the second-largest Coca-Cola bottler in Latin America
MEXICAN ECONOMIC DEVELOPMENT INC
 MEXICAN ECONOMIC DEVELOPMENT INC FORM 20-F (Annual and Transition Report (foreign private issuer)) Filed 6/28/2007 For Period Ending 12/31/2006 Address GENERAL ANAYA NO 601 PTE COLONIA BELLA VISTA MONTERREY,
COCA COLA FEMSA SAB DE CV (Filer) CIK:
 CIK:") COCA COLA FEMSA SAB DE CV (Filer) CIK: 0000910631 Print Document View Excel Document Cover Document and Entity Information Financial Statements Notes to Financial Statements Accounting Policies Notes Tables
COCA COLA FEMSA SAB DE CV (Filer) CIK: 0000910631 Print Document View Excel Document Cover Document and Entity Information Financial Statements Notes to Financial Statements Accounting Policies Notes Tables
ARCA CONTINENTAL REPORTS EBITDA GROWTH OF 5.3% WITH NET INCOME UP 23.3% OR 140 BPS IN 4Q14
 ARCA CONTINENTAL REPORTS EBITDA GROWTH OF 5.3% WITH NET INCOME UP 23.3% OR 140 BPS IN 4Q14 Monterrey, Mexico, February 18, 2015 Arca Continental, S.A.B. de C.V. (BMV: AC*) ( Arca Continental or AC ), the
Investor Relations. June, 2016
 Investor Relations June, 2016 Cautionary Statement FORWARD-LOOKING STATEMENTS This presentation contains forward-looking statements These forward-looking statements relate to Coca-Cola FEMSA, S.A.B. de
REVENUE GREW 14% WITH EBITDA UP 5.7% IN 2018
 REVENUE GREW 14% WITH EBITDA UP 5.7% IN 2018 Monterrey, Mexico, February 19, 2019 Arca Continental, S.A.B. de C.V. (BMV: AC*) ( Arca Continental or AC ), the second-largest Coca-Cola bottler in Latin America,
Company Overview 2008
 Company Overview 2008 Safe Harbor Statement During this presentation management may discuss certain forwardlooking statements concerning FEMSA s future performance that should be considered as good faith
Fomento Económico Mexicano, S.A.B. de C.V. U.S. $300,000, % Senior Notes due 2023 U.S. $700,000, % Senior Notes due 2043
 LISTING PARTICULARS Fomento Económico Mexicano, S.A.B. de C.V. U.S. $300,000,000 2.875% Senior Notes due 2023 U.S. $700,000,000 4.375% Senior Notes due 2043 References to the prospectus supplement or the
Contents % economic interest, representing 63% of shares with voting rights.
 ANNUAL REPORT 2017 Fomento Económico Mexicano, S.A.B. de C.V., or FEMSA, is a leading multinational company headquartered in Monterrey, Mexico, that participates in the beverage and retail industries.
FORM 20-F. Fomento Económico Mexicano, S.A.B. de C.V. (Exact name of registrant as specified in its charter)
") As filed with the Securities and Exchange Commission on April 16, 2014. UNITED STATES SECURITIES AND EXCHANGE COMMISSION Washington, D.C. 20549 FORM 20-F ANNUAL REPORT PURSUANT TO SECTION 13 OF THE SECURITIES
As filed with the Securities and Exchange Commission on April 16, 2014. UNITED STATES SECURITIES AND EXCHANGE COMMISSION Washington, D.C. 20549 FORM 20-F ANNUAL REPORT PURSUANT TO SECTION 13 OF THE SECURITIES
EBITDA GREW 6% TO REACH A 24% MARGIN IN 2Q14
 EBITDA GREW 6% TO REACH A 24% MARGIN IN 2Q14 Monterrey, Mexico, July 17, 2014 Arca Continental, S.A.B. de C.V. (BMV: AC*) ( Arca Continental or AC ), the second-largest Coca-Cola bottler in Latin America
UNITED STATES SECURITIES AND EXCHANGE COMMISSION WASHINGTON, D.C FORM 6-K
 UNITED STATES SECURITIES AND EXCHANGE COMMISSION WASHINGTON, D.C. 20549 FORM 6-K REPORT OF FOREIGN ISSUER PURSUANT TO RULE 13a-16 OR 15b-16 OF THE SECURITIES EXCHANGE ACT OF 1934 October 2015 Date of Report
five-year summary COCA-COLA FEMSA, S.A.B. DE C.V. AND SUBSIDIARIES
 financial section 31 Five-Year Summary 32 Management s Discussion and Analysis 34 Corporate Governance 34 Environmental Statement 34 Management s Responsibility for Internal Control 35 Audit Committee
ARCA CONTINENTAL REPORTS REVENUE GROWTH OF 22.5% WITH EBITDA UP 20.3% IN 2016
 ARCA CONTINENTAL REPORTS REVENUE GROWTH OF 22.5% WITH EBITDA UP 20.3% IN 2016 Monterrey, Mexico, February 24, 2017 Arca Continental, S.A.B. de C.V. (BMV: AC*) ( Arca Continental or AC ), the second-largest
EBITDA GREW 16.8% WITH NET INCOME UP 11.3% IN 1Q13
 EBITDA GREW 16.8% WITH NET INCOME UP 11.3% IN 1Q13 Monterrey, Mexico, April 26, 2013 Arca Continental, S.A.B. de C.V. (BMV: AC*), the secondlargest Coca-Cola bottler in Latin America and third largest
Embotelladora Andina announces Consolidated Results for the Third Quarter and Nine Months ended September 30, 2010
 www.embotelladoraandina.com For Immediate Distribution Contact in Santiago, Chile Embotelladora Andina Giuliana Gorrini, Head of Investor Relations (56-2) 338-0520 / ggorrini@koandina.com Contacts in New
COCA COLA FEMSA SAB DE CV
 COCA COLA FEMSA SAB DE CV FORM 20-F (Annual and Transition Report (foreign private issuer)) Filed 04/11/14 for the Period Ending 12/31/13 Telephone 525515195120 CIK 0000910631 Symbol KOF SIC Code 2086
THIRD-QUARTER 2007 RESULTS (Peso amounts are stated in millions in constant terms as of September 30, 2007)
") Rogelio Sánchez rsanchezm@gruma.com (52) 81 8399-3312 Lilia Gómez lgomez@gruma.com (52) 81 8399-3324 Monterrey, N.L. Mexico; October 24, 2007 www.gruma.com THIRD-QUARTER 2007 RESULTS (Peso amounts are
Rogelio Sánchez rsanchezm@gruma.com (52) 81 8399-3312 Lilia Gómez lgomez@gruma.com (52) 81 8399-3324 Monterrey, N.L. Mexico; October 24, 2007 www.gruma.com THIRD-QUARTER 2007 RESULTS (Peso amounts are
MEXICAN ECONOMIC DEVELOPMENT INC
 MEXICAN ECONOMIC DEVELOPMENT INC FORM 20-F (Annual and Transition Report (foreign private issuer)) Filed 4/8/2004 For Period Ending 12/31/2003 Address CUAUHTEMOC 400 SUR APERTADO POSTAL 2001 COLONIA VELLA
GRUPO BIMBO REPORTS THIRD QUARTER 2018 RESULTS MEXICO CITY, OCTOBER 24, 2018
 GRUPO BIMBO REPORTS THIRD QUARTER 2018 RESULTS MEXICO CITY, OCTOBER 24, 2018 We delivered strong third quarter results. We continue to transform our Company to be highly competitive, productive and sustainable
Accelerating towards excellence. Investor relations June 2017
 Accelerating towards excellence Investor relations June 2017 Cautionary Statement FORWARD-LOOKING STATEMENTS This presentation contains forward-looking statements These forward-looking statements relate
REVENUE GREW 46.4% WITH NET INCOME UP 44.9% IN 2017
 REVENUE GREW 46.4% WITH NET INCOME UP 44.9% IN 2017 Monterrey, Mexico, February 23, 2018 Arca Continental, S.A.B. de C.V. (BMV: AC*) ( Arca Continental or AC ), the second-largest Coca-Cola bottler in
ARCOS DORADOS REPORTS THIRD QUARTER 2016 FINANCIAL RESULTS
 FOR IMMEDIATE RELEASE ARCOS DORADOS REPORTS THIRD QUARTER 2016 FINANCIAL RESULTS Achieved as reported revenue and mid-teen comparable sales growth and delivered consolidated Adjusted EBITDA margin expansion
COCA COLA FEMSA SAB DE CV
 COCA COLA FEMSA SAB DE CV FORM 20-F (Annual and Transition Report (foreign private issuer)) Filed 03/15/13 for the Period Ending 12/31/12 Telephone 525515195120 CIK 0000910631 Symbol KOF SIC Code 2086
Nemak posts 19% EBITDA 1 growth in 3Q15
 Nemak posts 19% EBITDA 1 growth in 3Q15 Monterrey, Mexico. October 20, 2015. - Nemak, S.A.B. de C.V. ( Nemak ) (BMV: NEMAK), a leading provider of innovative light-weighting solutions for the global automotive
SECOND QUARTER 2015 RESULTS
 B SECOND QUARTER 2015 RESULTS MEXICO CITY, JULY 21, 2015 Grupo Bimbo S.A.B. de C.V. ( Grupo Bimbo or the Company ) (BMV: BIMBO) today reported results for the three months ended June 30, 2015.* HIGHLIGHTS
Nemak posts 1Q17 EBITDA 1 of US$190 million
 Nemak posts 1Q17 EBITDA 1 of US$190 million Monterrey, Mexico. April 24, 2017. - Nemak, S.A.B. de C.V. ( Nemak ) (BMV: NEMAK), a leading provider of innovative lightweighting solutions for the global automotive
Coca-Cola FEMSA presents 2011 Financial Information under International Financial Reporting Standards (IFRS)
") Stock Listing Information Mexican Stock Exchange Ticker: KOFL NYSE (ADR) Ticker: KOF Ratio of KOF L to KOF = 10:1 Coca-Cola FEMSA presents 2011 Financial Information under International Financial Reporting
Stock Listing Information Mexican Stock Exchange Ticker: KOFL NYSE (ADR) Ticker: KOF Ratio of KOF L to KOF = 10:1 Coca-Cola FEMSA presents 2011 Financial Information under International Financial Reporting
Corporate Presentation
 Corporate Presentation 1 Disclaimer During this presentation management may discuss certain forwardlooking statements concerning Arca Continental s future performance that should be considered as good-faith
Coca-Cola Andina announces Consolidated Results for the First Quarter of 2015
 April 29, 2015 Contacts in Santiago, Chile Andrés Wainer, Chief Financial Officer Paula Vicuña, Head of Investor Relations (56-2) 2338-0520 / paula.vicuna@koandina.com Coca-Cola Andina announces Consolidated
GRUPO BIMBO REPORTS FIRST NINE MONTHS 2017 RESULTS
 GRUPO BIMBO REPORTS FIRST NINE MONTHS 2017 RESULTS MEXICO CITY, OCTOBER 26, 2017 Grupo Bimbo, S.A.B. de C.V. ( Grupo Bimbo or the Company ) (BMV: BIMBO) today reported its results for the nine months ended
E A R N I N G S R E L E A S E P R E S E N T A T I O N 1 Q 1 6 A P R I L 27,
 E A R N I N G S R E L E A S E P R E S E N T A T I O N Q 6 A P R I L 27, 2 0 6 Q 6 H I G H L I G H T S Consolidated revenues total US$295.8 million, EBITDA US$40.4 million and Net Income attributable to
REVENUE GREW 7.0% WITH NET INCOME UP 30.6% IN 2Q18
 REVENUE GREW 7.0% WITH NET INCOME UP 30.6% IN 2Q18 Monterrey, Mexico, July 20, 2018 Arca Continental, S.A.B. de C.V. (BMV: AC*) ( Arca Continental or AC ), the second-largest Coca-Cola bottler in America,
Notes to the Consolidated Statements
 Notes to the Consolidated Statements For the years endend December 31, 2016, 2015 and 2014 Amounts expressed in millions of U.S. dollars ($) and in millions of Mexican pesos (Ps.) Note 1. Activities of
2017-4Q17 E A R N I N G S R E L E A S E
 E A R N I N G S R E L E A S E 2017-4Q17 January 01, 2017 December 31, 2017 SONDA S.A. and subsidiaries announce their consolidated financial results for the period from January 01 to December 31, 2017.
FINANCIAL SECTION. Coca-Cola FEMSA
 FINANCIAL SECTION INTEGRATED REPORT 2017 Coca-Cola FEMSA Annual report of the audit committee 2 Independent auditors report 4 Consolidated statements of financial position 8 Consolidated income statements
Let s give our soul, heart and being in everything we do. R.I.P. Don Lorenzo Servitje, founder of Grupo Bimbo
 GRUPO BIMBO REPORTS 2016 RESULTS MEXICO CITY, FEBRUARY 23, 2017 Grupo Bimbo, S.A.B. de C.V. ( Grupo Bimbo or the Company ) (BMV: BIMBO) today reported its results for the twelve months ended December 31,
GRUMA REPORTS FOURTH QUARTER 2017 RESULTS
 Investor Relations ir@gruma.com Tel: 52 (81) 8399-3349 www.gruma.com San Pedro Garza García, N.L., Mexico; February 21, 2018 GRUMA REPORTS FOURTH QUARTER 2017 RESULTS HIGHLIGHTS GRUMA s performance in
MEXICAN ECONOMIC DEVELOPMENT INC
 MEXICAN ECONOMIC DEVELOPMENT INC FORM 20-F (Annual and Transition Report (foreign private issuer)) Filed 04/21/17 for the Period Ending 12/31/16 Telephone 528183286167 CIK 0001061736 Symbol FMX SIC Code
12M11 4Q11. Earnings Release. Sonda S.A. SONDA S.A. 1
 12M11 4Q11 Earnings Release Sonda S.A. 1 EARNINGS RELEASE January 01, 2011 December 31, 2011 (Santiago Stock Exchange: SONDA), the leading Latin American owned private-sector IT Services provider, announces
GRUPO BIMBO REPORTS FIRST QUARTER 2018 RESULTS
 GRUPO BIMBO REPORTS FIRST QUARTER 2018 RESULTS MEXICO CITY, APRIL 26, 2018 Grupo Bimbo S.A.B. de C.V. ( Grupo Bimbo or the Company ) (BMV: BIMBO) today reported its results for the three months ended March
3Q08 EARNINGS RELEASE
 3Q08 EARNINGS RELEASE SONDA REPORTS A 26.9% EBITDA GROWTH IN 3Q08 Santiago, Chile, October 28, 2008 SONDA S.A. (Santiago Stock Exchange: SONDA), the leading Latin American owned private-sector IT Services
FORM 20-F. Coca-Cola FEMSA, S.A.B. de C.V.
 As filed with the Securities and Exchange Commission on April 15, 2015. UNITED STATES SECURITIES AND EXCHANGE COMMISSION Washington, D.C. 20549 FORM 20-F ANNUAL REPORT PURSUANT TO SECTION 13 OF THE SECURITIES
Ternium Announces Third Quarter and First Nine Months of 2018 Results
 Sebastián Martí Ternium - Investor Relations +1 (866) 890 0443 +54 (11) 4018 8389 www.ternium.com Ternium Announces Third Quarter and First Nine Months of 2018 Results Luxembourg, October 30, 2018 Ternium
MEXICAN ECONOMIC DEVELOPMENT INC
 MEXICAN ECONOMIC DEVELOPMENT INC FORM 20-F (Annual and Transition Report (foreign private issuer)) Filed 04/27/12 for the Period Ending 12/31/11 Telephone 528183286167 CIK 0001061736 Symbol FMX SIC Code
ARCOS DORADOS 3Q 2016 Conference Call Presentation November 2, 2016
 Agenda ARCOS DORADOS 3Q 2016 Conference Call Presentation November 2, 2016 Disclaimer This presentation contains forward-looking statements that represent our beliefs, projections and predictions about
FORM 20-F. Coca-Cola FEMSA, S.A.B. de C.V. (Exact name of registrant as specified in its charter)
") As filed with the Securities and Exchange Commission on April 15, 2016. UNITED STATES SECURITIES AND EXCHANGE COMMISSION Washington, D.C. 20549 FORM 20-F ANNUAL REPORT PURSUANT TO SECTION 13 OF THE SECURITIES
As filed with the Securities and Exchange Commission on April 15, 2016. UNITED STATES SECURITIES AND EXCHANGE COMMISSION Washington, D.C. 20549 FORM 20-F ANNUAL REPORT PURSUANT TO SECTION 13 OF THE SECURITIES
Key figures (US $ million)
") THIRD QUARTER 218 REPORT Sigma is a leading multinational food company that produces, markets and distributes quality branded foods, including packaged meats, cheese, yogurt and other refrigerated and
THIRD QUARTER 218 REPORT Sigma is a leading multinational food company that produces, markets and distributes quality branded foods, including packaged meats, cheese, yogurt and other refrigerated and
GRUPO BIMBO REPORTS 2017 RESULTS
 GRUPO BIMBO REPORTS 2017 RESULTS MEXICO CITY, FEBRUARY 22, 2018 Grupo Bimbo, S.A.B. de C.V. ( Grupo Bimbo or the Company ) (BMV: BIMBO) today reported its results for the twelve months ended December 31,
ARCOS DORADOS REPORTS THIRD QUARTER 2012 FINANCIAL RESULTS
 FOR IMMEDIATE RELEASE ARCOS DORADOS REPORTS THIRD QUARTER 2012 FINANCIAL RESULTS On track with restaurant opening plan and achieved double-digit organic revenue growth, despite impact of weak Brazilian
GRUPO BIMBO REPORTS FIRST HALF 2016 RESULTS
 GRUPO BIMBO REPORTS FIRST HALF 2016 RESULTS MEXICO CITY, JULY 26, 2016 Grupo Bimbo S.A.B. de C.V. ( Grupo Bimbo or the Company ) (BMV: BIMBO) today reported its results for the six months ended June 30,
GRUMA REPORTS FIRST QUARTER 2018 RESULTS
 Investor Relations ir@gruma.com Tel: 52 (81) 8399-3349 www.gruma.com San Pedro Garza García, N.L., Mexico; April 25, 2018 HIGHLIGHTS GRUMA REPORTS FIRST QUARTER 2018 RESULTS GRUMA s performance showed
Vitro Reports Second Quarter 2018 Results
 Vitro Reports Second Quarter 2018 Results 1.1% Year over Year increase in Sales; EBITDA Impacted by Carlisle s Float temporary shutdown San Pedro Garza García, Nuevo León, Mexico, 27 of July -, 2018 Vitro,
Corporate Presentation
 Corporate Presentation 2015 Presentation Disclaimer During this presentation management may discuss certain forward-looking statements concerning Arca Continental s future performance that should be considered
Fourth Quarter Results
 2013 Fourth Quarter Results Forward looking information This presentation contains certain forward-looking statements and information relating to CEMEX, S.A.B. de C.V. and its subsidiaries (collectively,
September 13 & 14 RESULTS 2 ND QUARTER 2016
 September 13 & 14 RESULTS 2 ND QUARTER 2016 Cencosud achieved an improvement on second quarter results despite a more challenging economic environment and deceleration in consumption in the region. This
ARCOS DORADOS REPORTS THIRD QUARTER 2017 FINANCIAL RESULTS
 FOR IMMEDIATE RELEASE ARCOS DORADOS REPORTS THIRD QUARTER 2017 FINANCIAL RESULTS Achieved strong comparable sales and Adjusted EBITDA growth. Positive volume trends continued across key markets. Improved
Selected financial information
 SECOND QUARTER 2018 REPORT Sigma is a leading multinational refrigerated food company that produces, markets and distributes quality branded foods, including packaged meats, cheese, yogurt and other refrigerated
UNITED STATES SECURITIES AND EXCHANGE COMMISSION WASHINGTON, D.C FORM 6-K
 UNITED STATES SECURITIES AND EXCHANGE COMMISSION WASHINGTON, D.C. 20549 FORM 6-K REPORT OF FOREIGN ISSUER PURSUANT TO RULE 13a-16 OR 15b-16 OF THE SECURITIES EXCHANGE ACT OF 1934 November 2018 Date of
Coca-Cola Femsa (KOF)
") July 28, 2004 KOF L / KOF Price: Mx / ADR Ps 22.70 US$ 19.70 Price Target Ps 30.00 Risk Level High 52 Week Range: Ps 28.65 to Ps 20.94 Shares Outstanding: 1.85 billion Market Capitalization: US$ 3.65 billion
July 28, 2004 KOF L / KOF Price: Mx / ADR Ps 22.70 US$ 19.70 Price Target Ps 30.00 Risk Level High 52 Week Range: Ps 28.65 to Ps 20.94 Shares Outstanding: 1.85 billion Market Capitalization: US$ 3.65 billion
3Q18 EARNINGS RELEASE. Earnings Release 3Q18 1 / 16
 EARNINGS RELEASE 3Q18 1 / 16 Monterrey, Mexico, October 25 th, 2018. Grupo Famsa, S.A.B. de C.V. (BMV: GFAMSA), a leading Mexican commercial conglomerate in the retail, consumer and savings sector, announced
ARCOS DORADOS REPORTS FOURTH QUARTER & FULL YEAR 2016 FINANCIAL RESULTS
 FOR IMMEDIATE RELEASE ARCOS DORADOS REPORTS FOURTH QUARTER & FULL YEAR 2016 FINANCIAL RESULTS Achieved full year Adjusted EBITDA margin expansion and strong Net Income growth. Announces new restaurant
ARCOS DORADOS REPORTS FOURTH QUARTER & FULL YEAR 2015 FINANCIAL RESULTS
 FOR IMMEDIATE RELEASE ARCOS DORADOS REPORTS FOURTH QUARTER & FULL YEAR 2015 FINANCIAL RESULTS Achieved double-digit consolidated comparable sales growth, with margin expansion in all divisions in the fourth
Nemak posts 13% EBITDA 1 growth in 4Q16
 Nemak posts 13% EBITDA 1 growth in 4Q16 Monterrey, Mexico. February 14, 2017. - Nemak, S.A.B. de C.V. ( Nemak ) (BMV: NEMAK), a leading provider of innovative lightweighting solutions for the global automotive
EARNINGS RELEASE 3Q17
 LOGISTICS INVESTMENT PLATFORM EARNINGS RELEASE 3Q17 1 Quarterly Results 3Q17 TRAXION S REVENUE AND EBITDA INCREASE 70% AND 56% DURING 3Q17 BOOSTED BY ACQUISITIONS CONSOLIDATION YTD 2017 REVENUE AND EBITDA
Nemak reports 3Q17 results
 Nemak reports 3Q17 results - Quarterly revenues and EBITDA of US$1.1 billion and US$153 million - Won new contracts worth US$570 million in annual revenues Monterrey, Mexico. October 16, 2017. - Nemak,