FY2018 2Q CONSOLIDATED BUSINESS RESULTS
|
|
|
- Hilary Carroll
- 5 years ago
- Views:
Transcription

1 FY218 2Q CONSOLIDATED BUSINESS RESULTS
2 FY218 2Q HIGHLIGHTS 1 Overview Gross Merchandise Value : 141,221 million yen ( + 18.%,Yoy) Operating Profit : 1,53 million yen ( ー 27.3%,Yoy) Gross ZOZOTOWN BUSINESS Merchandise Gross Merchandise Value : 136,719 million yen ( %,Yoy) Value Consignment Business : 129,12 million yen ( %,Yoy) Purchased Stock Business : 94 million yen ( + 2.7%,Yoy) ZOZOUSED Business : 7,612 million yen ( %,Yoy) Private Brand Business : 658 million yen Average Retail Price : 3,655 yen ( ー.2%,Yoy) Average Purchase Amount per Shipment : 7,777 yen ( ー 5.%,Yoy) *Average retail price and average purchase amount per shipment are averages calculated from combined results of the ZOZOTOWN business and the PB business. B to B Business : 3,843 million yen ( %,Yoy) Profitability Operating profit margin (to the total gross merchandise value) : 7.1% (11.6% for FY217 2Q) Factors improving profitability : Increase in GPM, Decrease in the commission regarding payment collection Factors worsening profitability : Increase in the rate of shipping cost due to the change of shipping charge from the carrier, Initiation of mass distribution of ZOZOSUIT, Increase in the rate of other expenses, Increase in the rate of payroll Topic Investment of a Singapore based sizing recommendation software development company Pixibo (August, 218) Start Today Research commenced collective research with Kyushu Institute of Technology (September, 218) Start Today Group changed its corporate name to ZOZO (October, 218) About Private brand ZOZO Number of selling items which started to offer during the Q2 Men s :11 items Women s:1 items Total:21 items

3
4 OVERVIEW OF THE FY218 2Q 3 (million ) Item FY217 2Q FY218 2Q YoY Change(%) Target Progress Rate(%) Gross Merchandise Value 119, , % 36, 39.2% Net sales 42,694 53, % 147, 36.6% Gross profit 39,378 48, % - - (%Gross Merchandise Value) 32.9% 34.7% 1.8% - - SG&A 25,547 38, % - - (%Gross Merchandise Value) 21.4% 27.6% 6.2% - - Operating profit 13,831 1, % 4, 25.1% (%Gross Merchandise Value) 11.6% 7.1% -4.5% 11.1% - Recurring profit 13,837 1,7-27.7% 4, 25.% Profit attributable to owners of parent 9,551 6, % 28, 22.5%
5 4 Item (million ) FY217 FY218 1Q 2Q 3Q 4Q 1Q 2Q Gross Merchandise Value 59,574 6,82 77,331 73,555 7,46 7,814 YoY (%) 4.9% 35.9% 25.5% 14.9% 18.2% 17.9% Net sales 21,451 21,242 28,22 27,517 26,552 27,212 SG&A 11,863 13,684 16,476 15,77 18,376 2,559 YoY (%) 35.% 48.3% 45.2% 16.3% 54.9% 5.2% (%Gross Merchandise Value) 19.9% 22.8% 21.3% 21.4% 26.1% 29.% Operating profit 7,981 5,85 9,72 9,118 5,874 4,178 YoY (%) 59.3% 4.9% 11.7% 3.4% -26.4% -28.6% (%Gross Merchandise Value) 13.4% 9.7% 12.6% 12.4% 8.3% 5.9%
6 5 Gross Merchandise Value increase effect +2.4 Improvement in gross profit margin +2.5 Increase in other revenue Decrease in the rate of commission regarding payment collection +.6 Change in the composition of settlement manners Increase in shipping cost -3.1 Change in shipping charge from the carrier Drop in purchase amount per shipment Increase in promotion expenses -3.1 Initiation of mass distribution of ZOZOSUIT PB-related advertisement Increase in the rate of payroll -1.1 Increase in the number of employees on consolidated basis Others -1.8 Operating Profit 13.8 Increase in expenses due to the increase in the number of logistics centers Operating Profit 1. (bn ) FY217 2Q FY218 2Q
7 6 (million ) FY217 (as of March 31, 218) FY218 2Q (as of September 3, 218) FY217 (as of March 31, 218) FY218 2Q (as of September 3, 218) Current assets 53,574 52,2 Current liabilities 27,243 49,921 Cash and deposits 24,571 19,188 short-term borrowing - 24, Merchandise inventory 2,194 3,177 Noncurrent liabilities 2,659 2,817 Noncurrent assets 17,138 17,993 Total liabilities 29,92 52,739 Tangible assets 5,668 4,856 Shareholders' equity 4,892 17,18 Intangible assets 3,222 3,317 Treasury stock - -24,412 Investments and other assets 8,247 9,819 Total net assets 4,81 17,256 Total assets 7,712 69,995 Total liabilities and net assets 7,712 69,995
8 CASH FLOWS 7 (million ) Item FY217 2Q FY218 2Q YoY Reasons for change Cash flows from operating activities 6,548 2,588-3,96 (FY218)Decrease in profit before income taxes Cash flows from investing activities -1,989-2, (FY218)Expenditure of purchase of investment securities Cash flows from financing activities -5,428-5, (FY218)Increase in short-term borrowings (FY218)Expenditure of purchase of treasury stock Cash and cash equivalents at the end of the year 21,263 19,188-2,75
9 8 7% ROE Net Profit Margin(to the Gross Merchandise Value) 1% 72.7% 6% 55.5% 57.4% 56.% 9% 5% 4% 3% 34.8% 6.2% 26.3% 3.4% 37.8% 4.4% 41.5% 5.% 6.8% 4.4% 7.% 7.5% 8.% 7.5% 7.8% 8% 7% 2% 1% 5.9% 5.1% 5.5% 5.8% 5.6% 6% % FY27 FY28 FY29 FY21 FY211 FY212 FY213 FY214 FY215 FY216 FY217 FY218(Plan) 5%
10 GROSS MERCHANDISE VALUE 9 Gross merchandise value of new shops opened in FY218 2Q ZOZOTOWN Business ( purchased stock & consignment sales ) : 1.6 billion (accounts for 1.2% of the total gross merchandise value) 4,5 4, ZOZOFURIMA BtoB Business Private Brand Business 3,5 ZOZOUSED 3, 2,5 2, 1,5 1, Purchased stock Consignment sales 11.8%.6% 8.5% 79.1% % 2.% 4.7% 79.9% % 3.4%.6% 82.2% % 8.3% 5.%.4% 86.2% % 2.9% 6.1%.1% 9.5% 27.5.% 2.8%.% 5.9%.1% 91.2% % 2.7%.5% 5.4%.1% 91.3% (bn ) FY212 FY213 FY214 FY215 FY216 FY217 FY218 2Q ZOZO FURIMA Business ended on June 3, 217.
11 GROSS MERCHANDISE VALUE(QUARTERLY) ZOZOFURIMA BtoB Business Private Brand Business ZOZOUSED Purchased stock Consignment sales.5% 4.% 6.2%.1% % 2.8% 5.8%.1% 91.% % 2.6% 6.7%.1% 9.2% 64..4% 2.7% 5.6%.1% 91.2% % 2.7% 5.5%.1% 91.6%.% 2.6% 5.4%.1% 91.9% 77.3.% 2.9% 6.2%.% 9.8% 73.5.% 2.9% 6.2%.1% 9.8% % 2.6%.%.8% 2.8% 5.1%.2%.1% 5.7%.1% 91.4% 91.2% YoY +17.9% % (bn ) FY216 1Q FY216 2Q FY216 3Q FY216 4Q FY217 1Q FY217 2Q FY217 3Q FY217 4Q FY218 1Q FY218 2Q ZOZO FURIMA Business ended on June 3, 217.
12 11 12, Others 11, Advertisement business 1, 9, 8, 7, 6, 5, 4, 3, 2, ZOZOFURIMA BtoB Business Private Brand Business ZOZOUSED Purchased stock Consignment sales 35,5 2,389 2, ,139 38,58 41,182 1,766 1,573 4,477 4,16 2,285 4,446 5, ,422 3, ,256 7, ,313 76,393 6,731 1,338 12, ,253 98,432 9,498 1,642 15, ,764 6, ,57 71, ,249 1, 2,968 25,324 29,725 (million ) FY212 FY213 FY214 FY215 FY216 FY217 FY218 2Q ZOZO FURIMA Business ended on June 3, 217.
13 12 35, 3, 25, 2, 15, 1, 15,386 Others Advertisement business ZOZOFURIMA BtoB Business Private Brand Business ZOZOUSED Purchased stock Consignment sales 1, , ,18 22,127 22,699 4,114 1, , ,697 1, , ,451 21,242 2,54 1, ,31 3, ,22 2, , ,163 2,957 2,942 3, , ,479 3,968 YoY +28.1% 27,517 26,552 27, ,539 18,976 19,272 15,951 16,848 15,716 15,832 5, 1,812 11,641 (million ) FY216 1Q FY216 2Q FY216 3Q FY216 4Q FY217 1Q FY217 2Q FY217 3Q FY217 4Q FY218 1Q FY218 2Q ZOZO FURIMA Business ended on June 3, 217.
14 13 45, Operating Profit 2.% 4, Operating Profit Margin (% Gross Merchandise Value) 35, 32, % 3, 25, 1.8% 11.7% 11.1% 26, % 12.1% 12.% 8.9% 2, 15, 1, 8,529 12,388 15,84 17,756 1,53 7.1% 8.% 4.% 5, (million ) FY212 FY213 FY214 FY215 FY216 FY217 FY218 2Q.%
15 14 (million ) item Amount FY217 2Q FY218 2Q YoY %Gross Merchandise Value Amount %Gross Merchandise Value %Gross Merchandise Value Payroll(*) 7, % 9,842 7.%.9% Increase decrease factors Employee 2, % 4,48 2.9%.5% Details are described in the next page Logistics-Related Expenses (Including Outsourcing) 4, % 5, %.4% Outsourcing Expenses (Excluding Logistics- Related Expenses) 2,19 1.7% 2,13 1.4% -.3% Increase in proportion of outsourced workers with higher unit price due to changes in logistics Centers / Increase in proportion in line with the drop in retail price / Shipping expenses between logistics centers Increase in operation expenses due to the increase in the number of logistics centers / Increase in expenses of trademarks registration (FY217 2Q) Outsourcing of development of ZOZOSUIT 1 and PB branding Shipping 5, % 9, % 2.3% change in shipping fees / Initiation of mass distribution of ZOZOSUIT Commission of Payment collection 3, % 4,18 2.9% -.4% Changes in the composition ratio of settlement manners Promotion related expenses 2,6 1.7% 5,56 3.9% 2.2% Advertising 739.6% 4,29 3.% 2.4% Reward points related expenses 1,32 1.1% 1,269.9% -.2% Initiation of mass distribution of ZOZOSUIT / Advertising expenses of PB business / Implementation of overseas campaign Rent expense 1, % 1, %.1% Depreciation 48.3% 624.4%.1% Amortization of goodwill 113.1% 238.2%.1% VASILY Inc. (Nov. 217~) and Colorcle Inc. (Feb. 218~) *Both subsidiaries have been merged to ZOZO TECHNOLOGIES Inc. from Apr. 218 Stock Compensation Expenses %.1% Others 2,72 2.3% 4, % 1.2% Details are described in the next page Total SG&A 25, % 38, % 6.2% *Payroll includes directors remuneration, employee salaries, bonus, legal welfare expenses, welfare expenses, retirement benefits cost, provision for employee bonus, expenses of company pension premium, subcontracting payroll, a portion of expenses at logistics centers operation. Employee includes directors and employees, Logistics-Related Expenses includes part-timers, dispatched workers(subcontracting payroll) and substantial personnel expenses within outsourcing commission of staff working for logistics operations.
16 15 Payroll (Employee): % towards gross merchandise value +.5% YoY Increase due to the increase in the number of employees on consolidated basis: 838 FY217 2Q end 1,31 at FY218 2Q end Actively hiring employees for PB business and engineer / Increase in the number of consolidated subsidiaries - PB Business: 19 at FY217 2Q end 79 at FY218 2Q end - Engineer: 133 at FY217 2Q end 225 at FY218 2Q end - Overseas subsidiaries: 28 at FY218 2Q end (included in the scope of consolidation from FY218 1Q) Increase in the amount of provision for reserve for bonuses and legal welfare expenses due to the change in bonus payment policy - FY217: bonuses based on monthly budget achievements - FY218: fix amount bonuses Others: % towards gross merchandise value +1.2% YoY Occurrence of one-time high expenses(impact to % towards gross merchandise value +.5%) Detail 1Q 2Q Expenses for ZOZOSUIT1 material disposal - Contingency fee for ZOZOSUIT improvement research Donation to affected area - All the expenses listed above are not expected to occur from 3Q onward. Increase in ordinary expenses(impact to % towards gross merchandise value +.4%) - Increase in the rate of supplies expenses due to the drop in retail price and purchase amount per shipment - Increase in communication expenses for the improvement of websites and services
17 16 15, 15.% 13, 11, 9, 11.9% 14.1% 12.6% 1.9% 8, % 9.7% 12.6% 12.4% 12.7% 9,72 9,118 8,934 8, % 11.% 7, 5, 3, 5,11 5,576 6,992 7,981 5,85 8.3% 7.% 5.9% YoY ー 28.6% 4,178 1, (million ) -1, FY216 1Q FY216 2Q FY216 3Q FY216 4Q FY217 1Q FY217 2Q FY217 3Q FY217 4Q FY218 1Q FY218 2Q 3.% -3, -5, -3,6-3,984-1.% Existing Business Excluding PB OP Private Business OPM (% Gross Merchandise Value) Existing Business Excluding PB OPM (% Gross Merchandise Value) OPM (% Gross Merchandise Value)
18 17 (QUARTERLY) 25, SG&A (Quarterly) Promotion related expenses(% Gross Merchandise Value) 2,559 2% 2, 18,376 16% 16,476 15,77 15, 13,561 13,684 12% 11,35 11,863 1, 8,788 9,228 8% 4.5% 4.7% 5, 3.2% 4% (million ) 1.9% 1.8% 2.3% 1.2% 2.% 1.5% 1.5% FY216 1Q FY216 2Q FY216 3Q FY216 4Q FY217 1Q FY217 2Q FY217 3Q FY217 4Q FY218 1Q FY218 2Q %
19 18 (million ) item Amount FY217 FY218 1Q 2Q 3Q 4Q 1Q 2Q %Gross Merchandise Value Amount %Gross Merchandise Value Amount %Gross Merchandise Value Amount %Gross Merchandise Value Amount %Gross Merchandise Value Amount %Gross Merchandise Value Payroll(*) 3, % 3, % 4,37 5.6% 4, % 4, % 5,17 7.1% Employee 1, % 1, % 1, % 1, % 1, % 2,6 2.9% Logistics-Related Expenses (Including Outsourcing) 2,11 3.5% 2, % 2, % 2, % 2,836 4.% 2, % Outsourcing Expenses (Excluding Logistics- Related Expenses) % 1, % 1,25 1.3% % % 1,17 1.4% Shipping 2, % 2, % 4, % 4, % 4, % 5,76 7.2% Commission of Payment collection 1, % 2,37 3.4% 2,42 3.1% 2, % 2,3 2.9% 2,77 2.9% Promotion related expenses % 1,16 1.9% 1, % % 2, % 3, % Advertising 345.6% 393.7% 529.7% 283.4% 1, % 2, % Reward points related expenses 554.9% % % 612.8% % 59.8% Rent expense % % % % % % Depreciation 197.3% 211.4% 278.4% 33.4% 29.4% 333.5% Amortization of goodwill 56.1% 56.1% 86.1% 113.2% 119.2% 119.2% Stock Compensation Expenses % Others 1, % 1, % 1, % 2,5 2.8% 2, % 2, % Total SG&A 11, % 13, % 16, % 15, % 18, % 2, % Payroll includes directors remuneration, employee salaries, bonus, legal welfare expenses, welfare expenses, retirement benefits cost, provision for employee bonus, expenses of company pension premium, subcontracting payroll, a portion of expenses at logistics centers operation. Employee includes directors and employees, Logistics-Related Expenses includes part-timers, dispatched workers(subcontracting payroll) and substantial personnel expenses within outsourcing commission of staff working for logistics operations.
20 19 Number of total buyers = Active members and guest buyers who made at least one purchase within a year Guest buyers = Total number of guest purchases within a year Active members = Members who have made at least one purchase within a year 8,, 7,, 6,, 5,, Guest buyers Active members 5,252,541 4,832,558 5,783,381 6,324,33 2,43,877 6,734,74 2,552,867 6,963,986 2,372,969 7,25,777 7,223,227 2,247,916 2,11,366 7,392,126 1,933,483 7,769,546 1,987,319 2,361,941 4,, 1,988,387 2,192,55 3,, 2,, 2,844,171 3,59,991 3,421,44 3,893,156 4,181,873 4,591,17 4,957,861 5,112,861 5,458,643 5,782,227 1,, (members) FY216 1Q FY216 2Q FY216 3Q FY216 4Q FY217 1Q FY217 2Q FY217 3Q FY217 4Q FY218 1Q FY218 2Q * Excluding the users only purchased the body measurement device ZOZOSUIT
21 NUMBER OF SHOPS ON ZOZOTOWN 2 1,2 1, 8 Purchased stock Consignment sales ,16 7 1,94 1, ,139 1, ,9 1,88 1,15 1,134 1,178 2 (shops) FY216 1Q FY216 2Q FY216 3Q FY216 4Q FY217 1Q FY217 2Q FY217 3Q FY217 4Q FY218 1Q FY218 2Q Private brand ZOZO is not included to the number of shops


22 21 Gender ratio Geographical distribution Age distribution Kyushu/Okinawa 8.9% Hokkaido 3.5% Tohoku 5.5% Chugoku/Shikoku 7.5% Kinki/Tokai 27.8% Kanto 41.1% (Tokyo 17.3%) Hokuriku/Koshinetsu 5.7%
23 22 5, 48, 48,644 48,556 48,275 46,417 47,119 Annual purchase amount Annual purchase pieces 47,661 46,818 46,77 46,87 46, , 44, 42, 4, 38, Due to the increase of light users , 9 34, 8 32, ( ) 3, FY216 1Q FY216 2Q FY216 3Q FY216 4Q FY217 1Q FY217 2Q FY217 3Q FY217 4Q FY218 1Q FY218 2Q * Excluding the users only purchased the body measurement device ZOZOSUIT (item) 7
24 ANNUAL PURCHASE AMOUNT AND PIECES PER EXISTING ACTIVE MEMBER 23 7, Existing active members:active members who have passed over 1 year since registration Annual purchase amount Annual purchase pieces 18 65, 6, 58,953 6,16 6,929 61,77 63, ,29 62,761 61, , , , , Increase in the proportion of short-term registered existing active members as the registered period gets longer, the annual purchase amount also becomes higher , 11 ( ) (Item) 4, 1 FY216 1Q FY216 2Q FY216 3Q FY216 4Q FY217 1Q FY217 2Q FY217 3Q FY217 4Q FY218 1Q FY218 2Q * Excluding the users only purchased the body measurement device ZOZOSUIT
25 24 1,, 9,, 8,, Shipment volume YoY comparison 8,33,595 8,293,761 8,425,33 8,865,33 14% 12% 7,, 6,931,318 7,148,647 6,787,599 1% 6,, 5,, 5,391,93 4,652,11 5,886,58 8% 4,, 54.7% 61.9% 6% 3,, 5.9% 42.3% 45.9% 32.6% 41.1% 4% 2,, 19.7% 24.1% 24.% 1,, 2% (shipment) FY216 1Q FY216 2Q FY216 3Q FY216 4Q FY217 1Q FY217 2Q FY217 3Q FY217 4Q FY218 1Q FY218 2Q % * Excluding the number of shipment of the body measurement device ZOZOSUIT only. * The number of shipment is the combined results of the ZOZOTOWN business and the PB business.
26 25 7, 6, Average retail price = Gross Merchandise Value / Number of pieces (ZOZOTOWN Business) Average retail price YoY comparison 25% 2% 5, 4, 4,468 3,855 5,236 4,474 4,99 3,664 4,858 4,23 3,953 3,655 15% 1% 5% % 3, 2, -11.4% -11.8% -9.1% -8.3% -5.% -7.2% -6.1% -3.6% -.2% -5% -1% -14.7% -15% 1, -2% ( ) FY216 1Q FY216 2Q FY216 3Q FY216 4Q FY217 1Q FY217 2Q FY217 3Q FY217 4Q FY218 1Q FY218 2Q * The numbers of average retail price are averages calculated from combined results of the ZOZOTOWN business and the PB business. -25%
27 26 14, Average purchase amount per shipment = Gross Merchandise Value / Number of shipments (ZOZOTOWN Business) Average purchase amount per shipment YoY comparison 25% 12, 1,143 15% 1, 8, 8,68 7,941 8,955 8,53 8, % 9,43 8,611 8,122 7,777 5% 6, -4.8% -2.5% -1.7% -3.8% -4.8% -5.% -5% 4, -9.6% -1.9% -14.4% -15% 2, ( ) FY216 1Q FY216 2Q FY216 3Q FY216 4Q FY217 1Q FY217 2Q FY217 3Q FY217 4Q FY218 1Q FY218 2Q -25% * The numbers of average purchase amount per shipment are averages calculated from combined results of the ZOZOTOWN business and the PB business.
28 27 1% PC Feature Phones Smart Phones 9% 8% 7% 69.9% 71.6% 75.2% 77.5% 79.4% 8.4% 82.1% 83.2% 84.2% 85.3% 6% 5% 4% 3% 29.7% 28.1% 24.6% 22.3% 2% 2.5% 19.5% 17.8% 16.7% 15.7% 14.7% 1% %.4%.3%.2%.2%.1%.1%.1%.1%.1%.% FY216 1Q FY216 2Q FY216 3Q FY216 4Q FY217 1Q FY217 2Q FY217 3Q FY217 4Q FY218 1Q FY218 2Q

29
30 FY FY218 Plan Growth Rate(%) Gross Merchandise Value 36. billion yen 33.1% Net Sales 147. billion yen 49.3% Operating Profit 4. billion yen 22.4% Operating Profit Margin ( to the Gross Merchandise Value) 11.1 % - Recurring Profit 4. billion yen 22.2% Profit attributable to owners of parent 28. billion yen 38.9% Earnings per share 91.4 yen - Estimated dividends per share (Plan) 36. yen -
31 FY218 TARGET BY BUSINESS SEGMENT 3 Target for Gross Merchandise Value Yoy ZOZO Group 36. billion yen +33.1% ZOZOTOWN Business 33. billion yen +25.5% Consignment Business 39. billion yen +25.2% ZOZOUSED 21. billion yen +31.7% Private Brand Business 2. billion yen - BtoB Business 1. billion yen +32.7% Target for Net Sales Yoy Advertisement Business 3. billion yen -
32 Gross Merchandise Value Gross merchandise value Operating profit margin(to the Gross merchandise value) 1.8% 1.4% 11.7% 11.1% 12.4% 12.1% 11.1% 12% % 9.6% 8.9% 36. 1% % % % 2% (bn ) FY29 FY21 FY211 FY212 FY213 FY214 FY215 FY216 FY217 FY218(Target) %
33 32 5, 4,5 Capital Investment Depreciation Cost Amortization of Goodwill 4,565 4,1 4, 3,5 3, 2,5 2,162 2, 48 1,5 1, 5 (million ) , FY21 FY211 FY212 FY213 FY ,174 1, FY215 FY216 FY217 FY218 (Plan) 1,8
34 33 5 Dividends per share 5% 45 4 Payout ratio 35.6% 4.3% 34.3% 4.6% 41.8% 41.5% 44.8% 4.1% % 4% 35 35% % % 24.1% 24.9% 24.8% % ( ) FY27 FY28 FY29 FY21 FY211 FY212 FY213 FY214 FY215 FY216 FY217 FY218(Plan) 2% 15% 1% 5% %

35
36 MEDIUM-TERM VISION Medium-term Gross Merchandise Value FY22 Gross Merchandise Value 715 billion Operating profit 9 billion (bn ) FY29 FY21 FY211 FY212 FY213 FY214 FY215 FY216 FY217 FY218(Target) FY219(Target) FY22(Target)
37 DETAIL OF MEDIUM-TERM VISION 36 (bn ) FY218 FY219 FY22 Target Yoy Target Yoy Target Yoy Gross Merchandise Value % % % ZOZOTOWN Business % % % Private Brand Business 2. ー 8. 3.% % From Domestic 18. ー % % From Overseas 2. ー 2. 9.% 8. 3.% BtoB Business % 2. 1.% 3. 5.% Net Sales % % % Advertisement Business 3. ー % 1. 1.% Operating Profit % % % (% GMV) 11.1% -1.% 11.4%.3% 12.6% 1.2%
38
39 38 6,957 1, ,431 名 776


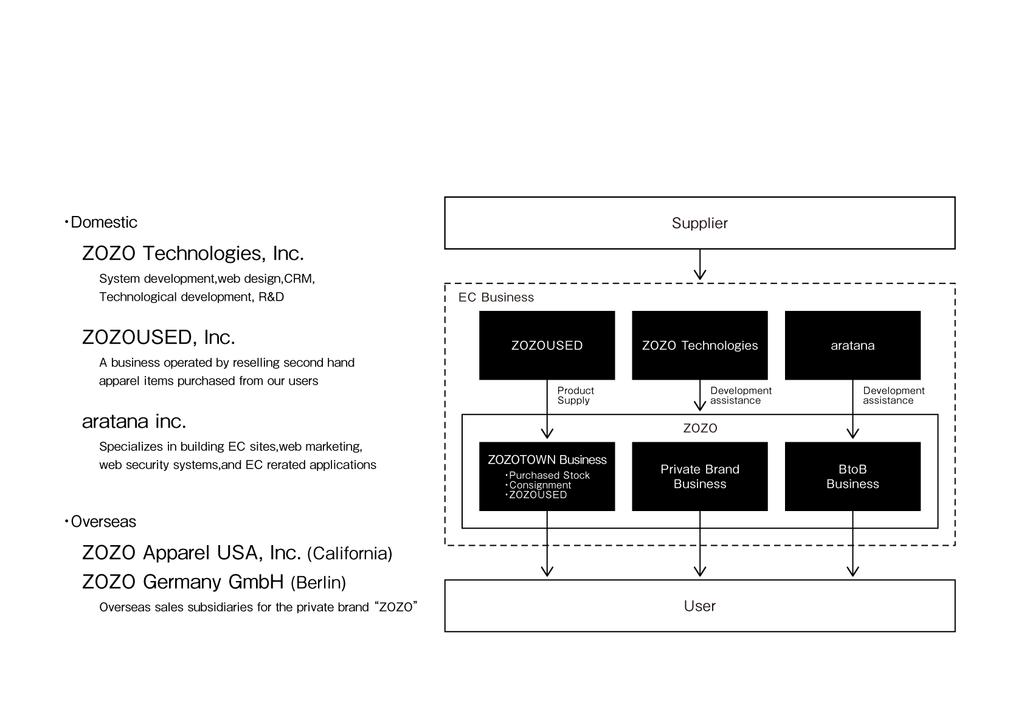
40 39 ZOZOTOWN Japan s Largest Online Retailer of Apparel and Accessories 1,183 stores offering 6,957 brands. At any given time, more than 65, items are available with an average of 3,1 new items added each day. Systems, design, to fulfillment, all functions are built in house. WEAR Japan s largest fashion coordination app When uploading coordinate pics, tag each item worn in the look, using information on our data base. The systems allows anyone to search for coordinates and items by various queries. Official users who we call WEARISTAs, include popular models, singers, actors and actresses. Over 12. million DL Now available in all geographic areas. Private Brand ZOZO Sales and manufacture of made-to-order basic items fitting every body uniquely and perfectly, from measurement data extracted from the body measurement device the company developed ZOZOSUIT. Offering U-neck/V-neck T-shirt, denim pants, Oxford shirt, business suit, dress shirt etc. Sold at ZOZOTOWN and dedicated sales sites for overseas.
41 4
42 MAJOR SERVICES 41 ZOZOTOWN Business Consignment Sales We operate 1,178 shops as consignment sales businesses. This business model allows us to carry a certain amount of products from the brands, while giving us low inventory risk. Sales = Gross merchandise value of each store x commission rate Purchased Stock We operate 5 stores within ZOZOTOWN, which offer products we purchase from brands. Sales = Gross merchandise value generated by each store ZOZOUSED Business We purchase used fashion products from our users, and resell them as a second-hand business. Sales = Gross merchandise value of purchase stock + Consignment commission of marketplace Private Brand Business The business model which manufacture and sell order-made basic items with best fit for each customer, by utilizing the data measured by the body measurement suit ZOZOSUIT developed by Start Today. Items are sold at the private brand shop on ZOZOTOWN in Japan, and will be sold at dedicated sales websites at overseas. Sales = Gross merchandise value of private brand items BtoB Business We help develop and operate online shops on behalf of various brands, such as United Arrows. We currently provide back-end service to 12 stores. Sales = Gross merchandise value of these online shops x commission rate Above sales includes other sales such as initial shop opening commission, shipping income etc. Advertisement Business Advertisement business will gain advertisement income from client companies including brands by providing advertisement spots utilizing the user base of ZOZOTOWN and WEAR. Sales = Advertisement income
43 This material has been created for the sole purpose of introducing the company s business activities, and not for soliciting investments. The business forecasts and the future outlook described in the material is based on information currently available. The forecast includes uncertainties such as sudden changes, therefore actual results may differ.
Profitability. Topics
 1 Overview Total Transaction Value:129.0 billion yen(+12.5%, Yoy)Operating Profit: 15.0 billion yen(+21.8%, Yoy) We have achieved : 97% for Total Transaction Value, 110% for Operating Profit, of our original
Overview Total transaction value : 92.1billion yen (+ 13.5% /Yoy)
") 1 Overview Total transaction value : 92.1billion yen (+ 13.5% /Yoy) Operating Profit : 10.6 billion yen (+23.3% /Yoy). For Operating Profit, we have over achieved our corporate plan (not disclosed). Total
1 Overview Total transaction value : 92.1billion yen (+ 13.5% /Yoy) Operating Profit : 10.6 billion yen (+23.3% /Yoy). For Operating Profit, we have over achieved our corporate plan (not disclosed). Total
Overview Total Transaction Value:67,414 million yen(+20.2%, Yoy)Operating Profit: 7,009million yen(+16.0%, Yoy) Steady growth. Total Transaction Value
Operating Profit: 7,009million yen(+16.0%, Yoy) Steady growth. Total Transaction Value") Overview Total Transaction Value:67,414 million yen(+20.2%, Yoy)Operating Profit: 7,009million yen(+16.0%, Yoy) Steady growth Total Transaction Value ZOZOTOWN Business Total Transaction Value 59,785 million
Overview Total Transaction Value:67,414 million yen(+20.2%, Yoy)Operating Profit: 7,009million yen(+16.0%, Yoy) Steady growth Total Transaction Value ZOZOTOWN Business Total Transaction Value 59,785 million
(million) Item FY2014 2Q FY2013 2Q YoY Change(%) Target. Transaction value 56,073 49, % 132, %
 Item FY2014 2Q FY2013 2Q YoY Change(%) Target. Transaction value 56,073 49, % 132, %") 1 Overview Total transaction value : 56.0billion yen (+ 13.1% increase / Yoy) Operating Profit 6.0 billion (+11.1% increase / Yoy). For Operating Profit, we have over achieved our corporate plan (not disclosed).
1 Overview Total transaction value : 56.0billion yen (+ 13.1% increase / Yoy) Operating Profit 6.0 billion (+11.1% increase / Yoy). For Operating Profit, we have over achieved our corporate plan (not disclosed).
Consolidated Business Results
 FY2013 April 1, 2013 December 31, 2013 Consolidated Business Results 2014.1.31 01 FY2013 3Q Highlights Overview for the consolidated business result Total Transaction value:81.1billion yen (+19.2% increase
Details of financial results of FY2017 are as follows.
 Details of financial results of are as follows. (Unit: million yen) FY2016 YoY Against Guidance Total Transaction Value 212,090 (100.0%) 270,543 (100.0%) 27.6% 0.2% Net Sales 76,393 (36.0%) 98,432 (36.4%)
Consolidated Financial Results For the Second Quarter Ended September 30, 2018 [JGAAP]
![Consolidated Financial Results For the Second Quarter Ended September 30, 2018 [JGAAP]](/thumbs/94/121027936.jpg "Consolidated Financial Results For the Second Quarter Ended September 30, 2018 [JGAAP]") DISCLAIMER This document is summary translation of Japanese version and is to be used solely as a reference. In the event of any discrepancy, errors and/or omissions, the Japanese version shall prevail.
DISCLAIMER This document is summary translation of Japanese version and is to be used solely as a reference. In the event of any discrepancy, errors and/or omissions, the Japanese version shall prevail.
MARUI GROUP CO., LTD. Financial Results Briefing for Fiscal 2014
 MARUI GROUP CO., LTD. Financial Results Briefing for Fiscal 2014 May 14, 2015 Today s Agenda 1. Overview of Performance in Fiscal 2014 2. Progress of Medium-Term Management Plan and Future Initiatives
Q3 Results for FY 2018 Earnings Results July 1, March 31, 2018
 Don Quijote Holdings. Co., Ltd. Q3 Results for FY 2018 Earnings Results July 1, 2017 - March 31, 2018 May 8,2018 0 Earnings summary 9 months to Mar. 2018 9 months to Mar. 2017 (Millions of yen) Actual
Q3 Results for FY 2017 Earnings Results July 1, March 31, 2017
 Don Quijote Holdings. Co., Ltd. Q3 Results for FY 2017 Earnings Results July 1, 2016 - March 31, 2017 May 8,2017 0 Earnings summary 9 months to Mar. 2017 9 months to Mar. 2016 (Millions of yen) Actual
Net sales Operating profit Ordinary profit Profit
 Summary of Non-consolidated Financial Results for the Fiscal Year Ended March 31, 2018 [Japanese GAAP] May 1, 2018 Company name: CONEXIO Corporation Stock exchange listing: Tokyo Stock Exchange, First
Summary of Consolidated Financial Results for the First Half Ended September 30, 2008
 Head Office : 8-1 Nihonbashi Odenmacho, Chuo-ku, Tokyo, Japan Code No. : 7537 (URL http://www.marubun.co.jp) Contact : Corporate Planning Dept., Phone +81-3-3639-3010, Fax +81-3-5644-7693 November 7, 2008
Don Quijote Holdings Co., Ltd. Results for FY 2018
 Don Quijote Holdings Co., Ltd. Results for FY 2018 Earnings Results July 1, 2017 - June 30, 2018 August 10, 2018 Earnings summary 12 months to June 2018 12 months to June 2017 Actual Share YoY Actual Share
Results for FY 2016 Earnings Results July 1, June 30, 2016
 Don Quijote Holdings. Co., Ltd. Results for FY 2016 Earnings Results July 1, 2015 - June 30, 2016 August 17, 2016 0 Earnings summary 12 months to Jun. 2016 12 months to Jun. 2015 Actual Share YoY Actual
1H Results for FY 2016 Earnings Results July 1 - December 31, 2015
 Don Quijote Holdings. Co., Ltd. 1H Results for FY 2016 Earnings Results July 1 - December 31, 2015 February 5,2016 0 Earnings summary 6 months to Dec. 2015 6 months to Dec. 2014 Actual Share YoY Actual
2: The supplied housing business contributed to earnings. The Company s sound supplied stocks bolstered its performance.
 Sekisui House, Ltd. Third Quarter of (February 1, through October 31, ) Summary of Consolidated Financial Results 1. Topics in the Third Quarter 2. Overview 3. Segment Information 1. Sales and Orders 2.
million yen % (39.5) 10.2 million yen 8,855 8,654
 10.2 million yen 8,855 8,654") Fiscal Year Ended December 2007 Financial Results (Non-consolidated) February 18, 2008 Corporate Name: AIRTECH JAPAN, LTD. Stock Exchange Listing: Tokyo Stock Exchange Stock Code: 6291 URL: http://www.airtech.co.jp
Fiscal Year Ended December 2007 Financial Results (Non-consolidated) February 18, 2008 Corporate Name: AIRTECH JAPAN, LTD. Stock Exchange Listing: Tokyo Stock Exchange Stock Code: 6291 URL: http://www.airtech.co.jp
Q1 Results for FY 2018 Earnings Results July 1, September 30, 2017
 Don Quijote Holdings. Co., Ltd. Q1 Results for FY 2018 Earnings Results July 1, - September 30, November 6, 0 Earnings summary 3 months to Sep. 3 months to Sep. 2016 (Millions of yen) Actual Share YoY
Don Quijote Holdings Co., Ltd. Q1 Results for FY 2019
 Don Quijote Holdings Co., Ltd. Q1 Results for FY 2019 Earnings Results July 1, 2018 - September 30, 2018 November 6, 2018 Earnings summary for Q1 3 months to September 2018 3 months to September 2017 Actual
Q1 Results for FY 2016 Earnings Results July 1 - September 30, 2015
 Don Quijote Holdings. Co., Ltd. Q1 Results for FY 2016 Earnings Results July 1 - September 30, 2015 November 5,2015 0 Earnings summary 3 months to Sep. 2015 3 months to Sep. 2014 Actual Share YoY Actual
Net sales Operating income Ordinary income EBITDA. 7,727 million yen (72.9%) 11,559 million yen (35.5%)
 11,559 million yen (35.5%)") Summary of Consolidated Financial Results for the Six-month Period Ended September 30, 2018 (Japanese accounting standards) Released October 30, 2018 Name of listed firm: Nojima Corporation Listed on the
Summary of Consolidated Financial Results for the Six-month Period Ended September 30, 2018 (Japanese accounting standards) Released October 30, 2018 Name of listed firm: Nojima Corporation Listed on the
Summary of Financial Conditions and Business Results for the Quarter Ended December 31, 2007* (Consolidated)
") February 12, 2008 Summary of Financial Conditions and Business Results for the Quarter Ended December 31, 2007* (Consolidated) Corporate Name: UNITED ARROWS LTD. Code Number: 7606 URL: Securities Traded:
February 12, 2008 Summary of Financial Conditions and Business Results for the Quarter Ended December 31, 2007* (Consolidated) Corporate Name: UNITED ARROWS LTD. Code Number: 7606 URL: Securities Traded:
Taiheiyo Cement Corporation
 Taiheiyo Cement Corporation Reference Materials of Financial Results for Fiscal 2018 (the Year Ended March 31, 2018) Contents Trend in Construction Investments and Domestic Demand of Cement Page 1 Volume
Net sales Operating profit Ordinary profit
 Consolidated Financial Statements Summary May 8, 2018 (For the year ended March 31, 2018) English translation from the original Japanese-language document (All financial information has been prepared in
Net sales Operating income Ordinary income EBITDA. 2,679 million yen (22.3%) 4,894 million yen (16.1%) June 30, 2017:
 4,894 million yen (16.1%) June 30, 2017:") Summary of Consolidated Financial Results for the Three-month Period Ended June 30, 2018 (Japanese accounting standards) Released August 7, 2018 Name of listed firm: Nojima Corporation Listed on the Tokyo
Summary of Consolidated Financial Results for the Three-month Period Ended June 30, 2018 (Japanese accounting standards) Released August 7, 2018 Name of listed firm: Nojima Corporation Listed on the Tokyo
Q1 Results for FY 2017 Earnings Results July 1, September 30, 2016
 Don Quijote Holdings. Co., Ltd. Q1 Results for FY 2017 Earnings Results July 1, 2016 - September 30, 2016 November 4, 2016 0 Earnings summary 3 months to Sep. 2016 3 months to Sep. 2015 (Millions of yen)
FY2016 1Q Topics. Future forecasts We will strive to set record highs in revenue and operating income for the fourth consecutive year.
 Topics Business performance Revenue and operating income for set new record highs Revenue: 61 billion (+110.3% YOY) Operating income: 8.5 billion (+211.7% YOY) Profit attributable to owners of parent 5.3
Summary of Financial Results for the First Three Quarters of Fiscal Year ending March 31, 2010 February 3, 2010
 Summary of Financial Results for the First Three Quarters of Fiscal Year ending March 31, 2010 February 3, 2010 Listed Company Name: Listing Exchanges: Tokyo Stock Exchange Securities Code: 9749 URL: http://www.fsi.co.jp
attributable to Sales revenue Profit before tax Net profit shareholders of income Cookpad Inc. Fiscal year ended million yen %
 This is a translation of the original Japanese document. If there are any discrepancies between this and the original, the original Japanese document prevails. Cookpad Inc. Consolidated Earnings Results
Consolidated Financial Results for the Second Quarter of the Fiscal Year Ending May 15, 2019 [J-GAAP]
![Consolidated Financial Results for the Second Quarter of the Fiscal Year Ending May 15, 2019 [J-GAAP]](/thumbs/93/111571475.jpg "Consolidated Financial Results for the Second Quarter of the Fiscal Year Ending May 15, 2019 [J-GAAP]") Consolidated Financial Results for the Second Quarter of the Fiscal Year Ending May 15, 2019 [J-GAAP] December 18, 2018 Name of listed company: TSURUHA Holdings, Inc. Listed on: Tokyo Stock Exchange, 1st
Consolidated Financial Results for the Second Quarter of the Fiscal Year Ending May 15, 2019 [J-GAAP] December 18, 2018 Name of listed company: TSURUHA Holdings, Inc. Listed on: Tokyo Stock Exchange, 1st
Non-consolidated Financial Report for Year Ending March 31, 2006
 May 17, 2006 Non-consolidated Financial Report for Year Ending March 31, 2006 Listed company name: Ariake Japan Co., Ltd. Code No.: 2815 Listing Exchanges: Tokyo, 1st Section, Head office: 3-2-17 Ebisu-Minami,
Q3 Results for FY 2016 Earnings Results July 1, March 31, 2016
 Don Quijote Holdings. Co., Ltd. Q3 Results for FY 2016 Earnings Results July 1, 2015 - March 31, 2016 May 9,2016 0 Earnings summary 9 months to Mar. 2016 9 months to Mar. 2015 (Millions of yen) Actual
1H Results for FY 2018 Earnings Results July 1, December 31, 2017
 Don Quijote Holdings. Co., Ltd. 1H Results for FY 2018 Earnings Results July 1, 2017 - December 31, 2017 February 6, 2018 0 Earnings summary 6 months to Dec. 2017 6 months to Dec. 2016 Actual Share YoY
FY2011 Consolidated Financial Results (Japan GAAP)
") Consolidated Financial Results (Japan GAAP) (April 1, 2010 through March 31, 2011) English Translation of the Original Japanese-Language Document May 11, 2011 Company name : ISUZU MOTORS LIMITED Stock
Consolidated Financial Results (Japan GAAP) (April 1, 2010 through March 31, 2011) English Translation of the Original Japanese-Language Document May 11, 2011 Company name : ISUZU MOTORS LIMITED Stock
Sales Operating profit Ordinary income. Nine months ended Dec. 31, Nine months ended Dec. 31,
 February 5, 2016 Summary of Consolidated Financial Results for the Third Quarter of the Fiscal Year Ending March 31, 2016 (Nine Months Ended December 31, 2015) [Japanese GAAP] Company name: AOKI Holdings
Consolidated Financial Results for the Second Quarter of the Fiscal Year Ending May 15, 2018 [J-GAAP]
![Consolidated Financial Results for the Second Quarter of the Fiscal Year Ending May 15, 2018 [J-GAAP]](/thumbs/73/68519869.jpg "Consolidated Financial Results for the Second Quarter of the Fiscal Year Ending May 15, 2018 [J-GAAP]") Consolidated Financial Results for the Second Quarter of the Fiscal Year Ending May 15, 2018 [J-GAAP] December 19, 2017 Name of listed company: TSURUHA Holdings, Inc. Listed on: Tokyo Stock Exchange, 1st
Consolidated Financial Results for the Second Quarter of the Fiscal Year Ending May 15, 2018 [J-GAAP] December 19, 2017 Name of listed company: TSURUHA Holdings, Inc. Listed on: Tokyo Stock Exchange, 1st
Million yen 14,872 13,119. Net income E.P.S. Diluted E.P.S. Million yen. Yen. Yen 10, ,
 Consolidated Financial Statements Summary February 6, 2007 (For FY 2007 3rd Quarter ended December 31, 2006) English translation from the original Japaneselanguage document (All financial information has
FACTBOOK. ABC-MART, INC. For the fiscal year ended February 28, Contents. Securities Code: 2670 / TSE 1st Section
 FACTBOOK ABC-MART, INC. For the fiscal year ended February 28, 217 Contents Corporate Profile 1-4 Consolidated Balance Sheet 5-6 Consolidated Statement of Income 7-8 Consolidated Statement of Cash Flows
Net sales Operating profit Ordinary profit. Million yen Million yen Million yen Million yen Six months ended
 Consolidated Financial Statements Summary November 6, 2018 (For the six months ended ) English translation from the original Japanese-language document (All financial information has been prepared in accordance
Consolidated Financial Results for the First Quarter of the Fiscal Year Ending May 15, 2019 [J-GAAP]
![Consolidated Financial Results for the First Quarter of the Fiscal Year Ending May 15, 2019 [J-GAAP]](/thumbs/93/111998227.jpg "Consolidated Financial Results for the First Quarter of the Fiscal Year Ending May 15, 2019 [J-GAAP]") Consolidated Financial Results for the First Quarter of the Fiscal Year Ending May 15, 2019 [J-GAAP] September 18, 2018 Name of listed company: TSURUHA Holdings, Inc. Listed on: Tokyo Stock Exchange, 1st
Consolidated Financial Results for the First Quarter of the Fiscal Year Ending May 15, 2019 [J-GAAP] September 18, 2018 Name of listed company: TSURUHA Holdings, Inc. Listed on: Tokyo Stock Exchange, 1st
Note: The original disclosure in Japanese was released on May 10, 2018 at 14:15 (GMT +9).
.") May 10, 2018 Summary of Consolidated Financial Results for the Fiscal Year Ended March 31, 2018 [Japanese GAAP] Company name: AOKI Holdings Inc. Listings: TSE First Section Stock code: 8214 URL: http://www.aoki-hd.co.jp/
May 10, 2018 Summary of Consolidated Financial Results for the Fiscal Year Ended March 31, 2018 [Japanese GAAP] Company name: AOKI Holdings Inc. Listings: TSE First Section Stock code: 8214 URL: http://www.aoki-hd.co.jp/
FamilyMart UNY Holdings Co., Ltd. Fiscal 2016 Financial Review
 FamilyMart UNY Holdings Co., Ltd. Fiscal 2016 Financial Review April 2017 Cautionary Statement: This report contains forward-looking statements, including the Company s strategies, future business plans,
Financial Results for FY2010 (April 1, 2009 through March 31, 2010) English Translation of the Original Japanese-Language Document May 11, 2010
 English Translation of the Original Japanese-Language Document May 11, 2010") Financial Results for (April 1, 2009 through March 31, 2010) English Translation of the Original Japanese-Language Document May 11, 2010 Company name : ISUZU MOTORS LIMITED Stock exchange on which the
Financial Results for (April 1, 2009 through March 31, 2010) English Translation of the Original Japanese-Language Document May 11, 2010 Company name : ISUZU MOTORS LIMITED Stock exchange on which the
Flash Report for the Fiscal Year Ended December 31, 2016 [Japan GAAP] (on a consolidated basis) February 13, 2017
![Flash Report for the Fiscal Year Ended December 31, 2016 [Japan GAAP] (on a consolidated basis) February 13, 2017](/thumbs/95/123620510.jpg "Flash Report for the Fiscal Year Ended December 31, 2016 [Japan GAAP] (on a consolidated basis) February 13, 2017") Flash Report for the Fiscal Year Ended December 31, 2016 [Japan GAAP] (on a consolidated basis) February 13, 2017 Company Name: OPT Holding, Inc. Stock Exchange Listing: Tokyo Stock Code: 2389 URL http://www.opt.ne.jp/english/holding/
Flash Report for the Fiscal Year Ended December 31, 2016 [Japan GAAP] (on a consolidated basis) February 13, 2017 Company Name: OPT Holding, Inc. Stock Exchange Listing: Tokyo Stock Code: 2389 URL http://www.opt.ne.jp/english/holding/
Consolidated Financial Results for the First Quarter of Fiscal Year 2018
 Consolidated Financial Results for the First Quarter of Fiscal Year Company name: DISCO Corporation Stock code number: 6146 (Tokyo Stock Exchange 1st Section) URL: http://www.disco.co.jp Telephone number:
Net sales Operating income Ordinary income EBITDA. 16,152 million yen (9.5%)
") Summary of Consolidated Financial Results for the Nine-month Period Ended December 31, 2018 (Japanese accounting standards) Released January 31, 2019 Name of listed firm: Nojima Corporation Listed on the
Summary of Consolidated Financial Results for the Nine-month Period Ended December 31, 2018 (Japanese accounting standards) Released January 31, 2019 Name of listed firm: Nojima Corporation Listed on the
Consolidated Financial Results for the Third Quarter of the Fiscal Year Ending May 15, 2018 [J-GAAP]
![Consolidated Financial Results for the Third Quarter of the Fiscal Year Ending May 15, 2018 [J-GAAP]](/thumbs/93/114345868.jpg "Consolidated Financial Results for the Third Quarter of the Fiscal Year Ending May 15, 2018 [J-GAAP]") Consolidated Financial Results for the Third Quarter of the Fiscal Year Ending May 15, 2018 [J-GAAP] March 13, 2018 Name of listed company: TSURUHA Holdings, Inc. Listed on: Tokyo Stock Exchange, 1st Section
Consolidated Financial Results for the Third Quarter of the Fiscal Year Ending May 15, 2018 [J-GAAP] March 13, 2018 Name of listed company: TSURUHA Holdings, Inc. Listed on: Tokyo Stock Exchange, 1st Section
Olympus Group Financial Results for the 2nd Quarter of the Fiscal Year Ending March 31, 2015
 Olympus Group Financial Results for the 2nd Quarter of the Fiscal Year Ending March 31, 2015 Hiroyuki Sasa President and Representative Director Olympus Corporation November 7, 2014 2Q of Fiscal 2015 Consolidated
Consolidated Financial Results for the Year Ended March 31, 2018[ Japan GAAP ] The Sumitomo Warehouse Co., Ltd. May 11, 2018 Securities code: 9303 Sto
![Consolidated Financial Results for the Year Ended March 31, 2018[ Japan GAAP ] The Sumitomo Warehouse Co., Ltd. May 11, 2018 Securities code: 9303 Sto](/thumbs/94/121802775.jpg "Consolidated Financial Results for the Year Ended March 31, 2018[ Japan GAAP ] The Sumitomo Warehouse Co., Ltd. May 11, 2018 Securities code: 9303 Sto") Consolidated Financial Results for the Year Ended March 31, 2018[ Japan GAAP ] The Sumitomo Warehouse Co., Ltd. May 11, 2018 Securities code: 9303 Stock exchange listings: URL: Representative: Inquiries:
Consolidated Financial Results for the Year Ended March 31, 2018[ Japan GAAP ] The Sumitomo Warehouse Co., Ltd. May 11, 2018 Securities code: 9303 Stock exchange listings: URL: Representative: Inquiries:
Results of Operations
 Results of Operations for the Fiscal Year Ended August 2017 (FY8/17) October 20, 2017 Contents Corporate Overview 3 Organization 4 FY8/17 Consolidated Results of Operations 5 Financial Highlights 6 Consolidated
:
 Financial Results for (April 1, 2008 through March 31, 2009) English Translation of the Original Japanese-Language Document May 11, 2009 Company name : ISUZU MOTORS LIMITED Stock exchange on which the
Summary of Consolidated Financial Results for the 9 Months Ended November 30, 2016 (Based on Japanese GAAP)
") Translation tice: This document is an excerpt translation of the original Japanese document and is only for reference purposes. In the event of any discrepancy between this translated document and the
Translation tice: This document is an excerpt translation of the original Japanese document and is only for reference purposes. In the event of any discrepancy between this translated document and the
Flash Report for the Fiscal Year ended December 31, 2013 [Japan GAAP] (on a consolidated basis)
![Flash Report for the Fiscal Year ended December 31, 2013 [Japan GAAP] (on a consolidated basis)](/thumbs/91/106826542.jpg "Flash Report for the Fiscal Year ended December 31, 2013 [Japan GAAP] (on a consolidated basis)") Flash Report for the Fiscal Year ended December 31, [Japan GAAP] (on a consolidated basis) January 31, 2014 Company Name: OPT, Inc. Stock exchange listing: Tokyo Stock Code: 2389 URL http://www.opt.ne.jp/
Flash Report for the Fiscal Year ended December 31, [Japan GAAP] (on a consolidated basis) January 31, 2014 Company Name: OPT, Inc. Stock exchange listing: Tokyo Stock Code: 2389 URL http://www.opt.ne.jp/
Financial Results of the Principal Subsidiaries
 Financial Results of the Principal Subsidiaries Fiscal Year Ended March 31, 2018 May 15, 2018 Copyright 2018 JAPAN POST GROUP. All Rights Reserved. Table of Contents I Japan Post Holdings... 1 Year-on-Year
Summary of Financial Results for the Fiscal Year Ended August 31, 2015 [Japan GAAP] (Consolidated)
![Summary of Financial Results for the Fiscal Year Ended August 31, 2015 [Japan GAAP] (Consolidated)](/thumbs/96/128499145.jpg "Summary of Financial Results for the Fiscal Year Ended August 31, 2015 [Japan GAAP] (Consolidated)") Summary of Financial Results for the Fiscal Year Ended August 31, 2015 [Japan GAAP] (Consolidated) October 9, 2015 Company Watts Co., Ltd. Listed on the TSE Stock Code 2735 URL: http://www.watts-jp.com/
Summary of Financial Results for the Fiscal Year Ended August 31, 2015 [Japan GAAP] (Consolidated) October 9, 2015 Company Watts Co., Ltd. Listed on the TSE Stock Code 2735 URL: http://www.watts-jp.com/
Results of Operations for February 13, 2019 Bell-Park Co., Ltd. (Stock code: 9441)
") Results of Operations for 2018 February 13, 2019 Bell-Park Co., Ltd. (Stock code: 9441) Contents I. Financial Highlights II. 2018 Initiatives III. Changes in the Business Climate IV. 2019 Plan Appendix:
Results of Operations for 2018 February 13, 2019 Bell-Park Co., Ltd. (Stock code: 9441) Contents I. Financial Highlights II. 2018 Initiatives III. Changes in the Business Climate IV. 2019 Plan Appendix:
Consolidated Financial Results (Japanese Accounting Standards) for the Six Months Ended September 30, 2018 (Q2 FY2018)
 for the Six Months Ended September 30, 2018 (Q2 FY2018)") November 1, 2018 Consolidated Financial Results (Japanese Accounting Standards) for the Six Months Ended September 30, 2018 (Q2 FY2018) Company name: House Foods Group Inc. Stock exchange listing: Tokyo
November 1, 2018 Consolidated Financial Results (Japanese Accounting Standards) for the Six Months Ended September 30, 2018 (Q2 FY2018) Company name: House Foods Group Inc. Stock exchange listing: Tokyo
2.Non-Consolidated Operating Results
 2.Non-Consolidated Operating Results (1) Results and Forecasts for Major Financial Indicators (Billions of yen) 2008.11 YOY 2009.2 Total net sales 1,144.9 107.6% 1,506.3 107.4% 1,127.6 98.5% 1,497.0 99.4%
To our Shareholders. Notice of the 19 th Ordinary General Meeting of Shareholders. June 12 th, Stock Code:3092
 June 12 th, 2017 To our Shareholders Stock Code:3092 6-1 Nakase 2-chome, Mihama-ku Chiba START TODAY CO.,LTD. President and representative director YUSAKU MAEZAWA Notice of the 19 th Ordinary General Meeting
Financial Summary for the Nine Months Ended December 31, 2009 (From April 1 to December 31, 2009) February 10, 2010 Dentsu Inc.
 February 10, 2010 Dentsu Inc.") Financial Summary for the Nine Months Ended December 31, 2009 (From April 1 to December 31, 2009) February 10, 2010 Dentsu Inc. 1 Cautionary Statement This document contains forward-looking statements
Financial Summary for the Nine Months Ended December 31, 2009 (From April 1 to December 31, 2009) February 10, 2010 Dentsu Inc. 1 Cautionary Statement This document contains forward-looking statements
Summary Report of Consolidated Financial Results
 Summary Report of Consolidated Financial Results for the third quarter ended September 30, 2012 October 23,2012 Registered company name: Canon Marketing Japan Inc. Stock listing: Tokyo Stock Exchange,
Net sales Operating income Ordinary income. 112, , , , Three-month period ended June 30, 2016
 Summary of Consolidated Financial Results for the Three-month Period Ended June 30, 2017 (Japanese accounting standards) Released August 8, 2017 Name of listed firm: Nojima Corporation Listed on the Tokyo
FACTBOOK. ABC-MART, INC. For the fiscal year ended February 29, Contents. Securities Code: 2670 / TSE 1st Section
 FACTBOOK ABC-MART, INC. For the fiscal year ended February 29, 216 Contents Corporate Profile 1-4 Consolidated Balance Sheet 5-6 Consolidated Statement of Income 7-8 Consolidated Statement of Cash Flows
Taiyo Holdings / 4626
 COVERAGE INITIATED ON: 2017.12.08 Shared Research Inc. has produced this report by request from the company discussed in the report. The aim is to provide an owner s manual to investors. We at Shared Research
Consolidated Earnings Results for the Six Months ended June 30, 2017 [IFRS], unaudited
![Consolidated Earnings Results for the Six Months ended June 30, 2017 [IFRS], unaudited](/thumbs/94/118686325.jpg "Consolidated Earnings Results for the Six Months ended June 30, 2017 [IFRS], unaudited") This is a translation of the original Japanese document. If there are any discrepancies between this and the original, the original Japanese document prevails. Cookpad Inc. Consolidated Earnings Results
This is a translation of the original Japanese document. If there are any discrepancies between this and the original, the original Japanese document prevails. Cookpad Inc. Consolidated Earnings Results
Investor Presentation Q NEXON Co., Ltd.
 Investor Presentation NEXON Co., Ltd. Results 2 Highlights First quarter performance exceeded high end of our outlook 44.4 bn revenue, up 46% year-over-year, and up 26% on a constant currency basis 20.7
Consolidated Financial Results Announcement for the Nine Months Ended September 30, 2014
 November 14, 2014 Consolidated Financial Results Announcement for the Nine Months Ended September 30, 2014 Company name: SBS Holdings, Inc. Stock exchange listing: Tokyo Stock Exchange (TSE) Stock code:
Summary of Reference data
 Summary of Reference data Fiscal Year 2016 (September 1, 2016 to August 31, 2017) (Tokyo Stock Exchange, 1st Section:3048) 2. Earnings Forecast for FY2017 3. Topics 4. Kojima (Subsidiary) Consolidated
2000 ANNUAL REPORT Year Ended August 31, 2000 FAST RETAILING CO., LTD.
 ANNUAL REPORT Year Ended August 31, FAST RETAILING CO., LTD. PROFILE FAST RETAILING CO., LTD., is the company behind the UNIQLO brand of casual clothing. The Company manages all facets of its business,
Taiheiyo Cement Corporation
 Taiheiyo Cement Corporation Reference Materials of Financial Results for the (From April 1, 2013 through September 30, 2013) Contents Trend in Construction Investments and Domestic Demand of Cement Page
Consolidated Financial Results for the Second Quarter of Fiscal Year 2018
 October 30, 2018 Consolidated Financial Results for the Second Quarter of Fiscal Year 2018 Company name: DISCO Corporation Stock code number: 6146 (Tokyo Stock Exchange 1st Section) URL: http://www.disco.co.jp
Notes to Consolidated Financial Statements Notes to Non-Consolidated Financial Statements
 May 26, 2017 To Our Shareholders: Disclosure on the Internet in conformity with Laws, Regulations and the Articles of Incorporations Notes to Consolidated Financial Statements Notes to Non-Consolidated
Summary of Consolidated Financial Results of Sumitomo Osaka Cement Co., Ltd. for the Fiscal 2012, Ending March 31, 2012(Japan GAAP) May 11, 2012
 May 11, 2012") Company: Sumitomo Osaka Cement Co., Ltd. Fiscal 2011 : April 1, 2010-March 31, 2011 Stock code: 5232 Fiscal 2012 : April 1, 2011-March 31, 2012 URL: http://www.soc.co.jp/ *Figures are rounded down to the
Company: Sumitomo Osaka Cement Co., Ltd. Fiscal 2011 : April 1, 2010-March 31, 2011 Stock code: 5232 Fiscal 2012 : April 1, 2011-March 31, 2012 URL: http://www.soc.co.jp/ *Figures are rounded down to the
Consolidated Balance Sheet
 Consolidated Balance Sheet All Nippon Airways Trading Co., Ltd. and consolidated subsidiaries As of March 31, 2016 Reference information (Unit: millions of yen) Assets 2016 Current assets: Cash and deposits
Consolidated Financial Results for the First Quarter of Fiscal Year 2017
 Consolidated Financial Results for the First Quarter of Fiscal Year Company name: DISCO Corporation Stock code number: 6146 (Tokyo Stock Exchange 1st Section) URL: http://www.disco.co.jp Telephone number:
Summary of Reference data
 Summary of Reference data Fiscal Year August 2015 (September 1, 2015 to August 31, 2016) (Tokyo Stock Exchange, 1st Section:3048) 1. Fiscal Year August 2015 2. Earnings Forecast for FY2016 3. Topics FY2016
Summary of Consolidated Financial Results of Taiheiyo Cement Corporation for the Fiscal 2018 Ended March 31, 2018 May 10, 2018
 Summary of Consolidated Financial Results of Taiheiyo Cement Corporation for the Fiscal 2018 Ended March 31, 2018 May 10, 2018 Company: Taiheiyo Cement Corporation Fiscal 2017: April 1, 2016-March 31,
Topics. 1. 2Q FY2016 Performance P Business Overview P Supplementary Materials P.23. Copyright Adways Inc. All Rights Reserved.
 Topics 1. 2Q FY2016 Performance P.2 2. Business Overview P.10 3. Supplementary Materials P.23 Copyright Adways Inc. All Rights Reserved. 1 1. 2Q FY2016 Performance Copyright Adways Inc. All Rights Reserved.
First-Half Results and Full-Year Outlook for the Fiscal Year Ending March Shinzo Maeda President & CEO Shiseido Co., Ltd. 1
 First-Half Results and Full-Year Outlook for the Fiscal Year Ending March 2010 Shinzo Maeda President & CEO Shiseido Co., Ltd. 1 First-Half Results for the year ended March 2010 Results YoY change Local
FY4/18 IR PRESENTATION
 IR PRESENTATION June 2018 Results Overview 1 Consolidated P/L Net sales increased 8.2% year on year and 0.3% against the plan due to business growth in same stores and stores that were opened in previous
Financial Highlights, Year ended March 31, 2012
 Financial Highlights, Year ended March 31, 212 Contents Ⅰ.Financial Results 3 Ⅱ.Financial Forecasts 11 Ⅲ.Mid-term Plan 21 Ⅳ.Topics 24 Ⅴ.Appendix 27 Ⅰ. Financial results Ⅰ-1 Financial highlights Increase
FINANCIAL RESULTS. Consolidated Financial Statements - Fiscal Year Ended March 31, Consolidated Balance Sheets
 FINANCIAL RESULTS Consolidated Financial Statements - Fiscal Year Ended March 31, 2007-1. Consolidated Balance Sheets (ASSETS) Prior Year End Current Year End (As of March 31, 2006) (As of March 31, 2007)
Third Quarter of FY Japan Display Inc. Consolidated Financial Results. February 14, (Oct. 1, 2018 Dec. 31, 2018)
") Third Quarter of FY 2018 (Oct. 1, 2018 Dec. 31, 2018) Consolidated Financial Results Japan Display Inc. February 14, 2019 Today s Speakers Yoshiyuki Tsukizaki Chief Operating Officer and President Takanobu
Third Quarter of FY 2018 (Oct. 1, 2018 Dec. 31, 2018) Consolidated Financial Results Japan Display Inc. February 14, 2019 Today s Speakers Yoshiyuki Tsukizaki Chief Operating Officer and President Takanobu
Summary of Consolidated Financial Results for the Year Ended February 28, 2017 (FY2017) (Based on Japanese GAAP)
 (Based on Japanese GAAP)") Summary of Consolidated Financial Results for the Year Ended February 28, 2017 (FY2017) (Based on Japanese GAAP) Company name: ABC-MART, INC. Stock exchange listing: Tokyo Stock code: 2670 URL http://www.abc-mart.co.jp/ir/
Summary of Consolidated Financial Results for the Year Ended February 28, 2017 (FY2017) (Based on Japanese GAAP) Company name: ABC-MART, INC. Stock exchange listing: Tokyo Stock code: 2670 URL http://www.abc-mart.co.jp/ir/
Management Policies (Fiscal 2014)
") Management Policies (Fiscal 2014) Hiroyuki Sasa President and Representative Director Olympus Corporation May 9, 2014 2 II. Challenges and Responses 3 4 5 6 I. Successes during 2 Years under New Management
Management Policies (Fiscal 2014) Hiroyuki Sasa President and Representative Director Olympus Corporation May 9, 2014 2 II. Challenges and Responses 3 4 5 6 I. Successes during 2 Years under New Management
Fact Book. Year ended August 31, 2010 BIC CAMERA INC.
 Fact Book Year ended August 31, 21 BIC CAMERA INC. -Year ended August 31, 21- Sales and Earnings(consolidated) Net sales Operating income / ratio Operating income Operating income ratio 3.4 8 6 493.9 4
FY09 Summary of Financial Results (Consolidated) April 30, 2010
 April 30, 2010") FY09 Summary of Financial Results (Consolidated) April 30, 2010 Company Name Wacom Co., Ltd. (Code Number: 6727 TSE1) (URL http://www.wacom.co.jp) Representative: Masahiko Yamada, CEO TEL: 03-5309-1500
FY09 Summary of Financial Results (Consolidated) April 30, 2010 Company Name Wacom Co., Ltd. (Code Number: 6727 TSE1) (URL http://www.wacom.co.jp) Representative: Masahiko Yamada, CEO TEL: 03-5309-1500
Summary of Financial Results for the Fiscal Year Ended March 31, 2018 [Japan GAAP] (Non-Consolidated)
![Summary of Financial Results for the Fiscal Year Ended March 31, 2018 [Japan GAAP] (Non-Consolidated)](/thumbs/92/110301098.jpg "Summary of Financial Results for the Fiscal Year Ended March 31, 2018 [Japan GAAP] (Non-Consolidated)") Summary of Financial Results [Japan GAAP] (Non-Consolidated) Listed internet infinity INC. Company: Code Number 6545 URL: http://iif.jp May 15, 2018 Stock Exchange Listing: Tokyo Stock Exchange Representative:
Summary of Financial Results [Japan GAAP] (Non-Consolidated) Listed internet infinity INC. Company: Code Number 6545 URL: http://iif.jp May 15, 2018 Stock Exchange Listing: Tokyo Stock Exchange Representative:
Q Investor Presentation. March 31, 2013
 Q2 2013 Investor Presentation March 31, 2013 Forward-Looking Information This presentation contains forward-looking statements. All forward-looking statements speak only as of the date of this presentation.
Financial Results for the Fiscal Year Ended March 31, 2010
 Financial Results for the Fiscal Year Ended March 31, 2010 April 27, 2010 Name of Listed Company: Hino Motors, Ltd. Stock Listing: Tokyo and Nagoya Code Number: 7205 URL: http://www.hino.co.jp/ Representative:
mil. Yen % mil. Yen % mil. Yen % mil. Yen %
 FY2012 Financial Results Outline (Consolidated Base) (Based on Generally Accepted Accounting Principles in Japan) (Translated from the Original Japanese Document) May 11, 2012 Company Name: Uniden Corporation
Results for Year Ended March 2013 Outlook for Year Ending March 2014
 SHISEIDO Co., Ltd. Results for Year Ended March 2013 Outlook for Year Ending March 2014 2013-4-26 In this document, statements other than historical facts are forward-looking statements that reflect our
Seven & i Holdings Co., Ltd Financial Results Presentation for the Fiscal Year ended February 28, 2011
 Seven & i Holdings Co., Ltd Financial Results Presentation for the Fiscal Year ended February 28, 2011 April 8, 2011 Seven & i Holdings Co., Ltd. Consolidated Financial Results for the Fiscal Year ended
CFA EQUITY RESEARCH CHALLENGE 2014
 Milan February 2014 CFA EQUITY RESEARCH CHALLENGE 2014 A tailor-made investment Marta Giampietro Federico Braga Matteo Cataldi Davide Di Bucchianico Giovanni Galvani Agenda Introduction and investment
Financial Highlights for the Fiscal Year Ended March 31, 2018 May 15, 2018
 Financial Highlights for the Fiscal Year Ended March 31, 2018 May 15, 2018 Japan Post Holdings: Financial Highlights Results of Operations for the Fiscal Year Ended March 31, 2018 Japan Post Holdings Japan
Reference Materials. Page. Results
 Results Reference Materials Consolidated Financial Results (FY2014 vs. FY2013) P.1 Balance Sheet (as of March 31, 2015 vs. as of March 31, 2014) P.2 Non-consolidated Financial Results (FY2014 vs. FY2013)
Consolidated Financial Results for the First Quarter Ended June 30, 2011
 Consolidated Financial Results for the First Quarter Ended June 30, 2011 FOR IMMEDIATE RELEASE July 27, 2011 (April 1, 2011 to June 30, 2011) FDK CORPORATION (URL: http://www.fdk.com) Listing Code No.6955
Summary of Consolidated Financial Results for the Year Ended March 31, 2017 (Based on Japanese GAAP)
") Translation Notice: This document is an excerpt translation of the original Japanese document and is only for reference purposes. In the event of any discrepancy between this translated document and the
Translation Notice: This document is an excerpt translation of the original Japanese document and is only for reference purposes. In the event of any discrepancy between this translated document and the
Summary of Financial Statements for Second Quarter of Fiscal Year Ending March 31, 2019 [Japanese GAAP] (Consolidated) November 9, 2018
![Summary of Financial Statements for Second Quarter of Fiscal Year Ending March 31, 2019 [Japanese GAAP] (Consolidated) November 9, 2018](/thumbs/95/123001120.jpg "Summary of Financial Statements for Second Quarter of Fiscal Year Ending March 31, 2019 [Japanese GAAP] (Consolidated) November 9, 2018") Summary of Financial Statements [Japanese GAAP] (Consolidated) November 9, 2018 Name of listed company: SHIP HEALTHCARE HOLDINGS, INC. Shares listed on: Tokyo Stock Exchange Code: 3360 URL http://www.shiphd.co.jp/
Summary of Financial Statements [Japanese GAAP] (Consolidated) November 9, 2018 Name of listed company: SHIP HEALTHCARE HOLDINGS, INC. Shares listed on: Tokyo Stock Exchange Code: 3360 URL http://www.shiphd.co.jp/
Summary of Financial Statements for the Year ended March 31, 2018 (April 1, 2017 through March 31, 2018)
") Summary of Financial Statements for the Year ended March 31, 2018 (April 1, 2017 through March 31, 2018) Qualification: This is directly translated into English for the convenience of readers, and all
Summary of Financial Statements for the Year ended March 31, 2018 (April 1, 2017 through March 31, 2018) Qualification: This is directly translated into English for the convenience of readers, and all