Full-year results. March-April 2011
|
|
|
- Cecily George
- 5 years ago
- Views:
Transcription

1 Full-year results March-April
2 DISCLAIMER Safe Harbour Statement This presentation contains forward-looking statements (made pursuant to the safe harbour provisions of the Private Securities Litigation Reform Act of 1995). By their nature, forward-looking statements involve risk and uncertainty. Forward-looking statements represent the company s judgement regarding future events, and are based on currently available information events. Consequently the company cannot guarantee their accuracy and their completeness and actual results may differ materially from those the company anticipated due to a number of uncertainties, many of which the company is not aware of. For additional factors that may cause the company s actual results to differ materially from expectations and underlying assumptions, please refer to the reports filed by the company with the Autorité des Marchés Financiers. 2
3 Highlights 2010 Financial Statements Focus on Neopost North America 2011 Outlook 3
4 2010 HIGHLIGHTS
5 2010 KEY FIGURES Sales: 965.6m Annual sales growth (At constant exchange rates) 2010 quarterly sales growth (At constant exchange rates) 7% 6% +6.1% 7% 6% 5% 4% 3% 2% +2.4% +2.0% 5% 4% 3% 2% +1.4% +3.3% +3.6% 1% 0% -1% % % 0% -1% -0.4% Q Q Q Q Current operating margin*: 25.7% of sales Net margin: 16.2% of sales Rebound of the activity after having well resisted during the crisis 5 * Current operating income / total sales
6 2010 KEY POINTS (1/2) Numerous product launches: IS 5000 and IS 6000 in the USA IS 280 in the United Kingdom Roll-out of IS 350 to IS 480 on all markets DS Success of high end folders/ inserters Number of DS-100/140/1000/1200 sold per semester (Rebased H1-09 = 100) H1-09 H2-09 H1-10 H2-10 Rebound of the activity after having well resisted A great year for products launches during the crisis 6
7 2010 KEY POINTS (2/2) Success of the integration of dealers acquired in 2009 In the USA In Scandinavia Performance of Satori 2009: $15m (including $3m of inter company sales) 2010: +10% growth Deployment in the United Kingdom Improved EBIT margin Rebound of the activity after having well resisted Successful integrations during the crisis 7
8 UPDATE ON MAIL VOLUMES Mail volumes in the USA USPS in the USA Continuing increase of the marketing mail in 2010 Q1 Q2 Q3 Q4 Q1 Q2 Q3 Q4 Transactional mail structurally decreasing 10% 5% 0% La Poste in France Mail volume declining by 3.5% in 2010 versus -5% in % -10% -15% 1st Class mail Standard mail Deutsche Post Mail volume declining by 3.5% in 2010 Slight increase of the volumes in Q4-20% Evolutions in line with Neopost s view 8

9 2010 FINANCIAL STATEMENTS 9
10 2010 SALES Sales (in million) FY 2009 Change* Currency FY 2010 impacts Sales growth of +5.8% in 2010, +2.0% at constant exchange rates 10 * Excluding currency impacts
11 SALES BY AREA 2010 / 2009 change* 2010 sales: 965.6m North America France UK +4.8% -2.4% -2.9% Rest of world 14% Germany 7% North America 41% Germany +1.2% UK 12% Rest of world Total Group +8.3% +2.0% France 26% Further growth in North America, contrasted performance elsewhere 11 * At constant exchange rates
12 SALES GROWTH PER REVENUE TYPE 2010 / 2009 change* 2010 sales: 965.6m Recurring revenue ** +1.1% Rental & leasing 29% Services and supplies 40% Equipment sales +4.0% Equipment sales 31% Four consecutive quarters of growth in equipment sales 12 * At constant exchange rates ** After adjustment for changes in revenues from postal rate changes, recurring revenue increased by about 3%.
13 SALES GROWTH PER BUSINESS LINE 2010 / 2009 change* 2010 sales: 965.6m Mailing systems ** -1.1% Document and logistics systems 31% Documents and logistics systems +9.5% Mailing systems 69% Good performance of the Document systems 13 * At constant exchange rates ** After adjustment for changes in revenues from postal rate changes, mailing systems revenue would have increased by about 1%.
14 CURRENT OPERATING MARGIN Change In million % Sales % Gross margin As % of sales % % +4.4% EBITDA % As % of sales 32.5% 32.5% Current Operating Income As % of sales % % +5.7% A high level of profitability 14 /$ 2010 = 1.32 and 2009 = 1.40 ; / 2010 = 0.86 and 2009 = 0.89
15 PERFORMANCE ANALYSIS Positive factors Negative factors Optimization plan Mix effect Adjustment of production facilities Rebound of equipment sales Success of high-end folders / inserters R&D IFRS impacts Rate change: - 11m in revenues End of R&D projects related to the IS range Subcontracting Short-term dilutive impacts of acquisitions Control of operating costs Natural currency hedge Distributors Targeted acquisitions Good control of the operating margin 15
16 1500 FINANCING STRUCTURE In million July 09 January 10 July 10 January m Natixis / BPCE private placement availability Revolving line availability Revolving line drawn (1) Maturity: June 2013 Rate: Euribor + 20bp OCEANE Maturity: February 2015 Rate: 3.75% Crédit Agricole Private Placement Maturity: December 2012 Rate: 4.09% USPP (1) Maturity: September 2010 Rate: 4.83% and 4.52% Maturity: September 2014 Rate: Euribor + 190bp After reimbursement of the USPP, Neopost has Net margin maintained at a high level sufficient financing capacity 16 (1) EUR/USD : at 31/01/2010, at 31/07/10 and 1,3692 at 31/01/2011
17 COST OF DEBT EVOLUTION Net cost of debt In million 1 st Semester 2009 (13.4) 2010 (18.4) Variation % 2 nd Semester (16.6) (13.5) Total (30.0) (31.9) Important decrease of the cost of debt between H1 and H2 2010: Savings coming from the USPP reimbursement: - 2,4m Exceptional items: - 2,5m 2011 net cost of debt is expected between 30m and 31m A financial result under control 17
18 NET INCOME In million Change % Operating Income % Net cost of debt (30) (32) Other financial gains or losses - (1) Taxes (57) (59) Share of associated companies - 1 Net Income % As % of sales 16.2% 16.2% Net Attributable Income % EPS % Fully diluted EPS % A high level of Net Margin 18 /$ 2010 = 1,32 and 2009 = 1,40 ; / 2010 = 0,86 and 2009 = 0,89
19 CASH FLOW GENERATION In million Change % EBITDA % Other items 5 (8) Cash flow* Change in Working Capital Requirement (16) (8) Change in lease receivables (38) (51) Interests and Income taxes paid (75) (62) Cash flow from Operations % Investments (134) (80) Cash flow after Investments High cash flow from operations that are highly recurring and growing 19 * Before net cost of debt and income tax /$ 2010 = 1,32 and 2009 = 1,40 ; / 2010 = 0,86 and 2009 = 0,89
20 CHANGE IN WORKING CAPITAL REQUIREMENT Details of the variation In million Inventories Accounts receivable Prepaid income Other payables and receivables Total excluding leasing (7) (13) 2 2 (16) (25) (8) A structurally negative WCR at - 196m 20 /$ 2010 = 1.32 and 2009 = 1.40 ; / 2010 = 0.86 and 2009 = 0.89
21 HEALTHY FINANCIAL STRUCTURE In million Financial debt Cash and marketable securities Net financial debt 31/ (139) / (136) 689 Shareholders equity Net debt / shareholders equity Net debt / EBITDA ratio EBITDA / financial charges* ratio % % A strengthened equity level and covenants** that are easily met 21 * Financial charges= cost of debt ** Minimum equity of 400m and maximum leverage ratio of 3.25
22 SOLIDITY OF NEOPOST BALANCE SHEET Equity: 606m at end-january 2011 versus 490m at end-january 2010 Leasing portfolio as at end-january 2011: 572 M +10% versus end-january 2010* Rental Net present value of future rental cash flows above 300m Net debt: 689m at end-january 2011 Leasing + rental future cash flows about 900m i.e. >> 100% of net debt Acquisitions de nouvelles technologies Debt is totally backed by future cash flows payantes 22 * At constant exchange rates
23 INCREASE OF THE DIVIDEND IN In EPS Dividend Pay-out ratio: 100% Cash Of which 59% Cash Of which % 78% 79% 52% Cash 2.25 Interim dividend 1.65 A proposed dividend of 3,90 per share for FY 2010, i.e. a yield above 6%* 23 * Based on 27 March 2011 closing price ( 64.31)


24 FOCUS ON NEOPOST NORTH AMERICA 24
25 NORTH AMERICA: THE WORLD S LARGEST AND MOST DYNAMIC MARKET North America is the world s largest market 50% + of world s total volume of mail 50% + of mailing systems global installed base North American postal organizations are extremely dynamic Long track record in encouraging the mandatory renewal of the installed base (decertifications) Early adopters of new technologies: digitalization, connectivity, IBI, Shape-Based Pricing Technological innovation as a driver for operational efficiency / productivity Mail accounts for an increasing share of marketing expenditure From 19.5% of total US advertising spending in 2002 to 23% in
26 NORTH AMERICA: NEOPOST S LARGEST MARKET North America accounts for 41% of Neopost total revenues in 2010 Neopost employs 1,800 people in North America North America has been Neopost engine for growth in 2010 and momentum will remain positive in 2011 and beyond Neopost key marketing initiatives and product launches target North America first, prior to global roll-out Longstanding partnership with US and Canadian postal organizations: Shared vision, common goals 26
27 NEOPOST NORTH AMERICA Canada : Headquarters in Toronto 20%* market share 2010 revenues: CAD 36m Sales force: 60 people including dealers USA : Headquarters in Milford, CT 18%* market share 2010 revenues: USD 490m Sales force: 800 people including dealers Satori HQ HQ Logistic center Call center R&D 27 * in percentage of the installed base of franking machines end of 2010
28 NORTH AMERICA: A STRUCTURAL OPPORTUNITY FOR NEOPOST Neopost, the North American challenger # 2 in Canada with 20% market share* # 2 in the US with 18% market share* Neopost has already been capturing a growing share of North American total revenues Despite recession, Neopost has been growing faster than market average at +3% per year from 2007 to North American sales in USD millions *of mailing system installed base - Source USPS and Canada Post
29 NORTH AMERICAN DECERTIFICATION ECHO: A MARKET OPPORTUNITY FOR NEOPOST Decertification of all electromechanical machines in Canada and partially in the USA 2007 Shape-Based Pricing in the USA Decertification of the remaining electro-mechanical machines in the USA With an average 5 year leasing period, past decertifications will continue to bring boosts of activity 29
30 CONSISTENT ROLL OUT OF NEOPOST STRATEGY IN NORTH AMERICA Launch of new innovative products Optimization of distribution Promotion of leasing and financial services Marketing of services Operational efficiency in particular through 2008/09 restructuring Creating a new culture among employees Neopost has prepared itself for seizing the decertification echo opportunity 30


31 TIMELY LAUNCH OF MAILING SYSTEMS Price in $k IS IS-480 IS IS-440 IS IS-280 IS-350 IS Volume envelopes / day envelopes / day >200 envelopes / day 31
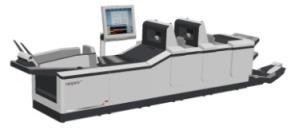


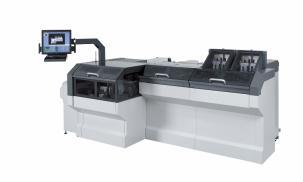
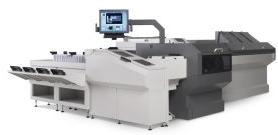
32 FOLDERS/INSERTERS: A RANGE AMPLY RENEWED Price in $k 150 DS DS DS DS-100/ DS DS DS DS DS Office Mailroom Mail center Production 32
33 A CONTINUOUS MOVE TOWARDS A MORE DIRECT DISTRIBUTION The goal is to be direct in highly dense metropolitan areas From 31%* direct in 2004 to 57%* direct in 2010 in the US %* direct 43% indirect Key recent acquisitions: Baltimore, Florida, San Diego, Connecticut, Los Angeles, New York/Long Island, Atlanta, Philadelphia, Washington DC Further acquisitions still possible 33 *Percentage of the installed base covered by a direct distribution
34 BENEFITS OF A MORE DIRECT DISTRIBUTION Capture 100% of revenues Deployment of Neopost s business model Grow recurring revenues Leasing and financial services Maintenance and other services Increase cross selling between mailing and document systems More consistency in the deployment of the marketing strategy Better access to large and national accounts Ability to define the pace of investments [Moving direct boasts effective leverage over operations] 34
35 DISTINCTIVE DISTRIBUTION MODEL Combine the best of direct control and dealer s entrepreneurial spirit Drive decision making to the market level Centralize all non-customer facing activities Roll-out market by market Local decision-making entails faster customer response 35
36 PROMOTION OF LEASING A high value added service High probability of replacement of equipment at end of contract Ability to bundle additional services High profitability Leasing expansion Increased penetration* +50% in 5 years Dealer acquisitions Around 60% of the installed base covered with leasing North American leasing portfolio in USD millions A critical tool to plan for equipment renewal in the context of the decertification echo 36 *Penetration rate: hardware sales leased / total hardware sales
37 DEVELOPMENT OF SERVICES Postage financing Service launched in 2006 Attachment rate* reached 60% in 2010 Online services Available thanks to mailing systems digital technology /connectivity Attachment rate* around 30% in 2010 Rate change protection (RCP) In 2010, RCP represented 60%+ of rate change revenues in North America Maintenance Increased attachment rate Dealer acquisitions Potential to further increase recurring revenues will be boosted by opportunity of decertification echo 37 *Attachment rate: number of service contract / new machine
38 US OPTIMISATION PLAN R&D: merger of 3 US centres into 1 (Austin) Supply chain: 1 North American logistics platform (Memphis) plus introduction of direct shipment US distribution: Combined 3 separate entities to create Neopost USA Closed all West coast operations and established headquarters in CT, including the leasing company Consolidated of all call center activities in Dallas, TX Established a cohesive management team for Neopost USA A stronger organisation creating a new momentum 38


39 CREATING A NEW CUSTOMER-CENTRIC CULTURE A differentiating culture versus competition A drive for excellence in customer experience and employee satisfaction NEOPOST WINS INTERNAL COMMUNICATION AWARD IN CANADA TORONTO, ON 10 March 2011 Neopost internal communications campaign received a prestigious 2010 Silver Leaf Award for excellence in business communication, presented by the International Association of Business Communicators (IABC). According to Neopost Canada president, Lou Gizzarelli, internal communications helps foster a customer-centric culture: It helps Neopost to differentiate itself from its competitors. As a result of our efforts, customer satisfaction is up, sales are up, employee engagement is up. Mr. Gizzarelli added: Our 2010 employee engagement survey results showed substantial gains in our customer-centric culture. And an amazing 96% of our Canadian team indicated they had a good understanding of their business unit s goals and objectives. We achieved that company-wide alignment by focusing on clear and consistent internal communications. It works. 39
40 LOW-END: A NEW GROWTH POTENTIAL Most of our US growth is today achieved in the Mid/High-end segment Total US Meter Population* The Low-end segment is very significant We have a lower market share in that segment It is a profitable segment, which requires a specific approach Low-end 70% Mid-end 20% High-end 10% 40 * Based on USPS published data and Neopost estimates
41 LOW-END INITIATIVE Creation of a dedicated Small Business Solutions Group Set up the right sales and service organization Increase market share in the low-end segment, and contribute to recurring revenue growth Handle remotely the lower end of the market With the neodirect sales channel Focus field sales professionals on higher $ value sales Increase field sales productivity and revenue Optimize distribution costs 41
42 CONCLUSION Completely realigned efficient organization Optimized and more direct distribution network More maturing leases allowing for hardware growth coupled with strong lease portfolio management Strong innovative renewed product portfolio Higher level of services attachment rate which will translate in higher recurring revenues for the future Strong customer-centric culture Low-end initiative Significant growth opportunities in North America 42

43 2011 OUTLOOK
44 2011 OUTLOOK Good momentum in North America More contrasted performance in Europe Sales growth at constant exchange rates Expected between 2% and 4% Current Operating Margin expected Expected between 25.5% and 26% of sales 44

45 APPENDIX 45
46 CONSOLIDATED BALANCE SHEET (1/2) Assets In million 31/ / Goodwill Intangible fixed assets Tangible fixed assets Other non-current financial assets Other non-current receivables Leasing receivables Deferred tax assets Inventory Accounts receivables Other current assets Cash & marketable securities TOTAL 1,970 2,056 46
47 CONSOLIDATED BALANCE SHEET (2/2) Liabilities In million 31/ / Shareholders equity Non-current provisions 9 10 Non-current financial debt Short-term financial debt Deferred tax liabilities Other non-current liabilities Prepaid income Current financial instruments 2 1 Other current liabilities TOTAL 1,970 2,056 47
48 DEBT STRUCTURE Private placement with Crédit Agricole Regional Banks 133m at a fixed rate (4.09%) Maturity: December 2012 Revolving credit 750m at variable rates, EURIBOR or LIBOR +20bps Multi-currency drawings the currency of future cash flow Maturity: June 2012, extended to June 2013 for 675m Acquisitions Simple de nouvelles debt structure technologies payantes 48
49 DEBT STRUCTURE Banques Populaires / Caisses d Epargne / Natixis private placement 175m redeemable revolving loan Euribor +190bp Maturity: September 2014 OCEANE 300m, 3,622,750 convertible bonds Maturity: 1 st February 2015 Interest: 3.75% 30% premium on reference share price of 63.70, i.e Dividend protection clause Funds not yet drawn down: 558m as at 01/31/2011 covering future needs 49
Interim results. September/October 2010
 2 0 1 0 Interim results September/October 2010 1 DISCLAIMER Safe Harbour Statement This presentation contains forward-looking statements (made pursuant to the safe harbour provisions of the Private Securities
2005 FULL YEAR RESULTS. March / April 2006
 2005 FULL YEAR RESULTS March / April 2006 DISCLAIMER Safe Harbour Statement This presentation contains forward-looking statements (made pursuant to the safe harbour provisions of the Private Securities
Neopost Interim Results. October 2005
 Neopost 2005 Interim Results October 2005 3 October 2005 Disclaimer Safe Harbour Statement This presentation contains forward-looking statements (made pursuant to the safe harbour provisions of the Private
2006 FULL YEAR RESULTS. March / April 2007
 2006 FULL YEAR RESULTS March / April 2007 DISCLAIMER Safe Harbour Statement This presentation contains forward-looking statements (made pursuant to the safe harbour provisions of the Private Securities
PRESS RELEASE. Sales came to million in 2009, down 0.5% compared with 2008, or down 0.3% at constant exchange rates.
 2009: A ROBUST PERFORMANCE IN A PARTICULARLY CHALLENGING ENVIRONMENT Current operating margin1 maintained at 25.7% of sales 2009 dividend: 3.80 euros per share Full-year sales virtually unchanged: -0.3%
LIMITATION OF LIABILITY
 2016 HALF-YEAR RESULTS September 2016 LIMITATION OF LIABILITY Forward-looking statement (Safe Harbour) This presentation contains forward-looking statements (made pursuant to the safe harbour provisions
2017 HALF-YEAR RESULTS 27 September 2017
 2017 HALF-YEAR RESULTS 27 September 2017 LIMITATION OF LIABILITY Forward-looking statement (Safe Harbour) This presentation contains forward-looking statements (made pursuant to the safe harbour provisions
PRESENTATION OF 2017 ANNUAL RESULTS
 PRESENTATION OF 2017 ANNUAL RESULTS Paris, 19 February 2018 Delivering Transformation. Together. DISCLAIMER This presentation contains forward-looking information subject to certain risks and uncertainties
Q results. July 28, Financial statements at June 30, 2010 were reviewed by the Supervisory Board held on July 27, 2010.
 Q2 2010 results July 28, 2010 Financial statements at June 30, 2010 were reviewed by the Supervisory Board held on July 27, 2010. 1. Q2 2010 at a glance Q2 2010 highlights Organic sales growth in Q2 (+2.3%)
First Quarter Fiscal 2017 Financial Report
 First Quarter Fiscal 2017 Financial Report For the three months ended March 31, 2017 and 2016 TSX: AVO AVIGILON CORPORATION MANAGEMENT S DISCUSSION AND ANALYSIS INTRODUCTION The following Management s
Commercial Real Estate Services
 GROUP, GROUP, INC. INC. Global Global Market Market Leader Leader in in Integrated Integrated Commercial Real Estate Services JUNE 2016 NOVEMBER 2016 FORWARD-LOOKING STATEMENTS This presentation contains
FIRST-HALF 2017 RESULTS. 27 July 2017
 FIRST-HALF 2017 RESULTS 27 July 2017 Disclaimer FORWARD LOOKING STATEMENTS This presentation contains certain statements that constitute "forward-looking statements", including but not limited to statements
INTENSIFIED TRANSFORMATION THANKS TO INCREASED INVESTMENT AND COST REDUCTION AS SALES DECREASE
 2016 HALF-YEAR RESULTS AND Q2 2016 SALES INTENSIFIED TRANSFORMATION THANKS TO INCREASED INVESTMENT AND COST REDUCTION AS SALES DECREASE First-half 2016 sales down 5.0%, or -3.3% organically 1 H1 2016 current
MAISONS DU MONDE: FULL-YEAR 2017 RESULTS
 PRESS RELEASE MAISONS DU MONDE: FULL-YEAR 2017 RESULTS Very good performance across the board, in line with targets Solid sales growth and profitability Excellent free cash flow generation and strong deleveraging
Finning reports Q results; increases dividend
 Q2 2017 EARNINGS RELEASE August 9, 2017 Finning reports Q2 2017 results; increases dividend Vancouver, B.C. Finning International Inc. (TSX: FTT) ( Finning or the Company ) reported 2 nd quarter 2017 results
Francotyp-Postalia Holding AG. Financial Statements 2008 Analysts Conference 28 April 2009
 Francotyp-Postalia Holding AG Financial Statements 2008 Analysts Conference 28 April 2009 Francotyp-Postalia (FP) at a Glance Overview FP-Group covers the entire value chain in the outbound mail market
1,633m 2013 Revenues 2013 ANNUAL RESULTS. 13 March ,427 Employees in % of Revenues for International in 2013
 1,633m 2013 Revenues 2013 ANNUAL RESULTS 13 March 2014 55% of Revenues for International in 2013 20,427 Employees in 2013 Disclaimer This presentation contains forward-looking statements (as defined in
Sopra Steria turns in a solid performance in 2017
 Press release Sopra Steria turns in a solid performance in Revenue of 3,845.4 million, equating to organic growth* of 3.5% Revenue growth of 4.6% at constant exchange rates and total growth of 2.8% Operating
Q Francotyp-Postalia Holding AG QUARTERLY FINANCIAL REPORT QUARTERLY FINANCIAL REPORT FIRST QUARTER 2007 Q12007
 1 Francotyp-Postalia Holding AG QUARTERLY FINANCIAL REPORT Q1 2007 Q12007 Q12007 FRANCOTYP-POSTALIA HOLDING AG UNTERNEHMENS- ENTWICKLUNG Overview 1 ST QUARTER 1 ST QUARTER FRANCOTYP-POSTALIA GROUP 2007
REXEL. Q3 & 9-month 2009 results. November 12, 2009
 REXEL Q3 & 9-month 2009 results November 12, 2009 Q3 2009 & 9-month results Q3 and 9-month 2009 at a glance Financial review Outlook 3 Q3 & 9-month 2009 at a glance Q3 & 9-month 2009 highlights: Quarter-on-quarter
Sopra Steria beats targets for 2015
 Press release Sopra Steria beats targets for Successful integration Organic revenue growth: 2.0% Operating margin on business activity: 6.8% Net profit Group share: 84.4m Free cash flow: 49.3m Paris, 29
Q results. April 27, 2018
 Q1 2018 results April 27, 2018 Consolidated financial statements as of March 31, 2018 were authorized for issue by the Board of Directors held on April 26, 2018. Q118 KEY HIGHLIGHTS Q1 2018 in line with
TD Bank Financial Group Delivers Very Strong Second Quarter 2007 Earnings
 TD B A NK FINANCIAL G ROUP SECOND QUART ER 2007 R EPORT TO SHAR EHOLD ERS Page 1 2 nd Quarter 2007 Report to Shareholders Three and six months ended April 30, 2007 TD Bank Financial Group Delivers Very
Investor Relations Presentation. March 2019
 Investor Relations Presentation March 2019 CAGR 2011-2018: 69.5% CAGR 2011-2018: 17.2% U.S. Concrete, Inc. - Overview U.S. Concrete is one of the largest and fastest growing construction materials companies
Philips Lighting reports 0.5% full year comparable sales growth, 10% operational profitability and EUR 403 million free cash flow
 Philips Lighting reports 0.5% full year comparable sales growth, 10% operational profitability and EUR 403 million free cash flow Q4 & Full Year 2017 presentation February 2, 2018 Important information
Press Release For immediate release
 Press Release For immediate release Uni-Select reports double-digit increases for sales, EBITDA (1) and EPS (compared to the same quarter last year), driven by The Parts Alliance contribution: Sales up
2015 SECOND QUARTER INTERIM REPORT. Empowered by customer experience
 2015 SECOND QUARTER INTERIM REPORT Empowered by customer experience Interim Management s Discussion and Analysis as at June 30, 2015 Quarterly highlights 3 Preliminary comments to Management s Discussion
Commercial Real Estate Services
 GROUP, GROUP, INC. INC. Global Global Market Market Leader Leader in in Integrated Integrated Commercial Real Estate Services JUNE 2016 JUNE 2016 FORWARD-LOOKING STATEMENTS This presentation contains statements
Horizon Global First Quarter 2016 Earnings Presentation
 Horizon Global First Quarter 2016 Earnings Presentation May 3, 2016 1 Safe Harbor Statement Forward-Looking Statements This presentation may contain "forward-looking statements" as defined in the Private
2017 Full Year. Results Presentation. 21 February 2018
 2017 Full Year Results Presentation 21 February 2018 CAUTIONARY STATEMENT 2017 Full Year Results Slide 2 Full Year Highlights 2017 Full Year Results Presentation 8TH YEAR OF DOUBLE-DIGIT GROWTH 2017 FINANCIAL
PROFITABILITY AND FREE CASH FLOW GENERATION MAINTAINED AT HIGH LEVELS DESPITE UNDER- PERFORMANCE FROM EDS DIVISION
 2017 ANNUAL RESULTS AND FOURTH-QUARTER 2017 SALES PROFITABILITY AND FREE CASH FLOW GENERATION MAINTAINED AT HIGH LEVELS DESPITE UNDER- PERFORMANCE FROM EDS DIVISION 2017 Full-year sales of 1.1 billion,
MAISONS DU MONDE: FULL-YEAR 2018 RESULTS
 PRESS RELEASE MAISONS DU MONDE: FULL-YEAR 2018 RESULTS Strong performance in line with targets Continued solid momentum in online and international sales Focus on strategic pillars to deliver further profitable
Cegedim Q Revenue Highlights th. August 3 th, 2011
 Cegedim Q2 2011 Revenue Highlights th August 3 th, 2011 Safe Harbour Statement This presentation contains forward-looking statements (made pursuant to the safe harbour provisions of the Private Securities
CBRE GROUP, INC. Global Market Leader in Integrated Commercial Real Estate Services
 CBRE GROUP, INC. Global Market Leader in Integrated Commercial Real Estate Services March 2016 FORWARD-LOOKING STATEMENTS This presentation contains statements that are forward looking within the meaning
Henkel Our strategic priorities for the future. Hans Van Bylen / Carsten Knobel Press Conference, November 17, 2016
 Henkel 2020 + Our strategic priorities for the future Hans Van Bylen / Carsten Knobel Press Conference, November 17, 2016 Disclaimer This information contains forward-looking statements which are based
first quarter results 2010
 first quarter results 2010 back to growth in March Robert-Jan van de Kraats, CFO Randstad Holding nv April 28, 2010 disclaimer Certain statements in this document comprise forecasts on Randstad Holding
2017 Full Year Results. Tuesday 21 November 2017
 2017 Full Year Results Tuesday 21 November 2017 Disclaimer Certain information included in the following presentation is forward looking and involves risks, assumptions and uncertainties that could cause
Cegedim: First half is 2011 on target.
 Public company with share capital of 13,336,506.43 euros Trade and Commercial Register: Nanterre B 350 422 622 www.cegedim.com First-half financial information at June 30, 2011 IFRS Regulated information
Press Release For immediate release
 Uni-Select Inc. Reports Third Quarter 2018 Financial Results: Sales up 13.4% to $448.8 million, driven by the contribution of TPA and organic growth; Consolidated organic growth (1) of 3.4% with positive
forward-looking statements non-gaap adjusted measures
 This presentation includes forward-looking statements within the meaning of the U.S. federal securities laws, including, without limitation, statements regarding: our preliminary financial results for
MAISONS DU MONDE: FIRST-HALF 2018 RESULTS
 PRESS RELEASE MAISONS DU MONDE: FIRST-HALF 2018 RESULTS A solid first half in a challenging environment Updated full-year 2018 targets Sales up 11% to 507m including Modani, and up 9.8% at constant scope
CDW Reports Third Quarter 2015 Results
 November 4, 2015 CDW Reports Third Quarter 2015 Results Record Third Quarter Net Sales, Adjusted EBITDA and Non-GAAP Net Income Per Share (Dollars in millions, except per share amounts) Three Months Ended
Investor Presentation
 Investor Presentation May 2013 48,000 employees 200 offices 70 countries 1 global platform Table of Contents I. Company Description II. Global Growth Strategy III. Financial Overview IV. Appendix 2 Company
CBRE GROUP, INC. Fourth Quarter 2017: Earnings Conference Call FEBRUARY 8, 2018
 GROUP, INC. Fourth Quarter 2017: Earnings Conference Call FEBRUARY 8, 2018 FORWARD-LOOKING STATEMENTS This presentation contains statements that are forward looking within the meaning of the Private Securities
2014 Full-Year Results
 2014 Full-Year Results February 18, 2015 Amsterdam Nancy McKinstry Chief Executive Officer and Chairman Kevin Entricken Chief Financial Officer Forward-looking Statements This presentation contains forward-looking
2018 Full-year results
 Press release Full-year results Revenue up 6.9% to 4,095.3 million Organic growth of 4.9% over the full year, and 5.5% in the 4th quarter Operating margin on business activity of 7.5%, in line with the
Our Transformation Continues. March 21, 2018
 Our Transformation Continues March 21, 2018 Disclosure Regarding Forward-Looking Statements Forward-Looking Statements and Factors That May Affect Future Results: Throughout this presentation, we make
John Menzies plc. Interim Results Presentation 14 August 2018
 John Menzies plc Interim Results Presentation 14 August 2018 Results Overview Highlights Underlying operating profit at 33.9m, up 18% at constant currency Profit progression John Menzies plc H1 underlying
Francotyp-Postalia Holding AG QUARTERLY FINANCIAL REPORT QUARTERLY FINANCIAL REPORT FOR Q1 2008
 1 Francotyp-Postalia Holding AG QUARTERLY FINANCIAL REPORT Q12008 Q12008 OVERVIEW FRANCOTYP-POSTALIA GROUP 1 ST QUARTER 1 ST QUARTER 2008 2007 Figures in accordance with consolidated financial statements
FINANCIALS. Arnaud Laviolette Group CFO. Investor day 13 December 2017
 FINANCIALS Arnaud Laviolette Group CFO ACTIVITIES ARE FINANCED INDEPENDENTLY EUR million 30 June 2017 AUTO BELRON MOLESKINE GROUP Loans & borrowings 189.9 708.8 189.6 1,088.3 Inter-group -330.2 180.5 149.7
CBRE GROUP, INC. REPORTS DOUBLE-DIGIT SECOND-QUARTER 2018 REVENUE AND EARNINGS GROWTH AND INCREASES FULL-YEAR OUTLOOK
 PRESS RELEASE Corporate Headquarters 400 South Hope Street 25 th Floor Los Angeles, CA 90071 www.cbre.com FOR IMMEDIATE RELEASE For further information: Brad Burke Steve Iaco Investor Relations Media Relations
McCormick & Company, Inc. 4th Quarter 2018 Financial Results and 2019 Outlook
 McCormick & Company, Inc. 4th Quarter 2018 Financial Results and 2019 Outlook January 24 th 2019 The following slides accompany a January 24 th 2019, earnings release conference call. This information
SOCIETE GENERALE GOLDMAN SACHS EUROPEAN FINANCIALS CONFERENCE 2017 BERNARDO SANCHEZ INCERA, DEPUTY CEO MADRID
 SOCIETE GENERALE GOLDMAN SACHS EUROPEAN FINANCIALS CONFERENCE 2017 BERNARDO SANCHEZ INCERA, DEPUTY CEO MADRID 08.06.2017 DISCLAIMER This presentation contains forward-looking statements relating to the
John Engel Chairman, President and CEO. EPG Conference May 19, 2014
 John Engel Chairman, President and CEO EPG Conference May 19, 2014 Safe Harbor Statement Note: All statements made herein that are not historical facts should be considered as forwardlooking statements
ROADSHOW POST-Q2 & H RESULTS. September 2016
 ROADSHOW POST-Q2 & H1 2016 RESULTS September 2016 1. COMPANY OVERVIEW Rexel at a glance : Strategic partner for suppliers and customers Energy Providers Suppliers Customers Endusers Economies of scale
Finning reports Q results
 Q3 2017 EARNINGS RELEASE November 7, 2017 Finning reports Q3 2017 results Vancouver, B.C. Finning International Inc. (TSX: FTT) ( Finning or the Company ) reported third quarter 2017 results today. All
ERSTEN QUARTALS +4.1 % REVENUES climbs to EUR million 12.7EUR MILLION EBITDA 6.7 EUR MILLION. Sound adjusted free cash flow
 HALF-YEARLY FINANCIAL REPORT 2017 KENNZAHLEN KEY FIGURES DES ERSTEN QUARTALS +4.1 % REVENUES climbs to EUR 104.4 million 12.7EUR MILLION EBITDA 6.7 EUR MILLION Sound adjusted free cash flow Revenue grows
Zebra Technologies Second-Quarter 2018 Results. August 7, 2018
 Zebra Technologies Second-Quarter 2018 Results August 7, 2018 Safe Harbor Statement Statements made in this presentation which are not statements of historical fact are forward-looking statements and are
Our Transformation Continues Sidoti NDR May 29-30, 2018
 Our Transformation Continues Sidoti NDR May 29-30, 2018 Disclosure Regarding Forward-Looking Statements Forward-Looking Statements and Factors That May Affect Future Results: Throughout this presentation,
2018 THIRD QUARTER INTERIM REPORT
 2018 THIRD QUARTER INTERIM REPORT INTERIM MANAGEMENT S DISCUSSION AND ANALYSIS September 30, 2018 Quarterly highlights 3 Preliminary comments to Management s discussion and analysis 4 Profile and description
2018 SECOND QUARTER INTERIM REPORT
 2018 SECOND QUARTER INTERIM REPORT INTERIM MANAGEMENT S DISCUSSION AND ANALYSIS June 30, 2018 Quarterly highlights 3 Preliminary comments to Management s discussion and analysis 4 Profile and description
AIRBUS H1 Results 2018
 AIRBUS H1 Results 2018 26 July 2018 Tom Enders Chief Executive Officer Harald Wilhelm Chief Financial Officer SAFE HARBOUR STATEMENT 2 DISCLAIMER This presentation includes forward-looking statements.
ORGANIC SALES GROWTH STABILIZED AND STRONG CASH FLOW GENERATION
 2018 ANNUAL RESULTS AND FOURTH-QUARTER 2018 SALES ORGANIC SALES GROWTH STABILIZED AND STRONG CASH FLOW GENERATION 2018 full-year sales of 1.1 billion, down -1,8%, or up +0,2% in organic terms 1 2018 fourth-quarter
CONSTELLATION SOFTWARE INC.
 Condensed Consolidated Interim Financial Statements (In U.S. dollars) CONSTELLATION SOFTWARE INC. For the three months ended March 31, 2014 and 2013 Condensed Consolidated Interim Statements of Financial
Press Release For immediate release
 Press Release For immediate release Uni-Select reports its first quarter of 2018 driven by The Parts Alliance contribution: Sales up 42.0% to $422.1 million of which The Parts Alliance contribution represented
LafargeHolcim makes good progress in 2017; Strategy 2022 to drive growth. EPS 11.9% up on prior year excluding impairment and divestments
 Zurich, 07:00, March 2, 2018 LafargeHolcim makes good progress in 2017; Strategy 2022 to drive growth 4.7% growth in Net Sales on like-for-like basis Recurring EBITDA up 6.1% on like-for-like basis EPS
PRESENTATION OF FIRST-HALF 2017 RESULTS
 PRESENTATION OF FIRST-HALF 2017 RESULTS Paris, 28 July 2017 Delivering Transformation. Together. DISCLAIMER This presentation contains forward-looking information subject to certain risks and uncertainties
Full Year Results 2014
 Legal disclaimer Information in this presentation may involve guidance, expectations, beliefs, plans, intentions or strategies regarding the future. These forward-looking statements involve risks and uncertainties.
The Premium Review Conference. Société Générale. Paris December 2, 2010
 The Premium Review Conference Société Générale Paris December 2, 2010 Disclaimer This presentation is not an offer to purchase or a solicitation to recommend the purchase of Michelin shares. To obtain
Third Quarter Report to Shareholders
 Third Quarter Report to Shareholders Thirteen and thirty-nine weeks ended MANAGEMENT'S DISCUSSION AND ANALYSIS For the thirteen and thirty-nine weeks ended (All amounts are in United States dollars unless
Bob Dorrance Vice Chair - Wholesale Banking, TD Bank Financial Group Chairman and CEO, TD Securities
 Bob Dorrance Vice Chair - Wholesale Banking, TD Bank Financial Group Chairman and CEO, TD Securities NATIONAL BANK FINANCIAL CANADIAN BANK CEO CONFERENCE April 7, 2004 Forward-Looking Statements From time
ZEBRA TECHNOLOGIES FIRST QUARTER 2016 RESULTS May 10, 2016
 ZEBRA TECHNOLOGIES FIRST QUARTER 2016 RESULTS May 10, 2016 Anders Gustafsson Chief Executive Officer Mike Smiley Chief Financial Officer 2 Safe Harbor Statement Statements made in this presentation which
SAMSONITE INTERNATIONAL S.A.
 Hong Kong Exchanges and Clearing Limited and The Stock Exchange of Hong Kong Limited take no responsibility for the contents of this announcement, make no representation as to its accuracy or completeness
DSM Capital Markets Day 2018
 DSM Capital Markets Day 2018 Targets 2021 focused on growth, cash and value Geraldine Matchett CFO ROYAL DSM CAPITAL MARKETS DAY LONDON (UK) - 20 JUNE 2018 Safe harbor statement This presentation may contain
WESCO International John Engel Chairman, President and CEO. William Blair & Company 36 th Annual Growth Stock Conference June 14, 2016
 WESCO International John Engel Chairman, President and CEO William Blair & Company 36 th Annual Growth Stock Conference June 14, 2016 Safe Harbor Statement Note: All statements made herein that are not
MIDCAP ZURICH 11 September 2018
 MIDCAP ZURICH 11 September 2018 1 Disclaimer Before reading these presentation slides (the "Presentation"), you acknowledge that you are fully informed of the limitations and qualifications below: This
Performance Food Group Company Reports Third-Quarter Fiscal 2016 Results: Provides Full-Year Fiscal 2016 Adjusted EBITDA Growth Outlook of 10% to 12%
 NEWS RELEASE For Immediate Release May 4, 2016 Investors: Michael D. Neese VP, Investor Relations (804) 287-8126 michael.neese@pfgc.com Media: Joe Vagi Manager, Corporate Communications (804) 484-7737
Financial review Gemalto
 0 0111010 0110 010 0 0110 0 011101010 0 0111010 0110 010 0 0110 0 011101010 0 0111010 0110 010 0 0110 0 011101010 0 0111010 0110 010 0 0110 0 011101010 0 0111010 0110 010 0 0110 0 011101010 0 0111010 01100100010
FIRST-HALF 2018 RESULTS 30 JULY 2018
 FIRST-HALF 2018 RESULTS 30 JULY 2018 Disclaimer FORWARD LOOKING STATEMENTS This presentation contains certain statements that constitute "forward-looking statements", including but not limited to statements
Horizon Global Third Quarter 2017 Earnings Presentation
 Horizon Global Third Quarter 2017 Earnings Presentation October 31, 2017 Q1 2016 Earnings 1 Safe Harbor Statement Forward-Looking Statements This presentation may contain "forward-looking statements" as
Investor Presentation. 53,000 employees, 200 offices, 75 countries, 1 global platform
 Investor Presentation 53,000 employees, 200 offices, 75 countries, 1 global platform August 2014 Who we are JLL is a leading provider of real estate services and investment management, creating value for
Excellent results for Alstom in the first half 2018/19
 PRESS RELEASE Excellent results for Alstom in the first half 2018/19 Strong commercial momentum with 7 billion orders, leading to a new record-breaking backlog of 38 billion Outstanding operational performance
t e c h n i c o l o r. c o m
 2017 t e c h n i c o l o r. c o m Forward looking statements THIS PRESENTATION contains certain statements that constitute "forward-looking statements", including but not limited to statements that are
Earnings Webcast & Conference Call. Fourth Quarter and Fiscal Year 2018
 Earnings Webcast & Conference Call Fourth Quarter and Fiscal Year 2018 2017 1 Forward-Looking Statements This presentation and other written or oral statements made from time to time by representatives
Second Quarter 2017 Report to Shareholders
 Second Quarter 2017 Report to Shareholders BMO Financial Group Reports Net Income of $1.25 Billion for Second Quarter of 2017 Financial Results Highlights: Second Quarter 2017 Compared with Second Quarter
Investor Presentation
 Feb Investor Presentation 2018 Lee D. Rudow President and CEO Michael J. Tschiderer Chief Financial Officer NASDAQ: TRNS 1 Safe Harbor Statement This presentation contains forward looking statements within
Investors: Michael D. Neese VP, Investor Relations (804)
") NEWS RELEASE For Immediate Release August 17, 2016 Investors: Michael D. Neese VP, Investor Relations (804) 287-8126 michael.neese@pfgc.com Media: Joe Vagi Manager, Corporate Communications (804) 484-7737
NEWS RELEASE For Immediate Release August 17, 2016 Investors: Michael D. Neese VP, Investor Relations (804) 287-8126 michael.neese@pfgc.com Media: Joe Vagi Manager, Corporate Communications (804) 484-7737
DH CORPORATION Management s Discussion and Analysis For the quarter ended March 31, 2016
 DH CORPORATION Management s Discussion and Analysis For the quarter ended March 31, 2016 D+H Q1 2016 1 Management s Discussion and Analysis For the quarter ended March 31, 2016 Page 1 Introduction 3 2
This presentation contains forward-looking statements (made pursuant to the safe harbour provisions of the Private
 Safe Harbour Statement This presentation contains forward-looking statements (made pursuant to the safe harbour provisions of the Private Securities Litigation Reform Act of 1995). By their nature, forward-looking
WESCO International John Engel Chairman, President and CEO. EPG Conference May 16, 2016
 WESCO International John Engel Chairman, President and CEO Safe Harbor Statement Note: All statements made herein that are not historical facts should be considered as forwardlooking statements within
Manulife Financial Corporation Third Quarter
 Manulife reports 3Q16 net income of $1.1 billion and core earnings of $1 billion, strong growth in Asia, and positive net flows in Wealth and Asset Management TORONTO Manulife Financial Corporation ( MFC
YHY2007 // HALF-YEARLY FINANCIAL REPORT. Francotyp-Postalia Holding AG HALF-YEARLY FINANCIAL REPORT 2007
 Y Francotyp-Postalia Holding AG YHY2007 // HALF-YEARLY FINANCIAL REPORT HY2007 HY2007 FRANCOTYP-POSTALIA HOLDING AG // Overview HY HY 2 nd Quarter 2 nd Quarter FRANCOTYP-POSTALIA GROUP 2007 2006 2007 2006
Forward Looking Statements
 Kingspan 2015 Full Year Results 22 nd February 2016 Disclaimer Forward Looking Statements This presentation contains certain forward-looking statements including, without limitation, regarding the Group
Q4 AND FULL YEAR 2017 UPDATE FEBRUARY 16, 2018
 Q4 AND FULL YEAR 2017 UPDATE FEBRUARY 16, 2018 SAFE HARBOR STATEMENT Forward-looking Statements This webcast presentation contains a number of forward-looking statements. Words such as gain, drive, invest,
P R E S S R E L E A S E
 P R E S S R E L E A S E from ASSA ABLOY AB (publ) 2 November 2004 No. 12/04 ASSA ABLOY: CONTINUED STRONG ORGANIC GROWTH IN THE THIRD QUARTER Sales in the third quarter increased organically by 6% to SEK
PHOTOCURE ASA RESULTS FOR THIRD QUARTER AND THE FIRST NINE MONTHS November 2018
 PHOTOCURE ASA RESULTS FOR THIRD QUARTER AND THE FIRST NINE MONTHS 2018 8 November 2018 Daniel Schneider, President and CEO Ambaw Bellete, President, Photocure Inc. and Head, US Cancer Commercial Operations
1H FY16 RESULTS PRESENTATION
 FY16 RESULTS PRESENTATION March 2016 Contents 1 Results Overview 2 Key Line Items 3 Country Results 4 Cash Flow, Balance Sheet, Dividend 5 Growth Strategy Update 6 FY16 Outlook 7 Questions A Appendices
Logista Q Results. July 26, 2018
 Logista Q3 2018 Results July 26, 2018 Logista reports Q3 2018 Results Logista announces today its Q3 Results for 2018. Main highlights: Economic Sales 1 increase by 7,8% improving the 1.3% drop in Revenues
CDW Corporation. Webcast Conference Call February, CDW.com
 CDW Corporation Webcast Conference Call February, 7 2018 CDW.com 800.800.4239 Today's Agenda Fourth Quarter and YTD 2017 Results Key Performance Drivers and Strategic Progress Financial Results ASC 606
Bank of America Acquires LaSalle Bank
 Bank of America Acquires LaSalle Bank Ken Lewis Chairman, CEO and President Joe Price Chief Financial Officer Liam McGee President - Global Consumer & Small Business Banking David Darnell President - Commercial