ENEL AMÉRICAS FINANCIAL STATEMENTS ANALYSIS As of March 31, 2018
|
|
|
- Ginger Newman
- 5 years ago
- Views:
Transcription

1 CONSOLIDATED OF ENEL AMÉRICAS AS OF MARCH 31, 2018 Revenues increased by 20.0% compared to the same period of last year reaching US$ 2,800 million explained mainly by higher revenues in Brazil and Argentina. Colombia and Peru also registered higher revenues but to a lesser extent. EBITDA increased by 26.0% reaching US$ 820 million, explained by better results in the 4 countries, especially in the distribution business in Brazil as a result of the improvement in Enel Dx Goiás (Celg) results and, in Argentina, due to the tariff increase in Edesur. Operating Income (EBIT) increased by 32.4%, reaching US$ 631 million. Net income attributable to controlling shareholders reached US$ 221 million, a 200.3% growth compared to the previous year, explained by an improvement in the operating income for the period, along with a better net financial result (lower expense of 35.3%) explained by lower financial expenses in Argentina and Brazil. On the other hand, tax expense increased by 24.6% reaching US$ 170 million. Net financial debt reached US$ 3,939 million, 17.6% higher than the yearend of 2017, explained mainly by lower level of cash and an increase of debt in Brazil and Colombia. CAPEX for the period reached US$ 251 million, 8.3% less than the same period of the previous year, mostly due to lower investments in Enel Gx Piura and Enel Dx Río.
2 SUMMARY BY BUSINESS SEGMENT Generation The generation segment showed an EBIDTA growth of 17.0%, reaching US$ 413 million. The foregoing is explained by better results obtained in the 4 countries, mainly in Argentina as a result of higher prices. Physical Data Distribution The distribution segment showed a 36.3% growth than the same period of the previous year, reaching US$ 429 million; explained mainly by higher tariffs in Argentina as a result of the application of the new regulation, and a better performance of Enel Distribución Goiás. The number of clients increased by 252,925. Physical data
3 FINANCIAL SUMMARY The Company s available liquidity has remained solid, as shown below: Cash and cash equivalents Cash and cash equiv. + cash investments over 90 days Available committed lines of credit US$ 1,214 million US$ 1,388 million US$ 808 million The average nominal interest rate as of March 2018 decreased to 7.1 % from 8.5% during the same period of the previous year, primarily influenced by better interest rate conditions in debts refinancing in Brazil and Colombia, and lower inflation in these two countries. All of the above was partially offset by higher debt s interest rates stemming from the recently acquired EGP Volta Grande concession. Hedging and protection: In order to mitigate the financial risks associated to foreign exchange rate and interest rate fluctuations, Enel Américas S.A. has established policies and procedures aimed at hedging its financial statements against the volatility of these variables. Enel Américas S.A. (consolidated) foreign exchange rate risk hedging policy establishes that there must be a balance between the index currency of the flows generated by each company and the currency in which they assume debt. Therefore, Enel Américas S.A., has contracted cross currency swaps for US$ 857 million and forwards for US$ 751 million. In order to reduce the financial statements volatility caused by interest rate changes, Enel Américas S.A. (consolidated) keeps an adequate debt structure balance. To that effect, we have entered into interest rate swaps that totaled US$ 1,042 million.
4 RELEVANT INFORMATION FOR THE ANALYSIS OF THESE FINANCIAL STATEMENTS Change of Perimeter: On February 14, 2017, our subsidiary Enel Brasil S.A. purchased 99.88% of Celg Distribución S.A. share capital. The impact of this operation, plus other factors related to this acquisition, are detailed in note 7.1 of the Consolidated Financial Statements of Enel Américas as of March 31, In November 2017, our subsidiary Enel Brasil S.A. wholly-acquired the Volta Grande concession for an approximate amount of US$ 436 million. The impact of this operation, plus other factors related to this acquisition are detailed in note 9 of the Consolidated Financial Statements of Enel Américas as of March 31, MARKETS IN WHICH THE COMPANY OPERATES Enel Américas owns and operates generation, transmission and distribution companies in Argentina, Brazil, Colombia and Peru. Virtually, all our revenues, income and cash flows come from the operations of our subsidiaries, jointly-controlled entities and associates in these four countries.


5 The following tables show some key indicators, as of March 31, 2018 and 2017 of the companies operating in Argentina, Brazil, Colombia and Peru. Generation and transmission business segment Distribution business segment

6 The following table shows an energy sale revenues breakdown of continuing operations by business segment, by type of client, and by country as of March 31, 2018 and 2017.

7 I.- ANALYSIS OF THE FINANCIAL STATEMENTS 1. Analysis of the Income Statement The income attributable to the controlling shareholders of Enel Américas for the period which ended on March 31, 2018 reached US$ 221 million, representing a % increase in relation to the US$ 74 million income registered in the same period of the previous year. Following is an item-by-item comparison of the Income Statement of the continuing operations for the periods ended March 31, 2018 and 2017:

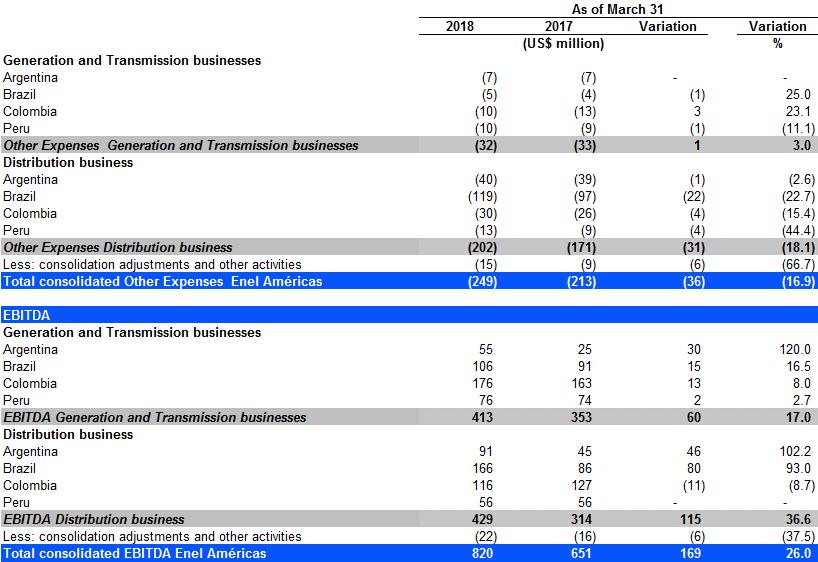
8 EBITDA: EBITDA for the period ended March 31, 2018 reached US$ 820 million, which represents a US$ 169 million increase, equivalent to a 26% increase, in comparison to the US$ 651 million EBDITA for the period ended March 31, Operating revenues, operating costs, staff expenses and other expenses by nature for the operations that determine our EBITDA, broken down by business segment for the periods ended March 31, 2018 and 2017, are shown below:
9
10 EBITDA OF GENERATION AND TRANSMISSION SEGMENT: Argentina The EBITDA of our generation subsidiaries in Argentina reached US$ 55 million in March 2018, representing a US$ 30 million increase compared to the same period of The main variables, by subsidiary, explaining this increase in the results as of March 2018, compared to the same period of 2017, are described below: Enel Generación Costanera S.A.: (US$ 13 million higher EBITDA mainly attributable to higher revenues from the tariff increase of the Resolution SEE No. 19/2017). Enel Generación Costanera s operating revenues increased by US$ 12 million, or 55.2 %, in March This increase is mainly explained by US$ 19 million of higher revenue attributable to a US$ 21 million increase in tariff revenue related to the new Resolution SEE 19/2017. The aforementioned was offset by (i) lower generation due to the maintenance of the power plant totaling US$ 2 million and (ii) US$ 5 million lower conversion income due to the 25.5 % devaluation of the Argentine peso in relation to the US dollar. Operating costs decreased by a US$ 1 million, mainly due to the 25.5% devaluation of the Argentine peso in relation to the US dollar. Staff expenses were in line with the same period of the year before. Other expenses by nature were in line with the same period of the year before. Enel Generación El Chocón: (US$ 6 million higher EBITDA mainly due to higher tariff revenue stemming from the new Resolution No. SEE 19/2017) Operating revenues of Enel Generación El Chocón increased by US$ 5 million, mostly due to (i) a US$ 4 million increase due to the tariff revenue stemming from the new Resolution No. SEE 19/2017, (ii) a US$ 4 million increase of energy sales due to favorable hydrological conditions. The aforementioned was partially offset by a US$ 3 million decrease as a consequence of the 25.5% devaluation of the Argentine peso in relation to the US dollar. Operating costs were in line with the same period of the year before. Staff expenses were in line with the same period of the year before. Other expenses by nature were in line with the same period of the year before.
11 Central Dock Sud: (US$ 11 million higher EBITDA mostly attributable to higher revenues stemming from the new tariff regulations No. SEE 19/2017). Dock Sud s operating revenues increased by US$ 13 million, or 70.4% in 2018, explained by a US$ 17 million increase in tariff revenues stemming from the new Resolution No.19/2017, which was offset by US$ 4 million decrease in revenues as a consequence of the 25.5% devaluation of the Argentine peso in relation to the US dollar. Dock Sud s operating costs increased by US$ 2 million, or 59.5 % in 2018, mainly due to higher transportation costs. Dock Sud s Staff expenses were in line with the same period of the year before. Other expenses by nature were in line with the same period of the year before.
12 Brazil EBITDA of our generation and transmission subsidiaries in Brazil totaled US$ 106 million in 2018, representing a US$ 15 million increase compared to the same period of the previous year. The main variables, by subsidiary, explaining this increase in the results of March 2018, compared to the same period in 2017, are described below: EGP Cachoeira Dourada S.A.: (US$ 2 million higher EBITDA mainly because of higher energy sales). EGP Cachoeira Dourada s operating revenues increased by US$ 36 million, or 35.41%, in This increase is mostly explained by a US$ 39 million increase due to higher energy sales of 1,614 GWh related to a higher market demand. The above was offset by a US$ 3 million decrease due to the 3.2% depreciation of the Brazilian Real in relation to the US dollar. EGP Cachoeira Dourada s operating costs increased by US$ 33 million, or 53.9% in 2018, mostly explained by a US$ 36 million increase in energy purchases given by the rise of unregulated clients demand compared to 2017, which was offset by a US$ 2 million decrease in costs due to the 3.2% depreciation of the Brazilian Real in relation to the US dollar EGP Cachoeira Dourada s staff expenses were in line with the same period of the year before. Other expenses by nature were in line with the same period of the year before. Compañía Eléctrica de Fortaleza: (US$ 10 million lower EBITDA mainly due to higher energy purchases by gas supply disruption carried out by Petrobras) Compañía Eléctrica de Fortaleza s operating revenues increased by US$ 2 million, mostly due to a US$ 6 million recognition under the concept of indemnities for insurance associated to claims in generating plant, US$ 2 million as a result of the tax incentive recognition named Provion (Programa de Incentivo y Desarrollo Industrial). The aforementioned was offset by (i) a US$ 3 million decrease in energy sales and (ii) a US$ 2 million decrease as a consequence of the 3.2 % depreciation of the Brazilian Real in relation to the US dollar. Compañía Eléctrica de Fortaleza s operating costs increased by US$ 8 million, or 29.7 %, in 2018, due to an increase mainly attributable to a US$ 13 million increase in energy purchases, resulting from the gas supply disruption carried out by Petrobras, which forced the company to supply energy in the market, to comply with its contractual committed with customers. The above was partially offset by US$ 5 million of lower fuel consumption.
13 Eléctrica de Fortaleza s staff expenses were in line with the same period of the previous year. Compañía Eléctrica de Fortaleza s other expenses by nature were in line with the same period of the previous year. Enel Cien S.A.: (in line with the same period of the year before). Enel Green Power Volta Grande.: (Company that entered into the consolidation perimeter as of November 2017, date in which its acquisition was completed. Its income as of March 31, 2018 shows a positive EBITDA of US$ 22 million) EGP Volta Grande s operating revenues totaled US$ 26 million, corresponding to 407 GWh of energy sales that took place during the first quarter of EGP Volta Grande s operating costs totaled US$ 4 million, corresponding to energy transportation costs.
14 Colombia EBITDA of our generation subsidiary in Colombia reached US$ 176 million in 2018, which represents a US$ 13 million increase in relation to the same period of the previous year. The main variables that explain this increase in the results as of March 2018, compared to the same period of the previous year, are described below: Emgesa SA: (US$ 13 million higher EBITDA mostly due higher energy sales) Emgesa s operating revenues increased by US$ 35 million, or 12.7%, in This increase is mostly explained by (i) a US$ 15 million increase resulting from 93 Gwh growth on physical sales, (ii) a US$ 11 million growth in energy tariff, (iii) a US$ 5 million increase due to the 2.2% appreciation of the Colombian peso in relation to the US dollar and (iv) a US$ 3 million increase corresponding to indemnities for claims on the Chivor, Guavio and Guaca tunnel. Emgesa s operating costs increased by US$ 23 million, or 25.3%, in 2018, mainly composed by (i) a US$ 15 million increase in energy purchases, which is explained by: US$ 37 million increase of energy purchases (441/GWh) in the spot market, offset by US$ 23 million in purchase price decrease in the spot market (of -$69/KWh); (ii) a US$ 3 million increase in fuel consumption, (iii) a US$ 5 million increase in transportation costs due to client increase in the unregulated market. Emgesa s staff expenses increased by US$ 1 million mostly associated with the 2.2% appreciation of the Colombian peso in relation to the US dollar. Emgesa s other expenses by nature decreased by US$ 3 million, or 23.3% in 2018, mainly due to a decrease in wealth tax recognized in March 2017.
15 Peru_ EBITDA of our generation subsidiaries in Peru reached US$ 76 million in 2018, which represents a US$ 2 million increase in relation to the same period of the previous year. The main variables, by subsidiary, that explain this increase in the March 2018 results, compared the same period of the previous year, are described below: Enel Generación Perú S.A. (Edegel): (US$ 1 million higher EBITDA mostly because of higher incomes from tolls and weather emergency compensation offset by energy purchase increase) Enel Generación Perú s operating revenues increased by US$ 25 million, or 18.5%, in This increase is mostly explained by (i) US$ 5 million in higher energy sales resulting from a higher demand (ii) US$ 12 million increase in toll revenues due to more unregulated clients and (iii) a US$8 million increase in provision for loss of profit due to a rotor damage in Ventanilla power plant. Enel Generación Perú s Operating costs increased by US$ 24 million, or 35.8%, in 2018 mostly composed by (i) a US$ 6 million increase in energy purchases due to higher electricity generation capacity, (ii) a US$ 8 million increase in fuel costs, explained by a higher oil consumption for gas pipeline maintenance for US$ 3 million and a higher thermal energy consumption due to a higher demand from unregulated clients for US$ 5 million, (iii) a US$ 7 million increase of transportation costs and, (iv) a lower recognition of renewable energy compensations for US$ 3 million. Enel Generación Perú s staff expenses were in line with the same period of the previous year. Enel Generación Perú s other expenses by nature were in line with the same period of the previous year. Enel Generación Piura S.A.: (in line with the same period of the previous year) Chinango S.A.: (US$ 1 million EBITDA due mainly to lower energy sales) Chinango s operating revenues increased by US$ 2 million due to higher sales in the spot market.
16 Chinango s operating costs increased by US$ 1 million due to the 1.5% appreciation of the Peruvian Sol in relation to the US dollar. Chinango s staff expenses were in line with the same period of the previous year. Chinango s other expenses by nature were in line with the same period of the previous year.
17 DISTRIBUTION SEGMENT EBITDA: Argentina Empresa Distribuidora Sur S.A. (Edesur): (US$ 46 million higher EBITDA mainly due to the new integral tariff review) EBITDA of our Argentinean subsidiary reached US$ 91 million in 2018, which represents a US$ 46 million increase in relation to the same period of the previous year. The main variables that explain this decrease in the March 2018 income, as compared to 2018, are described below: Edesur s operating revenue increased by US$ 111 million, or 33.1 % in 2018, mostly because of a US$ 188 million recognition of a greater revenue from energy sales as a result of the application of the new tariff review (Revisión Tarifaria Integral RTI) as published by Resolution No. 64 dated February 1, 2017 issued by the ENRE (Ministerio de Energía y Minería de la Secretaría de Energía Eléctrica); This increment was partially offset by (i) US$ 16 million lower energy sales of 9 GWh and (ii) a US$ 61 million decrease caused by the 25.5 % devaluation of the Argentinean peso in relation to the US dollar. Edesur s operating costs increased by US$ 62 million, or 31.4 % mostly on account of: a US$ 107 million increase in energy purchases mostly attributable to a US$ 103 million price increase as a result of domestic inflation and a US$ 4 million from higher physical purchases; a US$ 10 million increase in transportation costs; a US$ 9 million increase in generator rental. These were partially offset by a US$ 39 million reduction caused by the 25.5 % devaluation of the Argentinean peso in relation to the US dollar and a US$ 25 million decrease in recognition of fines for client compensation registered in the same period of the previous year. Edesur s staff expenses increased by US$ 5 million, as a consequence of a US$ 11 million staff salary increase mainly due to domestic inflation and a US$ 7 million increase for the retirement plan. The above was offset by a US$ 14 million as a result of the 25.5 % devaluation of the Argentinean peso in relation to the US dollar. Edesur s other expenses by nature were in line in relation to the same period of the previous year. Energy losses were in line with the prior period reaching 12.1 % of operating costs as of March The number of Edesur s clients as of March 2018 reached 2,535 million which represented an increase of 22,000 new clients, as compared to the same period of the previous year.
18 Brazil EBITDA of our distribution subsidiaries in Brazil reached US$ 166 million in 2018, which represents a US$ 80 million increase in relation to the same period of the previous year. The main variables, by subsidiary, that explain such an increase in the March 2018 income, as compared to the same period of 2017, are described below: Enel Distribución Río S.A. (ex Ampla): (US$ 7 million higher EBITDA mostly attributable to lower operating costs) Enel Distribución Río s operating revenue decreased by US$ 6 million, or 1.6% in 2018, mainly explained by a decrease in other operating income of US$ 22 million, which is mainly explained by (i) decrease in construction income for IFRIC 12 for US$ 17 million (ii) lower income for mutual support for US$ 2 million and (iii) lower other operating income for US$ 3 million, due to the devaluation of 3.2% of the Brazilian Real in relation to with the US dollar. The above was partially offset by - Increase of US$ 7 million in revenues from energy sales, attributable mainly to the following effects: (i) an increase of US$ 57 million due to the effect of higher revenues from tariff recovery; (ii) increase of US$ 11 million due to higher revenues from meter energy measurement, (ii) higher income from taxes received for research and development and energy efficiency for US$ 8 million (iv) decrease in sales of 113 GWh equivalent to US$ 57 million, (v) decrease in the recognition of the tariff flag for US$ 5 million (vi) decrease of US$ 9 million due to the devaluation of 3.2% of the Brazilian Real in relation to the US dollar. - Increase in other services provided by US$ 9 million mainly due to an increase in revenues from tolls of US$ 10 million, offset by US$ 1 million from the conversion effects of a devaluation of 3.2% of the Brazilian Real relative to the US dollar Enel Distribución Rio s operating costs decreased by US$ 13 million or 4.8 % in 2018, mostly explained by a US$ 8 million decrease in energy purchases attributable to: (i) a US$ 3 million decrease due to lower prices for regulated industrial tariffs; (ii) a US$ 5 million decrease as a result of the conversion effects of the 3.2% depreciation of the Brazilian Real in relation to the US dollar. A US$ 19 million increase in energy transport costs due to increased thermal energy hire. A US$ 24 million decrease in other variable supplies corresponding to (i) US$ 18 million lower costs for the construction of IFRIC 12, (ii) a US$ 4 million decrease in compensation
19 to customers and a US$ 2 million decrease as a result of the 3.2% devaluation of the Brazilian Real in relation to the US dollar. Enel Distribución Río s staff expenses increased by US$ 3 million which is mainly explained by an increase in employee compensation costs. Other expenses by nature in Enel Distribución Río decreased by US$ 4 million mostly explained by lower maintenance costs and third party services of US$ 2 million, a US$ 2 million decrease due to the conversion effects stemming from the 3.2 % depreciation of the Brazilian real in relation to the US dollar. Energy losses increased by 1 p.p. reaching 20.5 % of the 2018 operating costs. As of March 2018, Enel Distribución Río had 2,992 million clients, which represented a 71,000 decrease as compared to the same period of the previous year. Enel Distribución Ceará S.A. (ex Coelce): (US$ 11 million lower EBITDA mostly attributable to higher transport costs) Enel Distribución Ceará s operating revenue of increased by US$ 6 million, or 1.8 % in 2018, mostly due to other supply services and other operating income explained by the effects of the IFRIC 12 construction contract. Enel Distribución Ceará s operating costs increased by US$ 12 million or 5.8 % in 2018, mostly explained by (i) a US$ 17 million transport cost increase from tolls; (ii) a US$ 6 million increase in the 12 IFRIC concession contracts costs;(iii) a US$ 9 million lower purchases due to lower demand; and (iv) a US$ 2 million decrease due to the conversion effects of the 3.2 % depreciation of the Brazilian real in relation to the US dollar. Enel Distribución Ceará s staff expenses increased by US$ 2 million mainly as a consequence of higher staff compensations. Enel Distribución Ceará s other expenses by nature increased by US$ 3 million, or 10.4 % in 2018, mostly because of a US$ 3 million increase in higher third party service costs for line and network maintenance and civil litigation. Energy losses during 2018 increased by 1 p.p. reaching 13.8 % of operating costs. As of March 2018, Enel Distribución Ceará had 3,991 million clients, which represented an increase of 65,000 new clients as compared to the same period of the previous year. Enel Distribución Goiás (ex CELG): (US$ 83 million higher EBIDTA mainly due to higher tariff recognition offset by lower staff compensation costs)
20 Enel Distribución Goiás operating revenue reached US$ 159 million, made up by (i) US$ 278 million from energy sales equivalent to 1,174 GWh of physical sales, plus USD 24 million, of which USD 23 million is explained by construction revenues related to IFRIC12. This was offset by other service of US$ 144 million, mainly due to lower tolls services. Enel Distribución Goiás s operating costs increased by US$ 120 million, made up of (i) US$ 59 million in energy purchases to cover higher demand, (ii) increase in transportation cost of US$ 37 million and (iii) increase in other variable supplies and services of US$ 24 million, which correspond mainly to construction costs for application of IFRIC 12 for US$ 23 million. Enel Distribución Goiás staff costs decreased by US$ 67 million including US$ 61 million provisions for the voluntary retirement plan recognized in February Enel Distribución Goiás other expenses by nature reached US$ 23 million corresponding mainly to higher third party service costs for line and network maintenance and other services. Energy losses decreased by 0.8 p.p. reaching 11.9% of operating costs in The number of Enel Distribución Goiás clients reached 2,945 million as of March 2018.
21 Colombia EBITDA of our subsidiary Codensa in Colombia reached US$ 116 million in 2018, which represents a US$ 11 million decrease in relation to the same period of the previous year. The main variables that explain such increase in the March 2018 results as compared to 2017, are described below: Codensa S.A.: (Lower EBITDA of US$ 11 million mostly explained by a higher energy purchases and higher average energy price of purchase) Codensa s operating revenue increased by US$ 30 million or 8.0% in 2018 because of (i) a US$ 3 million increase of 36 GWh physical sales, (ii) a US$ 16 million increase mainly due to higher tariffs due to the inflation effect, (iii) a US$ 3 million increase due mainly to collection commissions; and (v) finally, a US$ 8 increase as a result of the conversion effects of the 2.2 % appreciation of the Colombian peso in relation to the US dollar. Codensa s operating costs increased by US$ 35 million or 16.3 % in 2018, mainly explained by (i) a US$ 3 million increase in higher 53 GWh energy purchase compared to the previous year, (ii) a US$ 27 million increase in average prices, (iii) a US$ 3 million increase in transportation costs; and (iv) a US$ 4 million decrease in costs for variable supplies and services as a result of higher costs related to new business. Additionally, a US$ 6 million increase as a result of the conversion effects of the 2.2 % appreciation of the Colombian peso in relation to the US dollar. Codensa s staff expenses increased by US$ 2 million, or 16.4 % in 2018, as a consequence of US$ 3 million increase in salaries and wages, offset by US$ 1 million by higher labor cost on construction projects. Codensa s other expenses by nature increased by US$ 4 million, or 17.5 % in 2018 mostly due to a US$ 8 million increase in higher third party service costs for line and network maintenance. The above was partially offset by a US$ 4 million reduction caused by lower wealth tax costs in relation to the same period of the previous year. Energy losses in 2018 increased by 0.1 p.p. reaching 7.9% of operating costs. Codensa had 3,364 million clients as of March 2018 which represents an increase of 95,000 new clients, as compared to the same period of the previous year.
22 Peru EBITDA of our Enel Distribución Perú S.A. subsidiary reached US$ 56 million in 2018 which was in line with the same period of the year before. Enel Distribución Peru S.A. (former Edelnor): (In line with the same period of the previous year). Enel Distribución Perú s operating revenue increased by US$ 11 million due to increased in energy sales explained by US$ 17 million related to a tariff increase, offset by lower physical sales of US$ 6 million, equivalent to 53 GWh. Enel Distribución Perú s operating costs increased by US$ 7 million mostly explained by a US$ 8 million increase in energy purchases, offset in part by a US$ 1 million I in other variable costs corresponding to contractors. Enel Distribución Perú s staff expenses were in line with the same period of the previous year. Enel Distribución Perú s other expenses by nature increased by US$ 3 million due to higher third party services. Energy losses in 2018 increased by 0.4 p.p. reaching 8.2% of operating costs. Enel Distribución Perú had 1,403 million clients in 2018, which represents an increase of 24,000 new clients, as compared to the same period of the previous year.

23 The following table shows, by segment and by country, a summary of EBITDA, Depreciation Expenses, Amortization and Impairment, and EBIT for the subsidiaries of the Enel Américas Group during the periods ended as of March 31, 2018 and Depreciation, Amortization, Impairment Depreciation, amortization and impairment totaled US$ 189 million in 2018, which represents a US$ 14 million increase in relation to the same period of Depreciation and amortization reached US$ 167 million in 2018 representing a US$ 23 million increase compared to same period of 2017 by higher capitalized investment and in substation, lines and networks. The above is explained mainly by: (i) a US$ 18 million increase in the Enel Brasil Group: Enel Distribución Goiás S.A. of US$ 14 million, Enel Distribución Río of US$ 2 million, Enel Distribución Ceará of US$ 2 million; (ii) a US$ 4 million increase in Codensa; (iii) Enel Generación Piura by US$ 2 million due to the 1.5% appreciation of the Peruvian sol in relation to the US dollar. At the same time, impairment reached US$ 22 million in 2018, representing a US$ 7 million decrease in relation to the same period of 2017, explained mostly by: (i) US$ 5 million decrease in Enel Distribución Río due to lower recognition of uncollectability, (ii) US$ 2 million Enel Distribución Goiás due to lower recognition of uncollectability, (iii) a US$ 2 million less for uncollectability in Enel Distribución Ceará. The above was offset by US$ 2 million in Edesur for an increase in uncollectable debt.
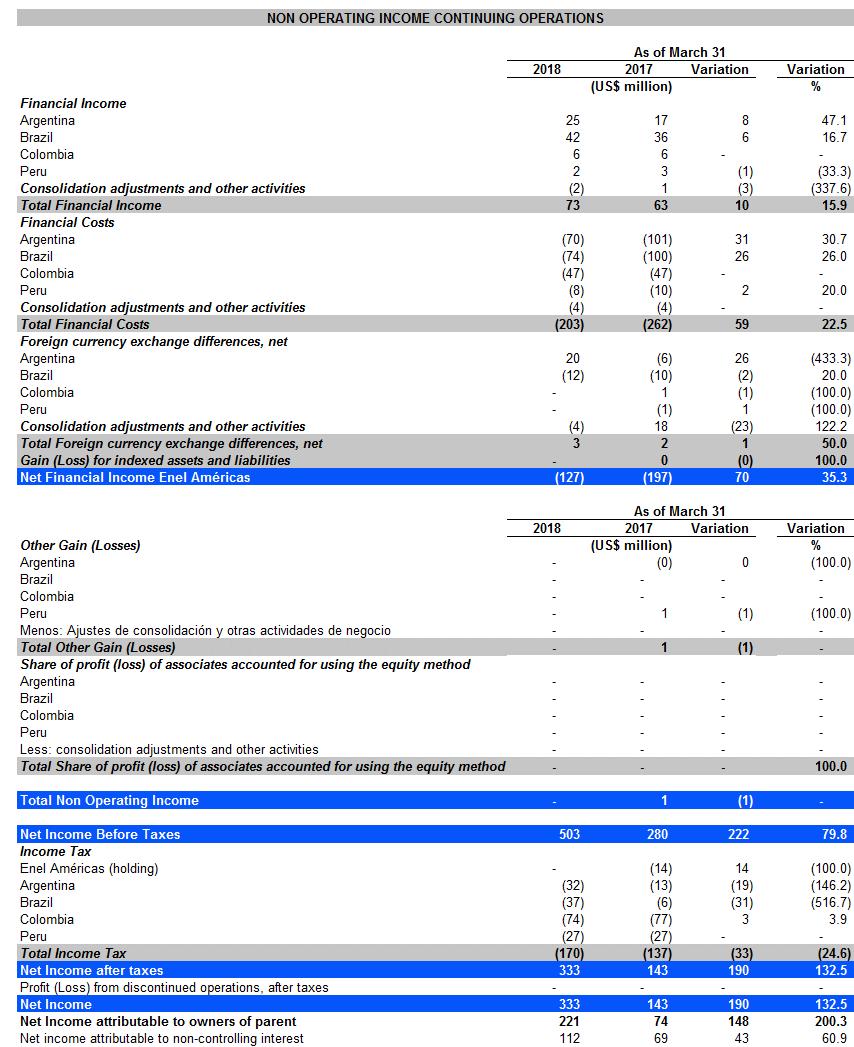
24 The following table shows the consolidated non-operating income from continued activities for the periods ended March 31, 2018 and 2017:
25
26 Financial Income Financial income reached a US$ 127 million loss as of March 2018, which represents a US$ 70 million improvement in relation to the US$ 197 million loss registered in the same period of The foregoing is mostly explained by: a) Higher financial income of US $ 10 million as of March 2018 mainly attributable to: (i) a US$ 2 million increase in Edesur due to higher income interest recognition on term deposits and arrear interests (ii) a US$ 9 million increase in Enel Distribución Rio corresponding to US$ 6 million from the IFRIC 12 contract; a US$ 9 million increase from the financial reversal less US$ 6 million decrease in financial updates and term deposits; (iii) a US$ 3 million increase in Enel Generación Costanera due mainly to higher interest rates from term deposits and (iv) a US$ 5 million decrease in Enel Brasil due to lower income from term deposits. (b) US$ 60 million of decreased in financial expenses mainly due to: (i) lower financial expenses of US$ 30 million in Edesur, explained mainly by a decrease in mutual interests in CAMMESA of US$ 17 million and a US$ 15 million decrease for the financial correction for client-related fines, (ii) US$ 24 million decrease in Enel Distribución Río mainly due to the US$ 9 million correction of civil provisions, a US$ 5 million decrease in FIDIC financial recharges, a US$ 5 million decrease in regulatory asset and liabilities, a US$ 5 million decrease in bond interests, and (iii) a US$ 4 million decrease in interests from bank loans in Enel Distribución Ceará.
27 Corporate taxes The gains tax levied on companies profits decreased its loss by US$ 33 million, or 24.6% in 2018, which is mainly explained by (i) increased spending of US$ 17 million in Enel Distribución Rio mainly due to better results compared to the same period of the previous year (ii) a US$ 6 million increase due to the incorporation of EGP Volta Grande into the consolidation perimeter (iii) a US$ 11 million increase in Enel Distribución Goiás mainly due to lower registration of deferred taxes from fiscal loss in relation to the same period of the previous year (iv) increased spending in Enel Generación el Chocón and Enel Generación Costanera of US$ 8 and US$ 3 million, respectively as a result of improved financial results in relation to the previous period. This was compensated partially in Enel Américas by US$ 13 million lower spending corresponding to lower income tax with respect to the same period of the previous year.
 a US$ 24 million decrease in Enel Américas S.A. due to the payment of dividends and forward settlement, (ii) a US$ 54 million decrease in Enel Distribución Goiás S.")
28 ANALYSIS OF THE FINANCIAL STATEMENT Enel Américas total assets as of March 31, 2018 increased by US$ 531 million as compared to total assets on March 31, 2017, mainly as a result of: Current assets decreased by US$ 241 million, equivalent to 5.3%, mostly explained by: A US$ 258 million decrease in cash and cash equivalents, composed mostly of (i) a US$ 24 million decrease in Enel Américas S.A. due to the payment of dividends and forward settlement, (ii) a US$ 54 million decrease in Enel Distribución Goiás S.A. mainly due to payment to employeed and legal deposits, (iii) a US$ 22 million decrease in Compañía Eléctrica Fortaleza for immediate liquidity term deposits (iv) a US$ 8 million decrease in term deposits recovery in Edesur (v) a US$ 93 million decrease in Cedensa corresponding to dividend payments, income tax and other tax payments, payments to suppliers (vi) a US$ 31 million decrease in Enel Distribución Perú for the payment of bank loans net of new bond issuance, maturity of term deposits (vii) a US$ 55 million decrease in Emgesa mainly for the payment of dividends, tax payments, net of operating income (viii) a US$ 7 million decrease in Enel Generación Perú mainly corresponding to the payment of loans and interests. This is offset by: (i) a US$ 15 million increase in Enel Generación El Chocón corresponding to term deposits, (iii) a US$ 12 million increase in EGP Volta Grande corresponding mainly to income from energy sales and (iii) in Empresa Eléctrica Chinango S.A. for an increase of USD 5 million due to higher revenues. Increase in other current financial assets US$ 83 million, mainly consisting of (i) a US$ 59 million in Enel Brasil group which is explained by an increase in term deposits > 90 days in Enel Distribución Rio and Enel Distribución Ceará, (ii) a US$ 20 million increase in Emgesa mainly from time deposits > 90 days.
29 A US$ 45 million increase in other current non-financial assets mainly consisting of (i) a US$ 27 million increase in Enel Perú for tax fines and interests claims, (ii) a US$ 5 million increase in Emgesa corresponding to an increases in civil liability policies. A US$ 318 million increase in Commercial receivables and other current accounts receivable corresponding mainly to an increase in (i) Enel Brasil group of US$ 142 accounted for by US$ 129 million in Enel Distribución Río and Enel Distribución Ceará due to an increased recognition of sector assets and liabilities transferred from long term, a US$ 26 million increase in EGP Cachoeira Dourada due to an increase in energy receivables, the above partially offset by a US$ 20 million decrease in receivables in Enel Distribución Goiás, (ii) a US$ 20 million increase in Codensa due to higher accounts receivable in the regulated market (iii) a US$ 102 million increase in Edesur due to higher accounts receivable from customers for tariff increases, (iv) a US$ 41 million increase in Emgesa mainly due to increase in trade accounts receivable due to increase in energy sales (v) a US$ 17 million increase in Enel Distribución Perú due to higher receivables stemming from lower accounts transferred to factoring, (vi) a US$ 9 million increase in Enel Generación Perú corresponding to loss of profit due to the rotor damage in Ventanilla Power Plant. A US$ 33 million Stock increase corresponding mainly to an increase in (i) Enel Brasil group of US$ 17 million corresponding to a US$ 8 million stock recognition from intangible assets in Enel Distribución Ceara and a US$ 12 million in Enel Distribución Río offset by US$ 3 less in materials in Enel Distribución Goiás, (ii) a US$ 7 million increase in Codensa corresponding to the purchase of materials for maintenance, (iii) a US$ 5 million increase in Emgesa for the purchase of liquid fuels and coal and (iv) a US$ 3 million increase in Enel Distribución Perú for the purchase of construction materials. A US$ 17 million increase in Current tax assets which corresponds mainly to (i) a US$ 7 million increase in Enel Distribución Goiás for gains tax and others, (ii) a US$ 2 million increase in Enel Distribución Ceará for taxes recoverable, (iii) a US$ 4 million increase in Enel Distribución Perú corresponding to gains tax recoverable and (iv) a US$ 2 million increase in Enel Generación Perú for gains tax recoverable. A US$ 290 million increase of Non-current assets equivalent to 1.9%, mainly due to: A US$ 44 million increase in Other non-current financial assets mainly due to an increase in accounts receivable as a result of the application of the IFRIC12 in Brazilian distributors Enel Distribución Río and Enel Distribución Ceará due to higher activations during the period totaling US$ 34 million plus the effect of the year s US$ 10 million financial correction.
30 A US$ 14 million increase in Other Non-financial and Non-current assets mainly from Enel Distribución Goiás due to legal deposits. A US$ 37 million decrease in Receivables and other non-current receivables mainly from a US$ 50 million decrease in Enel Brasil group principally due to a US$ 32 million in Enel Distribución Goiás mainly from regulatory assets transferred from short term, a US$ 11 million decrease in Enel Distribución Ceará due to recognitions and transfers of regulatory assets to short term; a US$ 5 million decrease in Enel Distribución Río due to recognitions and transfers of regulatory assets to short term, the above offset by (i) a US$ 5 million increase in accounts receivable from VOSA in Enel Generación El Chocón and US$ 3 million in Central Dock Sud; (iii) a US$ 4 million increase in Codensa for agreements with municipalities. A US$ 265 million increase in Property, plants and equipment mostly comprised of (i) a US$ 113 million increase on account of new investments, (ii) a US$ 251 million increase corresponding to the conversion effects of different functional currencies of the companies in the countries where we operate and (iii) US$ 4 million for other movements, offset partially by US$ 103 million due to amortization and impairment for the period.
 a US$ 131 million increase in")
31 Enel Américas total liabilities and equity as of March 31, 2018 increased by US$ 420 million as compared to the total liabilities and equity as of March 31, 2017, mostly attributable to: Current liabilities increased by US$ 420 million, explained mainly by: A US$ 425 million increase in Other current financial liabilities which is basically explained by (i) a US$ 131 million increase in Codensa due to the transfer of long term bonds and bank loans, (ii) a US$ 61 million increase in Enel Distribución Ceará for long term loan transfer, (iii) a US$ 82 million increase in Enel Distribución Rio for loan transfer and long term bonds, net of loan payment, (iv) a US$ 36 million in Enel Distribución Goiás for the acquisition of bank loans and short term transfers, (v) a US$ 95 million increase in Emgesa for long term bond transfer net of payments, (vi) a US$ 27 million increase in Enel Perú for fixed rate Scotiabank promissory note payment, (vii) a US$ 8 million increase in Enel Central Costanera for long term debt transfer to Mitsubishi, (viii) a US$ 10 million increase in Enel Américas corresponding to Yankee Bond interests and an increase in the value of Forwards. The above was mainly offset by a (i) US$ 15 million decrease in Enel Distribución Perú for the payment of bank loans net of long term debt transfer, (ii) a US$ 9 million decrease in Chinango for the payment of bank loans, (iii) a US$ 3 million decrease in Enel Generación Perú for the payment of bonds net of long-term transfers. A US$ 52 increase in Commercial accounts and other current accounts payable which is essentially explained by (i) US$ 58 in Enel Brasil group mainly due to a US$ 103 decrease in Enel Distribución Goiás due to lower accounts payable to suppliers for the purchase of power, VAT payments and a decrease of sector liabilities, a US$ 47 million decrease in Enel Distribución Ceará corresponding to lower provisions in energy and materials purchases net of long term sector asset and liability transfer, the above offset by a US$ 52 million increase in Enel Distribución Río for the transfer of long term sector assets and liabilities net of payment to suppliers and lower provisions for the purchase of energy and materials, a US$ 22 million increase in EGP Cachoeira Dourada for
32 higher energy purchases, a US$ 9 million increase in Compañía Eléctrica Fortaleza for the purchase of energy, a US$ 4 million increase in Enel Brasil for service payment accounts, (ii) a US$ 19 million decrease in Central Dock Sud for lower provisions in accounts payable, (iii) a US 14 million in Enel Central Costanera for lower provisions in turbo-steam cycle maintenance, (iv) a US$ 18 million in Enel Generación Perú for lower accounts payable to suppliers, (v) a US 21 million decrease in Enel Distribución Perú mainly due to lower accounts payable to contractors, (vi) a US$ 30 million decrease in Enel Américas for the payment of dividends to third parties. The foregoing was partially offset by (i) US$ 45 million in Edesur for the increase in debts and fines to pay to CAMMESA, (ii) US$ 68 million in Emgesa for the increase in third party dividend payments net of accounts payable to suppliers. A US$ 33 million increase in Current Tax Liabilities mainly attributable to US$ 16 million income tax settlement in Emgesa and a US$ 17 million increase in Edesur in income provisions. A US$ 18 million increase in Emgesa of Other current non-financial liabilities mainly attributable to energy sale advances to Electricaribe. Non-current liabilities increased by US$ 141 million, equivalent to a 2.0% variation mostly attributable to: A US$ 102 decrease in Other financial non-current liabilities (financial debt and derivatives) mostly explained by (i) a US$ 96 million decrease in Codensa due to short term bond transfer and a US$ 55 million decrease in Emgesa due to short term bond transfer, (ii) a US$ 20 million decrease in Enel Distribución Ceará due to short term debt transfer, (iii) a US$ 8 million decrease in Enel Generación Perú for short term bond transfer. The above offset by (i) a US$ 24 million decrease in Enel Distribución Goiás for new loans net of short term transfers, (ii) a US$ 27 million in Enel Distribución Río for new loans net of bond transfers and short term loans, (iii) a US$ 30 million for new loans net of short term debt transfers. A US$ 43 million decrease in Other non-current accounts payable mostly explained by (i) a US$ 31 million decrease in Grupo Enel Brasil S.A., US$ 32 million in Enel Distribución Goiás for transfer to short term of regulatory assets and liabilities, (ii) a US$ 6 million decrease in Enel Generación Central Costanera for transfer to short term of CAMMESA mutual, (iii) a US$ 3 million decrease in Edesur that is considered mutual debt increment in CAMMESA of US$ 10 million, offset by the US$ 13 million from the conversion effect stemming from the devaluation of the Argentine peso in relation to the US dollar.
33 The Company s Total Equity increased by US$ 252 million, mostly attributable to: Equity attributable to the property (shareholders) of the controller increased by US$ 277 million mostly due to (i) a US$ 52 million increase in other reserves composed mainly by an increase in difference reserves related to the conversion from exchange of US$ 55 million, offset by a US$ 2 million decrease of cash flow coverage reserve, (ii) US$ 4 million by the registration on January 1, 2018 of the effect of the first application of the new model for the determination of provisions for impairment of financial assets (IFRS 9), and (iii) Increase in profit for the period to March 2018 by US$ 221 million. Non-controlling shareholdings decreased by US$ 25 million mostly explained by (i) a US$ 195 million decrease due to the payment of dividends, (ii) a US$ 1 million decrease for the recognition of the IFRS9 impact from uncollectables. These decreases were partially offset by (i) a US$ 59 increase in integral income and (ii) a US$ 112 million increase for the recognition of profits earned in 2018.

34 The development of the main financial indicators of continuing operations as follows: The Company s Current liquidity as of March 31, 2018 reached 0.89 times, showing a 3 % decrease in relation to December 31, 2017, mostly explained by decreased cash and cash equivalents, as a result of dividend and loan payments carried out in the first quarter of the year. The Company s Acid test as of March 31, 2018 reached 0.84 times, showing a 3.4 % decrease in relation to December 31, 2017, explained by decreased cash and cash equivalents as a result of dividend and loan payments carried out in the first quarter of the year. The Company s Working capital as of March 31, 2018 reached US$ 568 million, representing a decrease in relation to December 31, 2017 mostly explained by decreased cash and cash equivalents as a result of dividend and loan payments carried out in the first quarter of the year. The Company s Leverage (indebtedness ratio) stood at 1.43 times as of March 31, 2018, a 0.7 % decrease in relation to December 31, 2017 mostly on account of reduced dividend and loan payments. The Hedging of financial costs as of the period that ended on March 31, 2018 was 4.08 times, which represents a 62.9 % increase as compared to the same period of the previous year, mainly because of increased tariffs in Edesur.
35 The Return-on-equity (profitability) index, measured in terms of operating income over operating revenues decreased by 10.5 % in relation to the same period of the previous year, reaching 22.5% as of March 31, 2018, mainly due to a higher EBIT. The Return-on-equity of the controller s property owners (shareholders) was 6.4 %, as a result of an increase in the income attributable to the property owners. The Return-on-assets stood at 7.1% as of March 31, 2018 mostly due to income increase for the period.

36 MAIN CASH FLOWS The Company s net cash flows were negative and totaled US$ 266 million as of March 2018, which represents a US$ 783 million increase in relation to the same period of the previous year. The main variables on account of the flows of the operation, investment and financing activities that explain this decrease in net cash flows, as compared to the same period of 2017, are described below: The net cash flows stemming from operating activities totaled US$ 130 million as of March 2018, representing a 36.3% drop in relation to the same period of the previous year. This variation is mostly explained by an increase in the type of collections for operations activities mainly in (i) US$ 474 from collections from the sale and provision of services, (ii) a US$ 19 million charge increase for operations, (iii) a US$ 7 million less from royalties and commissions, (iv) US$ 9 million less from charges related to premiums, services, annual fees and other benefits from endorsed policies. These increases were partially offset by payments in the type of cash payments from operations mainly in (i) US$ 496 million payments to suppliers for the supply of goods and services, (ii) US$ 8 million payments to and on behalf of employees, (iii) US$ 103 million other payments for operation activities (see detail in note 8F of the financial statements), (iv) US$ 9 million lower income tax payments f (vi) US$ 3 million in other cash income and outgoings. The net cash flows coming from (used in) investment activities were outflows of US$ 372 million as of March 2018 explained mainly by (i) US$ 198 million payment for the reimbursement of the incorporation of properties, plants and equipment, (ii) US$ 135 million incorporation of intangible assets from IFRIC 12, (iii) US$ 3 million payments arising from future contracts, term deposits, options and swaps and (iv) US$ 125 million redemption from investment payments of > 90 days. These cash investment outflows were offset (i) US$ 18 million from interests received and (ii) US$ 69 million the redemption from investment payments of > 90 days and (iii) other income of US$ 2 million.
37 The net cash flows coming from (used in) financing activities were outflows totaling US$ 24 million as of March 2018, stemming mainly from (i) US$ 162 million loan payments; (ii) US$ 97 million third party dividend payments, (iii) US$ 94 million interest payments, (iv) US$ 6 million liability payment for financial rental and (v) US$ 13 million other cash outflows. All the above was offset by US$ 348 million flows coming from loans.

38 Below we present the Disbursements of the Incorporation of Properties, Plants and Equipment and their Depreciation for the periods ended in December 2018 and 2017.
39 MAIN RISKS RELATED TO THE ACTIVITIES OF ENEL AMÉRICAS S.A. GROUP The Group s operations are subject to a broad set of governmental regulations, and any changes introduced in them might affect their operations, economic situation and operating income. The Group s operative subsidiaries are subject to a wide range of tariff regulations and other aspects that govern their operations in the countries in which they operate. Consequently, the introduction of new laws or regulations, such as the modification of laws or regulations currently in effect, could impact their operations, economic situation and operating results. Such new laws or regulations sometimes modify regulatory aspects that may affect existing entitlements; which, as the case might be, may adversely affect the group s future results. The Group s operations are subject to wide-ranging environmental regulations that Enel Américas continuously meets. Eventual modifications introduced to such regulations could impact its operations, economic situation and operating income. Enel Américas and its operative subsidiaries are subject to environmental regulations; which, among other things, require preparing and submitting Environmental Impact Studies for projects under study, obtaining licenses, permits and other mandatory authorizations and complying with all the requirements imposed by such licenses, permits and regulations. Just as with any regulated company, Enel Américas cannot guarantee that: Public authorities will approve such environmental impact studies; Public opposition will not derive in delays or modifications to any proposed project; Laws or regulations will not be modified or interpreted in a manner such as to increase expenses or affect the Group s operations, plants or plans. The Commercial activity of the group has been planned in order to moderate eventual impacts resulting from changes in the hydrologic conditions. The operations of the Enel Américas Group include hydroelectric generation and, therefore, they depend from the hydrological conditions that exist at each moment in the broad geographical areas where the Group s hydroelectric generation facilities are located. If the hydrological conditions generate droughts or other conditions that may negatively impact hydroelectric generation, then, the outcome will be adversely affected, reason why Enel has established -as an essential part of its commercial policy - to refrain from contractually committing 100% of its generation capacity. The electric business, in turn, is also affected by atmospheric conditions such as mean temperatures that condition consumption.
ENERSIS ANNOUNCES CONSOLIDATED RESULTS FOR THE PERIOD ENDED ON SEPTEMBER 30, Highlights for the Period
 ENERSIS ANNOUNCES CONSOLIDATED RESULTS FOR THE PERIOD ENDED ON SEPTEMBER 30, 2014 Highlights for the Period The company s total EBITDA in the first nine months of the year amounted to Ch$ 1,521,114 million,
ENERSIS PRESS RELEASE CONSOLIDATED FINANCIAL STATEMENTS
 ENERSIS ANNOUNCES CONSOLIDATED RESULTS FOR THE PERIOD ENDED ON SEPTEMBER 30, 2015 Enersis EBITDA as of September 2015 amounted to Ch$ 1,636,989 million, 7.6% higher than last year during the same period,
ENERSIS ANNOUNCES CONSOLIDATED RESULTS FOR YEAR ENDED ON DECEMBER 31, Highlights for the Period SUMMARY
 ENERSIS ANNOUNCES CONSOLIDATED RESULTS FOR YEAR ENDED ON DECEMBER 31, 2011 Highlights for the Period SUMMARY 2011 confirmed the strong growth in demand for electricity in the countries where we operate,
Enel Américas FY 2017 results
 Enel Américas FY 2017 results Highlights of the period EBITDA of 2,947 musd, an increase of 21% vs 2016 13% increase in Gx and 25% increase in Dx Net Income of 1,127 musd, an increase of 33% vs 2016 1
Enel Américas 1H 2018 results
 Enel Américas 1H 2018 results Highlights of the period EBITDA of 1,652 musd, an increase of 19% vs 1H 2017 despite a negative fx scenario in Argentina and Brazil Generation EBITDA increased by 14% due
ENEL CHILE GROUP CONSOLIDATED FINANCIAL STATEMENTS AS OF MARCH 31, 2017 (Amounts expressed in millions of Chilean Pesos)
") ENEL CHILE GROUP CONSOLIDATED FINANCIAL STATEMENTS AS OF (Amounts expressed in millions of Chilean Pesos) Revenues of Enel Chile reached Ch$ 594,438 representing a 166% increase when compared with March
ENEL CHILE GROUP CONSOLIDATED FINANCIAL STATEMENTS AS OF (Amounts expressed in millions of Chilean Pesos) Revenues of Enel Chile reached Ch$ 594,438 representing a 166% increase when compared with March
ENERSIS ANNOUNCES CONSOLIDATED RESULTS FOR THE PERIOD ENDED ON SEPTEMBER 30, Highlights for the Period SUMMARY
 ENERSIS ANNOUNCES CONSOLIDATED RESULTS FOR THE PERIOD ENDED ON SEPTEMBER 30, 2011 Highlights for the Period SUMMARY The first nine months of the year confirmed the strong growth in demand for electricity
enersis 1H 2013 results
 07 25 2013 enersis 1H 2013 results Highlights Average demand 1 growth in LatAm reaches +3.5% improving the trend vs 1Q13 The GAP of hydro generation caused by the persistence of droughts in the region
C O U R T E S Y T R A N S L A T I O N
 REFERENTIAL EXPERT'S REPORT ON THE ESTIMATED VALUE OF THE MERGING ENTITIES (Endesa Americas S.A. and Chilectra Americas S.A. in Enersis Americas S.A.) AND THE ESTIMATES REGARDING THE EXCHANGE RATIO OF
Presentation to Investors May, 2006
 Presentation to Investors May, 26 Business Structure Distribution (Dx) US$ 1.5 billion assets 48% of total EBITDA* > 11.3 million clients 61 % Generation (Gx) US$ 9.5 billion assets 51% of total EBITDA*
FORM 20-F ENERSIS S.A.
 SECURITIES AND EXCHANGE COMMISSION Washington, D.C. 20549 FORM 20-F REGISTRATION STATEMENT PURSUANT TO SECTION 12(b) OR 12(g) OF THE SECURITIES EXCHANGE ACT OF 1934 OR ANNUAL REPORT PURSUANT TO SECTION
FORM 20-F. ENERSIS S.A. (Exact name of Registrant as specified in its charter)
") SECURITIES AND EXCHANGE COMMISSION Washington, D.C. 20549 FORM 20-F REGISTRATION STATEMENT PURSUANT TO SECTION 12(b) OR 12(g) OF THE SECURITIES EXCHANGE ACT OF 1934 OR ANNUAL REPORT PURSUANT TO SECTION
SECURITIES AND EXCHANGE COMMISSION Washington, D.C. 20549 FORM 20-F REGISTRATION STATEMENT PURSUANT TO SECTION 12(b) OR 12(g) OF THE SECURITIES EXCHANGE ACT OF 1934 OR ANNUAL REPORT PURSUANT TO SECTION
ENDESA CHILE ANNOUNCES CONSOLIDATED RESULTS FOR THE PERIOD ENDED MARCH 31, 2005
 FOR IMMEDIATE RELEASE For further information contact: Jaime Montero Investor Relations Director Endesa Chile (56-2) 634-2329 jfmv@endesa.cl Tomás González tgonzalez@endesa.cl Irene Aguiló iaguilo@endesa.cl
Latam Reorganization. November 6 th, 2015
 Latam Reorganization November 6 th, 2015 Important Legal Information This presentation does not constitute an offer to sell any securities and is not soliciting an offer to buy any securities in any jurisdiction.
ENERSIS ANNOUNCES CONSOLIDATED RESULTS FOR FIRST QUARTER ENDED MARCH 31 st, 2009
 ENERSIS ANNOUNCES CONSOLIDATED RESULTS FOR FIRST QUARTER ENDED MARCH 31 st, 2009 These Financial Statements have been prepared, for the first time, under IFRS. It implies several changes in the accounting
ENDESA, S.A. and Subsidiaries. Consolidated Management Report for the six-month period ended 30 June 2014
 ENDESA, S.A. and Subsidiaries Consolidated Management Report for the six-month period ended 30 June Madrid, 30 July ENDESA, S.A. AND SUBSIDIARIES 1 CONSOLIDATED MANAGEMENT REPORT FOR THE SIX-MONTH PERIOD
SECURITIES AND EXCHANGE COMMISSION Washington, D.C FORM 20-F
 SECURITIES AND EXCHANGE COMMISSION Washington, D.C. 20549 FORM 20-F REGISTRATION STATEMENT PURSUANT TO SECTION 12(b) OR 12(g) OF THE SECURITIES EXCHANGE ACT OF 1934 OR ANNUAL REPORT PURSUANT TO SECTION
JUNE
 JUNE 2005 www.endesachile.cl INDEX BUSINESS RESULTS COUNTRY ANALYSIS BUSINESS OUTLOOK CONCLUSIONS BUSINESS Highlights One of the largest private power producers in Latin America, with plants in Argentina,
NET INCOME AT 765 MILLION EUROS IN THE FIRST HALF OF 2014
 NET INCOME AT 765 MILLION EUROS IN THE FIRST HALF OF 2014 Compared to the first half of 2013, net income declined by 31.3%. EBITDA fell by 17.7% in the first six months of the year, to 2,911 million euros.
AES GENER Q RESULTS
 AES GENER Q1 2016 RESULTS AES Gener recorded an EBITDA of ThUS$157,603 during the first quarter of 2016, similar to the EBITDA recorded in the same period in 2015. Net income of ThUS$41,033 recorded as
Endesa Chile IR presentation As of September 2013
 Endesa Chile IR presentation As of September 2013 Ownership Structure 92% ENERSIS 61% 12% 3% 4% 6% 15% 60% Chilean Pension Funds Institutional Shareholders ADR Holders 60% Minority Shareholders Other Institutional
EMPRESA NACIONAL DE ELECTRICIDAD S.A. (Exact name of Registrant as specified in its charter)
") SECURITIES AND EXCHANGE COMMISSION Washington, D.C. 20549 FORM 20-F [ ] REGISTRATION STATEMENT PURSUANT TO SECTION 12(b) OR 12(g) OF THE THE SECURITIES EXCHANGE ACT OF 1934 OR [X] ANNUAL REPORT PURSUANT
SECURITIES AND EXCHANGE COMMISSION Washington, D.C. 20549 FORM 20-F [ ] REGISTRATION STATEMENT PURSUANT TO SECTION 12(b) OR 12(g) OF THE THE SECURITIES EXCHANGE ACT OF 1934 OR [X] ANNUAL REPORT PURSUANT
ENDESA CHILE ANNOUNCES CONSOLIDATED RESULTS FOR THE PERIOD ENDED DECEMBER 31, 2001.
 FOR IMMEDIATE RELEASE For further information contact: Jaime Montero, Giovano Suazo Investor Relations Endesa Chile (56-2) 634-2329 gsuazo@endesa.cl ENDESA CHILE ANNOUNCES CONSOLIDATED RESULTS FOR THE
ENDESA CHILE ANNOUNCES CONSOLIDATED RESULTS FOR THE PERIOD ENDED MARCH 31, 2006
 FOR IMMEDIATE RELEASE For further information contact: Jaime Montero Investor Relations Director Endesa Chile (56-2) 634-2329 jfmv@endesa.cl Tomás González tgonzalez@endesa.cl Irene Aguiló iaguilo@endesa.cl
endesa 1H 2012 results
 27 07 2012 endesa 1H 2012 results Market context 1H 2012 Demand consolidated results 1H 2012 Spain: adjusted demand decrease due to industry Spain (1) Endesa distribution area +0.8% Industry -1.8% Services
The best way to balance your investments in the growing electric sector in South America
 The best way to balance your investments in the growing electric sector in South America 0 AGENDA 1.- Introduction 2.- Fundamentals 3.- Financial Analysis 4.- Enersis future 1 2008: YEAR OF STOCK MARKET
Enel Américas. Corporate Presentation, March 2018
 Enel Américas Corporate Presentation, March 2018 Enel Américas Overview Enel Américas overview 1 Enel Américas is Latin America s largest private power company Colombia Generation 3,467 MW 21% Market Share
Endesa Chile IR presentation As of December 2013
 Endesa Chile IR presentation As of December 2013 Ownership Structure 92% ENERSIS 61% 12% 3% 4% 6% 15% 60% Chilean Pension Funds Institutional Shareholders ADR Holders 60% Minority Shareholders Other Institutional
AES GENER 2015 YEAR-END RESULTS
 AES GENER 2015 YEAR-END RESULTS Net income recorded as of December 31, 2015 was ThUS$264,874, representing a 44% increase compared to the previous year. AES Gener recorded EBITDA of ThUS$691,068 during
ENDESA CHILE ANNOUNCES CONSOLIDATED RESULTS FOR THE PERIOD ENDED SEPTEMBER 30, 2006
 FOR IMMEDIATE RELEASE For further information contact: Jaime Montero Investor Relations Director Endesa Chile (56-2) 634-2329 jfmv@endesa.cl Tomás González tgonzalez@endesa.cl Irene Aguiló iaguilo@endesa.cl
ENDESA CHILE ANNOUNCES CONSOLIDATED RESULTS FOR THE YEAR ENDED DECEMBER 31st, Highlights for the Period
 ENDESA CHILE ANNOUNCES CONSOLIDATED RESULTS FOR THE YEAR ENDED DECEMBER 31st, 2010 Highlights for the Period SUMMARY Consolidated physical sales declined by 5.4% to 56,641 GWh, mainly in Colombia, Argentina
endesa chile YE 2012 results
 31 01 2013 endesa chile YE 2012 results Highlights of 2012 Lower hydro generation in Chile, mainly explained by a third consecutive year of a severe drought. 6% growth of installed capacity in Chile, related
Now, please join me in slide 3 to begin. Let s start with the highlights for the period:
 Conference Call Codensa and Emgesa 1H2017 July 25, 2017 Good morning and thank you for joining us today in our investor conference call. My name is Daniele Caprini, I am the CFO of Emgesa and Codensa,
ENERSIS. Initiating Coverage. Investment Thesis and Recommendation. Risks. Target Price: CLP 180 Recommendation: Hold Risk: Medium
 ENERSIS Target Price: CLP 180 Recommendation: Hold Risk: Medium November, 12th 2012 Sector: Electricity & Energy Analyst: Sergio Zapata sergio.zapata@corpgroup.cl T: +562 660 2243 Company Information Ticker:
Endesa Chile IR Presentation. As of December 2011
 Endesa Chile IR Presentation As of December 2011 Our company Multinational electricity generation company based in Chile Vast experience, with over 68 years of history Leading position in most of the countries
Endesa Chile IR Presentation
 Endesa Chile IR Presentation As of March 31, 2014 2 Organization structure ITALY 92% Committed Shareholders SPAIN 61% ENERSIS CHILE Chilean Pension Funds 60% 6% 3%3%13% 15% 60% Institutional Shareholders
Endesa Chile IR Presentation 1H 2016
 Endesa Chile IR Presentation 1H 2016 Organization structure Endesa Chile (before Spin-Off) ITALY Committed Shareholders 61% 60% CHILE 6% 4% 14% Enersis S.A. Chilean Pension Funds ADRs (Citibank N.A.) 16%
ENEL AMERICAS S.A. FORM 20-F. (Annual and Transition Report (foreign private issuer)) Filed 04/03/14 for the Period Ending 12/31/13
) Filed 04/03/14 for the Period Ending 12/31/13") ENEL AMERICAS S.A. FORM 20-F (Annual and Transition Report (foreign private issuer)) Filed 04/03/14 for the Period Ending 12/31/13 Telephone 562-2353-4639 CIK 0000912505 Symbol ENIA SIC Code 4911 - Electric
ENEL AMERICAS S.A. FORM 20-F (Annual and Transition Report (foreign private issuer)) Filed 04/03/14 for the Period Ending 12/31/13 Telephone 562-2353-4639 CIK 0000912505 Symbol ENIA SIC Code 4911 - Electric
ENDESA, S.A. and Subsidiaries. Consolidated Management Report for the First Quarter 2013
 ENDESA, S.A. and Subsidiaries Consolidated Management Report for the First Quarter 2013 Madrid, 7 May 2013 1 Contents Analysis for the period 3 Consolidated results 4 Results by business line 10 Business
AES GENER JUNE 2017 RESULTS 2017 YEAR TO DATE HIGHLIGHTS AES GENER/ 2017
 AES GENER JUNE 2017 RESULTS AES Gener achieved its highest ever LTM EBITDA US$813 million in the twelve months ended June 30, 2017. Year-to-date EBITDA reached US$380 million, 10% higher compared to the
Enel Américas. Strategic Plan November 30 th, 2017
 Enel Américas Strategic Plan 2018-20 November 30 th, 2017 Strategic Plan 2018-20 Agenda Enel Américas today Previous Plan Delivery 2017-19 Strategic pillars new plan 2018-20: Industrial growth: Organic
Endesa Chile IR Presentation 1Q 2016
 Endesa Chile IR Presentation 1Q 2016 Organization structure Endesa Chile (before Spin-off) ITALY Committed Shareholders 61% 60% CHILE 6% 4% 14% Enersis S.A. Chilean Pension Funds ADRs (Citibank N.A.) 16%
Endesa Chile 1H15 Results. July 28th,2015
 Endesa Chile 1H15 Results July 28th,2015 Highlights Consolidated generation rose by 8% Consolidated EBITDA increased by 9% Significant improvement in Chile Bocamina II restarted its operations El Quimbo
Empresa Nacional de Electricidad S.A. - Chile Current Report on Form 6-K
 May 2, 2001 Securities And Exchange Commission 450 Fifth Street, N.W. Washington, D.C. 20549 U.S.A. Attention:Filing Desk Re: Empresa Nacional de Electricidad S.A. - Chile Current Report on Form 6-K Empresa
ENDESA, S.A. and Subsidiaries. Consolidated Management Report for the First Quarter of 2014
 ENDESA, S.A. and Subsidiaries Consolidated Management Report for the First Quarter of Madrid, 7 May 1 ENDESA, S.A. AND SUBSIDIARIES CONSOLIDATED MANAGEMENT REPORT FOR THE FIRST QUARTER OF Contents 1. Analysis
Enel Chile 1H 2018 consolidated results. July 27 th, 2018
 Enel Chile 1H 2018 consolidated results July 27 th, 2018 Chilean highlights EBITDA increased 11% driven by the consolidation of EGP and a better generation mix Net income, excluding the effect of the sale
Enel Américas Strategic Plan
 Enel Américas Strategic Plan 2019-21 Maurizio Bezzeccheri CEO Aurelio Bustilho CFO Enel Américas Strategic Plan Agenda Maurizio Bezzeccheri Delivery 2016-18 Enel Américas today Energy transition and new
Endesa Chile IR Presentation
 Endesa Chile IR Presentation As of December 31, 2014 Organization structure ITALY Committed Shareholders 61% CHILE Enersis S.A. 60% 3% 3% 15% 18% 60% Chilean Pension Funds ADRs (Citibank N.A.) Retail CHILE
Enel Américas. Corporate Presentation, March 2018
 Enel Américas Corporate Presentation, March 2018 Enel Américas Overview Enel Américas overview 1 Enel Américas is Latin America s largest private power company Colombia Generation 3,467 MW 21% Market Share
AES GENER 2014 YEAR-END RESULTS
 AES GENER 2014 YEAR-END RESULTS AES Gener recorded EBITDA of ThUS$671,215 during 2014, 8% higher than the EBITDA recorded in 2013. Net income recorded as of December 31, 2014 was ThUS$183,651 EBITDA increased
UNITED STATES SECURITIES AND EXCHANGE COMMISSION WASHINGTON, D.C FORM 20-F
 UNITED STATES SECURITIES AND EXCHANGE COMMISSION WASHINGTON, D.C. 20549 FORM 20-F REGISTRATION STATEMENT PURSUANT TO SECTION 12(b) OR 12(g) OF THE SECURITIES EXCHANGE ACT OF 1934 OR ANNUAL REPORT PURSUANT
Interim Financial Report at March 31, 2018
 Interim Financial Report at March 31, 2018 Contents Our mission... 3 Foreword... 4 > Enel organizational model... 7 Summary of results... 8 Results by business area... 19 > Italy... 22 > Iberia... 27 >
Interim Financial Report at September 30, 2015
 Interim Financial Report at September 30, 2015 Contents Our mission... 4 Introduction... 7 Summary of results... 9 Results by business area... 21 > Italy... 26 > Iberian Peninsula... 33 > Latin America...
endesa 1H 2013 results
 31 07 2013 endesa 1H 2013 results consolidated results 1H 2013 Spain: demand decrease in all categories of clients, particularly in the services segment Spain (1) -2.6% -2.4% -3.8% Not adjusted (1) Mainland.
HIGHLIGHTS FOR THE PERIOD [All figures in Chilean Pesos]
![HIGHLIGHTS FOR THE PERIOD [All figures in Chilean Pesos]](/thumbs/86/94553203.jpg "HIGHLIGHTS FOR THE PERIOD [All figures in Chilean Pesos]") First Quarter 2008 Market Information ENERSIS ANNOUNCES CONSOLIDATED RESULTS FOR THE FIRST QUARTER ENDED MARCH 31, 2008 HIGHLIGHTS FOR THE PERIOD [All figures in Chilean Pesos] ECONOMIC-FINANCIAL SUMMARY
First Quarter 2008 Market Information ENERSIS ANNOUNCES CONSOLIDATED RESULTS FOR THE FIRST QUARTER ENDED MARCH 31, 2008 HIGHLIGHTS FOR THE PERIOD [All figures in Chilean Pesos] ECONOMIC-FINANCIAL SUMMARY
Conference Call Codensa and Emgesa FY 2015 February 29, 2016
 Conference Call Codensa and Emgesa FY 2015 February 29, 2016 Good Morning Everyone. Thank you very much for joining us today, and welcome to our quarterly Investor conference call. My name is Leonardo
Fourth Quarter and full year 2017 Financial Report
 Medellin, April 3, 2018 EPM Group announces consolidated financial results as of December 31, 2017 Empresas Públicas de Medellin E.S.P. and subsidiaries (hereinafter, "EPM Group") is the holding company
AES GENER 3Q-2017 RESULTS 2017 YEAR TO DATE HIGHLIGHTS AES GENER/ 2017
 AES GENER 3Q-2017 RESULTS AES Gener achieved LTM EBITDA US$769 million in the twelve months ended September 30, 2017. Year-to-date EBITDA reached US$562 million, 2% lower compared to the EBITDA recorded
Endesa Chile. Investor Relations Presentation. November 2007
 Endesa Chile Investor Relations Presentation November 2007 1 Agenda 1. Who we are 2. Company s Environment 3. Financial Aspects 4. Strategic Aspects and Projects 5. Social Commitment 2 Our Business and
endesa FY 2012 results
 27 02 2013 endesa FY 2012 results consolidated results FY 2012 Business context in 2012 Demand Spain: demand decrease due to lower industrial activity Spain (1) Endesa distribution area (2) -0.5% -1.3%
Conference Call Codensa and Emgesa 1Q2017 April 27 nd, Good morning and thank you for joining us today in our investor conference call.
 Conference Call Codensa and Emgesa 1Q2017 April 27 nd, 2017 Good morning and thank you for joining us today in our investor conference call. My name is Daniele Caprini, I am the CFO of Emgesa and Codensa,
ENDESA, S.A. and Subsidiaries. Consolidated Management Report for the period January-September 2017
 ENDESA, S.A. and Subsidiaries Consolidated Management Report for the period Madrid, 7 November, ENDESA, S.A. AND SUBSIDIARIES CONSOLIDATED MANAGEMENT REPORT FOR THE PERIOD JANUARY-SEPTEMBER Index. 1. Business
endesa 1H 2014 results
 30 07 2014 endesa 1H 2014 results consolidated results 1H 2014 Business context in 1H 2014 Demand Spain: shift in demand trend supported by industrial segment Spain (1) +0.1% -1.2% Endesa distribution
endesa chile 1Q 2012 results
 25 04 2012 endesa chile 1Q 2012 results Highlights in 1Q 2012 Growth of 7% in electricity demand in the region Growth of 2% in physical sales on a consolidated basis Growth of 9% in operating costs, primarily
Endesa Chile Roadshow 2006
 Endesa Chile Roadshow 2006 1 Index Introduction Where We Stand Financial Profile Operating & Financial Results Conclusions 2 Endesa Chile Strengths & Opportunities Highly Efficient Generation Assets Increasing
INTERIM FINANCIAL REPORT AT MARCH 31, 2016
 INTERIM FINANCIAL REPORT AT MARCH 31, 2016 Interim Financial Report at March 31, 2016 Contents Our mission 4 Foreword 5 Summary of results 8 Results by business area 16 > Italy 20 > Iberian Peninsula
Endesa Chile IR presentation. As of June 2012
 Endesa Chile IR presentation As of June 2012 Our company Multinational electricity generation company based in Chile Vast experience, with over 69 years of history Efficient and diversified investment
Tarjetas Cuyanas S.A.
 Condensed Interim Financial Statements For the six-month period beginning January 1, 2012 and ended June 30, 2012, presented on a comparative basis Condensed Interim Financial Statements For the six-month
Half-Year Financial Report at June 30, 2018
 Half-Year Financial Report at June 30, 2018 Contents Interim report on operations... 5 Our mission... 6 Enel organizational model... 7 Corporate boards... 8 Summary of results... 9 Overview of the Group
MANAGEMENT S DISCUSSION AND ANALYSIS OF FINANCIAL CONDITION AND RESULTS OF OPERATIONS
 MANAGEMENT S DISCUSSION AND ANALYSIS OF FINANCIAL CONDITION AND RESULTS OF OPERATIONS You should read this discussion in conjunction with (i) the information set forth in Summary Financial and Operating
ENDESA, S.A. and Subsidiaries. Consolidated Management Report for the nine-month period ended 30 September 2013
 ENDESA, S.A. and Subsidiaries Consolidated Management Report for the nine-month period ended 30 September 2013 Madrid, 6 November 2013 1 ENDESA, S.A. AND SUBSIDIARIES MANAGEMENT REPORT FOR THE NINE-MONTH
CONSOLIDATED FINANCIAL STATEMENTS Guacolda Energía S.A. and Subsidiary For the years ended December 31, 2015 and 2014
 CONSOLIDATED FINANCIAL STATEMENTS Guacolda Energía S.A. and Subsidiary For the years ended and This document includes the following sections: - Independent Auditor s Report - Consolidated Statements of
TGS Announces Results for the First Quarter 2017
 Contacts in Buenos Aires, Argentina Investor Relations Leandro Perez Castaño, Finance & IR Manager leandro_perez@tgs.com.ar Carlos Almagro, Investor Relations calmagro@tgs.com.ar Tel: (+5411) 4865-9077
Interim Financial Report at September 30, 2017
 Interim Financial Report at September 30, 2017 Contents Our mission...3 Introduction...6 Summary of results... 8 Group performance... 15 Results by business area... 22 > Italy... 27 > Iberia... 34 > Latin
1Q-2018 Earnings Call. May 8th, 2018
 1Q-2018 Earnings Call May 8th, 2018 Disclaimer This presentation is not an offer for sale of securities. This material has been prepared solely for informational purposes and is not to be construed as
First Quarter 2018 Financial Report
 Medellin, May 8, 2018 EPM Group announces consolidated financial results as of March 31, 2018 Empresas Públicas de Medellin E.S.P. and subsidiaries (hereinafter, "EPM Group") is the holding company of
Business Strategy. Enel Américas Analyst Update Meeting
 Business Strategy Enel Américas Analyst Update Meeting Enel Américas overview Enel Américas is Latin America s largest private power company Colombia Generation 3,457 MW 21% Market Share in Installed capacity
Fourth Quarter 2016 Financial Report
 Medellin, April 5,2016 Empresas Públicas de Medellin E.S.P. (hereinafter, "EPM Group") is the holding company of a multi-latin enterprise group formed by 45 companies and one structured entity, that have
September 13 & 14 RESULTS 2 ND QUARTER 2016
 September 13 & 14 RESULTS 2 ND QUARTER 2016 Cencosud achieved an improvement on second quarter results despite a more challenging economic environment and deceleration in consumption in the region. This
endesa FY 2011 results
 29 02 2012 endesa FY 2011 results consolidated results FY 2011 Market context in 2011 Demand Spain: demand decrease mainly due to residential and SME -1.2% (1) Spain 0.2% (2) Industry Services Residential
FIRST QUARTER 2011 RESULTS
 FIRST QUARTER 2011 RESULTS ISA ANNOUNCES FIRST QUARTER RESULTS 2011 Medellín, Colombia, May 2, 2011 Interconexión Eléctrica S.A. E.S.P ISA (BVC: ISA; OTC: IESFY) ( ISA or the Company ), a Colombian organization
GEOPARK LIMITED CONSOLIDATED FINANCIAL STATEMENTS. As of and for the year ended 31 December 2017
 CONSOLIDATED FINANCIAL STATEMENTS As of and for the year ended 31 December 2017 Contents 2 Report of Independent Registered Public Accounting Firm 3 Consolidated Statement of Income 4 Consolidated Statement
Enel Generación Chile. Investor Relations Presentation 9M 2016
 Enel Generación Chile Investor Relations Presentation 9M 2016 Organization structure Enel Generación Chile (after Spin Off) 61% ENEL SpA ITALY Committed Shareholders 60% ENEL CHILE CHILE 3% 3% 18% Enersis
Interim Financial Report at March 31, 2017
 Interim Financial Report at March 31, 2017 Contents Our mission... 3 Foreword... 4 Summary of results... 8 Results by business area... 17 Italy... 20 Iberia... 24 Latin America... 28 Europe and North Africa...
Efficiency and Proximity EARNINGS RELEASE FOURTH QUARTER Edenor S.A. 4Q 18 Earnings Release
 Efficiency and Proximity EARNINGS RELEASE FOURTH QUARTER 2018 1 Results for the fourth quarter 2018 Ticker: EDN Ratio: 20 Class B = 1 ADR Share Cap. Net of repurchases: 878 million shares 43.9 million
ENDESA CHILE ANNOUNCES CONSOLIDATED RESULTS FOR THE PERIOD ENDED DECEMBER 31, 2006
 FOR IMMEDIATE RELEASE For further information contact: Jaime Montero Investor Relations Director Endesa Chile (56-2) 634-2329 jfmv@endesa.cl Tomás González tgonzalez@endesa.cl Irene Aguiló iaguilo@endesa.cl
endesachileirpresentation AS OF SEPTEMBER 30th, 2010
 endesachileirpresentation AS OF SEPTEMBER 30th, 2010 whoisendesachile? A unique portfolio in Latam s Generation business Colombia N 1 2,914 MW inst. capacity 21% market share Brazil 987 MW inst. capacity
2017-4Q17 E A R N I N G S R E L E A S E
 E A R N I N G S R E L E A S E 2017-4Q17 January 01, 2017 December 31, 2017 SONDA S.A. and subsidiaries announce their consolidated financial results for the period from January 01 to December 31, 2017.
ANÁLISIS RAZONADO MEMORIA ANUAL 2015
 LATAM AIRLINES GROUP RESULTS Comparative analysis and explanation of the main trends: 1. Consolidated Statement of Financial Position As of December 31, 2015 Total Assets of the Company reached US$ 18,101,418
Quarterly Information - ITR 1Q16
 Quarterly Information - ITR 1Q16 CNPJ Nº 02.474.103/0001-19 / NIRE Nº 42 3 0002438-4 Address: Rua Paschoal Apóstolo Pítsica, 5064 Agronômica Florianópolis SC CEP 88025-255 Index Company Information Capital
Grupo Energía de Bogotá
 Grupo Energía de Bogotá 2016 Key Results and Developments March 23 rd 2017 1 Disclaimer The information provided herein is for informational and illustrative purposes only and is not, and does not seek
GERDAU S.A. AND SUBSIDIARIES CONSOLIDATED INTERIM FINANCIAL STATEMENTS AS OF JUNE 30, 2008 AND 2007 Prepared in accordance with the International
 CONSOLIDATED INTERIM FINANCIAL STATEMENTS AS OF JUNE 30, 2008 AND 2007 Prepared in accordance with the International Financial Reporting Standards ( IFRS ) as issued by the International Accounting Standards
Quarterly information ITR-3Q13
 Quarterly information ITR-3Q13 TRACTEBEL ENERGIA S.A. September 30 th, 2013 Rua Paschoal Apóstolo Pítsica, n 5064, Agronômica - Florianópolis (SC), CEP 88025-255 Index Company Information Capital Composition
Highlights of the second quarter of 2017
 Highlights of the second quarter of Consolidated Highlights EBITDA of R$ 1.1 billion in 2Q17, with EBITDA margin expansion in relation to 2Q16 and 1Q17. Selling, general and administrative expenses declined
Below we present the main impacts on the financial statements as of December 31, 2014 resulting from the change of standards.
 Empresas Públicas de Medellín E.S.P. (hereinafter, "EPM" or the "company") is the parent company of an economic group consisting of 48 companies with presence in Colombia, Chile, El Salvador, Guatemala,
Grupo Albanesi Results Review Results Review
 Grupo Albanesi April 2017 Disclaimer This Earnings Presentation provides information about the Companies and, in no case, constitutes a comprehensive analysis of the financial, operative and sales situation
GRUPO ENERGÍA DE BOGOTA 3Q 2015 Key Results and Developments
 GRUPO ENERGÍA DE BOGOTA 3Q 2015 Key Results and Developments November 25 th, 2015 Agenda I. EEB Overview and Key Updates 3Q 2015 II. Expansion Projects Review III. Financial Review 3Q 2015 IV. Questions
Agenda. Relevant events. Energy market. Work progress in main project: Ituango. Financial results as of Sept. 2017
 3Q2017 Report Agenda Relevant events Energy market Work progress in main project: Ituango Financial results as of Sept. 2017 Note: please, see disclaimer at the end of the presentation. 2 Relevant events
Cencosud S.A. (Translation of registrant s name into English)
") UNITED STATES SECURITIES AND EXCHANGE COMMISSION Washington, D.C. 20549 FORM 6 - K Report of Foreign Private Issuer Pursuant to Rule 13a - 16 or 15d - 16 under the Securities Exchange Act of 1934 For the
UNITED STATES SECURITIES AND EXCHANGE COMMISSION Washington, D.C. 20549 FORM 6 - K Report of Foreign Private Issuer Pursuant to Rule 13a - 16 or 15d - 16 under the Securities Exchange Act of 1934 For the
Adjusted EBITDA ,5% ,9% Adjusted EBITDA Margin (%) 7,7% 9,3% -160 bps 7,4% 6,2% 119 bps
 7,7% 9,3% -160 bps 7,4% 6,2% 119 bps") Earnings Release Fourth Quarter 2016 Financial Highlights Full Year 2016 Consolidated revenues reached CLP 10,333,001 million, down 6.0% versus 2015 (+7.9% in constant exchange rate), explained by currency
Earnings Release Fourth Quarter 2016 Financial Highlights Full Year 2016 Consolidated revenues reached CLP 10,333,001 million, down 6.0% versus 2015 (+7.9% in constant exchange rate), explained by currency