Investor Presentation
|
|
|
- Baldric Watts
- 5 years ago
- Views:
Transcription
1 Investor Presentation

2 Awards and Accolades IDRBT Award for the Best Bank Among Small Banks for Digital Banking, on IDRBT Award for the Best Bank Among Small Banks for Managing IT Ecosystem, on Dun & Bradstreet Banking Awards 2016, Karur Vysya Bank has been awarded the Best Private Sector Bank Priority Sector Lending on FE India s Best Banks Award, KVB is the winner in Credit Quality category for the year received on Karur Vysya Bank has been selected as The Best Bank at National Level under Private Sector category for the year in the State Forum of Bankers Clubs Kerala (SFBCK) Banking Excellence Award 2016 on Karur Vysya Bank has received NSDL star performer award for the top performer in new accounts opened under Bank Category - 2 nd position on Award for Solar irrigation pump scheme Ministry of New & Renewable Energy, Government of India has selected Karur Vysya Bank for 1 st prize for having achieved highest disbursement under the category Solar irrigation pumps Off grid & decentralized solar applications programe for the FY on Business Today KPMG Award Best Small Bank for FY announced in January
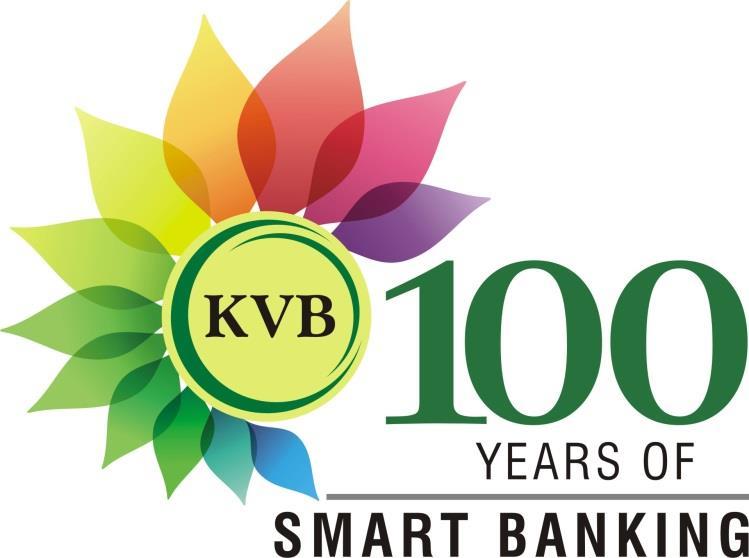
3 About Us Banking tradition of 100 years Earning profits since its inception Declaration of uninterrupted dividend 100% and above dividend for 15 years consecutively from 2004, out of which 120% for five years Dividend of 130% for two years and 140% for two years First bank to get permission from RBI to issue bonus shares 706 branches and 1711 ATMs as on 31 st December 2016 A Customer Base of 6.09 million Fully on CBS facility since 2005 and all latest technology products are available Top Rating from CRISIL (A1+) and ICRA (A1+) for Short Term Borrowings 3
4 Q3FY17 Results Snapshot Deposits Rs. 55,066 crore ( 16.33%) Advances Rs. 38,459 crore ( 1.54%) CASA Rs.16,973crore ( 53.26%) (30.80% as %of Total Deposits) Branches 706 ATMs 1711 Net Profit Rs. 116 crore ( 24.25%) ROA 0.74% (Q3FY %) NIM 3.68% (Q3FY %) Net NPA 1.68% (Q3FY %) 4
5 9Months FY17 Results Snapshot Net Profit Rs. 388 crore ( 10%) ROA 0.87% (9 month FY %) NIM 3.62% (9 month FY %) ROE 10.35% (9 month FY %) 5
6 Profit & Loss Account Units: Rs crore Particulars Quarter Ended Q3FY17 Q3FY16 YoY% Net Interest Income % Other Income (-)2% Total Income % Operating Expenses % Operating Profit (-)17% Operating Profit before amortisation of loss on sale of assets to ARC % Provisions % Credit Related Others Profit Before Tax (-)24% Tax (-)23% Net Profit (-)25% 6
7 Profit & Loss Account Particulars 9 months Ended FY 17 FY16 YoY% Units: Rs crore Net Interest Income % Other Income % Total Income % Operating Expenses % Operating Profit % Operating Profit before amortisation of loss on sale of assets to ARC % Provisions % Credit Related Others Profit Before Tax % Tax % Net Profit % 7
8 Breakup of Other Income (Quarter) Particulars Total Q3 FY Units: Rs crore Q3 FY YoY % 173 (-)1.73% Fee Income (-)15.85% Forex (-)61.53% Commissions % Other (-)42.85% Profit on Sale of Investments % 8
9 Breakup of Other Income (9 months) Particulars Total Fee Income Units: Rs crore 9M FY M FY YoY % % (-)7.43% Forex (-)39.13% Commissions % Other (-)28.81% Profit on Sale of Investments % 9
 Treasury (Rs. bn) Forex Gain (Rs. bn) Others (Rs.")
10 Healthy Other Income Profile Growth in other income Fee income consistently contributes ~ 60% of other income FY11 FY12 FY13 FY14 FY15 FY16 9MFY17 Fee Income (Rs. bn) Treasury (Rs. bn) Forex Gain (Rs. bn) Others (Rs. bn) 100% 90% 80% 70% 60% 50% 40% 30% 20% 10% 0% 12% 17% 13% 16% 12% 7% 14% 5% 4% 4% 7% 15% 11% 7% 7% 20% 12% 20% 13% 8% 18% 69% 64% 62% 60% 69% 66% 68% FY11 FY12 FY13 FY14 FY15 FY16 9MFY17 Fee Income % Treasury % Forex Gain % Others % Diverse sources of non interest income Non interest income contribution to total income at 11.5% for FY KVB s Fee income streams : Banking charges (Corporate, Commercial & Retail) Bancassurance Third party product sales Trade Finance Retail Asset fees Card fees Credit Card Debit Card Travel Card Gift Card 10
11 Key Ratios (For the quarter ended) Net Interest Margin Cost to Income % 4.00% 3.80% 3.60% 3.40% 3.20% 3.47% 3.55% 3.52% 3.61% 3.68% 65% 60% 55% 59.47% 56.01% 55.18% 60.48% 3.00% 2.80% 2.60% 50% 45% 47.57% 2.40% Dec-15 Mar-16 Jun-16 Sep-16 Dec-16 40% Dec-15 Mar-16 Jun-16 Sep-16 Dec-16 Return on Assets Return on Equity 1.40% 20% 1.20% 1.00% 0.80% 1.10% 0.97% 1.00% 0.86% 0.74% 15% 10% 12.00% 12.07% 12.34% 10.34% 9.47% 0.60% Dec-15 Mar-16 Jun-16 Sep-16 Dec-16 5% Dec-15 Mar-16 Jun-16 Sep-16 Dec-16 11
12 Key Ratios (For the 9 months ended) Net Interest Margin Cost to Income % 4.00% 3.80% 3.60% 3.40% 3.20% 3.00% 2.80% 2.60% 2.40% 3.60% 3.62% 3.52% 3.39% 3.43% Dec-15 Mar-16 Jun-16 Sep-16 Dec-16 60% 56.01% 57.22% 55.57% 55% 50.35% 50% 47.20% 45% 40% Dec-15 Mar-16 Jun-16 Sep-16 Dec-16 Return on Assets Return on Equity 1.40% 20% 1.20% 1.00% 0.80% 1.05% 1.03% 1.00% 0.93% 0.87% 15% 10% 12.23% 12.41% 12.34% 11.16% 10.60% 0.60% Dec-15 Mar-16 Jun-16 Sep-16 Dec-16 5% Dec-15 Mar-16 Jun-16 Sep-16 Dec-16 12
13 Key Ratios Particulars Q3 FY Q3 FY Cost of Deposits 6.44% 7.37% Yield on Advances 11.30% 11.62% Cost of Funds 6.34% 7.33% Yield on Funds 9.55% 10.09% Cost Income Ratio 60.48% 47.57% Cost Income Ratio(before amortisation) 51.29% 46.86% Spread 3.21% 2.76% NIM Business/Emp. (Rs crore) Profit/Emp. (Rs lakh) No. of Employees 3.68% %
14 Key Ratios Particulars Cost of Deposits 9M FY M FY % 7.52% Yield on Advances 11.38% 11.79% Cost of Funds 6.67% 7.50% Yield on Funds 9.75% 10.16% Cost Income Ratio 57.22% 47.20% Cost Income Ratio(before amortisation) Spread NIM 47.95% 46.96% 3.08% 2.66% 3.62% 3.39% Business/Emp. (Rs crore) Profit/Emp. (Rs lakh) No. of Employees , ,278 14
15 Cost and Yield on Funds (%) Profitability Metrics Consistency in spreads FY06 FY07 FY08 FY09 FY10 FY11 FY12 FY13 FY14 FY15 FY16 9M FY17 Yield on funds Cost of funds Net Interest Margin (%) over the years Net Interest Margin FY06 FY07 FY08 FY09 FY10 FY11 FY12 FY13 FY14 FY15 FY16 9 M FY17 Net Interest Margin 15
16 Deposits Particulars Q3 FY Q3 FY Units: Rs crore YoY % Total Deposits 55,066 47, % CASA 16,973 11, % CASA Mix % 30.82% 23.40% Demand 5,816 3, % Savings 11,157 7, % Term Deposits 38,093 36, % 16

 13% 13% 12% 11% 12% 9% 9% 5% FY10 FY11 FY12 FY13 FY14 FY15 FY16 9MFY17 Concentration")
17 Retail Liability Franchise Granular and Sticky Low dependence on wholesale deposits (FY17) Term deposits are primarily retail deposits. Only 6% of term deposits are > Rs.50 Mn < Rs. 1.5 Mn, 63% Rs. 1.5 Mn - Rs. 10 Mn., 23% Low concentration of deposits > Rs. 50 Mn, 8% Rs. 10 Mn - Rs. 50 Mn, 6% Breakup of deposits (9M FY17) 13% 13% 12% 11% 12% 9% 9% 5% FY10 FY11 FY12 FY13 FY14 FY15 FY16 9MFY17 Concentration of top 20 depositors % Term Deposits, 69% Savings Deposits, 20% Demand Deposits, 11% 17
18 Deposit Mix Break-up of deposit base (in %) 100% 80% 60% 40% 76% 77% 81% 81% 79% 78% 77% 69% 20% 0% 13% 13% 20% 11% 11% 13% 14% 15% 11% 10% 8% 8% 8% 8% 8% 11% FY10 FY11 FY12 FY13 FY14 FY15 FY16 9MFY17 Demand Deposits Savings Deposits Time Deposits Demand deposit balances since FY10 Savings deposit balances since FY Demand Deposits Balance (Rs. bn) Savings Deposits Balance (Rs. bn) 18
19 Advances Particulars Q3 FY Q3 FY YoY % Units: Rs crore Advances 38,459 37, % Corporate 12,890 13,772 (-)6.40% Commercial 13,035 12, % Agriculture 6,442 6, % Retail (Personal Banking) 6,093 5, % Jewel Loan (included in other segments) 6,094 6, (-)2.99%
 % to Total Advance Growth Over Dec-15 Dec-16 Dec-15 Mar-16 Dec-16 Dec-15 Mar-16 Quantum % MANUFACTURING SECTOR 12,627 13,688 13,633 32.8 36.1 34.5 (1061) (7.")
 BILLS 1,118 1,347 1,352 2.9 3.6 3.4 (229) (17.0) NBFC 1,041 797 975 2.7 2.1 2.5 244 30.6 OTHER EXPOSURES* 6,432 4,882 6,076 16.7 12.9 15.4 1550 31.")
20 Advances Category wise Particulars Amount (Rs. in crore) % to Total Advance Growth Over Dec-15 Dec-16 Dec-15 Mar-16 Dec-16 Dec-15 Mar-16 Quantum % MANUFACTURING SECTOR 12,627 13,688 13, (1061) (7.8) JEWEL LOAN 6,094 6,282 6, (188) (3.0) Personal Segment 5,364 5,031 5, TRADING 5,783 5,845 5, (62) (1.1) BILLS 1,118 1,347 1, (229) (17.0) NBFC 1, OTHER EXPOSURES* 6,432 4,882 6, TOTAL ADVANCES 38,459 37,872 39, Vehicle, Housing, Deposit loans **includes Commercial Real estate, Capital Market and exposure to other service sectors, etc. 20
 5.6 5.6 (11.06) Power) 1,874 2,107 2,212 4.9 POWER 877 1,257 1,142 2.3 3.3 2.9 (380) (30.23) FOOD PROCESSING 1,302 1,281 1,282 3.4 3.4 3.2 21 1.")
21 Manufacturing Sector - Breakup INDUSTRY Amount (Rs. in crore) % to Total Advance Growth Dec-16 Dec-15 Mar-16 Dec-16 Dec-15 Mar-16 Amount % TEXTILES 3,423 3,278 3, INFRASTRUCTURE (Ex - (233) (11.06) Power) 1,874 2,107 2, POWER 877 1,257 1, (380) (30.23) FOOD PROCESSING 1,302 1,281 1, BASIC METAL & METAL (306) (19.70) PRODUCTS 1,247 1,553 1, (338) CHEMICALS & (40.92) CHEMICALS PRODUCTS ALL ENGINEERING (158) (26.38) TRANSPORT EQUPMENTS CEMENT & CEMENT (3) PRODUCTS (0.79) GEMS & JEWELLERY OTHER INDUSTRIES 1,832 1,710 2, Total INDUSTRY EXPOSURE 12,627 13,688 13, (1061) (7.78) 21
22 Retail Advances Segment Amount (Rs. in crore) Mar-12 Mar-13 Mar-14 Mar-15 Mar-16 Dec-16 Housing Loan ,387 1,757 2,094 2,264 Vehicle Loan Educational Loan Personal Loan Jewel Loan Mortgage Loan (LAP) Retail (Others) Total 2,538 3,545 4,291 5,242 5,878 6,093 22
23 Advances Mix Advance in Value (Rs.in crore) Advance Mix (in %) Mar-12 Mar-13 Mar-14 Mar-15 Mar-16 Dec-16 ABG CBG CIG PBG 45% 40% 35% 30% 25% 20% 15% 10% 5% 0% 43% 38% 37% 35% 34% 34% 32% 32% 33% 34% 31% 30% 18% 16% 17% 17% 18% 17% 14% 15% 16% 10% 12% 12% Mar-12 Mar-13 Mar-14 Mar-15 Mar-16 Dec-16 ABG CBG CIG PBG ABG- Agri Banking, CBG Commercial Banking, CIG Corporate Banking, PBG Personal Banking Increased focus on Commercial, SME & Retail Advances over the period 23

24 Investment Portfolio Investment Outstanding (Rs. In crore) Portfolio wise Investment HFT, 0.12% AFS, 36.79% HTM, 63.09% Dec'15 Mar'16 Dec'16 Investment Portfolio SLR Shares Debentures/CD/MF/CP Modified Duration HTM AFS HFT Total % 8.66% Yield on Investment Yield on Investments 7.54% 7.54% 7.27% 90.58% 6.00% 1.00% Dec'15 Mar'16 Dec'16 out of 8.66% Security Receipts constitutes 2.66%(Rs Crores) 24
25 Sector Wise Restructured Advances S.NO SECTOR AMOUNT (Rs. in crore) (%) to total Rest. Adv Dec-16 Mar-16 Dec-16 Mar-16 1 AGRICULTURE IRON AND STEEL Nil Nil Nil 3 INFRASTRUCTURE TEXTILES HOUSING LOANS AUTO LOANS EDUCATIONAL LOANS REAL ESTATE FOOD PROCESSING OTHERS TOTAL 1, % to Total Advance 3.32% 3.43%
26 Movement of Restructured Assets Units: Rs crore Oct 16 to Dec ,245 1,279 Opening Balance Additions Reductions Slippage to NPA Closing Balance % of Advances 3.25% % 0.09% 3.15% 26
27 Stress Accounts Rs. in Crore SDR Outstanding (4 accounts) /25 ( 1 Account ) S4A Accounts Nil Sale to ARC in 9 months of FY Nil 27
28 NPA Details 1,200 1, Gross and Net NPA Units: Rs crore Dec-15 Mar-16 Jun-16 Sep-16 Dec-16 Gross NPA Net NPA 1, % 2.0% 1.0% 1.91% 0.96% 1.30% 0.55% 1.79% 0.79% 2.29% 1.44% 2.66% 1.68% 0.0% Gross NPA % Net NPA % Dec-15 Mar-16 Jun-16 Sep-16 Dec-16 Provision Coverage Ratio 75.20% 82.46% 78.49% 68.26% 67.06% 28
29 Movement of NPA (Rs. in crore) Particulars Apr 16 Sep 16 Oct 16 Dec 16 Apr-16 Dec 16 Apr 15 - Dec 15 Movement of Gross NPAs Opening Balance Additions during the period Reductions during the period Closing Balance Movement of Net NPAs Opening Balance Additions during the period Reductions during the period Closing Balance Movement of Provision for NPA Opening Balance Provn made during the period Write off/write back of excess provn Closing Balance
30 Breakup of Provisions (Other than Tax) Particulars Units: Rs crore Q3 FY Q3 FY YoY % Total Provisions % NPA % Standard Assets Restructured Investment (-) Others
31 Breakup of Provisions (Other than Tax) Particulars Total Provisions NPA Units: Rs crore 9M FY M FY YoY % (-)16.66% (-)6.39% Standard Assets Restructured Investment Others (-)9 (-) (-)
32 Growth in Branch & ATM Network Branch network & ATM network FY10 FY11 FY12 FY13 FY14 FY15 FY16 9MFY Branch ATM 32
33 Branch Network - Diversified Across the Country Geographical spread of branches 9 months (FY17) State /UT Dec-16 - Branches (Nos) Region, Number of branches 18 Divisional Offices spread across the country South 601 North 39 East 24 West 42 TAMILNADU 375 ANDHRA PRADESH 102 TELANGANA 51 KARNATAKA 49 MAHARASHTRA 27 GUJARAT 15 WEST BENGAL 16 Dominant presence (52%) in semi-urban and rural locations KERALA 17 Branch Distribution in 9MFY16 (706 branches) Rural, 15% Semi-urban, 37% Metro, 27% Urban, 21% DELHI 14 PUNJAB 7 UTTARPRADESH 6 ORISSA 5 HARYANA 4 PONDICHERY 6 M.P. 4 Number of customers (Millions) RAJASTHAN 3 JHARKHAND CHANDIGARH 1 CHATTISGARH 1 GOA 1 Total 706 FY10 FY11 FY12 FY13 FY14 FY15 FY16 9MFY17 33
34 Mar-14 Jun-14 Sep-14 Dec-14 Mar-15 Jun-15 Sep-15 Dec-15 Mar-16 Jun-16 Sep-16 Dec-16 Leveraging Technology Alternate Banking Channels Rising market share in RTGS transactions POS Terminals 1.05% 1.00% 0.95% 0.90% 0.85% 0.80% 0.79% 0.84% 0.91% 0.94% 0.99% 1.01% % 0.70% FY12 FY13 FY14 FY15 FY16 9MFY17 Market share in RTGS transactions (by volume) POS Terminals Exponential growth in Mobile transactions Cash Deposit Machines Mobile Banking (Nos in '000) Mar-13 Mar-14 Mar-15 Mar-16 Dec-16 0 Mobile Banking (Nos in '000) Cash Deposit Machines (Nos.) 34
35 Capital Adequacy Capital Adequacy Ratio (Basel III) 16% 14% 12% 12.90% 0.94% 12.17% 0.91% 11.67% 11.44% 0.81% 0.77% 11.79% 0.74% 10% 8% 6% 4% 11.96% 11.26% 10.86% 10.67% 11.05% 2% 0% Dec-15 Mar-16 Jun-16 Sep-16 Dec-16 Tier 1 Tier 2 35

36 Human Resources Young workforce, average 33 years well qualified work force with decreasing attrition over time % below 30 yrs of age out of 7,218 employees Graduate, 39% Others, 12% PG, 49% 2.9% 4.4% 5.4% 8.4% 6.2% 4.5% 2.7% 0.58% leading to improving productivity, despite employee base rising 1.6x between FY FY10 FY11 FY12 FY13 FY14 FY15 FY16 9M FY FY10 FY11 FY12 FY13 FY14 FY15 FY16 9M FY17 0 Business per employee (Rs. million) Business per branch (Rs. million) 36
37 A Decade of Progress Units: Rs crore Year Paid up Capital Reserves Owned funds CRAR - Basel II % 14.49% 14.41% 14.33% 14.41% 12.77% 14.63% Basel III % 14.62% Deposits Advances Total Income Operating Profit Net Profit Branches (No.) EPS (Rs.) Return on Assets 1.53% 1.63% 1.49% 1.76% 1.71% 1.56% 1.35% 0.86% 0.88% 1.03% Book Value(Rs.) No of Employees


38 38
INVESTOR PRESENTATION. Business Performance
 INVESTOR PRESENTATION Business Performance 31.12.2018 31.12.2018 DISCLAIMER This presentation has been prepared by Karur Vysya Bank Limited ( the Bank ) solely by the Bank for information purposes only.
Growth Powered by Technology, Driven by Customers. Financial Results 31 st March 2017
 Financial Results 31 st March 2017 Performance Highlights Q4 FY 2016-17 NET INTEREST INCOME ` 989.49 cr NON INTEREST INCOME ` Rs.450.16 cr OPERATING PROFIT ` Rs.703.12 cr NET PROFIT ` 203.99 cr NET INTEREST
Q2 FY 12 INVESTOR PRESENTATION
 Q2 FY 12 INVESTOR PRESENTATION PERFORMANCE HIGHLIGHTS Profitability Measure ROA 1.34 1.15 1.44 11.48% 11.28% 14.29% Shareholder Value Measure ROE 38.60% 38.91% Efficiency Measure COST-INCOME 33.90% 0.68
The Bank that begins with Financial Results Q1, F.Y
 The Bank that begins with Financial Results Q1, F.Y. 2012-13 Analyst Meet August 8 th, 2012 Performance Highlights Jun - 2011 Jun - 2012 Percent 153264 Total Business 130201 17.7 Deposit 77104 89639 16.3
INVESTOR PRESENTATION FEDERAL BANK
 INVESTOR PRESENTATION FY 2010-11 Fourth Quarter & Annual Results as on 31.03.2011 PERFORMANCE HIGHLIGHTS Q4 FY 11 FY 2011 (YOY growth) (YOY growth) Net Interest Income Fee Income Total Income Net Profit
The Bank that begins with Financial Results Q3 & 9Months, F.Y
 The Bank that begins with Financial Results Q3 & 9Months, F.Y. 2012-13 Concall with Analysts 4 th March, 2013 Performance Highlights Mar - 2012 Dec - 2011 Dec - 2012 Percent 152989 157682 Total Business
Q4 FY 13. Investor Information
 Q4 FY 13 Investor Information Key Messages : FY 13 Retail Advance grew by 25.47% (12.58%) SME Advance grew by 22.44% (9.49%) Retail & SME Customer base increased by 79.8% in 12 months (32.90%) Other Income
Investor Presentation Q3 FY 12
 Investor Presentation Q3 FY 12 Performance Highlights Profitability Measure ROA 1.30 1.44 1.41 11.37 14.29 14.56 Shareholder Value Measure ROE 37.30 38.91 37.13 Efficiency Measure COST-INCOME 0.81 0.58
Financial Results Q1 FY July 28, 2015
 Financial Results Q1 FY 2015-16 July 28, 2015 A Step Towards Digitalization 2 Performance Highlights Business Opex Profitability Global Business increased by 8.6% to ` 582817 crore Savings Deposits grew
The Bank that begins with Financial Results Q3 & 9-Months
 The Bank that begins with Financial Results Q3 & 9-Months 2011-12 Tele-Conference with Analysts February 7 th, 2012; 3.30 P.M. Performance Highlights Dec - 2010 Dec - 011 Percent 141915 Total Business
INVESTOR PRESENTATION FEDERAL BANK FY
 INVESTOR PRESENTATION FY 2010-11 Second Quarter Results as on 30.09.2010 PERFORMANCE HIGHLIGHTS (Q2 FY 2011 vs Q2 FY 2010) Net Interest Income up by 32.86 % from Rs.329.95 Cr to Rs.438.37 Cr Operating
154 years in service of the Nation and going strong
 Financial Results Q4 & Welcome Board of Directors 11 th May 2018 154 years in service of the Nation and going strong The Bank s Key Strengths Robust CASA Stable Operating Profit Young & energetic workforce
Financial Results Q2 & H1 FY November 06, 2015
 Financial Results Q2 & H1 FY 2015-16 November 06, 2015 Highest Gainer in Brand Value Brand value rises 72% on accelerated digitalization efforts. 2 Structural Transformation Initiative 3 Performance Highlights
Investor Presentation March-2014
 Investor Presentation March-2014 1 IMPORTANT NOTICE No representation or warranty, express or implied is made as to, and no reliance should be placed on, the fairness, accuracy, completeness or correctness
Earnings Presentation. Annual Results FY16-17
 Earnings Presentation Annual Results FY16-17 1 Safe Harbor Except for the historical information contained herein, statements in this release which contain words or phrases such as will, aim, will likely
Financial Results Q3/FY February 2019
 Financial Results Q3/FY18-19 08 February 2019 HIGHLIGHTS - DEC 2018 Total Business Total Deposit Gross Advance Operating Profit (Q-3) Rs. 291519 Crore Rs. 177906 Crore Rs.113610 Crore Rs. 381 Crore Basel
Performance During Q4 : FY17-18 * ENABLING THE STAR TO SHINE *
 Performance During Q4 : FY17-18 * ENABLING THE STAR TO SHINE * PERFORMANCE AT A GLANCE Q4 FY18 Parameter Rs. Crore Y-o-Y (%) Growth Business 896,850-3.96 Total Deposits 520,854-3.55 Gross Advances 375,995-4.52
Investor Presentation Sept-2014
 Investor Presentation Sept-2014 1 IMPORTANT NOTICE No representation or warranty, express or implied is made as to, and no reliance should be placed on, the fairness, accuracy, completeness or correctness
Performance Highlights
 Presentation on Financial Performance for the Quarter/FY March 2015 1 Performance Highlights Top Line Milestones: Global Assets- Rs. 6.0 Lac Global Deposit- Rs. 5.0 Lac Saving Deposit- Rs. 1.5 Lac Overseas
Investor Presentation June-2014
 Investor Presentation June-2014 1 IMPORTANT NOTICE No representation or warranty, express or implied is made as to, and no reliance should be placed on, the fairness, accuracy, completeness or correctness
Financial Results. Q3 FY15 & Nine-months ended December th January 2015
 Financial Results Q3 FY15 & Nine-months ended December 27 th January 2015 1 Highlights Capital CRAR (Basel III) at 10.30%; CET 1: 7.02% Margin Domestic NIM stable at 2.6% Fee Income Core Fee Income up
THE BANKER TO EVERY INDIAN. Quarterly Results Q1 FY 2012
 THE BANKER TO EVERY INDIAN Quarterly Results Q1 FY 2012 1 Rs. In Crores NII growth drives Profitability Parameter Q1 FY 11 Q4 FY 11 Q1 FY 12 YOY Growth % Interest Income 18452 21721 24197 31.14 Interest
Performance and Outlook. November 2016
 Performance and Outlook November 2016 1 Macro Picture Asset Quality Growth Earnings Quality Retail Franchise 2 Growth in industrial production has slowed in recent months Growth in IIP and Components 14%
Investor Presentation Q3 FY2013
 Investor Presentation Q3 FY2013 IMPORTANT NOTICE No representation or warranty, express or implied is made as to, and no reliance should be placed on, the fairness, accuracy, completeness or correctness
The Bank that begins with Financial Results
 The Bank that begins with U Financial Results 2010-2011 Analyst Meet Trident, Mumbai May 4, 2011 Performance Highlights 2009-10 2010-11 Percent 131779 Total Business 110936 18.8 Deposit 68180 77845 14.2
Capital Adequacy Ratio (Basel III) Earnings Per share, Book Value Per Share & Share Holdings Pattern
 Earnings Per share, Book Value Per Share & Share Holdings Pattern") 1 Sl. No. Areas of Presentation Slide No 1 Highlights 3 2 Business Cross Section 4 3 Domestic CASA 5 4 Domestic Advances 6 5 Retail Credit Components 7 6 Industry & NBFC Exposure 8 7 Restructured Advances,
1 Sl. No. Areas of Presentation Slide No 1 Highlights 3 2 Business Cross Section 4 3 Domestic CASA 5 4 Domestic Advances 6 5 Retail Credit Components 7 6 Industry & NBFC Exposure 8 7 Restructured Advances,
 www.allahabadbank.in Business Mix Sl. No. Parameters Jun'15 Mar'16 Jun'16 Variation Q-o-Q Y-o-Y Jun'16 over Mar'16 Jun'16 over Jun'15 Amt. (%) Amt. (%) 1 Business 334548 358352 350848-7504 -2.09 16300
The Bank that begins with. Financial Results Q-4 / FY ( )
") The Bank that begins with Financial Results Q-4 / FY (2014-15 ) Result at A Glance. Performance Parameter Rs. crore Ratio for 2014-15 (in %) Net Profit 256 Return on Assets 0.21% Operating Profit 2428
The Bank that begins with Financial Results Q-4 / FY (2014-15 ) Result at A Glance. Performance Parameter Rs. crore Ratio for 2014-15 (in %) Net Profit 256 Return on Assets 0.21% Operating Profit 2428
 www.allahabadbank.in Business Mix Sl. No. Parameters Mar'15 Sep'15 Variation Q-o-Q Y-o-Y over Sep'15 over Amt. (%) Amt. (%) 1 Business 331196 346519 340101 344709 4608 1.35 13513 4.08 2 Deposit 184544
Financial Results Q4 FY & FY May 13, 2016
 Financial Results Q4 FY 2015-16 & FY 2015-16 May 13, 2016 Table of Contents #1 Story of Transformation #2 Business Performance #3 Financials 2 Structural Transformation 3 Structural Transformation Medium
INVESTOR PRESENTATION MARCH 2012
 INVESTOR PRESENTATION MARCH 2012 South Indian Bank At A Glance 83 Years 700 663 `64136 Cr 27% 25% `401 Cr 3.10 % 14.00% 0.28% Number of years in banking business Number of branches Number of ATM s Business
Page 1
 Page 1 HIGHLIGHTS MARCH 2015 Major HIghlights Net profit at 2703 crore, up by 10.8% y.o.y. Gross profit at 6950 crore, up by 2.3% y.o.y. Total provisions at 4248 crore compared to 4358 crore in FY14 Non-interest
Content. Highlights. Financial Performance. Business Performance. Treasury Operations. Asset Quality. Capital. Digital Banking & Financial Inclusion
 Q2 FY 2019 Content Highlights Financial Performance Business Performance Treasury Operations Asset Quality Capital Digital Banking & Financial Inclusion 2 Highlights 3 Highlights for Quarter September
Performance Analysis:
 Performance Analysis: Q3 FY 2016 (April December 2015) February 13, 2016 2016 Bank of Baroda. All Rights Reserved 1 Bank of Baroda: Our Key Strengths Bank of Baroda is a 107 years old State-owned Bank
INVESTOR PRESENTATION DEC 2011
 INVESTOR PRESENTATION DEC 2011 South Indian Bank At A Glance 83 Years 674 614 `58884 Cr 27% 25% `280 Cr `102 Cr 3.05 % 12.03% 0.24% Number of years in banking business Number of branches Number of ATM
Corporate Presentation
 Corporate Presentation Disclaimer This presentation has been prepared by Karur Vysya Bank Limited (the Company ) solely for your information and may not be taken away, distributed, reproduced, or redistributed
FY First Quarter Results. Investor Presentation
 FY 2009-10 First Quarter Results Investor Presentation 1 Performance Highlights Q1FY10 Net Profit Net Interest Income Fee Income Operating Revenue Operating Profit 70% YOY 29% YOY 17% YOY 40% YOY 47% YOY
Total Business Gross Advances Total Deposits 12.05% 9.91% 13.82% NIM CASA. CRAR Basel III 2.59% 11.20% 12.52%
 1 Total Business Gross Advances Total Deposits 12.05% 9.91% 13.82% CASA NIM CRAR Basel III 12.52% 2.59% 11.20% 2 PARTICULARS 31.03.2015 31.03.2016 No. of Share % Holding No. of Share % Holding Govt of
Investor Presentation MARCH-2013
 Investor Presentation MARCH-2013 IMPORTANT NOTICE No representation or warranty, express or implied is made as to, and no reliance should be placed on, the fairness, accuracy, completeness or correctness
CORPORATE PRESENTATION SEPTEMBER 2014
 CORPORATE PRESENTATION SEPTEMBER 2014 DISCLAIMER This presentation has been prepared by and is the sole responsibility of The South Indian Bank Limited (the Bank ). By accessing this presentation, you
Robust Operating Momentum
 Key Messages Operating Momentum Continues to make Strong Progress **** Healthy Core Engine Robust Operating Momentum Highest ever Operating Profit @ 708cr, grows 26% Y-o-Y Highest ever Net Profit @ 334Cr,
Quarterly Results Q3FY15
 Quarterly Results Q3FY15 13 th February 2015 Safe Harbor Certain statements in these slides are forward-looking statements. These statements are based on management's current expectations and are subject
HIGHLIGHTS OF WORKING RESULTS
 1 HIGHLIGHTS OF WORKING RESULTS 2 Business Global Business at ` 4,67,626 Crore Savings Deposits grew by 23% (Y-o-Y) Income Non - Interest Income increased by 38% (Y-o-Y) Profit Advances Consistent and
INVESTOR PRESENTATION
 INVESTOR PRESENTATION 1 South Indian Bank At A Glance 83 Years 644 568 `56386 Cr 31% 25% `177 Cr `95 Cr 3% 13.48% 0.25% Number of years in banking business Number of branches Number of ATM s Business as
Domestic Branch Network
 Domestic Branch Network RURAL SEMI-URBAN URBAN METRO 20% 19% 20% 41% Branches 2716 Rural-1105 S-Urban-553 Urban-551 Metro-507 3000 2500 2000 1500 Branches 2415 2259 2286 2716 2516 FY'09 FY'10 FY'11 FY'12
NET PROFIT (Q4) INCREASED BY 110% Y-O-Y TOTAL NUMBER OF BRANCHES CROSSED 2500 PROVISION COVERAGE RATIO IMPROVED TO 58.93
 INCREASED BY 110% Y-O-Y TOTAL NUMBER OF BRANCHES CROSSED 2500 PROVISION COVERAGE RATIO IMPROVED TO 58.93") 1 NET PROFIT (Q4) INCREASED BY 110% Y-O-Y NIM @ 3.00% FOR FY 2014-15 TOTAL NUMBER OF BRANCHES CROSSED 2500 PROVISION COVERAGE RATIO IMPROVED TO 58.93 CASA DEPOSITS CROSSED 27% NET NPAs BELOW 3% 2 BRANCH
1 NET PROFIT (Q4) INCREASED BY 110% Y-O-Y NIM @ 3.00% FOR FY 2014-15 TOTAL NUMBER OF BRANCHES CROSSED 2500 PROVISION COVERAGE RATIO IMPROVED TO 58.93 CASA DEPOSITS CROSSED 27% NET NPAs BELOW 3% 2 BRANCH
HIGHLIGHTS OF WORKING RESULTS
 1 HIGHLIGHTS OF WORKING RESULTS 2 Business Global Business at ` 4,96,122 Crore. Grew by 6% (Y-o-Y) Global Advances at ` 2,23,346 Crore. Grew by 8%(Y-o-Y) Income Net - Interest Income increased by 4% (Y-o-Y)
FINANCIAL HIGHLIGHTS FOR THE 1 ST QUARTER ENDED 30 TH JUNE 2018
 FINANCIAL HIGHLIGHTS FOR THE 1 ST QUARTER ENDED 30 TH JUNE 2018 PERFORMANCE HIGHLIGHTS- FY 20 Total Business of the Bank increased to Rs. 4,68,535 crore as at June 30, 2018 compared to Rs. 4,66,360 crore
FY Annual Results. Investor Presentation
 FY 2011-12 Annual Results Investor Presentation Performance Highlights Q4FY12 12M FY12 Net Profit 25% YOY 25% YOY Net Interest Income 26% YOY 22% YOY Fee Income 8% YOY 25% YOY Operating Revenue 18% YOY
Q3-2018: Performance review. January 31, 2018
 Q3-2018: Performance review January 31, 2018 Certain statements in these slides are forward-looking statements. These statements are based on management's current expectations and are subject to uncertainty
ICICI Group: Strategy & Performance. Motilal Oswal Conference September 2, 2013
 ICICI Group: Strategy & Performance Motilal Oswal Conference September 2, 2013 Certain statements in these slides are forward-looking statements. These statements are based on management's current expectations
ICICI Group: Performance & Strategy. November 2015
 ICICI Group: Performance & Strategy November 2015 Certain statements in these slides are forward-looking statements. These statements are based on management's current expectations and are subject to uncertainty
Q2-2018: Performance review. October 27, 2017
 Q2-2018: Performance review October 27, Certain statements in these slides are forward-looking statements. These statements are based on management's current expectations and are subject to uncertainty
Financial Results Q4-10 & FY Analyst Presentation
 Financial Results Q4-10 & FY 2010 Analyst Presentation 6th May, 2010 HIGHLIGHTS OF BUSINESS GROWTH Total Business increased from Rs.236968 Cr. to Rs.291289 Cr. an increase of 22.92% Total Deposits registered
THE BANKER TO EVERY INDIAN. Annual Results FY
 THE BANKER TO EVERY INDIAN Annual Results FY 2011-12 Healthy Growth in NII and Operating Profit - a Snapshot (1/2) Rs. In Crores Q4 FY11 Q4 FY12 Gr.% FY11 FY12 Gr.% Interest Income 21721 28583 31.59 Interest
Q1-2018: Performance review. July 2017
 Q1-2018: Performance review July Certain statements in these slides are forward-looking statements. These statements are based on management's current expectations and are subject to uncertainty and changes
Investor Presentation. April 2016
 Investor Presentation April 2016 Safe Harbor Except for the historical information contained herein, statements in this release which contain words or phrases such as will, aim, will likely result, would,
FY2018: Performance review. May 7, 2018
 FY2018: Performance review May 7, 2018 Certain statements in these slides are forward-looking statements. These statements are based on management's current expectations and are subject to uncertainty
FINANCIAL HIGHLIGHTS FOR THE QUARTER ENDED
 FINANCIAL HIGHLIGHTS FOR THE QUARTER ENDED 30 th JUNE 2015 PERFORMANCE HIGHLIGHTS- FY 20 Total Business of the Bank increased to Rs. 4,51,739 crore from Rs. 4,26,829 crore in June 2014, recording Y-o-Y
Performance and Outlook
 Performance and Outlook November 2017 NSE: AXISBANK BSE: 532215 LSE (GDR): AXB 1 Safe Harbor Except for the historical information contained herein, statements in this release which contain words or phrases
Kotak Annual Global Investor Conference 2011 Chasing Growth. Mr. Bipin Kabra February 11, 2011
 Kotak Annual Global Investor Conference 2011 Chasing Growth Mr. Bipin Kabra February 11, 2011 Agenda 1 Macro update 2 Dhanlaxmi Bank - An overview 3 A Bank in Transformation 4 Financials - How the Numbers
ICICI Group: Performance & Strategy. May 2015
 ICICI Group: Performance & Strategy May 2015 Certain statements in these slides are forward-looking statements. These statements are based on management's current expectations and are subject to uncertainty
Analyst Presentation
 Quarterly Results Q3FY19 Analyst Presentation 01.02.2019 Safe Harbor Certain statements in these slides are forwardlooking statements. These statements are based on Management's current expectations and
FINANCIAL RESULTS HY 1 / Q2 FY 18
 1 FINANCIAL RESULTS HY 1 / Q2 FY 18 2 EMERGING ECONOMIC & BANKING SCENARIO Domestic Economy Reset in New Normal Govt s Mega Recapitalization Plan Improved Economic Macros Credit Growth shows green shoots
Strong Operating Momentum. Operating Profit grows 20% Y-o-Y Robust Growth across all Business Segments Highest ever
 Key Messages Robust Operating Momentum **** Healthy Core Engine Strong Operating Momentum Operating Profit grows 20% Y-o-Y Robust Growth across all Business Segments Highest ever NII @1022Cr Granular Liability
State Bank of India PRESS RELEASE H1FY
 SBI STAND ALONE RESULTS HIGHLIGHTS State Bank of India PRESS RELEASE H1FY 2011-12 Net Profit of the Bank is up by 12.36% YOY from Rs.2501 crores in Q2 FY11 to Rs.2810 crores in Q2FY12. Sequentially it
FINANCIAL HIGHLIGHTS FOR THE 4 TH QUARTER & FINANCIAL YEAR ENDED 31 ST MARCH 2018
 FINANCIAL HIGHLIGHTS FOR THE 4 TH QUARTER & FINANCIAL YEAR ENDED 31 ST MARCH 2018 PERFORMANCE HIGHLIGHTS- & 20 Total Business of the Bank improved to Rs. 4,72,323 crore in March 31, 2018 as against Rs.
Audited Financial Results. For Q / FY. March, 2015
 Audited Financial Results For Q / FY March, 2015 1 BUSINESS PROFILE 200000 150000 100000 50000 0 Advances Business Mar-13 Mar-14 Mar-15 Parameter Mar 13 Mar 14 Mar 15 Y-o-Y % Growth Gross Advances 66,457
Financial Performance For the Quarter/ Nine Months Ended 31ST DEC. 2017
 Financial Performance For the Quarter/ Nine Months Ended 31ST DEC. 2017 12th FEBRUARY 2018 1 Corporation Bank was founded in the Year 1906 in Udupi a small town in South India Nationalized in the year
Board Presentation Quarter / Year ended 31 st March TH APRIL 2016
 Board Presentation Quarter / Year ended 31 st March 2016 19 TH APRIL 2016 1 SUMMARY FINANCIAL STATEMENT Amounts In Rs. Lakhs Financial Snapshot * Figures are annualized Quarter Ended Q-o-Q Year Ended
Credit growth significantly ahead of the Industry average (26% growth Y-o-Y) Fourth consequent quarter of Slippages trending downwards
 Fourth consequent quarter of Slippages trending downwards") Key Messages Business momentum continues robust growth of 25% Y-o-Y Highest ever Operating Profit; Y-o-Y growth of 35%; Qtly Oper. Profit @ Rs.549 Cr. Credit growth significantly ahead of the Industry
Key Messages Business momentum continues robust growth of 25% Y-o-Y Highest ever Operating Profit; Y-o-Y growth of 35%; Qtly Oper. Profit @ Rs.549 Cr. Credit growth significantly ahead of the Industry
DF-3 Capital Adequacy- Qualitative Disclosure
 DF-3 Capital Adequacy- Qualitative Disclosure The Bank actively manages its capital requirement by taking in to account the current and future Business growth of the Bank. Stress tests are used as a part
Earnings Presentation Q3FY18
 Earnings Presentation Q3FY18 www.repcohome.com Agenda Q3FY18 Performance Business summary.. Financial performance for Q3FY18 Borrowing profile.... Geographic Presence Footprint... Region-wise loan book..
Investor Presentation
 Investor Presentation October 12, 2017 Q2-FY18 Results 2 Q2 FY18 Performance Highlights Key performance indicators remained stable NII up 25% ; Core Fee growth at 23 % YoY; YoY PAT growth up by 25 % NIM
Q2-2018: Performance review
 Q2-2018: Performance review October 27, 2017 Certain statements in these slides are forward-looking statements. These statements are based on management's current expectations and are subject to uncertainty
Corporate Presentation. February 2015
 Corporate Presentation February 2015 Disclaimer This document does not constitute or form part of and should not be construed as an offer to sell or issue or the solicitation of an offer to buy or acquire
Repco Home Finance Limited Earnings Presentation Q3FY17
 Repco Home Finance Limited Earnings Presentation Q3FY17 www.repcohome.com Agenda Q3Y17 Performance Business summary.. Financial performance for Q3 & 9MFY17 Asset quality. Diversified source of funding......
(_NI r- elki 1 iii)05li V. 3TaTTH?V, R 0? C
05li V. 3TaTTH?V, R 0? C") CIN: L65190MH2004G01148838 31> 3l tmf21d6 ti ft-a 0,1eliCle4 : 311 z- e-iii oid-,actd, colo tre`u, 311 CT,R, t4-400 005. 47W : (+91 22) 6655 3355, 2218 9111 : (+91 22) 2218 0411 t-4t11-"c: www.idbi.com
CIN: L65190MH2004G01148838 31> 3l tmf21d6 ti ft-a 0,1eliCle4 : 311 z- e-iii oid-,actd, colo tre`u, 311 CT,R, t4-400 005. 47W : (+91 22) 6655 3355, 2218 9111 : (+91 22) 2218 0411 t-4t11-"c: www.idbi.com
Earnings Presentation
 Earnings Presentation Q1FY18 NSE: AXISBANK BSE: 532215 LSE (GDR): AXB 1 Safe Harbor Except for the historical information contained herein, statements in this release which contain words or phrases such
Q1FY18 FINANCIALS JULY 27, 2017
 IDFC BANK Q1FY18 FINANCIALS JULY 27, 2017 3 Jun-16 Sep-16 Dec-16 Mar-17 Jun-17 Key Highlights: Q1 FY18 No. of Customers (Total: 16.0 lacs IBL customers: 10.1 lacs) (In 000 s) 1129 1237 1378 1605 Network
FINANCIAL HIGHLIGHTS FOR THE QUARTER / NINE MONTHS ENDED
 FINANCIAL HIGHLIGHTS FOR THE QUARTER / NINE MONTHS ENDED 31 ST DECEMBER 2015 PERFORMANCE HIGHLIGHTS- / 20 Total Business of the Bank increased to Rs. 4,59,266 crore from Rs. 4,41,510 crore in December
Un-Audited/ Reviewed Financial Results For the Quarter ended June 30,2018
 Un-Audited/ Reviewed Financial Results For the Quarter ended June 30,2018 1 BUSINESS PROFILE 200000 150000 100000 50000 0 Advances Deposit Business June-17 March-18 June-18 Parameter June 17 Mar 18 June
NIM on consistent growth trend Up by 3 bps at 3.31% Total Business Crosses Rs.1.5L Cr. Balance Sheet Size Crosses Rs.1L Cr
 Key Messages Operating Profit continues dynamic growth. Reflects core strength. Total Income (NII + Other Income) exhibits robust growth NIM on consistent growth trend Up by 3 bps at 3.31% Consistent credit
Business Delivery Channels. Branches Extension Counters ATMs Satellite Offices TOTAL
 1 Branch Mix METRO RURAL SEMI-URBAN URBAN Business Delivery Channels 31.12.2014 31.03.2015 31.12.2015 Branches 2287 2507 2748 27% 16% Extension Counters 9 8 4 ATMs 2156 2232 2323 Satellite Offices 35 35
Earnings Presentation Q2FY19
 Earnings Presentation Q2FY19 www.repcohome.com Agenda Q2FY19 Performance Business summary.. Financial performance for Q2FY19 Borrowing profile.... Geographic Presence Footprint... Region-wise loan book..
Equitas Holdings Limited Investor Presentation Q3FY17
 Equitas Holdings Limited Investor Presentation Q3FY17 1 Mission Empowering through Financial Inclusion Vision To Serve 5% of Indian Households by 2025 Values Fair and Transparent 2 Highlights Q3FY17 Rs.7,181
Investor Presentation January
 Investor Presentation January - 2018 Safe Harbor No representation or warranty, express or implied is made as to, and no reliance should be placed on, the fairness, accuracy, completeness or correctness
DF-2 Capital Adequacy- Qualitative Disclosure
 DF-2 Capital Adequacy- Qualitative Disclosure A Premier Public Sector Bank The Bank actively manages it s capital requirement by taking in to account the current and future Business growth of the Bank.
IIP growth (%) Rates FY CPI(YoY) in % Repo Reverse Repo MSF Call Money(Daily movement) A p r.
 Rates FY CPI(YoY) in % Repo Reverse Repo MSF Call Money(Daily movement) A p r.") 2 Rates FY13-14 Repo Reverse Repo MSF Call Money(Daily movement) 13.5 12.5 11.5 10.5 9.5 8.5 7.5 6.5 5.5 A p r M a y J u n J u l A u g S e p O c t N o v D e c J a n F e b M a r IIP growth (%) 3.5 2.6 2.7
2 Rates FY13-14 Repo Reverse Repo MSF Call Money(Daily movement) 13.5 12.5 11.5 10.5 9.5 8.5 7.5 6.5 5.5 A p r M a y J u n J u l A u g S e p O c t N o v D e c J a n F e b M a r IIP growth (%) 3.5 2.6 2.7
Financial Results. 30th September Reorienting towards retail business and recovery for a sustained path of growth and profitability.
 Get Instant Loan Approval!!! Financial Results 30th September 2016 Get Instant Loan Approval!!! CANARA BANK MULTI CURRENCY TRAVEL PREPAID CARD Reorienting towards retail business and recovery for a sustained
Investor Presentation October
 Investor Presentation October - 2017 Safe Harbor No representation or warranty, express or implied is made as to, and no reliance should be placed on, the fairness, accuracy, completeness or correctness
Market Share in Advances increases to 1.01%. Up by 6bps. Market Share in deposits increases to 0.91%. Up by 3bps Y-o-Y
 Key Messages Robust and Diversified Credit Growth Continues. Blended Y-o-Y Growth rate of 22% Refined Retail Asset delivery architecture yields results (HL grows 26% Y-o-Y; 7% Q-o-Q and Auto grows 68%Y-o-Y;15%Q-o-Q;
fm- Ref No.:HO:IRC:RB: :85 Date:
 _ fm- V.5+1, p 1l (1 400 051 V-(71 : (022)- 6668 4490 th-tit : (022)- 6668 4491 v) el : headoffice.share@bankofindia.coin 4- Rank of INVESTOR RELATIONS CELL HEAD OFFICE : Star House, C-5, "G" Block, 8th
ICICI Group: Strategy & Performance
 ICICI Group: Strategy & Performance Agenda India: macroeconomic scenario Indian banking sector ICICI Group 2 Growth indicators Strong long term growth fundamentals Key drivers of growth Favourable demographics
Analyst Presentation - Q4 & FY15 2
 Q4 & FY 2015 Disclaimer: Certain statements contained in this presentation may be statements of future expectations and other forward-looking statements that are based on third party sources and involve
Annual Results FY15 22nd May 2015
 Annual Results FY15 22 nd May 2015 Safe Harbor Certain statements in these slides are forward-looking statements. These statements are based on management's current expectations and are subject to uncertainty
ICICI Group: Performance & Strategy. February 2017
 ICICI Group: Performance & Strategy February 2017 Agenda Indian economy and banking sector ICICI Group Key International regulatory business developments 2 India: strong long term fundamentals Key drivers
Movement of business parameters
 2 Movement of business parameters. [ Amt. in Rs. Crore ] During Qtr./ As on QE Q3 vs Q4 Change (%) Performance Highlights During FY/ As on END YoY Change (%) Q3 FY'17 Q4FY'17 2015-16 2016-17 209572 201285-3.95
CENTRAL BANK OF INDIA FINANCIAL HIGHLIGHTS FOR THE HALF YEAR
 CENTRAL BANK OF INDIA FINANCIAL HIGHLIGHTS FOR THE HALF YEAR ENDED SEPTEMBER 2011 30 th Performance Highlights Sept 2011-12(` in crore) Parameters Q2FY2012 Q2FY2011 YOY Growth (%) FY2011 Total Business
Q1-2019: Performance review. July 27, 2018
 Q1-2019: Performance review July 27, Except for the historical information contained herein, statements in this release which contain words or phrases such as 'will', expected to, etc., and similar expressions