HAYS INVESTOR DAY 2017 THE ULTIMATE PEOPLE BUSINESS
|
|
|
- Melinda Snow
- 5 years ago
- Views:
Transcription

1 HAYS INVESTOR DAY 2017 THE ULTIMATE PEOPLE BUSINESS 9 November 2017
2 CAUTIONARY STATEMENT This presentation contains certain statements that are neither reported financial results nor other historical information. The information contained in this presentation is not audited, is for personal use and informational purposes only and is not intended for distribution to, or use by, any person or entity in any jurisdiction in any country where such distribution or use would be contrary to law or regulation, or which would subject any member of the Hays Group to any registration requirement. No representation or warranty, express or implied, is or will be made in relation to the accuracy, fairness or completeness of the information or opinions made in this presentation. Statements in this presentation reflect the knowledge and information available at the time of its preparation. Certain statements included or incorporated by reference within this presentation may constitute forward-looking statements in respect of the Group s operations, performance, prospects and/or financial condition. By their nature, forward-looking statements involve a number of risks, uncertainties and assumptions and actual results or events may differ materially from those expressed or implied by those statements. Accordingly, no assurance can be given that any particular expectation will be met and reliance should not be placed on any forward-looking statement. Additionally, forward-looking statements regarding past trends or activities should not be taken as a representation that such trends or activities will continue in the future. No responsibility or obligation is accepted to update or revise any forward-looking statement resulting from new information, future events or otherwise. Nothing in this presentation should be construed as a profit forecast. This presentation does not constitute or form part of any offer or invitation to sell, or any solicitation of any offer to purchase any shares in the Company, nor shall it or any part of it or the fact of its distribution form the basis of, or be relied on in connection with, any contract or commitment or investment decision relating thereto, nor does it constitute a recommendation regarding the shares of the Company or any invitation or inducement to engage in investment activity under section 21 of the Financial Services and Markets Act Past performance cannot be relied upon as a guide to future performance. Liability arising from anything in this presentation shall be governed by English Law, and neither the Company nor any of its affiliates, advisors or representatives shall have any liability whatsoever (in negligence or otherwise) for any loss howsoever arising from any use of this presentation or its contents or otherwise arising in connection with this presentation. Nothing in this presentation shall excludeany liability under applicable laws that cannot be excluded in accordance with such laws.

3 INTRODUCTION & OBJECTIVES ALISTAIR COX CHIEF EXECUTIVE
4 TODAY S AGENDA PROGRESS TO DATE AND NEXT PHASE OF GROWTH 12:45 14:00 ENHANCING AND EVOLVING OUR GLOBAL BUSINESS 14:15 15:40 BREAKOUTS 16:00 17:30 WRAP UP & DRINKS RECEPTION 17:30 18:30 4
5 WE HAVE A CLEAR AND COMPELLING INVESTMENT CASE THE BREADTH OF OUR BUSINESS MODEL ACROSS GEOGRAPHY, SECTOR & CONTRACT TYPE OUR BALANCED EXPOSURE TO BOTH MATURE & STRUCTURAL GROWTH MARKETS OUR ABILITY TO DELIVER SUPERIOR FINANCIAL PERFORMANCE THROUGH THE CYCLE OUR POTENTIAL TO GENERATE SIGNIFICANT CASHFLOW & DIVIDENDS
6 WE WANT YOU TO LEAVE TODAY WITH A CLEAR UNDERSTANDING OF: 1 THE SIGNIFICANT OPERATIONAL & STRATEGIC PROGRESS WE HAVE MADE SINCE THE STRENGTH OF OUR MODEL AND ITS RELEVANCE IN AN EVOLVING MARKET HOW WE BALANCE BUSINESS EFFECTIVENESS WITH INNOVATION AND EVOLUTION OUR SIGNIFICANT FUTURE GROWTH POTENTIAL TRANSLATED INTO PROFIT & CASH ASPIRATIONS THE STRENGTH, DEPTH AND EXPERIENCE OF OUR GLOBAL MANAGEMENT TEAMS

7 PROGRESS TO DATE AND NEXT PHASE OF GROWTH ALISTAIR COX CHIEF EXECUTIVE
8 WE HAVE CLEAR, WELL-ESTABLISHED STRATEGIC PRIORITIES TO DELIVER OUR LONG-TERM AIMS MATERIALLY INCREASE & DIVERSIFY GROUP PROFITS BUILD CRITICAL MASS & DIVERSITY ACROSS OUR GLOBAL PLATFORM GENERATE, REINVEST & DISTRIBUTE MEANINGFUL CASH RETURNS INVEST IN PEOPLE, TECHNOLOGY, COLLABORATIONS & INNOVATION
9 WE ARE ON TRACK WITH OUR ORIGINAL 5-YEAR PROFIT ASPIRATIONS Group Operating Profits ( ) 300m 125m + 15m + 24m CAGR 14% + 17m + 30m 211m 250m 200m 2018 RANGE OF EBIT ASPIRATIONS FY13 FY14 FY15 FY16 FY17 FY17 ON TRACK AGAINST OUR GOALS 9
10 WE HAVE RAPIDLY DIVERSIFIED OUR EARNINGS INTO INTERNATIONAL MARKETS Group Operating Profits by geography 100% 46% 54% INT L UK 80% INT L 0% 100% 20% UK 0% FY08 FY17 10
11 THIS HAS INCREASED OUR RESILIENCE TO MARKET SHOCKS OPERATING PROFIT ( ) 2013/14: AUSTRALIA MINING SLOWDOWN 125m 17.5% 2014: POST-GERMAN ELECTION, REGULATORY UNCERTAINTY 140m 19.4% 164m 21.5% JUNE 2016: UK VOTE TO LEAVE THE EU JUNE 2017: SNAP UK GENERAL ELECTION 211m 181m 22.3% 22.2% CONVERSION RATE FY13 FY14 FY15 FY16 FY17 PROFIT GROWTH EVERY YEAR, DESPITE MAJOR SHOCKS IN KEY MARKETS 11 11
12 WE HAVE DELIVERED THIS VIA TARGETED INVESTMENT INTO KEY PRIORITIES ORGANICALLY BUILD GLOBAL SCALE SCALING CONTRACTOR BUSINESS HTS GROWTH International headcount up 56% over 5 years Major expansion into Germany, now the largest business in the Group Significant organic investment into key European and Asian markets Rapid progress in rolling out Contractor business to 11 new markets Now a key driver of growth, diversification and quality in Group earnings Building scale in Hays Talent Solutions (RPO/MSP) on a global basis Fully integrated with and complementing core recruitment business 4 US ACQUISITION Veredus acquisition completed in 2014 Provides high-quality platform to grow in the world s largest market Significant progress investing in IT, C&P, Life Sciences and recently A&F
13 AS A RESULT, THE SHAPE OF OUR BUSINESS AND EARNINGS IS TRANSFORMED TOTAL CONSULTANT HEADCOUNT 6,038 5,173 6,884 NON-UK CONSULTANT HEADCOUNT 2,910 3,244 4,936 % OF GROUP IN STRUCTURAL GROWTH MARKETS 22% 44% 51% NET (DEBT) / CASH (81)m (105)m 112m
14 OUR INTERNATIONAL PLATFORM IS LARGER AND MORE RESILIENT THAN EVER BEFORE INT L NET FEES 712m INT L NET FEES 497m PERM 210m TEMP & CONTRACTING 287m CAGR 8% CAGR 10% PERM 288m TEMP & CONTRACTING 424m UNDERPINNED BY GROWTH IN HIGH-QUALITY NON-PERM REVENUES 14
15 OVER HALF OF OUR BUSINESS TODAY IS IN THE WORLD S BEST STRUCTURAL GROWTH MARKETS 787m NET FEES MATURE MARKETS 955m NET FEES 2017 MATURE MARKETS 49% OF GROUP 78% OF GROUP STRUCTURAL GROWTH MARKETS STRUCTURAL GROWTH MARKETS 22% OF GROUP 2008 CAGR 12% 51% OF GROUP
16 FUTURE PROFIT POTENTIAL REMAINS SIGNIFICANT, DRIVEN BY STRUCTURAL GROWTH IN OUR EXISTING BUSINESSES GERMANY 80m 375m 450m UK&I 19m AUS 27m OTHER 38m 300m 211m 2017 EBIT MATURE, CYCLICAL MARKETS 28% of growth STRUCTURAL GROWTH MARKETS 72% of growth GROWTH MARKETS 52% OF GROUP 2022 EBIT
17 TO DELIVER THIS NEXT PHASE OF GROWTH WE WILL BE FOCUSED ON: CONTINUED INVESTMENT TO DRIVE GROWTH & SCALE ACROSS OUR PLATFORM BUILDING EVEN GREATER DIVERSIFICATION & RESILIENCE INTO OUR EARNINGS INVESTING TO IMPROVE PRODUCTIVITY AND BUSINESS EFFICIENCY INNOVATING OUR MODEL TO BEST MEET EVOLVING CLIENT AND CANDIDATE DEMANDS ALL OF WHICH YOU WILL HEAR ABOUT TODAY

18 HAYS TRACK RECORD OF STRONG PERFORMANCE PAUL VENABLES GROUP FINANCE DIRECTOR
19 SINCE 2013 WE HAVE DELIVERED A CONSISTENTLY STRONG PROFIT PERFORMANCE DESPITE A MIXED MARKET BACKDROP Group Operating Profit ( m) DRIVEN BY THE STRENGTH AND BALANCE OF OUR BUSINESS MODEL Industry-leading levels of profitability Scale, balance and diversity across both Contracting/Temp and Perm Balanced exposure to both cyclical and structural growth markets UNDERPINNED BY EXPERIENCED AND STABLE MANAGEMENT TEAMS FY13 FY14 FY15 FY16 FY17 Selectively investing to drive long-term growth Consistent focus on consultant productivity Efficiency programmes on other costs STRONG TRACK RECORD OF PROFIT GROWTH 2
20 WE GENERATE MORE PROFIT THAN OUR MAJOR UK LISTED PEERS COMBINED Group Operating Profits ( m) AND ARE THE MOST EFFICIENT SPECIALIST RECRUITER Conversion rate % FY14 FY17 FY14 FY17 HAYS EBIT 1.2X COMBINED MAJOR UK LISTED PEERS 25% 20% 15% 10% 5% 0% 22.2% 17.5% 16.6% 11.9% 16.4% 11.4% 10.3% 4.6% FY13 FY14 FY15 FY16 FY17 PLUS 150m INCREMENTAL REVENUE INVESTMENT IN c.2,000 ADDITIONAL CONSULTANTS, IT CAPABILITY, BRANDING AND OFFICE SPACE OVER THE LAST FOUR YEARS Hays analysis of company reports and accounts. All numbers are shown before exceptional items or non-recurring items for the period July 2013 to June 2017.
21 THERE ARE 5 PILLARS WHICH UNDERPIN THE STRENGTH OF OUR A KEY BUSINESS DRIVER OF MODEL PERFORMANCE BETWEEN HAS BEEN OUR MULTI-FACETED MANAGEMENT OF THE BUSINESS AGGRESSIVE INVESTMENT IN STRUCTURAL GROWTH MARKETS Increased consultant headcount in Germany by c.560 people, or 60%, to over 1,500 BUILT CRITICAL SCALE ACROSS KEY MARKET SEGMENTS Invested in non-perm markets outside UK/Germ/ANZ, now 1/3 of their net fees, or c. 100m RAPIDLY RESPONDED TO FAST-CHANGING MARKET CONDITIONS Increased consultant headcount by c.200 in Australia to capitalise on improved market conditions RESHAPED & RESIZED COST BASE WHERE REQUIRED Early action to adjust cost base in UK pre- and post-eu referendum to defend profitability PERFORMANCE UNDERPINNED BY DECISIVE MANAGEMENT ACTION AROUND THE WORLD
22 2018 ASPIRATIONS: ON TRACK AFTER 4 YEARS UK & Ireland ( m) Operating Profit* FY FY FY18 OBJECTIVE ASSUMED 5YR NET FEE CAGR: +5% to +9% Germany ( m) Operating Profit* FY FY FY18 ORIGINAL FX Australia & NZ ( m) Operating Profit* FY FY FY18 ORIGINAL FX ASSUMED 5YR NET FEE CAGR: +1% to +5% Other Countries ( m) Operating Profit* FY FY FY18 ORIGINAL FX UK&I Vote to leave the EU Two general elections Hung parliament/political instability AUSTRALIA & NZ Mining crash Public sector backed investment Real economy returns to growth GERMANY 2013 Election led to grand coalition Regulatory uncertainties Pick up in economy OTHER COUNTRIES European slowdown and then recovery Subdued Asian banking markets Mixed conditions in Americas FX FLUCTUATIONS ASSUMED 5YR NET FEE CAGR: +7% to +12% ASSUMED 5YR NET FEE CAGR: +8% to +12% * Nothing in this presentation should be construed as a profit forecast. There is no certainty over timing or probability of achieving these objectives and they are dependent on a variety of assumptions and factors both Hays specific and otherwise. The 2018 Operating Profit ranges are after Group central cost allocation but before allocation of CERoW & Asia Pac divisional overheads (assumed to be 15m per annum) and assume constant rates of exchange as of 30 September All reported profit numbers are shown on a headline basis. 22
23 A TRACK RECORD OF MATERIAL CASH GENERATION FY14 - FY17 Operating Profit to free cash flow conversion Uses of cash flow OPERATING CASH FLOW 742m 697m 129m (84)m (213)m (19)m 510m Capex 60m Veredus 36m Acq. Pensions 57m Dividend 156m Eliminated net debt/built net cash 217m OPERATING PROFIT NON-CASH ITEMS WORKING CAPITAL TAX PAID INTEREST PAID FREE CASH FLOW Other (16)m NET DEBT ELIMINATED, STRONG CASH SURPLUS

24 THE NEXT PHASE OF HAYS PERFORMANCE PAUL VENABLES GROUP FINANCE DIRECTOR
25 WELL POSITIONED TO DELIVER FURTHER MATERIAL PROFIT GROWTH BALANCED CONTRACT TYPE EXPOSURE EXPOSURE TO BOTH MATURE AND STRUCTURAL GROWTH MARKETS AT SCALE MARKET LEADERSHIP IN KEY COUNTRIES SEVERAL BUSINESSES HIGHLY SCALABLE SIGNIFICANT OPERATING LEVERAGE Industry-leading Temp/Contracting business alongside a c. 400m net fee Perm business Perfectly positioned for current economic conditions c. 500m of our FY17 net fees generated in structural growth markets, which offer superior growth opportunities and relative resilience to our business model through the economic cycle Market leader in 8 countries incl. Germany, Australia, UK Top 5 position in a further 23 countries 20 countries with less than 100 consultants Infrastructure in place, highly scalable into continued market recovery High drop-through in larger and more mature businesses Continued focus on productivity and efficiency improvements SUPPORTED BY A STRONG AND EXPERIENCED GLOBAL MANAGEMENT TEAM
26 A PRIORITISED PIPELINE OF OPPORTUNITIES TO BUILD SCALE CORE PROFIT DRIVERS FUTURE MATERIAL PROFIT DRIVERS 20m+ TARGET 10m+ TARGET MEANINGFUL CONTRIBUTORS 5m+ TARGET NETWORK CRITICAL GERMANY AUSTRALIA UK FRANCE SWITZERLAND BELGIUM JAPAN SPAIN CANADA USA NEW ZEALAND POLAND NETHERLANDS CHINA MEXICO BRAZIL 17 OTHER HAYS COUNTRIES 0-5 YEARS 0-10 YEARS ONGOING
27 OUR PLAN ASSUMES THE CONTINUATION OF THE CURRENT GLOBAL ECONOMIC BACKDROP WE EXPECT TO BE OPERATING IN A WORLD WHERE GDP GROWTH REMAINS SUPPORTIVE, WITH DIFFERENCES BETWEEN REGIONAL GROWTH RATES WE ANTICIPATE REGULAR MINOR BUT MANAGEABLE ECONOMIC AND POLITICAL SHOCKS AND ASSUME NO SIGNIFICANT DOWNTURN IN OUR MAJOR MARKETS OVER THE PLAN PERIOD IN THE UK WE HAVE ASSUMED A CONTINUED UNCERTAIN ECONOMIC BACKDROP, WITH A BREXIT TRANSITION PERIOD BEYOND MARCH 2019 AND A REASONABLY ORDERLY EXIT FROM THE EU NO MATERIAL CHANGE IN KEY EXCHANGE RATES OVERALL WE NEED A CONTINUATION OF STABLE AND REASONABLY CONSISTENT LEVELS OF GDP GROWTH
28 EXTERNAL FORECASTS SUPPORT OUR ASSUMPTION OF MODEST OVERALL GROWTH ACROSS ADVANCED ECONOMIES GDP growth forecasts (% per annum) Key observations 2016A 2017F 2022F CHINA FRANCE RUSSIA AUSTRALIA US UK GERMANY JAPAN WORLD OVERALL GLOBAL GROWTH IS FORECAST TO BROADLY REMAIN AT CURRENT LEVELS ADVANCED ECONOMIES GROWTH REMAINS AT C.2% INFLATION REMAINS BELOW TARGET IN MOST ADVANCED ECONOMIES Source: Hays analysis of IMF World Economic Outlook (October 2017).
29 OUR 2022 ASPIRATIONS RANGE FROM 300M TO 450M WITH A MID-POINT CASE OF 375M Germany ( m) Operating Profit* Australia & NZ ( m) Operating Profit* FY FY FY22 OBJECTIVE LOWER MID UPPER FY22 OBJECTIVE ASSUMED 5YR NET FEE CAGR: +10% to +16% ASSUMED 5YR NET FEE CAGR: +4% to +9% UK & Ireland ( m) Operating Profit* FY Other Countries ( m) Operating Profit* FY FY22 OBJECTIVE FY22 OBJECTIVE ASSUMED 5YR NET FEE CAGR: -1% to +4% ASSUMED 5YR NET FEE CAGR: +6% to +11% * Nothing in this presentation should be construed as a profit forecast. There is no certainty over timing or probability of achieving these objectives and they are dependent on a variety of assumptions and factors both Hays specific and otherwise. The 2022 Operating Profit ranges are after Group central cost allocation but before allocation of CERoW & Asia Pac divisional overheads (assumed to be 15m per annum) and assume constant rates of exchange as of 30 September All reported profit numbers are shown on a headline basis.
30 WE MAINTAIN A DISCIPLINED APPROACH TO CASH GENERATION WITH CLEAR PRIORITIES FOR THE USES OF FREE CASH FLOW Our priorities for uses of free cash flow Our specific objectives FUND GROUP INVESTMENT AND DEVELOPMENT Invest in headcount, training, systems and brand to support organic growth Assess potential M&A opportunities when and where appropriate MAINTAIN A STRONG BALANCE SHEET Maintain a net cash position of c. 50m Address pension scheme deficit CORE DIVIDEND POLICY Deliver a core dividend which is sustainable, progressive and appropriate Target core dividend cover of 2.0x to 3.0x Group EPS EXCESS CASH RETURNS POLICY Assuming a positive outlook, any free cash flow generated over and above 50m will be distributed to shareholders via special dividends, or other appropriate methods, annually
31 POTENTIAL FOR MATERIAL RETURNS TO SHAREHOLDERS BASED ON ACHIEVING OUR 5 YEAR ASPIRATIONS m OPERATING PROFIT FREE CASH FLOW USES OF FREE CASH FLOW CAPEX DEFERRED VEREDUS (FY18) PENSION CORE DIVIDEND SPECIAL DIVIDEND TOTAL DIVIDENDS KEY ASSUMPTIONS: 1. Average working capital outflow of 50m per annum in mid-point case 2. No M&A spend built into the profit or the cash flow figures 3. Dividend policy unchanged, as per FY17 4. No assumed buyout of pension scheme 5. Share awards continue to be met by issuing new shares 6. Tax rate reduces to 29% over the plan period in mid-point case
32 STRONG PERFORMANCE IN , WITH SIGNIFICANT POTENTIAL FOR FURTHER STRONG PERFORMANCE IN STRONG BUSINESS MODEL AND OPERATIONAL MANAGEMENT GLOBALLY DELIVERED A CONSISTENTLY STRONG PROFIT PERFORMANCE IN FY14 - FY17 PERFECTLY POSITIONED TO DELIVER FURTHER MATERIAL PROFIT GROWTH SET OUT CLEAR ASPIRATION WITH A MID-POINT CASE TO DELIVER 375M PROFIT IN JUNE 2022 MID-POINT CASE COULD DELIVER MATERIAL CASH DISTRIBUTION TO SHAREHOLDERS OF > 700M OVER THE PLAN PERIOD ON TRACK WITH 2018 ASPIRATIONS, SIGNIFICANT UPSIDE IN NEXT PHASE OF GROWTH
 NICK DELIGIANNIS MD AUSTRALIA & NEW")
33 DELIVERING THE NEXT PHASE OF GROWTH PANEL DISCUSSION KLAUS BREITSCHOPF CEO DACH, NORDICS & RUSSIA JOHN FARAGUNA PRESIDENT HAYS AMERICAS NIGEL HEAP MD UKI & EMEA (EX-GERMANY) NICK DELIGIANNIS MD AUSTRALIA & NEW ZEALAND

34 QUESTIONS & ANSWERS

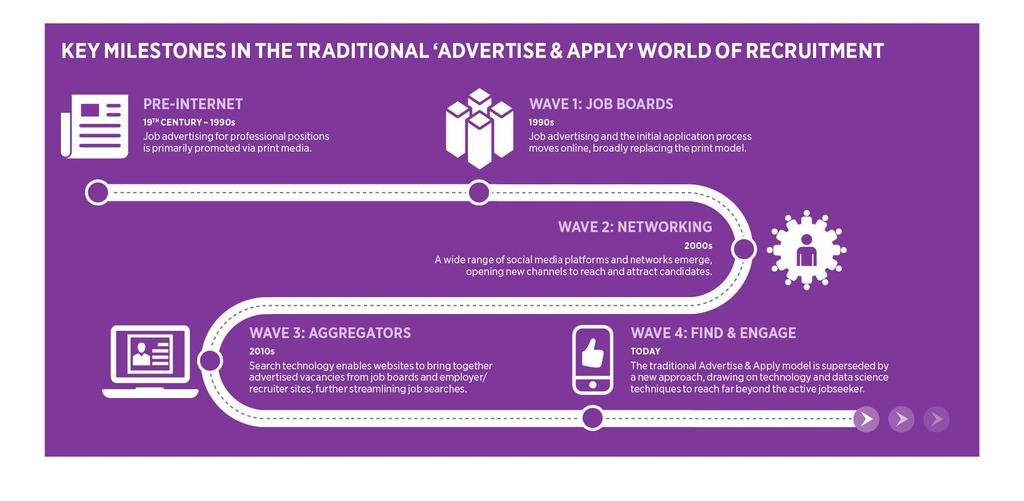
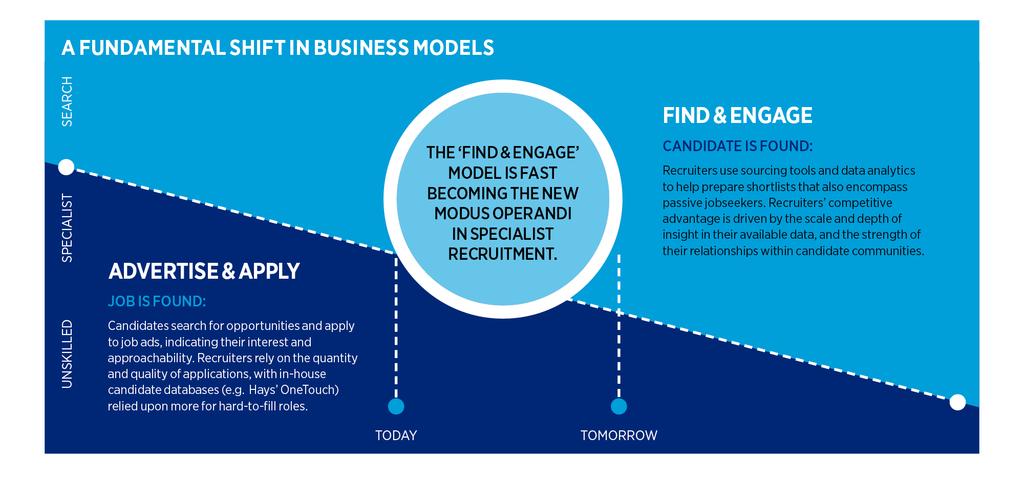
35 FUTURE SHAPE AND DIRECTION OF THE WORLD OF WORK ALISTAIR COX CHIEF EXECUTIVE
36 WE IDENTIFY FOUR MEGA TRENDS IN OUR INDUSTRY MORE AND VARIED WAYS OF BUILDING A CAREER SKILLS SHORTAGES & BUSINESS DEMAND FOR FLEXIBILITY STRUCTURAL MARKET GROWTH & EVOLVING CLIENT DEMANDS THE EMERGENCE OF NEW AND EVOLVING TECHNOLOGIES

37 MANAGING & EVOLVING OUR CORE BUSINESS NIGEL HEAP MD, UK&I AND EMEA (EX-GERMANY)
38 THE SCOPE AND SCALE OF OUR BUSINESS HAS NEVER BEEN GREATER FY17 STATISTICS 70, , million CVs RECEIVED >550, million PERM PLACEMENTS TEMP ASSIGNMENTS 250 6,884 CANDIDATE PROFILES 33 GLOBAL OFFICES CONSULTANTS CANDIDATE INTERVIEWS COUNTRY BUSINESSES WORLDWIDE WE FILL OVER 1,000 JOBS EVERY WORKING DAY
39 AND THE COMPLEXITY HAS INCREASED DRAMATICALLY OVER TIME INFORMATION AND DATA OVERLOAD INCREASED, MORE COMPLEX COMPLIANCE AND REGULATION FUNDAMENTAL CHANGES IN THE NATURE OF CLIENT INTERACTION CANDIDATES DEMAND FOR MOBILE ACCESS TO JOBS MARKET MARGIN PRESSURES IN MORE MATURE MARKETS MANAGING RAPID EXPANSION IN GROWTH MARKETS
40 KPIs FOCUSED ON MAXIMISING THE PRODUCTIVITY OF OUR BUSINESS PERM TEMP NET FEES PER 4-WEEK PERIOD CONVERSION RATE PERM JOBS REGISTERED INTERVIEW NUMBERS NUMBER OF PERMS PLACED AVERAGE PERM FEE TEMP ROLES REGISTERED TEMPS PAID / WEEK TEMPS PAID / CONSULTANT UNDERLYING TEMP MARGIN
41 IMPROVING PRODUCTIVITY DELIVERS SIGNIFICANT FINANCIAL UPSIDE AVERAGE CONSULTANT HEADCOUNT GROUP NET FEES FEES PER CONSULTANT IMPACT OF A FURTHER 5% IMPROVEMENT FY17 6, m 144k +5% c.85% FY13* 5, m* 137k* CHANGE +28% +34% +5% + 7k + 48m + 41m FEES/ CONSULTANT TOTAL NET FEES DROP THRU OPERATING PROFIT *Retranslated at average FX rates as of 30 June 2017


42 PANEL DISCUSSION - KEY OPERATORS CHRIS DOTTIE Managing Director, Spain TINA LING Managing Director, France PAM LINDSAY-DUNN Regional MD, North UK Joined Hays: 1996 Joined Hays: 1988 Joined Hays: 1995

43 A PROACTIVE AND OPEN-MINDED APPROACH TO INNOVATION AND TECHNOLOGY STEVE WESTON GROUP CHIEF INFORMATION OFFICER


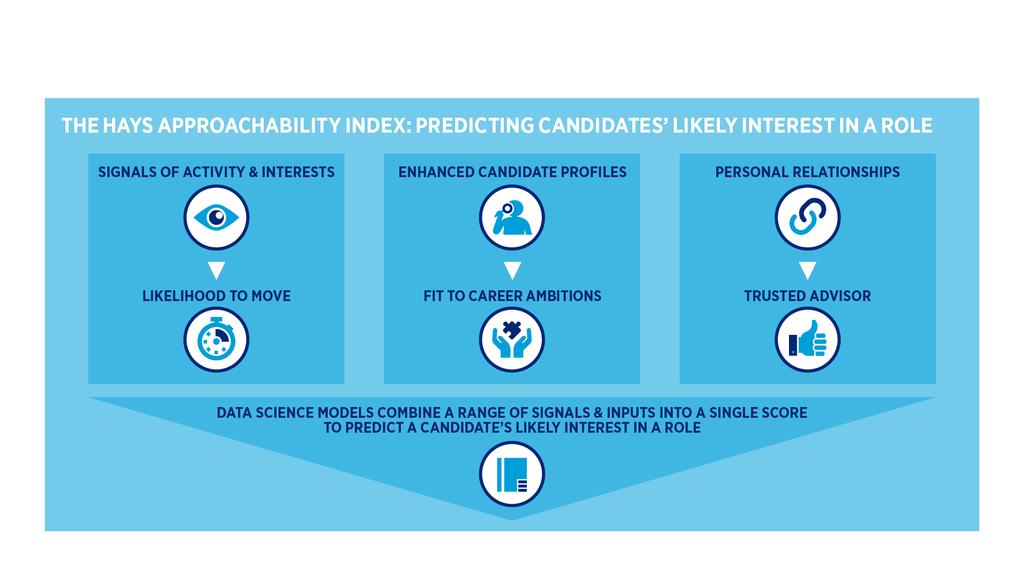
44 APPROACHABILITY CONNECTIVITY EFFICIENCY
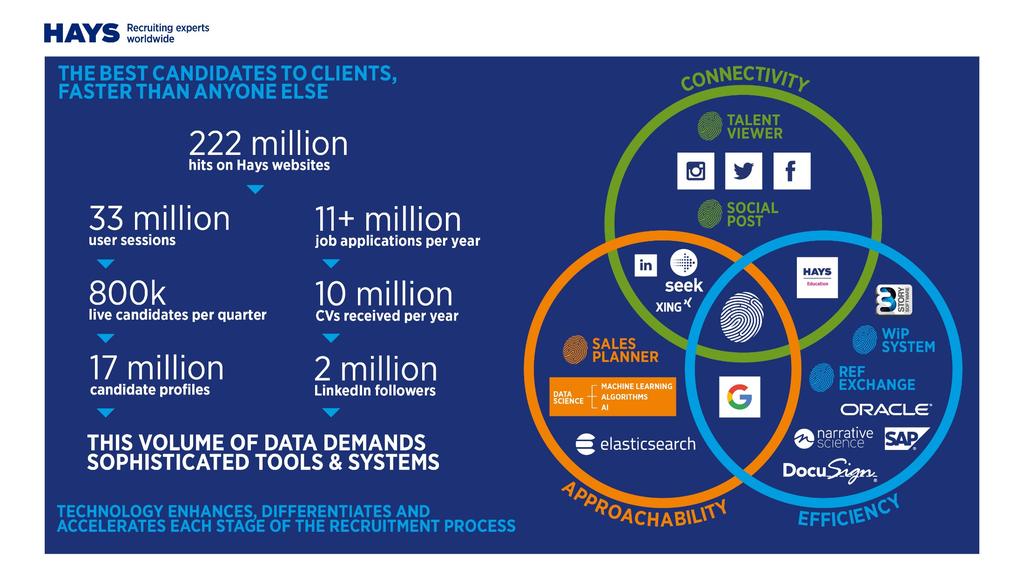
45 WE ARE A DATA-DRIVEN BUSINESS 222 million HITS ON HAYS WEBSITES CVs RECEIVED 10 million PER YEAR 800,000 LIVE CANDIDATES PER QUARTER 33 million USER SESSIONS 2 million LINKEDIN FOLLOWERS >11 million JOB APPLICATIONS 17 million CANDIDATE PROFILES THIS VOLUME OF DATA DEMANDS SOPHISTICATED TOOLS & SYSTEMS 45
46 OUR APPROACH IS DRIVEN BY A FOCUS ON OUR CORE VALUE PROPOSITION APPROACHABILITY CONNECTIVITY EFFICIENCY MAXIMISE OPERATIONAL EFFECTIVENESS DELIVER THE BEST CUSTOMER SERVICE DIGITALLY-ENABLED CONSULTANTS THE BEST CANDIDATES TO CLIENTS, FASTER THAN ANYONE ELSE


47 TALENT VIEWER CONNECTIVITY SOCIAL POST DATA SCIENCE MACHINE LEARNING AI ALGORITHMS WiP SYSTEM REF EXCHANGE SALES PLANNER
48 OUR ABILITY TO BE NIMBLE AND RESPOND QUICKLY IS KEY TO OUR APPROACH 1 WEEK DIGITAL CUSTOMER ENGAGEMENT 2 WEEKS MACHINE LEARNING AND AI FEATURES 4 WEEKS DIGITAL COMPLIANCE PRODUCTS 6 WEEKS OPERATIONAL SYSTEMS
49 OUR FUTURE APPROACH WILL REMAIN FOCUSED HIGH VALUE OF HUMAN TOUCH PROCESS, VOLUME & SPEED ART + SCIENCE Higher skill / higher margin FOCUSED ON ENHANCING OUR CORE OFFERING IN THE HIGHLY SKILLED/HIGHER MARGIN SEGMENT OF THE MARKET Skills are in short supply LOW Lower skill / lower margin Client demand is high Candidate matching is key Challenging to automate High AUTOMATION POTENTIAL Low

50 MARKETING A NEW RECRUITMENT MODEL SHOLTO DOUGLAS-HOME CHIEF MARKETING OFFICER
51 51
52


53 CAREER ADVICE INDUSTRY COMMENTARY THOUGHT LEADERSHIP
54 THE POWER OF HAYS CONTENT 2 MILLION LINKEDIN FOLLOWERS 2 TIMES MORE LIKELY TO APPLY FOR A HAYS JOB THAN NON-HAYS FOLLOWERS 700 VIEWPOINT BLOGS & 2 MILLION PAGE VIEWS


55 GLOBAL BRAND EXPOSURE OFFICIAL RECRUITMENT PARTNER MANCHESTER CITY STRATEGIC PARTNER CONFEDERATION OF BRITISH INDUSTRY CONTINUOUS INVESTMENT IN BUILDING GLOBAL BRAND AWARENESS
56


57 THE SCALE OF MARKETING ENGAGEMENT 13 MILLION INTERACTIONS EVERY MONTH 290,000 NEW CLIENT CONTACTS 820,000 NEW CANDIDATE CONTACTS

58 CONTRACTING AS A FUTURE KEY DRIVER FOR GROWTH CHRISTOPH NIEWERTH HAYS GERMANY CHIEF OPERATING OFFICER

59 CONTRACTING IS A HIGHLY ATTRACTIVE MARKET FOR HAYS 1 4 CLEAR STRUCTURAL GROWTH GREATER EARNINGS RESILIENCE EXISTING HAYS EXPERTISE SIGNIFICANT BARRIERS TO ENTRY 2 3
60 CLEAR STRUCTURAL GROWTH: DRIVEN BY CLIENTS & CANDIDATES CORPORATE DRIVERS INCLUDE Drive to embed more flexibility into their skilled employee cost base Legislative changes New types of job roles being created and required A demand for niche skills for specific needs at specific times Uncertain/fast-changing market backdrops CANDIDATE DRIVERS INCLUDE Cultural changes in perceptions of flexible work Contracting becoming the new perm in many skilled jobs markets Recognition of the benefits of flexibility A demand for work/life balance More skilled candidates choosing to build careers on a project-based basis SKILLS SHORTAGES
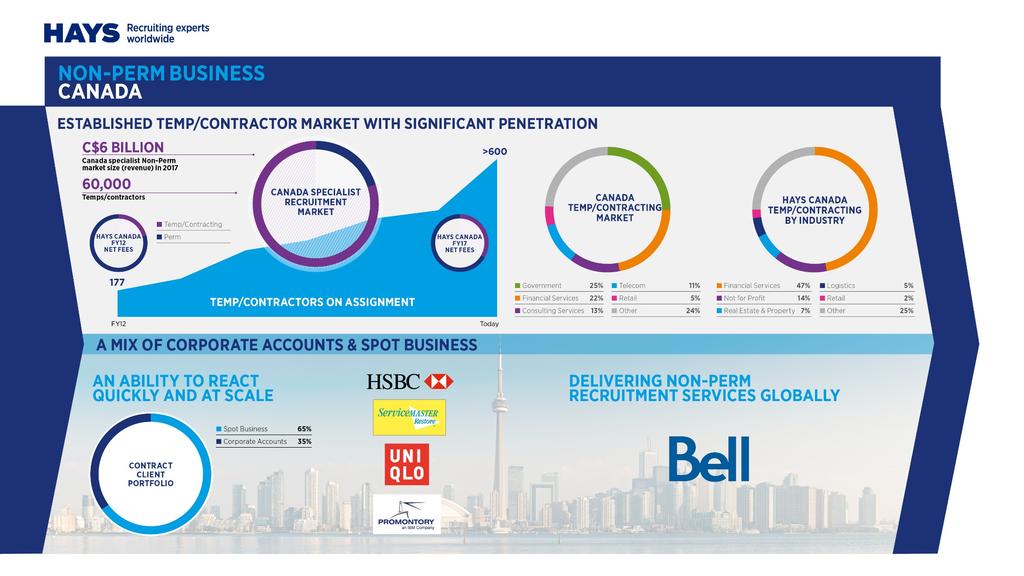
61 WE HAVE BUILT SCALE AND EXPERTISE IN THIS MARKET OVER MANY YEARS German Temp & Contracting Temp/Contractor business as % of net fees 87% OF GERMAN NET FEES 12,000 TEMPS & CONTRACTORS 11% NET FEE CAGR IN THE LAST 5 YEARS BEST-PRACTICE EXPERTISE PROCESSES CANADA 32% USA 62% NETHERLANDS FRANCE 32% 68% SWITZERLAND BELGIUM 55% 80% 66 % JAPAN 22% 75% FOCUSED ON IT & ENGINEERING
 COMPLIANCE AS A DIFFERENTIATOR BACKGROUND CHECKING PROCESSES ABILITY TO DELIVER AT SPEED & SCALE DEEP SECTOR / LOCAL MARKET EXPERTISE LOCAL")
62 A MARKET WITH SIGNIFICANT BARRIERS TO ENTRY EFFICIENT, SCALABLE BACK OFFICE SYSTEMS (PAYROLLING ETC.) COMPLIANCE AS A DIFFERENTIATOR BACKGROUND CHECKING PROCESSES ABILITY TO DELIVER AT SPEED & SCALE DEEP SECTOR / LOCAL MARKET EXPERTISE LOCAL CANDIDATE ATTRACTION NETWORKS / DATABASES
63 A HIGH VALUE, MORE RESILIENT SOURCE OF EARNINGS LONG-TERM NATURE OF ASSIGNMENTS TYPICAL DURATION OF 6-9 MONTHS HIGH RELATIVE PAY OF ROLES AVERAGE ANNUAL SALARY OF 100K + DEMAND FOR FLEXIBLE SKILLS IN TECHNICAL SPECIALISMS SUPPORTS HIGH RELATIVE AVERAGE MARGIN MORE DEFENSIBLE, HARDER TO REPLICATE, MORE VALUABLE

64 POSITIONING HAYS AS THE ULTIMATE PEOPLE BUSINESS SANDRA HENKE GROUP HEAD OF PEOPLE & CULTURE
65 OUR ABILITY TO HIRE, DEVELOP AND ENGAGE THE BEST PEOPLE IN OUR INDUSTRY IS KEY TO OUR SUCCESS MATERIALLY INCREASE & DIVERSIFY GROUP PROFITS BUILD CRITICAL MASS & DIVERSITY ACROSS OUR GLOBAL PLATFORM GENERATE, REINVEST & DISTRIBUTE MEANINGFUL CASH RETURNS INVEST IN PEOPLE, TECHNOLOGY, COLLABORATIONS & INNOVATION
66 WE ARE THE ULTIMATE PEOPLE BUSINESS UNIQUE PARTNERSHIPS SECTOR-LEADING TECHNOLOGY TOOLS A WORLD CLASS BRAND UNRIVALLED SCALE, BALANCE & DIVERSITY THE BEST PEOPLE SURGICAL, TARGETED INVESTMENT GLOBALLY INTEGRATED DATABASE


67 INCREASINGLY BEING RECOGNISED AS THE EMPLOYER OF CHOICE FOR THE BEST TALENT AROUND THE WORLD


68 A FOCUS ON DIVERSITY & INCLUSION IS INCREASINGLY IMPORTANT TO OUR OWN EMPLOYEES, OUR CLIENTS AND CANDIDATES PARTNERSHIPS THOUGHT LEADERSHIP & HAYS LEADING WOMEN NETWORKS


69 WE HAVE BECOME SMARTER AND MORE SOPHISTICATED IN HOW WE HIRE TO SOURCE THE BEST TALENT BEST-IN-CLASS ONLINE CANDIDATE ATTRACTION TOOLS TARGETED SOCIAL AND DIGITAL MEDIA CAMPAIGNS >150K APPLICATIONS WORLDWIDE/YEAR THOROUGH ASSESSMENT AND SELECTION MODEL INTERNAL RECRUITING TEAMS IN ALL REGIONS WITH LOCAL EXPERTISE SUPPORTED BY HAYS DNA DEPLOYED INTERNATIONALLY
70 TRAINING & DEVELOPMENT AT ALL LEVELS IS VITAL AND EMBEDDED INTO OUR BUSINESS AS A KEY ENABLER FOR GROWTH SALES (NON-PERISHABLE) SUPPORTED AND ENABLED BY TECHNOLOGY/SYSTEMS (EVOLVING) MANAGEMENT TRAINING FAST TRACK PROGRAMMES LEADERSHIP TRAINING SUCCESSION PLANNING SECURING THE FUTURE

71 QUESTIONS & ANSWERS
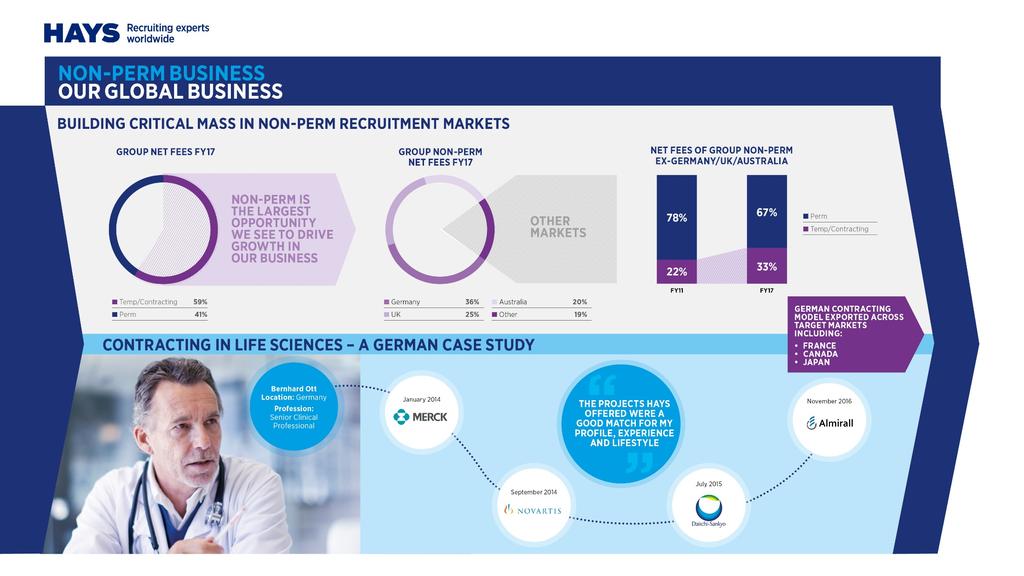
72 BREAKOUT SESSIONS LEVERAGING INNOVATION AND COLLABORATIONS TO DRIVE FURTHER GROWTH OUR PLANS TO DOUBLE OUR GERMAN BUSINESS BUILDING CRITICAL MASS IN NON-PERM RECRUITMENT MARKETS BREAKOUT AREA 1 (DOWNSTAIRS) BREAKOUT AREA 2 (UPSTAIRS) BREAKOUT AREA 3 (UPSTAIRS)

73 WRAP UP & KEY TAKEAWAYS ALISTAIR COX CHIEF EXECUTIVE
74 WE HAVE A CLEAR AND COMPELLING INVESTMENT CASE THE BREADTH OF OUR BUSINESS MODEL ACROSS GEOGRAPHY, SECTOR & CONTRACT TYPE OUR BALANCED EXPOSURE TO BOTH MATURE & STRUCTURAL GROWTH MARKETS OUR ABILITY TO DELIVER SUPERIOR FINANCIAL PERFORMANCE THROUGH THE CYCLE OUR POTENTIAL TO GENERATE SIGNIFICANT CASHFLOW & DIVIDENDS The diversity and growth potential of our International business Our clear plan to deliver further progress and growth in Contracting globally The scale of our business in the world s best growth markets over 50% of net fees The leverage which exists in our cyclical markets, and our ability to capitalise Our aspiration to deliver between 300m and 450m of operating profit by 2022 The increased resilience in our earnings today with 59% of the business in Non-Perm The significant cash generation potential of delivering on our goals The clear shareholder return policy we have in place

75 BREAKOUT 1 LEVERAGING INNOVATION AND COLLABORATIONS TO DRIVE FURTHER GROWTH
76

77 BREAKOUT 2 OUR PLANS TO DOUBLE OUR GERMAN BUSINESS
78
79

80 BREAKOUT 3 BUILDING CRITICAL MASS IN NON-PERM RECRUITMENT MARKETS
81
82
83


84 PROFILE OF HAYS AUSTRALIA & NEW ZEALAND Year ended 30 June 2017 TEMP 66% PERM 34% 181m 63m 35% NET FEES EBIT CONV. RATE 19% GROUP NET FEES 911 CONSULTANTS 38 OFFICES Net fees by specialism Net fees by region Construction & Property Acc. & Finance Office Support IT Banking Res & Mining* Other Q land NSW Victoria ACT WA Other 27% 14% 12% 10% 7% 4% 26% 30% 23% 11% 9% 9% 18% Note: All data is presented as of 30 June * Includes Oil & Gas and Energy.
85 HISTORIC PROFILE OF HAYS AUSTRALIA & NEW ZEALAND Historic headline net fees ( M) Historic headline operating profit ( M) FY08 FY09 FY10 FY11 FY12 FY13 FY14 FY15 FY16 FY17 FY consultant headcount FY08 FY09 FY10 FY11 FY12 FY13 FY14 FY15 FY16 FY17 Historic Conversion Rates 1, FY08 FY09 FY10 FY11 FY12 FY13 FY14 FY15 FY16 FY17 FY08 FY09 FY10 FY11 FY12 FY13 FY14 FY15 FY16 FY17 Note: Historic net fees and historic operating profit shown on a headline basis. For local currency data, please see slide 63.


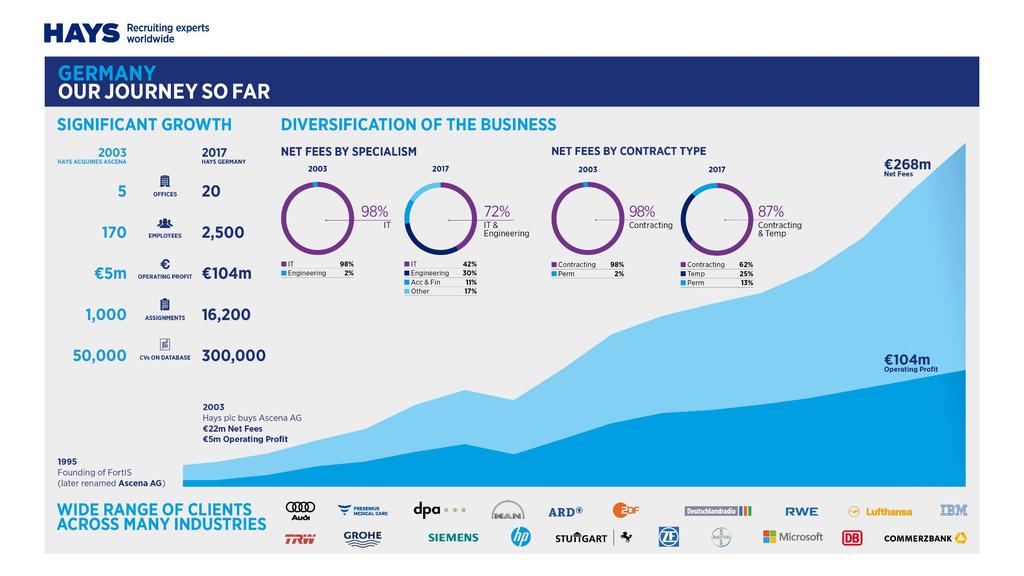
86 PROFILE OF HAYS GERMANY Year ended 30 June 2017 TEMP 87% PERM 13% 230m 81m 35% NET FEES EBIT CONV. RATE 24% GROUP NET FEES 1,503 CONSULTANTS 19 OFFICES Net fees by specialism Net fees by contract type IT Engineering Acc. & Finance Other Contracting Temp Perm 42% 30% 11% 17% 62% 25% 13% Note: All data is presented as of 30 June 2017.
87 HISTORIC PROFILE OF HAYS GERMANY Historic headline net fees ( M) Historic headline operating profit ( M) FY08 FY09 FY10 FY11 FY12 FY13 FY14 FY15 FY16 FY17 FY consultant headcount FY08 FY09 FY10 FY11 FY12 FY13 FY14 FY15 FY16 FY17 Historic Conversion Rates ,503 1,213 1, FY08 FY09 FY10 FY11 FY12 FY13 FY14 FY15 FY16 FY17 FY08 FY09 FY10 FY11 FY12 FY13 FY14 FY15 FY16 FY17 Note: Historic net fees and historic operating profit shown on a headline basis. For local currency data, please see slide 63.
88 HISTORIC PROFILE OF HAYS UK & IRELAND Historic headline net fees ( M) FY08 FY09 FY10 FY11 FY12 FY13 FY14 FY15 FY16 FY17 FY consultant headcount Historic headline operating profit ( M) (7) 6 FY08 FY09 FY10 FY11 FY12 FY13 FY14 FY15 FY16 FY17 Historic Conversion Rates 3,128 2,315 2,272 2,158 1,934 1,929 2,157 2,203 2,024 1, (3) FY08 FY09 FY10 FY11 FY12 FY13 FY14 FY15 FY16 FY17 FY08 FY09 FY10 FY11 FY12 FY13 FY14 FY15 FY16 FY17 Note: Historic net fees and historic operating profit shown on a headline basis.
89 LOCAL CURRENCY HAYS NET FEES AND OPERATING PROFIT Australia & New Zealand Historic net fees (AUDm) Australia & New Zealand Historic operating profit (AUDm) FY08 FY09 FY10 FY11 FY12 FY13 FY14 FY15 FY16 FY17 FY08 FY09 FY10 FY11 FY12 FY13 FY14 FY15 FY16 FY17 Germany Historic net fees (EURm) Germany Historic operating profit (EURm) FY08 FY09 FY10 FY11 FY12 FY13 FY14 FY15 FY16 FY17 FY08 FY09 FY10 FY11 FY12 FY13 FY14 FY15 FY16 FY17
QUARTERLY UPDATE FOR THE THREE MONTHS ENDED 31 MARCH 2018
 QUARTERLY UPDATE FOR THE THREE MONTHS ENDED 31 MARCH 2018 12 April 2018 Financial summary Growth in net fees for the quarter ended 31 March 2018 (Q3 FY18) (versus the same period last year) Growth Actual
QUARTERLY UPDATE FOR THE THREE MONTHS ENDED 31 MARCH 2017
 QUARTERLY UPDATE FOR THE THREE MONTHS ENDED 31 MARCH 2017 13 April 2017 Financial summary Growth in net fees for the quarter ended 31 March 2017 (Q3 FY17) (versus the same period last year) Growth Actual
INTERIM MANAGEMENT STATEMENT QUARTER ENDED 31 MARCH April 2013
 - INTERIM MANAGEMENT STATEMENT QUARTER ENDED 31 MARCH 2013 11 April 2013 Financial summary Growth in net fees for the quarter ended 31 March 2013 (Q3 FY13) (versus the same period last year) Growth Actual
INTERIM MANAGEMENT STATEMENT QUARTER ENDED 31 MARCH April 2015
 - INTERIM MANAGEMENT STATEMENT QUARTER ENDED 31 MARCH 2015 10 April 2015 Financial summary Growth in net fees for the quarter ended 31 March 2015 (Q3 FY15) (versus the same period last year) Growth Actual
QUARTERLY UPDATE FOR THE THREE MONTHS ENDED 30 JUNE 2018
 QUARTERLY UPDATE FOR THE THREE MONTHS ENDED 30 JUNE 2018 13 July 2018 Financial summary Growth in net fees for the quarter ended 30 June 2018 (Q4 FY18) (versus the same period last year) Growth Actual
PRELIMINARY RESULTS. Year ended 30 June 2016
 PRELIMINARY RESULTS Year ended 30 June 2016 CAUTIONARY STATEMENT This presentation contains certain statements that are neither reported financial results nor other historical information. The information
QUARTERLY UPDATE FOR THE THREE MONTHS ENDED 30 SEPTEMBER 2018
 QUARTERLY UPDATE FOR THE THREE MONTHS ENDED 30 SEPTEMBER 2018 11 October 2018 Financial summary Growth in net fees for the quarter ended 30 September 2018 (Q1 FY19) (versus the same period last year) Growth
QUARTERLY UPDATE FOR THE THREE MONTHS ENDED 31 DECEMBER 2017
 QUARTERLY UPDATE FOR THE THREE MONTHS ENDED 31 DECEMBER 2017 11 January 2018 Financial summary Growth in net fees for the quarter ended 31 December 2017 (Q2 FY18) (versus the same period last year) Growth
INTERIM MANAGEMENT STATEMENT QUARTER ENDED 31 MARCH 2012
 INTERIM MANAGEMENT STATEMENT QUARTER ENDED 31 MARCH 2012 12 April 2012 Financial summary Growth in net fees for the quarter ended 31 March 2012 (Q3) (versus the same period last year) Actual Growth LFL*
INTERIM MANAGEMENT STATEMENT QUARTER ENDED 30 SEPTEMBER 2011
 INTERIM MANAGEMENT STATEMENT QUARTER ENDED 30 SEPTEMBER 2011 6 October 2011 Financial summary Growth in net fees for the quarter ended 30 September 2011 (Q1) (versus the same period last year) actual growth
HALF YEAR REPORT SIX MONTHS ENDED 31 DECEMBER February 2015
 HALF YEAR REPORT SIX MONTHS ENDED 31 DECEMBER 2014 25 February 2015 EXCELLENT OPERATING LEVERAGE DRIVES 30% (1) PROFIT GROWTH FROM STRONG 10% (1) NET FEE GROWTH Six months ended 31 December (In s million)
INTERIM MANAGEMENT STATEMENT QUARTER ENDED 30 SEPTEMBER 2010
 INTERIM MANAGEMENT STATEMENT QUARTER ENDED 30 SEPTEMBER 2010 7 October 2010 Financial summary Growth in net fees for the quarter ended 30 September 2010 (Q1) (versus the same period last year) actual growth
First Quarter Interim Management Statement. 11 April 2011
 First Quarter Interim Management Statement 11 April 211 Michael Page International First Quarter Interim Management Statement 2 Group Gross profit +29% with growth in every geography Growth Rates Group
Another quarter of double digit growth
 11 April 2018 2018 Trading Update Steve Ingham Kelvin Stagg Chief Executive Officer Chief Financial Officer Another quarter of double digit growth LSE: PAGE.L Website: http://www.page.com/investors Headline
HALF YEAR REPORT SIX MONTHS ENDED 31 DECEMBER February 2017
 HALF YEAR REPORT SIX MONTHS ENDED 31 DECEMBER 2016 22 February 2017 18 ALL-TIME RECORD COUNTRY PERFORMANCES, INCLUDING GERMANY & FRANCE Six months ended 31 December (In s million) 2016 2015 Actual growth
HARVEY NASH GROUP PLC. Albert Ellis, CEO Mark Garratt, CFO. results ahead of expectations increased dividend strong platform to accelerate growth
 HARVEY NASH GROUP PLC Albert Ellis, CEO Mark Garratt, CFO results ahead of expectations increased dividend strong platform to accelerate growth HIGHLIGHTS Results ahead of expectations Strong operating
First ever quarter with over 200m Gross Profit
 11 July 2018 and H1 2018 Trading Update Steve Ingham Kelvin Stagg Chief Executive Officer Chief Financial Officer First ever quarter with over 200m Gross Profit LSE: PAGE.L Website: http://www.page.com/investors
HALF YEAR REPORT SIX MONTHS ENDED 31 DECEMBER February 2016
 HALF YEAR REPORT SIX MONTHS ENDED 31 DECEMBER 2015 24 February 2016 CONTINUED STRONG OPERATING LEVERAGE DRIVES 15% (1) PROFIT GROWTH FROM GOOD 8% (1) NET FEE GROWTH Six months ended 31 December (In s million)
Investor Presentation August Joost Kreulen Chief Executive Officer Spencer Wreford Group Finance Director
 Investor Presentation August 2016 Joost Kreulen Chief Executive Officer Spencer Wreford Group Finance Director Global Focus, Local Presence 1 Cautionary Statement The information contained in this presentation
PRELIMINARY RESULTS FOR THE YEAR ENDED 30 JUNE August 2018
 PRELIMINARY RESULTS FOR THE YEAR ENDED 30 JUNE 2018 30 August 2018 RECORD INTERNATIONAL PROFITS AND RECORD 128.4m TOTAL DIVIDENDS Year ended 30 June (In s million) 2018 2017 Actual growth LFL growth Net
PRELIMINARY RESULTS FOR THE YEAR ENDED 30 JUNE August 2017
 PRELIMINARY RESULTS FOR THE YEAR ENDED 30 JUNE 2017 31 August 2017 RECORD LEVEL OF INTERNATIONAL PROFIT AND FIRST SPECIAL DIVIDEND Year ended 30 June (In s million) 2017 2016 Actual growth LFL (1) growth
FULL YEAR RESULTS PRESENTATION 2017 RESULTS FOR YEAR ENDED 30 NOVEMBER 2017
 FULL YEAR RESULTS PRESENTATION 2017 RESULTS FOR YEAR ENDED 30 NOVEMBER 2017 2017 Overview Encouraging full year performance with strong Q4 and exit rate into 2018 Adjusted profit before tax up 9% to 44.5m
31 March 2018 Audited Preliminary Results. 6 June 2018
 31 March 2018 Audited Preliminary Results 6 June 2018 1 Presentation Team Euan Fraser Chief Executive Officer Stuart McNulty UK Chief Executive Officer John Paton Chief Financial Officer Has led Alpha
THE ULTIMATE PEOPLE BUSINESS. Hays plc Annual Report & Financial Statements 2017
 THE ULTIMATE PEOPLE BUSINESS Hays plc Annual Report & Financial Statements 2017 Overview WE ARE LEADING GLOBAL RECRUITING EXPERTS IN THE WORLD OF QUALIFIED, PROFESSIONAL AND SKILLED WORK The ultimate people
PRELIMINARY RESULTS FOR THE YEAR ENDED 30 JUNE st September 2016
 PRELIMINARY RESULTS FOR THE YEAR ENDED 30 JUNE 2016 1st September 2016 Preliminary Results STRONG GROWTH IN OPERATING PROFIT & CASH PERFORMANCE ELIMINATES NET DEBT Year ended 30 June (In s million) 2016
An introduction. May 2018
 An introduction May 2018 Our strategy To grow our specialist asset management activities 2 Invest selectively Grow assets under management Manage portfolios to maximise value Generate strong shareholder
2012 Results March PageGroup 2012 results 1
 2012 Results March 2013 PageGroup 2012 results 1 PageGroup 2012 results 2 Agenda Financial Review Segmental Analysis Strategy Summary Appendices Financial Review PageGroup 2012 results 3 PageGroup 2012
HALF YEAR REPORT SIX MONTHS ENDED 31 DECEMBER February 2019
 HALF YEAR REPORT SIX MONTHS ENDED 31 DECEMBER 2018 21 February 2019 20 COUNTRY RECORDS AND CONTINUED INVESTMENT IN KEY MARKETS Six months ended 31 December (In s million) 2018 2017 Actual growth LFL growth
Bank of America Merrill Lynch The Future of Financials Conference. November 6, Citi Investor Relations
 Citi Investor Relations Bank of America Merrill Lynch The Future of Financials Conference November 6, 2018 Francisco Aristeguieta CEO, Citigroup Asia Pacific Agenda Franchise Overview Asia Institutional
HALF-YEAR RESULTS Robert Walters plc 26 July 2017
 HALF-YEAR RESULTS Robert Walters plc STRATEGY & GROUP HIGHLIGHTS Robert Walters, Chief Executive Officer AGENDA FINANCIAL REVIEW Alan Bannatyne, Chief Financial Officer OPERATIONS REVIEW Giles Daubeney,
HALF YEAR RESULTS PRESENTATION 2018 RESULTS FOR THE SIX MONTHS ENDED 31 MAY 2018
 HALF YEAR RESULTS PRESENTATION 2018 RESULTS FOR THE SIX MONTHS ENDED 31 MAY 2018 2018 Overview Encouraging first half performance with accelerated momentum in Q2 Adjusted operating profit +6% to 20.4m
HALF-YEARLY FINANCIAL RESULTS 2018 ROBERT WALTERS PLC
 HALF-YEARLY FINANCIAL RESULTS ROBERT WALTERS PLC INTRODUCTION PEOPLE ARE THE MOST IMPORTANT COMPONENTS OF OUR BUSINESS. FROM THE JOB SEEKER, TO THE HIRING MANAGER, TO THOSE WHO BRING THEM TOGETHER. SO
Interim Results Presentation. 28 August 2017
 Interim Results Presentation 28 August 2017 Forward Looking Statements The information in this presentation has not been independently verified and does not purport to be comprehensive. One51 is not undertaking
HALF YEAR RESULTS Robert Walters plc 26 July 2018
 HALF YEAR RESULTS Robert Walters plc 26 July 2018 # AUSTRALIA BELGIUM BRAZIL CANADA CHINA FRANCE GERMANY HONG KONG INDIA INDONESIA IRELAND JAPAN LUXEMBOURG MALAYSIA NETHERLANDS NEW ZEALAND PHILIPPINES
2013 Interim Results. 14 August 2013
 2013 Interim Results 14 August 2013 1 This presentation contains statements that are, or may be, forward-looking regarding the group's financial position and results, business strategy, plans and objectives.
INFORCE MANAGEMENT. A strategic asset. Paul EVANS CEO of AXA UK & Ireland Member of the AXA Group Executive Committee. Investor Day November 20, 2014
 INFORCE MANAGEMENT A strategic asset Investor Day November 20, 2014 Paul EVANS CEO of AXA UK & Ireland Member of the AXA Group Executive Committee Certain statements contained herein are forward-looking
Full Year 2017 Results Presentation Bravura Solutions Limited
 Full Year 2017 Results Presentation Bravura Solutions Limited 23 rd August 2017 Important notice and disclaimer The information contained in this document (including this notice) or discussed at this presentation
1 st quarter 2015 results
 1 st quarter 2015 results continued improvement Jacques van den Broek, CEO Robert Jan van de Kraats, CFO Randstad Holding nv disclaimer & definitions Certain statements in this document concern prognoses
Foxtons Interim results presentation For the period ended 30 June 2018
 Foxtons Interim results presentation For the period ended 30 June 2018 Important information This presentation includes statements that are, or may be deemed to be, forward-looking statements. These forward-looking
Strategic Review ELIOR GROUP Develop, Innovate, Accelerate. September 24, 2015
 Strategic Review 2016-2020 ELIOR GROUP 2020 Develop, Innovate, Accelerate September 24, 2015 EXECUTIVE SUMMARY 2020 STRATEGY: Develop, Innovate, Accelerate 1 2 3 ELIOR A successful growth story Track record
Full year results presentation. 24 May 2016
 Full year results presentation 24 May 2016 Operational highlights Strong performance and record AUM 2 Total AUM up 20% to a record 21.6bn, with 5.2bn of new money raised Third party fee earning AUM up
Full Year Results Presentation (ASX Code: HIT) 31 AUGUST 2018
 31 AUGUST 2018") Full Year Results Presentation (ASX Code: HIT) 31 AUGUST 2018 Consistent track record is being rewarded in share price. HIT.ASX Share Price Aug 15 Nov 15 Feb 16 May 16 Aug 16 Nov 16 Feb 17 May 17 Aug 17
Full Year Results Presentation (ASX Code: HIT) 31 AUGUST 2018 Consistent track record is being rewarded in share price. HIT.ASX Share Price Aug 15 Nov 15 Feb 16 May 16 Aug 16 Nov 16 Feb 17 May 17 Aug 17
ELECTROCOMPONENTS Full-year results for the year ended 31 March 2018
 ELECTROCOMPONENTS Full-year results for the year ended 31 March 2018 24 May 2018 SAFE HARBOUR This presentation contains certain statements, statistics and projections that are or may be forward-looking.
Waters Corporation Management Presentation
 Waters Corporation Management Presentation Chris O Connell Chairman & Chief Executive Officer January 2019 Cautionary Statements This presentation may contain forward-looking statements regarding future
HUDSON GLOBAL. Baird s 2013 Business Solutions Conference. February 27, 2013
 HUDSON GLOBAL Baird s 2013 Business Solutions Conference February 27, 2013 FORWARD LOOKING STATEMENT Please be advised that except for historical information, the comments made during this presentation
Waters Corporation Management Presentation. July 2018
 Waters Corporation Management Presentation July 2018 Cautionary Statements This presentation may contain forward-looking statements regarding future results and events. For this purpose, any statements
UXC Limited ACN
 UXC Limited ACN 067 682 928 2015 Annual General Meeting Geoff Cosgriff, Chairman Cris Nicolli, Managing Director 29 October 2015 Welcome and introductions 2 Chairman s Address Mr. Geoff Cosgriff Recap
FY18 Results Presentation Bravura Solutions Limited. 28 August 2018
 FY18 Results Presentation Bravura Solutions Limited 28 August 2018 Important notice and disclaimer The information contained in this document (including this notice) and discussed at this presentation
INTERIM RESULTS PRESENTATION Strong start to the year, with a strong order book for the second half of September 2017
 INTERIM RESULTS PRESENTATION Strong start to the year, with a strong order book for the second half of 2017 11 September 2017 AGENDA Introduction and highlights John Hornby Financial review David Main
Investor Presentation
 Investor Presentation May 2013 48,000 employees 200 offices 70 countries 1 global platform Table of Contents I. Company Description II. Global Growth Strategy III. Financial Overview IV. Appendix 2 Company
Lindorff. Company Presentation. November 2016
 Lindorff Company Presentation November 06 Disclaimer IMPORTANT INFORMATION Not for distribution in or into the United States, Australia, Canada, Japan or any other jurisdiction in which such distribution
2015 RESULTS 15 MARCH 2016
 2015 RESULTS 15 MARCH 2016 STEFAN BOMHARD GROUP CHIEF EXECUTIVE 2015 HIGHLIGHTS Robust revenue, profit, margin growth and cash conversion Executive team strengthened by appointments and promotions Further
Working together to create value in the world of real estate. Investor Presentation. 58,000 employees, 230 offices, 80 countries, 1 global brand
 Working together to create value in the world of real estate Investor Presentation 58,000 employees, 230 offices, 80 countries, 1 global brand September 2015 Who we are JLL is a leading provider of real
MAY 2017 COMPANY PRESENTATION
 MAY 2017 COMPANY PRESENTATION 1 OVERVIEW MICHAEL SUTSKO OVERVIEW The world s largest installed base in heavy industrial LED lighting. Over 750,000 LED fixtures worldwide 97% OF THE MARKET OPPORTUNITY REMAINS
The Morgan Crucible Company plc Preliminary Results 20 th February 2007
 The Morgan Crucible Company plc 2006 Preliminary Results 20 th February 2007 Agenda Introduction Tim Stevenson 2006 preliminary financial results Kevin Dangerfield Our continuing progress in 2006 Mark
Inward investment after Brexit
 EY s UK Attractiveness Survey Inward investment after Brexit March 2018 Contents Executive summary 1 Investor perspectives on FDI 2 Methodology 11 About EY s Attractiveness Program 12 Executive summary
KION Q3 UPDATE CALL Gordon Riske, CEO Thomas Toepfer, CFO Wiesbaden, 14 November 2013
 KION Q3 UPDATE CALL 2013 Gordon Riske, CEO Thomas Toepfer, CFO Wiesbaden, 14 November 2013 AGENDA 1 Highlights 2013 Gordon Riske 2 Financial Update Thomas Toepfer 3 Outlook Gordon Riske 14 November 2013
Halma plc Final results 2016/17
 Halma plc Final results 2016/17 Summary of analysts presentation by: Andrew Williams, Chief Executive Kevin Thompson, Finance Director 13 June 2017 Page 2 Summary of analysts presentation 13 June 2017
Accelerating Performance IN THE HUMAN AGE
 Accelerating Performance IN THE HUMAN AGE Investor Presentation Forward-Looking Statement This presentation includes forward-looking statements which are subject to known and unknown risks and uncertainties.
2018 Full Year Results 20 November 2018
 2018 Full Year Results 20 November 2018 Disclaimer Certain information included in the following presentation is forward looking and involves risks, assumptions and uncertainties that could cause actual
Investor & Analyst Presentation
 Investor & Analyst Presentation FY18 H1 Results For the six monthsended 31 December 2017 15 th February 2018 Rebekah O Flaherty-CEO I Jonathan Kenny-CFO Agenda 1 2 3 4 5 6 Overview Strategic Priorities
THIS ANNOUNCEMENT CONTAINS INSIDE INFORMATION FOR THE PURPOSES OF ARTICLE 7 OF EU REGULATION 596/2014.
 31 January 2018 THIS ANNOUNCEMENT CONTAINS INSIDE INFORMATION FOR THE PURPOSES OF ARTICLE 7 OF EU REGULATION 596/2014. THIS ANNOUNCEMENT AND THE INFORMATION CONTAINED HEREIN IS RESTRICTED AND IS NOT FOR
Cover-More Group. UBS Australasia Conference. November 2015
 Cover-More Group UBS Australasia Conference November 2015 Executive summary: FY15 overview Cover-More delivered another year of double digit earnings growth, with offshore business growing substantially.
Savills plc: Results for the year ended 31 December 2016
 Savills plc: Results for the year ended 31 December 216 Disclaimer: Forward-looking statements These slides contain certain forward-looking statements including the Group s financial condition, results
2017 Full Year Results
 2017 Full Year Results Title of the presentation 2 lines Location, Date, Author Paris February 15 th, 2018 Disclaimer This presentation may contain forward-looking statements, Such statements may include
Savills plc. Results for the six months ended 30 th June August 2017
 Savills plc Results for the six months ended 30 th June 2017 10 August 2017 Disclaimer: Forward-looking statements These slides contain certain forward-looking statements including the Group s financial
F U T U R E O F W O R K
 H E A L T H W E A L T H C A R E E R F U T U R E O F W O R K Milan Taylor Partner, Mercer G E O P O L I T I C A L V O L AT I L I T Y G L O B A L T R E N D N O T J U S T U S What is on our employees minds?
Unilever Investor Event 2018 Graeme Pitkethly 4 th December 2018
 Unilever Investor Event 2018 Graeme Pitkethly 4 th December 2018 SAFE HARBOUR STATEMENT This announcement may contain forward-looking statements, including forward-looking statements within the meaning
HALF YEAR REPORT SIX MONTHS ENDED 31 DECEMBER February 2010
 HALF YEAR REPORT SIX MONTHS ENDED 31 DECEMBER 25 February 2010 Press Release DIVIDEND MAINTAINED IN DIFFICULT MARKETS 6 months ended Unaudited 2008 Actual growth LFL* growth Net fees 264.8 383.7 (31)%
CBL AGM Managing Director s Address
 CBL AGM 2017 - Managing Director s Address 2016 has been another record year for CBL. Our revenue growth has continued as we have identified and created opportunities across our key regions. Our gross
Aegis Group plc. 17 March 2011
 Aegis Group plc 2010 Full Year Results 2010 Full Year Results 17 March 2011 Agenda Introduction John Napier, Chairman Aegis Group overview Jerry Buhlmann, CEO Divisional review Aegis Media - Jerry Buhlmann,
KION UPDATE CALL Q Gordon Riske, CEO Thomas Toepfer, CFO Wiesbaden, 7 May 2015
 KION UPDATE CALL 2015 Gordon Riske, CEO Thomas Toepfer, CFO Wiesbaden, 7 May 2015 AGENDA 1 Highlights Gordon Riske 2 Market update Gordon Riske 3 Financial update Thomas Toepfer 4 Outlook Gordon Riske
1,196.1m m m
 We are one of the world s best known and most respected specialist recruitment consultancies. We deliver recruitment services to clients through a network of 140 offices across 36 countries. Our vision
2013 Annual General Meeting. Ken Hanna Chairman
 2013 Annual General Meeting Ken Hanna Chairman 2012 Results and Strategy Review Angus Cockburn CFO 2012 Results Pre-Exceptional 2012 2011 Movement m m As reported Underlying Revenue 1,583 1,396 13% 14%
ROBERT WALTERS PLC (the Company, or the Group ) Half-yearly financial results for the six months ended 30 June 2018 RECORD PROFITS, DIVIDEND UP 45%
 Half-yearly financial results for the six months ended 30 June 2018 RECORD PROFITS, DIVIDEND UP 45%") 26 July 2018 ROBERT WALTERS PLC (the Company, or the Group ) Half-yearly financial results for the six months ended 30 June 2018 RECORD PROFITS, DIVIDEND UP 45% Robert Walters plc (LSE: RWA), the leading
26 July 2018 ROBERT WALTERS PLC (the Company, or the Group ) Half-yearly financial results for the six months ended 30 June 2018 RECORD PROFITS, DIVIDEND UP 45% Robert Walters plc (LSE: RWA), the leading
Adecco Group Investor Presentation. May 2016
 Adecco Group Investor Presentation May 2016 Disclaimer and Note on Terminology Forward-looking statements Information in this release may involve guidance, expectations, beliefs, plans, intentions or strategies
Resilient performance, increased dividend and current financial year started well
 27 April HARVEY NASH GROUP PLC ( Harvey Nash or the Group ) PRELIMINARY RESULTS Resilient performance, increased dividend and current financial year started well Harvey Nash, the global recruitment and
Building on our STRENGTHS. Investing in our FUTURE.
 Building on our STRENGTHS. Investing in our FUTURE. Scotiabank Financials Summit Paul Mahon, President & CEO Great-West Lifeco Toronto September 8, 2016 CAUTIONARY NOTE REGARDING FORWARD-LOOKING INFORMATION
Full Year Results for the Year Ended 31 December 2015
 10 March 2016 Full Year Results for the Year Ended 31 December 2015 Michael Page International plc ( PageGroup ), the specialist professional recruitment company, announces its full year results for the
HALF-YEARLY FINANCIAL RESULTS 2017 ROBERT WALTERS PLC
 HALF-YEARLY FINANCIAL RESULTS ROBERT WALTERS PLC SPECIALISTS IN RECRUITMENT Robert Walters is a market-leading specialist professional recruitment group spanning 28 countries. Our specialist solutions
Business Update. USPP Conference Miami. Luis Damasceno Group CFO Michael Williams Group Finance Director & Treasurer January 2019
 Business Update USPP Conference Miami Luis Damasceno Group CFO Michael Williams Group Finance Director & Treasurer 23-25 January 2019 www.alsglobal.com IMPORTANT NOTICE AND DISCLAIMER This presentation
Year-end results. 18 May
 Year-end results 18 May Highlights for the year Strong operational performance Good performance across all areas of activity Deepened our core franchise Sound levels of corporate client and private client
Close Brothers Asset Management. Investor seminar
 Close Brothers Asset Management Investor seminar 4 December 218 Disclaimer Certain statements included or incorporated by reference within this presentation may constitute forward-looking statements in
Full year results presentation. 22 May 2018
 Full year results presentation 22 May 2018 Operational highlights Fundraising and capital deployment at record levels 2 Total AUM up 20% to 28.7bn, with 7.8bn of new money raised Fundraising driven by
ManpowerGroup Employment Outlook Survey Global
 ManpowerGroup Employment Outlook Survey Global 1 218 ManpowerGroup interviewed nearly 59, employers across 43 countries and territories to forecast labor market activity in Quarter 1 218. All participants
Building a better AA Putting Service, Innovation and Data at the heart of the AA
 LEI: 213800DTPE4O5OI17349 This announcement contains inside information Building a better AA Putting Service, Innovation and Data at the heart of the AA The AA is today presenting our new business strategy
INVESTOR PRESENTATION MAY 2018
 INVESTOR PRESENTATION MAY 2018 Forward-Looking Statements Forward-Looking Statements This presentation and other written or oral statements made from time to time by representatives of Broadridge Financial
Q Results. Adecco Group
 Adecco Group Zurich, Disclaimer and Note on Terminology Forward-looking statements Information in this release may involve guidance, expectations, beliefs, plans, intentions or strategies regarding the
26 FEBRUARY 2019 FULL YEAR RESULTS FOR THE YEAR ENDED 31 DECEMBER 2018 SIGNIFICANT PROGRESS ON STRATEGIC PRIORITIES AND IMPROVED PROFIT MARGIN
 26 FEBRUARY 2019 FULL YEAR RESULTS FOR THE YEAR ENDED 31 DECEMBER 2018 SIGNIFICANT PROGRESS ON STRATEGIC PRIORITIES AND IMPROVED PROFIT MARGIN 2018 HIGHLIGHTS Continued progress on operational and strategic
For personal use only. Investor Presentation Bravura Solutions Limited
 Investor Presentation Bravura Solutions Limited Tony Klim CEO 27 April 2017 The information contained in this document (including this notice) or discussed at this presentation (collectively, the Presentation)
OMAM. Investor Presentation. Fourth Quarter 2014
 OMAM Investor Presentation Fourth Quarter 2014 DISCLAIMER Forward Looking Statements This presentation may contain forward looking statements for the purposes of the safe harbor provision under the Private
H Interim Results 31 August 2017
 H1 2017 Interim Results 31 August 2017 Disclaimer The following presentation is being made only to, and is only directed at, persons to whom such presentation may lawfully be communicated ( relevant persons
OnePath Australian Shares
 OnePath Australian Shares Fund overview OnePath Australian Shares gives you access to a diverse portfolio of shares in companies listed on the Australian Securities Exchange (ASX). About the manager UBS
Investor & Analyst Presentation Ful YearResults 30 June2016 For personal use only 25th August 2016 Rebekah O Flaherty - CEO I Jonathan Kenny - CFO
 Investor & Analyst Presentation Full YearResults 30 June2016 25th August 2016 Rebekah O Flaherty - CEO I Jonathan Kenny - CFO Agenda 1 Overview 2 Strategic Priorities 3 FY16 Financial Results 4 FY17 Outlook
Electrocomponents 2017 half-year financial results. 18 November 2016
 Electrocomponents 2017 half-year financial results 18 November 2016 Agenda Overview of results Lindsley Ruth Financial results and performance update David Egan Performance Improvement Plan Lindsley Ruth
Investor Presentation
 14 MAR 2016 Investor Presentation 4Q and FY 2015 Results Hussein Hachem, CEO Bashar Obeid, CFO Management Update 4Q 2015 Results FY 2015 Results Long-term Performance Outlook & Guidance Page 1 Disclaimer
Part 1 Executing our strategy
 Entwurf 19.09.018 15h00 Part 1 Executing our strategy Klaus Rosenfeld Chief Executive Officer Capital Markets Day 018 Berlin Disclaimer This presentation contains forward-looking statements. The words
WILLIS GROUP HOLDINGS FACT BOOK FOR THE QUARTER ENDED JUNE 30, 2010
 WILLIS GROUP HOLDINGS FACT BOOK FOR THE QUARTER ENDED JUNE 30, 2010 Willis snapshot Leading global insurance broker Broad range of professional insurance, reinsurance, risk management, financial and human
FOURTH MEETING OF THE OECD FORUM ON TAX ADMINISTRATION January Cape Town Communiqué 11 January 2008
 ORGANISATION FOR ECONOMIC CO-OPERATION AND DEVELOPMENT FOURTH MEETING OF THE OECD FORUM ON TAX ADMINISTRATION 10-11 January 2008 Cape Town Communiqué 11 January 2008 CENTRE FOR TAX POLICY AND ADMINISTRATION
Development of the Client-Focused, Capital-Efficient Business Model
 Development of the Client-Focused, Capital-Efficient Business Model David Mathers, Chief Operating Officer, Investment Bank at the UBS Financial Services Conference, New York, May 12, 2010 Cautionary statement