ADVANCING MMI S STRATEGY
|
|
|
- Vivian Brooks
- 5 years ago
- Views:
Transcription


1 ADVANCING MMI S STRATEGY Financial results 2017 Momentum, Metropolitan, Guardrisk and Multiply form part of MMI Holdings Group, an authorised financial services provider.
2

3 Financial Results For 12 months ended 30 June FINANCIAL RESULTS MMI HOLDINGS 01
4 Summary of key metrics MMI s diluted core headline earnings of R3 208m (200 cents per share) were effectively flat year-on year. The largest positive driver of earnings was mortality experience which was R176m stronger in F2017, mainly as a result of much improved mortality profits in our Corporate & Public Sector (C&PS) segment. Core earnings were also aided by our decision to exit certain countries to improve focus on remaining operations. The largest headwind to earnings was the R179m reduction in discretionary margin releases relative to the prior year. F2017 also represents the first full year of start-up losses incurred in respect of our India health insurance joint venture (JV) and ayo, the MTN JV. Diluted headline earnings were R1 336m lower than diluted core headline earnings in F2017. R577m of the difference relates to amortisation of acquisition related intangibles. Another R458m of the difference arises from changes to actuarial assumptions and as a result of investment variances. Investment returns for the year were significantly lower than those assumed in the actuarial basis. Material actuarial assumption changes include a reduction in lapse assumptions on level premium risk policies and on joint life risk policies. Furthermore, R249m of the difference between core and headline earnings is attributable to non-recurring items. R175m of the R249m arises from our decision to reduce our footprint in Africa and the UK. New business margins declined from 1.6% to 1.3%. Volume growth was modest across all four segments and as such we have seen new business margins under pressure across all of the segments. Overall value of new business (VNB) has declined by 23% to R547m. We believe that the main driver of margin improvement in the future will be to improve the productivity and scale of our various sales channels. Group embedded value is slightly down over the year to R42.5bn (June 2016 was R43.0bn). This equates to embedded value per share of R26.51 on 30 June The return on embedded value (ROEV) for the year was 4.7%. ROEV on covered business was 8.3% during the period (12.6% excluding investment variances, interest rate changes, and forex movements). The ROEV on non-covered business was, however, disappointing at -10.4%. The biggest contributors to the weak non-covered ROEV were reduced valuations of our International operations and our SA asset management operations. Operating experience variation on the embedded value (EV) basis was modestly positive in F2017. Mortality and morbidity variances added R140m to positive variances (vs R161m in prior year). Credit experience also remains supportive and our credit risk variance was R117m in F2017 versus R70m in F2016. Our dividend policy references core headline earnings and targets a coverage range of 1.5x to 1.7x over time. We have declared a 92 cent per share final dividend which results in a full year dividend of 157 cents per share in respect of F2017. This equates to a 1.3x dividend cover. New business volumes are down 6% year-on-year to R41.6bn when measured on the present value of new business premiums (PVNBP) basis. Volumes were up on prior year for Metropolitan Retail (+5%) and for International (+3%). Momentum Retail is the largest business in the group and accounts for more than half of the new business volumes. PVNBP for Momentum Retail was down 3% for the year; mainly due to weaker sales of guaranteed endowments. C&PS volumes were down 16% versus F2016 due to weak inflows on investment products. Key metrics F2017 F2016 (%) Diluted core headline earnings per share (cents) Diluted headline earnings per share (cents) (11) Dividend per share (cents) New business volumes (PVNBP, ) (6) Value of new business () (23) New business margin (%) (0.3) Embedded value () (1) Return on Embedded Value (%) (8.1) 02 MMI HOLDINGS 2017 FINANCIAL RESULTS
5 Analysis of group earnings Diluted core headline earnings for the period were R3 208m which represents marginal growth on the comparative period. The main positive contributor to core earnings growth was C&PS where mortality profits improved significantly in the latter part of the financial year. Earnings from the Shareholder Capital segment are also up on the back of increasing investment income (in line with growth in investible assets). Momentum Retail Momentum Retail s earnings declined by 15% to R1 271m. Earnings from covered operations (life insurance) are down 9% to R 1 467m whereas losses from non-covered operations increased to R196m. The main reason for the reduced life insurance earnings is discretionary margin releases that were R179m lower in F2017. While we expect the level of discretionary margin releases to steadily decline over time, the decline in F2017 was exceptional due to a combination of certain discretionary margins being fully depleted by the end of F2016 and due to the interaction between investment returns and the release profile of the discretionary margins. Experience variances were also weaker year-on-year (approximately R100m lower on an IFRS basis) although mortality and morbidity variance remained strong. New business strain was significantly lower than in the prior period due to lower sales of products with high initial reserving strain (ie lower guaranteed endowment sales). Losses from non-covered operations reported within Momentum Retail increased from R111m to R196m. Profits on our Momentum Wealth platform declined due to higher investment in platform functionality and modest growth in assets under management. The improved operating performance in our short-term insurance operation is also somewhat hidden by the more conservative treatment of deferred tax assets in the current period. Mortality and morbidity experience remains strong. Persistency experience was negative overall in F2017. We are taking management action to improve collection rates and have seen positive results in recent months. Corporate and Public Sector C&PS earnings increased by 23% to R835m with improved underwriting experience, excluding disability experience, explaining more than R150m of the year-on-year increase. Unfortunately disability experience remains problematic and our experience variation deteriorated slightly during the past year. We continue to put through substantial price increases on disability risks and expect underwriting results to improve over time. Our property business, ERIS, contributed R99m (+46%) to core headline earnings and Guardrisk made another solid contribution of R200m (+40%). Health contributed R136m to C&PS in F2017. International Losses from International increased during the period to R166m. F2017 is the first year where India and ayo are included in the numbers for the full twelve months. These two entities incurred R90m higher start-up losses in F2017 than in F2016. The scaling back in Africa also had a positive impact on F2017 core headline earnings. Shareholder Capital Investment income is up slightly for the period to R668m (net of tax). The level central costs that are not allocated to operating segments is sharply down. This is consistent with the large basis change we made at the end of F2016. Metropolitan Retail Metropolitan Retail s earnings declined by 6% to R660m. Earnings declined due to weakening persistency, higher new business strain, and increased spending on new initiatives. Core headline earnings () F2017 F2016 (%) Momentum Retail (15) Metropolitan Retail (6) Corporate & Public Sector International (166) (156) (6) Operating profit (4) Shareholder Capital Diluted core headline earnings FINANCIAL RESULTS MMI HOLDINGS 03
6 New business commentary New business volumes are down 6% to R41.6bn for the year when measured as PVNBP. Volume growth was dragged down by 16% decline in sales from the C&PS segment. The largest contributor to new business is Momentum Retail where volumes ended down 3% for the year. New business margin declined from 1.6% of premiums to 1.3%. Lower volumes resulted in negative operational gearing relative to distribution expenses. Momentum Retail Momentum Retail s sales were 3% lower over the year. Single premium new business was under pressure due to limited balance sheet capacity constraining guaranteed endowment sales. Life annuities was the one single premium product area that experienced decent growth over the year. Our core risk offering, Myriad, had similar sales volumes in F2017 as in F2016. Our recurring premium savings volumes picked up in F2017 aided by good demand for retirement annuities. New business margins are down slightly from 1.1% of premiums to 1.0%. The margin has been negatively affected by the operational gearing between the 3% decline in new business volumes and the distribution channel overheads. Corporate and Public Sector C&PS new business was down 16% for the year. New business volumes were materially lower in group risk business where the competitive market pricing is putting conversion rates under pressure. On-balance sheet investment flows were also weak during the year. Recurring premium savings business was aided by ongoing demand for our FundsAtWork umbrella fund solution. New business margins declined from 1.5% of premiums to 0.6% of premiums. The decline mainly reflects the negative interaction between the lower volumes and relatively high fixed distribution costs. The assumed future risk margins have also been moderated in light of current market dynamics. International International new business was up 3% year-on-year. The strongest growth was achieved in Namibia where growth was 9%. Botswana was the only large market where sales were somewhat disappointing and declined by 6%. Overall new business margin for International was 2.9% of premiums (unchanged year-on-year). Metropolitan Retail Metropolitan grew recurring premium volumes by 12% in line with the increase in the agent headcount. Metropolitan Retail s agent headcount increased by 12% during the year. Risk sales were up 15% while recurring premium savings business was up 7% year-on-year. Single premium new business was down 12% following the change to de minimis rules allowing pension pots below R247,500 to be cashed out at retirement. While being a small component of new business, it is worthwhile noting that single premium new business excluding annuities was up 20% for Metropolitan Retail. Value of new business is down 7% to R178m. This represents a new business margin of 3.4% on premiums. The new business margin has declined due to three primary causes; changes to how group schemes business is structured, higher effective acquisition costs due to a high proportion of new agents in the sales force, and lower-than-expected persistency from the telesales channel. Present Value of New Business Premiums () F2017 F2016 (%) Momentum Retail (3) Metropolitan Retail Corporate & Public Sector (16) International MMI total PVNBP (6) 04 MMI HOLDINGS 2017 FINANCIAL RESULTS
7 Embedded value Our embedded value was R26.51 per share on 30 June Together with the dividend paid during the period (R1.57 per share) this represents an ROEV of 4.7% over the year. ROEV excluding investment variances, forex movements, and economic assumption changes was 8.3%. Our covered business continues to produce steady EV growth despite the tough operating environment and generated ROEV of 8.3% (excluding market items this equates to 12.6%). Our non-covered operations, which include many of our International operations earmarked for exit, had a difficult year and generated ROEV of -10.4%. Experience variation Our overall experience variation (including development expenses) for the period was negative R49m. Persistency variance was negative R198m across the group. We are seeing higher terminations in the group risk space in light of the highly competitive pricing observed across that market segment. We have also seen persistency deteriorate in the lower-income market segments. Persistency in higherincome market segments remains in line with expectations. Risk variances remain strong in aggregate despite ongoing weakness in the group disability space. Overall mortality and disability variance was positive R140m with retail operations generating nearly R300m of positive variances on this front. Expense management continues to be well implemented across MMI and our expense variance was R50m before allowing for specific development expenses (R67m). Our credit risk variance of R117m is well up on that achieved in the prior year. Adjustment of mortality and disability assumptions to reflect recent experience has an overall positive impact of R139m on EV. However, this includes a significant positive adjustment in Momentum Retail (R410m) offset by a large negative adjustment in C&PS on the group disability business. The overall change to persistency assumptions is negative R26m in F2017, but the impact in adjusted net worth (and thus capital) was substantial (>R700m decline). This reflects an assumption of lower lapses on level premium and joint life policies which require us to hold a larger reserve for these policies on our balance sheet. This is, however, countered by offsetting benefits of longer persistency in the value of in-force (VIF) component of the EV calculation. During the year we have also moved our valuation approach from using a single point in the yield curve to using the full term structure when valuing prospective liabilities. This has had an overall positive impact on EV at 30 June Non-covered EV earnings Non-covered EV earnings were negative R835m for the period. The valuation of our International operations, increased allowance for Multiply expenses, and reduction in the carry value of our domestic asset management subsidiaries explains the vast majority of the reduction in EV. Non-covered operations with positive ROEV contributions included Guardrisk, Eris, and our various health operations. Assumption changes The current period included a number of relatively large assumption changes. Many of the changes are offsetting and as such the net impact on embedded value is a positive R403m. Embedded value profits EV total ANW Net VIF New business 547 (1 495) Unwind of RDR Expected profit (4 091) Experience variance (49) 140 (189) Operating assumptions 403 (628) Investment return on ANW Investment variance (1 354) (144) (1 210) Economic assumption changes (164) (1) (163) FX translation effect (36) (24) (12) EV profit on non-covered (835) (835) 0 EV profit FINANCIAL RESULTS MMI HOLDINGS 05
8 Capital,dividend, and outlook Our capital position remains satisfactory and we had a capital buffer of R3.7bn on 30 June 2017 on the current statutory basis. Our available capital resources at the end of the period stood at R19.9bn, where as we are currently utilising R13.7bn of capital in our existing businesses. Outside of the existing operations we have also set aside R1.5bn for the next dividend payment and R1.0bn to fund strategic initiatives. Rbn June 2017 June 2016 NAV as per EV statement Qualifying debt capital Less: NAV in strategic subsidiaries (3.6) (3.5) Less: Required capital (10.1) (9.7) Capital buffer before deployment Deployed for dividend payable (1.5) (1.5) Deployed for strategic initiatives (1.0) (2.2) Capital buffer The capital buffer increased by roughly R100m over the period. The primary reasons for the increase is that we no longer hold R1bn for uncommitted initiatives in light of our increased focus on our core initiatives and on existing initiaves. This benefit is offset by the low level of retained earnings and by an increase in required capital. Required capital has increased mainly due to low investment market returns increasing the stress arising in the investment resilience test component of the CAR calculation. Change in our yield curve sensitivity and increase in credit risk capital requirement also played a part in the increase to required capital. Movement in capital buffer Rbn Capital buffer on 30 June Profit from covered business 2.6 Profit from non-covered business (0.7) Dividends and new capital (2.4) Increase in required capital (0.6) Change in strategic commitments 1.2 Capital buffer 3.7 Approximately R100m was invested into Momentum Short-term Insurance Approximately R100m was invested into various smaller investments. These injections were offset by proceeds from sales of property assets (c. R500m) and sale of a subsidiary (c. R100m). Dividends Our dividend policy is to maintain a dividend cover between 1.5 and 1.7 times core headline earnings, but with provision to go below the lower range to maintain stable dividends if there is a temporary decline in earnings. This is subject to our capital position making the dividend payment feasible. We remain adequately capitalised and have thus declared a final dividend of 92 cents per share. This results in a dividend cover of 1.3x for F2017. We plan to return to our targeted dividend cover range in due course. Strategy update We remain committed to our client-centric strategy that is purposefully focused on providing for our clients needs in order to enhance their lifetime Financial Wellness. At the same time we continue to refine the actions and decisions to optimise delivery on our strategy aspirations. Investors should be aware that: The business is increasingly focused on execution, with strategy now well ingrained in the various business areas; We have announced our plan to exit a number of African countries to improve focus on remaining operations. We continue to invest in our Multiply programme and see it as a key component of our client engagement strategy; We continue to invest in our distribution channels and the recent launch of our insurance products in selected African Bank branches is one manifestation of this focus. Investors should note that actual capital investments during the period do not affect the capital buffer as they are usually fully provided for in the deployed for strategic initiatives item. For information we can point out that we invested around R900m during the year: Approximately R400m was invested into shareholder backed property developments Approximately R200m was invested into venture capital investments via Exponential Approximately R100m was invested into our International operations 06 MMI HOLDINGS 2017 FINANCIAL RESULTS
9 Summary of financial information Audited results for the 12 months ended 30 June FINANCIAL RESULTS MMI HOLDINGS 07
10 MMI HOLDINGS GROUP DIRECTORS STATEMENT The directors take pleasure in presenting the audited summarised results of MMI Holdings financial services group for the year ended 30 June The preparation of the group s results was supervised by the group chief financial officer, Risto Ketola (FIA, FASSA, CFA). Corporate events During the current year, the FSB approved the transfer of the FNB Life book of business from MMI Group Ltd to FirstRand Life Assurance Ltd. MMI Group Ltd recognised a profit of R73 million relating to the sale which was effective from 1 October During June 2017, MMI Holdings and African Bank announced a partnership that will allow each other exclusive rights to sell their products to the combined client base. The value sharing partnership comprises lending and insurance business ventures. Basis of preparation of financial information These summarised consolidated financial statements have been prepared in accordance with International Financial Reporting Standards (IFRS); International Accounting Standard 34 (IAS 34) Interim financial reporting (with the exception of disclosures required in terms of paragraph 16A(j)); the SAICA Financial Reporting Guide as issued by the Accounting Practices Committee and Financial Pronouncements as issued by the Financial Reporting Standards Council; the JSE Listings Requirements and the South African Companies Act, 71 of The accounting policies applied in the preparation of these financial statements are in terms of IFRS and are consistent with those adopted in the previous years except as described below. Critical judgements and accounting estimates are disclosed in detail in the group s integrated report for the year ended 30 June 2017, including changes in estimates that are an integral part of the insurance business. The group is exposed to financial and insurance risks, details of which are also provided in the group s integrated report. New and revised standards effective for the period ended 30 June 2017 and relevant to the group The following amendments to standards and interpretations became effective for the first time in the current period and had no impact on the group s earnings or net asset value: Amendments to IFRS 10 Consolidated financial statements, IAS 28 Investments in associates and joint ventures, IFRS 11 Joint arrangements, IAS 1 Presentation of financial statements, IAS 16 Property, plant and equipment, IAS 38 Intangible assets and IAS 27 Separate financial statements. The International Accounting Standards Board (IASB) made amendments to various standards as part of their annual improvements project. These amendments had no impact on the group s earnings. Segmental report To align segmental reporting to change in management responsibilities, we have made numerous movements across the five segments. The changes can be categorised into two main themes: (1) transfer of smaller operations previously shown as part of the Shareholder Capital segment into the client-facing segment where management responsibility actually rests and (2) transfer of UK operations previously residing in Momentum Retail or in Shareholder Capital to the International segment. The group has also refined the manner in which costs related to our Rewards programme are allocated. This has resulted in Momentum Retail carrying more of these costs than under the previous allocation methodology. The new segmental reporting had no impact on the current or prior year reported earnings, diluted earnings or headline earnings per share, or on the net asset value or net cash flow. 08 MMI HOLDINGS 2017 FINANCIAL RESULTS
11 MMI HOLDINGS GROUP Segmental report (continued) The client-centric reporting view reflects the following segments: Momentum Retail: Momentum Retail offers a wide range of financial solutions to middle and affluent market segments. Our product range spans all major insurance lines (life, disability, health, motor, property, and all-risks) and a wide range of savings and investment products. We differentiate our business through the quality of our advice channels and our commitment to high levels of client engagement to encourage our clients to make choices that optimise their financial and physical wellness. Our most popular product solutions are retirement savings and life insurance. Momentum Retail is closely associated with Multiply, our client engagement programme. Clients who have Multiply active on their policies enjoy premium discounts, partner rewards and access to personal financial management tools. Metropolitan Retail: Metropolitan Retail is a long-established life insurance provider in the lower- and middle-income segments. Metropolitan Retail s most popular products include funeral plans, savings policies, underwritten life cover policies, and annuities. Our funeral plans are low sum insured whole life policies designed to pay for funeral costs. To extend our distribution channels and expand our solutions basket, Metropolitan recently partnered with African Bank to offer insurance and lending products to the existing Metropolitan client base. Corporate and Public Sector: Corporate and Public Sector provides insurance, administration and investment services to employee groups in the private and public sectors. The business is one of the largest underwriters of death and disability insurance in the corporate market. We also have a strong market share in umbrella funds (multi-employer retirement schemes) and annuity solutions. International: MMI International operates in the rest of Africa, India and the United Kingdom. We offer a wide range of solutions in these areas, with a focus on life, health and short-term insurance products. In Africa, life insurance is offered in nine countries and health insurance offered in seven as well as in India. Our Multiply wellness programme is only active in India at present, where it complements the health insurance offering. Shareholder Capital: The Shareholder Capital segment reflects investment income on capital held to support operations, earnings from start-up ventures not yet allocated to other segments, and some costs not allocated to operating segments (eg certain holding company expenses). The product houses support the segments to deliver best of breed product solutions that segments can distribute to clients. There are five of these centres of excellence supporting the segments, namely: Investments and savings, Life Insurance, Health, Short-term Insurance and Client Engagement Solutions. Each of the centres of excellence design solutions that meet unique Financial Wellness needs of clients as identified by our segment business. Embedded value information In addition to the segmental reporting changes, the methodology for classifying business as covered or non-covered has been reviewed and the following changes have been implemented: Guardrisk Life business has been reclassified as non-covered as the business being written is mainly fee income in nature rather than underwriting exposure. An entity will only be classified as covered business once it has reached sufficient operational scale to support all operational expenses attributable to that entity. As a result, with effect from 1 July 2015, Guardrisk Life Ltd and a number of International life and health entities were transferred to noncovered business. The prior year has been restated to reflect these transfers to non-covered business FINANCIAL RESULTS MMI HOLDINGS 09
12 MMI HOLDINGS GROUP Corporate governance The board has satisfied itself that appropriate principles of corporate governance (King IV) were applied, where possible, throughout the year under review. Changes to the directorate, secretary and directors shareholding On 21 July 2016, Voyt Krzychylkiewicz was appointed as an alternative director to Peter Cooper. On 1 October 2016, Professor Stephen Jurisich was appointed to the board. On 22 November 2016, Johan Burger retired from the board and as deputy chairman. On 1 December 2016, Louis von Zeuner was elected as deputy chairman of the board. All transactions in listed shares of the company involving directors were disclosed on SENS. Changes to the group executive committee Change in roles Mary Vilakazi Khanyi Nzukuma Thinus Alsworth-Elvey Herman Schoeman Deputy CEO and Group Finance Director CEO Momentum Retail and acting CEO Metropolitan Retail CEO Corporate and Public Sector, UK and Momentum Investments CEO MMI Short-term Insurance Centre of Excellence (previously CEO Corporate and Public Sector) Appointments/resignations Role Appointments Resignations Innocent Dutiro CEO International 1 July 2016 Linda Mthenjane Group executive of human capital 10 October 2016 Vuyo Lee Group executive officer of brand 28 February 2017 Danie Botes Chief Operating Officer 13 June 2017 Etienne de Waal CEO Momentum Retail 13 June 2017 Risto Ketola Group Chief Financial Officer 22 June 2017 Ashlene van der Colff Group Head of Operations 22 June 2017 Contingent liabilities and capital commitments The group is party to legal proceedings and appropriate provisions are made when losses are expected to materialise. The group had no material capital commitments at 30 June 2017 that were not in the ordinary course of business other than those disclosed in the 2017 integrated report. Events after year-end No material events occurred between the reporting date and the date of approval of these results. Final dividend declaration Ordinary shares On 5 September 2017, a gross final dividend of 92 cents per ordinary share was declared by the board, resulting in a total dividend of 157 cents per share. 10 MMI HOLDINGS 2017 FINANCIAL RESULTS
13 MMI HOLDINGS GROUP Final dividend declaration (continued) Ordinary shares (continued) The dividend is payable out of income reserves to all holders of ordinary shares recorded in the register of the company at the close of business on Friday, 29 September 2017, and will be paid on Monday, 2 October The dividend will be subject to local dividend withholding tax at a rate of 20% (as announced in the 2017 Budget) unless the shareholder is exempt from paying dividend tax or is entitled to a reduced rate. This will result in a net final dividend of cents per ordinary share for those shareholders who are not exempt from paying dividend tax. The last day to trade cum dividend will be Tuesday, 26 September The shares will trade ex dividend from the start of business on Wednesday, 27 September Share certificates may not be dematerialised or rematerialised between Wednesday, 27 September 2017 and Friday, 29 September 2017, both days inclusive. The number of ordinary shares at the declaration date was MMI s income tax number is Preference shares Dividends of R19.0 million (2016: R20.1 million) (132 cents per share p.a.) were declared on the unlisted A3 MMI Holdings Ltd preference shares as determined by the company s Memorandum of Incorporation. Integrated information The integrated report for 2017 will be posted to shareholders before 30 September Directors responsibility The preparation of these results, and the correct extraction thereof from the group s audited 2017 annual financial statements, are the responsibility of the directors. This announcement does not include the information required by paragraph 16A(j) of IAS 34. The full summarised IAS 34 compliant results (including paragraph 16A(j)) are available on MMI s website and at MMI s registered offices upon request. A printed version of the full financial statements and the SENS announcement may be requested from the group company secretary, Maliga Chetty tel: External audit These summarised results have not been audited, but have been extracted from the group s 2017 annual financial statements, which have been audited by PricewaterhouseCoopers Inc. and their unqualified audit report, together with the group s audited 2017 annual financial statements, are available for inspection at the company s registered office. In addition, the summarised group embedded value information has been extracted from the 2017 group embedded value report, which has been reviewed by PricewaterhouseCoopers Inc. in accordance with the embedded value basis of MMI, and the review report is available for inspection at the company s registered office FINANCIAL RESULTS MMI HOLDINGS 11
14 MMI HOLDINGS GROUP Signed on behalf of the board JJ Njeke Chairman Nicolaas Kruger Group chief executive officer Centurion 5 September 2017 DIRECTORS: MJN Njeke (chairman), LL von Zeuner (deputy chairman), NAS Kruger (group chief executive officer), M Vilakazi (deputy chief executive and group finance director), P Cooper, F Jakoet, Prof SC Jurisich, Prof JD Krige, PJ Moleketi, SA Muller, V Nkonyeni, KC Shubane, FJC Truter, BJ van der Ross, JC van Reenen, W Krzychylkiewicz (alternate to P Cooper) GROUP COMPANY SECRETARY: Maliga Chetty WEBSITE: TRANSFER SECRETARIES: Link Market Services SA (Pty) Ltd (registration number 2000/007239/07) Rennie House, 13th Floor, 19 Ameshoff Street, Braamfontein PO Box 4844, Johannesburg 2000 Telephone: info@linkmarketservices.co.za SPONSOR SOUTH AFRICA: Merrill Lynch South Africa (Pty) Ltd SPONSOR NAMIBIA: Simonis Storm Securities (Pty) Ltd AUDITORS: PricewaterhouseCoopers Inc REGISTERED OFFICE: 268 West Avenue, Centurion 0157 REGISTRATION NUMBER: 2000/031756/06 JSE CODE: MMI NSX CODE: MIM ISIN NO: ZAE SENS ISSUE: 6 September MMI HOLDINGS 2017 FINANCIAL RESULTS
15 MMI HOLDINGS MMI GROUP HOLDINGS IFRS GROUP FINANCIAL IFRS INFORMATION FINANCIAL INFORMATION SUMMARISED CONSOLIDATED STATEMENT OF FINANCIAL POSITION ASSETS Intangible assets Owner-occupied properties Property and equipment Investment properties Investments in associates and joint ventures Employee benefit assets Financial assets designated at fair value through income Investments in associates designated at fair value through income Derivative financial assets Available-for-sale financial assets Held-to-maturity financial assets Loans and receivables Reinsurance contract assets Deferred income tax Properties under development Insurance and other receivables Current income tax assets Non-current assets held for sale Cash and cash equivalents Total assets EQUITY Equity attributable to owners of the parent Non-controlling interests Total equity LIABILITIES Insurance contract liabilities Long-term insurance contracts Short-term insurance contracts Investment contracts with discretionary participation features (DPF) designated at fair value through income Financial liabilities designated at fair value through income Derivative financial liabilities Financial liabilities at amortised cost Reinsurance contract liabilities Deferred income tax Employee benefit obligations Other payables Provisions Current income tax liabilities Total liabilities Total equity and liabilities FINANCIAL RESULTS MMI HOLDINGS 13
16 MMI HOLDINGS GROUP IFRS FINANCIAL INFORMATION SUMMARISED CONSOLIDATED INCOME STATEMENT 12 mths to mths to Net insurance premiums Fee income (1) Investment income Net realised and fair value gains Net income Net insurance benefits and claims Change in actuarial liabilities and related reinsurance (2 267) (674) Change in long-term insurance contract liabilities (1 437) 354 Change in short-term insurance contract liabilities (86) (71) Change in investment contracts with DPF liabilities (855) (940) Change in reinsurance assets (278) (331) Change in reinsurance liabilities Fair value adjustments on investment contract liabilities Fair value adjustments on collective investment scheme liabilities 688 (153) Depreciation, amortisation and impairment expenses Employee benefit expenses Sales remuneration Other expenses Expenses Results of operations Share of (loss)/profit of associates and joint ventures (126) 18 Finance costs (2) (1 023) (937) Profit before tax Income tax expense (2 937) (2 164) Earnings for year Attributable to: Owners of the parent Non-controlling interests Basic earnings per ordinary share (cents) Diluted earnings per ordinary share (cents) Fee income consists of the following: Investment contracts: R2 477 million ( : R2 471 million) Trust and fiduciary services: R1 608 million ( : R1 892 million) Health administration: R1 764 million ( : R1 945 million) Other fee income: R1 562 million ( : R1 371 million) 2. Finance costs consist of the following: Preference shares issued by MMI: R113 million ( : R110 million) Subordinated debt: R351 million ( : R341 million) Cost of carry positions: R408 million ( : R346 million) Other: R151 million ( : R140 million) 14 MMI HOLDINGS 2017 FINANCIAL RESULTS
17 MMI HOLDINGS GROUP IFRS FINANCIAL INFORMATION SUMMARISED CONSOLIDATED STATEMENT OF COMPREHENSIVE INCOME 12 mths to mths to Earnings for year Other comprehensive (loss)/income, net of tax (103) 83 Items that may subsequently be reclassified to income (224) (24) Exchange differences on translating foreign operations (218) (27) Available-for-sale financial assets (4) 3 Share of other comprehensive loss of associates (2) - Items that will not be reclassified to income Land and building revaluation Remeasurements of post-employee benefit funds 11 (1) Income tax relating to items that will not be reclassified (32) (16) Total comprehensive income for year Total comprehensive income attributable to: Owners of the parent Non-controlling interests FINANCIAL RESULTS MMI HOLDINGS 15
18 MMI HOLDINGS GROUP IFRS FINANCIAL INFORMATION RECONCILIATION OF HEADLINE EARNINGS attributable to owners of the parent Basic earnings 12 mths to mths to Diluted earnings 12 mths to mths to Earnings Finance costs convertible preference shares Dilutory effect of subsidiaries (1) (14) (23) Diluted earnings Intangible assets and other impairments (2) Tax on intangible assets and other impairments (61) (10) (61) (10) Release of foreign currency translation reserve - (92) - (92) Gain on sale of business/subsidiary (94) (115) (94) (115) Tax on gain on sale of business/subsidiary Impairment of owner-occupied property below cost Headline earnings (3) Net realised and fair value losses/(gains) on excess 94 (112) 94 (112) Basis and other changes and investment variances Adjustments for MMI shares held by policyholder funds (42) (98) (42) (73) Amortisation of intangible assets relating to business combinations Non-recurring items (4) Core headline earnings (5) In the current year, the MMI Holdings Namibian group, Metropolitan Kenya and Cannon are consolidated at 96% in the results. In the prior year, Metropolitan Health was also consolidated at 100%. For purposes of diluted earnings, diluted non-controlling interests and investment returns are reinstated. For Metropolitan Health, this is no longer the case as all the shares in Metropolitan Health Corporate (Pty) Ltd which were held by Kagiso Tiso Holdings (Pty) Ltd have been purchased by the group in June The current year includes impairments relating to: - Goodwill, customer relations and internally developed software (R213 million) in the International segment that are recognised on acquisition of subsidiaries as the companies are making losses. A risk discount rate of 18.2% (2016: 19.0%) has been used in the impairment calculation. - Internally developed software in International (R88 million) and Metropolitan Retail (R76 million) whereby certain components will no longer be used and/or the costs to maintain the system exceed the economic benefits. A risk discount rate of 11.6% has been used in the impairment calculation. The prior year includes the impairment of Cannon goodwill, software in International and Health and Hello Doctor goodwill. 3. Headline earnings consist of operating profit, investment income, net realised and fair value gains, investment variances and basis and other changes. 4. Non-recurring items include costs relating mainly to the restructuring of the group. The current year also includes the core earnings/loss relating to companies in countries that the group has or will be exiting in the near future. 5. Core headline earnings comprise operating profit and investment income on shareholder assets. It excludes net realised and fair value gains on financial assets and liabilities, investment variances and basis and other changes that can be volatile, certain non-recurring items, as well as the amortisation of intangible assets relating to business combinations. 16 MMI HOLDINGS 2017 FINANCIAL RESULTS
19 MMI HOLDINGS GROUP IFRS FINANCIAL INFORMATION EARNINGS PER SHARE (cents) attributable to owners of the parent Basic 12 mths to mths to Core headline earnings Headline earnings Earnings Weighted average number of shares (million) Diluted Core headline earnings Weighted average number of shares (million) (1) Headline earnings Earnings Weighted average number of shares (million) (2) For diluted core headline earnings per share, treasury shares held on behalf of contract holders are deemed to be issued. 2. For diluted earnings and headline earnings per share, treasury shares held on behalf of contract holders are deemed to be cancelled. DIVIDENDS Ordinary listed MMI Holdings Ltd shares (cents per share) Interim March Final September Total MMI Holdings Ltd convertible redeemable preference shares (issued to Kagiso Tiso Holdings (Pty) Ltd (KTH)) The A3 MMI Holdings Ltd preference shares are redeemable in December 2017 (after extending it under the same terms by six months in the current year) at a redemption value of R9.18 per share unless converted into MMI Holdings Ltd ordinary shares on a one-for-one basis prior to that date. On 3 October 2016 and 3 April 2017, 1 million preference shares were converted into ordinary shares, on each date. The ordinary shares were originally issued at a price of R10.18 per share. Dividends are payable on the remaining preference shares at 132 cents per annum (payable March and September). Significant related party transactions R369 million of the ordinary dividends declared by MMI Holdings Ltd in September 2016 (R362 million of the ordinary dividends declared in September 2015) and R261 million of the ordinary dividends declared in March 2017 (R261 million of the ordinary dividends declared in March 2016) were attributable to RMI Holdings Ltd. Dividends of R39.5 million (2016: R41.9 million) were paid to KTH on the A3 MMI Holdings Ltd preference shares in the current year. Dividends of R8 million (2016: R5 million) were paid to KTH on the MHC A ordinary shares FINANCIAL RESULTS MMI HOLDINGS 17
20 MMI HOLDINGS GROUP IFRS FINANCIAL INFORMATION SUMMARISED CONSOLIDATED STATEMENT OF CHANGES IN EQUITY Changes in share capital 12 mths to mths to Balance at beginning and end 9 9 Changes in share premium Balance at beginning Conversion of preference shares (Increase)/decrease in treasury shares held on behalf of contract holders (124) 35 Balance at end Changes in other reserves Balance at beginning Total comprehensive (loss)/income (102) 51 Employee share schemes value of services provided (26) - BEE cost 4 4 Change in non-distributable reserves (3) 2 Transfer (to)/from retained earnings (40) 32 Balance at end (1) Changes in retained earnings Balance at beginning Total comprehensive income Dividend paid (2 456) (2 475) Transactions with non-controlling interests 4 (214) Transfer from/(to) other reserves 40 (32) Balance at end Equity attributable to owners of the parent Changes in non-controlling interests Balance at beginning Total comprehensive income Dividend paid (53) (60) Transactions with owners 11 (219) Balance at end Total equity Other reserves consist of the following: Land and building revaluation reserve: R807 million ( : R742 million) Foreign currency translation reserve: -R98 million ( : R122 million) Revaluation of available-for-sale investments: R7 million ( : R11 million) Non-distributable reserve: R54 million ( : R50 million) Employee benefit revaluation reserve: R88 million ( : R77 million) Fair value adjustment for preference shares issued by MMI Holdings Ltd: R940 million ( : R940 million) Equity-settled share-based payment arrangements: -R10 million ( : R13 million) 18 MMI HOLDINGS 2017 FINANCIAL RESULTS
21 MMI HOLDINGS GROUP IFRS FINANCIAL INFORMATION SUMMARISED CONSOLIDATED STATEMENT OF CASH FLOWS 12 mths to mths to Net cash inflow from operating activities Net cash outflow from investing activities (288) (1 051) Net cash outflow from financing activities (2 093) (4 817) Net cash flow (1 795) Cash resources and funds on deposit at beginning Cash resources and funds on deposit at end NON-CONTROLLING INTERESTS % % Cannon Assurance Eris Property Group Metropolitan Health Ghana Metropolitan Health Group Metropolitan Health Namibia Administrators Metropolitan Kenya Metropolitan Swaziland Metropolitan Tanzania Metropolitan Health Zambia MMI Holdings Namibia Momentum Mozambique Momentum Swaziland FINANCIAL RESULTS MMI HOLDINGS 19
22 MMI HOLDINGS GROUP IFRS FINANCIAL INFORMATION BUSINESS COMBINATIONS JUNE 2017 There were no significant business combinations for the 12 months ended June Goodwill and customer relationships to the value of R11 million each were recognised due to a small acquisition. BUSINESS COMBINATIONS JUNE 2016 There were no significant business combinations for the 12 months ended June RECONCILIATION OF GOODWILL Balance at beginning Business combinations 11 - Impairment charges (1) (100) (104) Exchange differences (20) 8 Balance at end Goodwill relating to the Cannon (International segment) and Momentum Financial Technology (International segment) acquisitions were impaired by R62 million ( : R41 million) and R38 million ( : Rnil) respectively during the current year due to these companies making losses. Goodwill of R63 million relating to Hello Doctor (International and Corporate and Public Sector segments) was also impaired in the prior year. 20 MMI HOLDINGS 2017 FINANCIAL RESULTS
23 MMI HOLDINGS GROUP SEGMENTAL INFORMATION Metropolitan Retail Corporate and Public Sector International Shareholder Capital Segmental total Reconciling items (1) IFRS total 12 mths to Momentum Retail Revenue Net insurance premiums (34 744) Recurring premiums (9 291) Single premiums (25 453) Fee income (1 409) Fee income (247) Intergroup fee income (1 162) - Expenses Net payments to contract holders External payments (34 438) Other expenses Sales remuneration (7) Administration expenses Amortisation due to business combinations and impairments Cell captive business Direct property expenses Asset management and other fee expenses Holding company expenses Intergroup expenses (498) (1 162) - Diluted core headline earnings (166) Operating profit/(loss) (102) (48) Tax on operating profit (631) (267) (270) (87) (12) (1 267) - (1 267) Investment income Tax on investment income (16) (1) (51) (4) (154) (226) - (226) Covered Non-covered (196) (25) 448 (369) (40) (182) - (182) (166) Actuarial liabilities The 'Reconciling items' column includes: investment contract business premiums and claims; intergroup fee income and expenses; non-recurring items included in administration expenses (R263 million); direct property and asset management fees for all entities, except non-life entities, that are set off against investment income for management reporting purposes but shown as an expense for accounting purposes; asset management fees from cell captive business; the amortisation of intangibles relating to business combinations; expenses relating to consolidated collective investment schemes and other minor adjustments to expenses and fee income FINANCIAL RESULTS MMI HOLDINGS 21
24 MMI HOLDINGS GROUP SEGMENTAL INFORMATION Restated 12 mths to Momentum Retail Metropolitan Retail Corporate and Public Sector International Shareholder Capital Segmental total Reconciling items (1) IFRS total Revenue Net insurance premiums (34 141) Recurring premiums (8 720) Single premiums (25 421) Fee income (1 894) Fee income (378) Intergroup fee income (1 516) - Expenses Net payments to contract holders External payments (37 355) Other expenses Sales remuneration (7) Administration expenses Amortisation due to business combinations and impairments Cell captive business Direct property expenses Asset management and other fee expenses Holding company expenses Intergroup expenses (263) (1 516) - Diluted core headline earnings (156) Operating profit/(loss) (151) (158) Tax on operating profit (629) (272) (242) (26) (17) (1 186) - (1 186) Investment income Tax on investment income (16) - (30) (4) (186) (236) - (236) Covered Non-covered (111) (23) 401 (341) (127) (201) - (201) (156) Actuarial liabilities The 'Reconciling items' column includes: investment contract business premiums and claims; intergroup fee income and expenses; non-recurring items included in administration expenses (R190 million); direct property and asset management fees for all entities, except non-life entities, that are set off against investment income for management reporting purposes but shown as an expense for accounting purposes; asset management fees from cell captive business; the amortisation of intangibles relating to business combinations; expenses relating to consolidated collective investment schemes and other minor adjustments to expenses and fee income. 22 MMI HOLDINGS 2017 FINANCIAL RESULTS
25 MMI HOLDINGS GROUP SEGMENTAL INFORMATION CHANGE IN DILUTED CORE HEADLINE EARNINGS Change % 12 mths to Restated 12 mths to Momentum Retail (15) Metropolitan Retail (6) Corporate and Public Sector International (6) (166) (156) Operating segments (4) Shareholder Capital Total diluted core headline earnings SEGMENT BY CENTRE OF EXCELLENCE Momentum Retail Metropolitan Retail Corporate and Public Sector International Shareholder Capital 12 mths to Covered Operating profit Investment income Total Non-covered Investment and savings Life insurance (111) - (111) Health (29) (82) - 25 Short-term insurance (162) (7) 200 (80) - (49) Client engagement (66) (18) (25) (24) 12 (121) Unallocated expenses (60) (60) Other operations (154) 8 (128) Total (196) (25) 448 (369) (40) (182) Core earnings (166) Restated 12 mths to (1) Covered Operating profit/(loss) (43) Investment income Total Total Non-covered Investment and savings (19) Life insurance (84) - (84) Health (43) (68) - 46 Short-term insurance (151) (6) 143 (54) - (68) Client engagement (53) (17) (22) (23) 17 (98) Unallocated expenses (102) (102) Other operations (93) (42) (120) Total (111) (23) 401 (341) (127) (201) Core earnings (156) Refer to segmental report paragraph in the Directors statement for more information on the restatements FINANCIAL RESULTS MMI HOLDINGS 23
26 MMI HOLDINGS GROUP SEGMENTAL INFORMATION INVESTMENTS AND SAVINGS CENTRE OF EXCELLENCE NON-COVERED BUSINESS Momentum Retail Corporate and Public Sector International 12 mths to Revenue Fee income Performance fees Intergroup fees Investment income Fair value gains Expenses and finance costs (1 014) (689) (405) (2 108) Fair value adjustments on investment contracts - - (103) (103) Other expenses (1 005) (640) (302) (1 947) Finance costs (9) (49) - (58) Share of profit of associates Profit before tax Income tax expense (43) (32) (3) (78) Non-controlling interest - (26) - (26) Core earnings Total Operating profit before tax Tax on operating profit (30) (11) (3) (44) Investment income Tax on investment income (13) (15) - (28) Diluted core headline earnings Restated 12 mths to Revenue Fee income Performance fees Intergroup fees Investment income Fair value gains/(losses) - 39 (44) (5) Expenses and finance costs (970) (595) (397) (1 962) Fair value adjustments on investment contracts Other expenses (962) (560) (423) (1 945) Finance costs (8) (35) (15) (58) Share of profit of associates Profit/(Loss) before tax (35) 320 Income tax expense (55) (38) 16 (77) Non-controlling interest - (18) - (18) Core earnings (19) 225 Operating profit/(loss) before tax (29) 251 Tax on operating profit (48) (32) 14 (66) Investment income 46 8 (2) 52 Tax on investment income (8) (2) (2) (12) Diluted core headline earnings (19) MMI HOLDINGS 2017 FINANCIAL RESULTS
27 MMI HOLDINGS GROUP SEGMENTAL INFORMATION HEALTH CENTRE OF EXCELLENCE NON-COVERED BUSINESS Momentum Retail Corporate and Public Sector International Total 12 mths to Revenue Net insurance premiums Fee income Investment income Intergroup fees Expenses and finance costs (603) (1 856) (384) (2 843) Net payments to contract holders (151) (279) (168) (598) Other expenses (450) (1 576) (216) (2 242) Finance costs (2) (1) - (3) Share of loss of associates - - (105) (105) (Loss)/Profit before tax (43) 193 (21) 129 Income tax expense 14 (57) (36) (79) Non-controlling interest - - (25) (25) Earnings attributable to ordinary shareholders (29) 136 (82) 25 Operating (loss)/profit before tax (53) 167 (72) 42 Tax on operating profit 17 (49) (24) (56) Investment income Tax on investment income (3) (8) (1) (12) Diluted core headline earnings (29) 136 (82) 25 Closed schemes Open scheme (23) (6) (148) (177) Other (6) (29) 136 (82) 25 Principal Principal members members Lives Closed schemes Open schemes FINANCIAL RESULTS MMI HOLDINGS 25
28 MMI HOLDINGS GROUP SEGMENTAL INFORMATION HEALTH CENTRE OF EXCELLENCE NON-COVERED BUSINESS Momentum Retail Corporate and Public Sector International Total Restated 12 mths to Revenue Net insurance premiums Fee income Investment income Intergroup fees Expenses and finance costs (493) (1 862) (844) (3 199) Net payments to contract holders (133) (294) (476) (903) Other expenses (358) (1 568) (368) (2 294) Finance costs (2) - - (2) (Loss)/Profit before tax (60) 227 (21) 146 Income tax expense 17 (61) (30) (74) Non-controlling interest - - (17) (17) Earnings attributable to ordinary shareholders (43) 166 (68) 55 Dilutory effect of subsidiaries - (9) - (9) Diluted core headline earnings (43) 157 (68) 46 Operating (loss)/profit before tax (66) 191 (65) 60 Tax on operating profit 19 (55) (18) (54) Investment income Tax on investment income (2) (6) (1) (9) Diluted core headline earnings (43) 157 (68) 46 Closed schemes (68) 45 Open scheme (43) 9 - (34) Other (43) 157 (68) 46 Principal Principal members members Lives Closed schemes Open schemes MMI HOLDINGS 2017 FINANCIAL RESULTS
29 MMI HOLDINGS GROUP SEGMENTAL INFORMATION SHORT-TERM INSURANCE CENTRE OF EXCELLENCE Momentum Retail Metropolitan Retail Corporate and Public Sector International 12 mths to Net insurance premiums Fee income Management fees Investment fees Underwriting fees Other fee income Investment income Fair value losses (9) (9) Total income Expenses and finance costs (784) (9) (379) (241) (1 413) Net payments to contract holders (449) - - (133) (582) Change in actuarial liabilities Other expenses (335) (9) (367) (115) (826) Finance costs - - (12) - (12) (Loss)/Profit before tax (125) (6) 280 (73) 76 Income tax expense (37) (1) (80) (9) (127) Non-controlling interest Earnings attributable to ordinary shareholders (162) (7) 200 (80) (49) Operating (loss)/profit before tax (130) (6) 187 (71) (20) Tax on operating profit (34) (1) (54) (9) (98) Investment income Tax on investment income (1) - (26) - (27) Diluted core headline earnings (162) (7) 200 (80) (49) Total Momentum Short-term Insurance (83) (83) MMI Short-term Insurance Administration (79) (7) - (25) (111) Guardrisk Group Cannon Short-term (55) (55) (162) (7) 200 (80) (49) 2017 FINANCIAL RESULTS MMI HOLDINGS 27
30 MMI HOLDINGS GROUP SEGMENTAL INFORMATION SHORT-TERM INSURANCE CENTRE OF EXCELLENCE Momentum Retail Metropolitan Retail Corporate and Public Sector International Restated 12 mths to Net insurance premiums Fee income Management fees Investment fees Underwriting fees - - (6) - (6) Other fee income Investment income Fair value losses (4) (4) Total income Expenses and finance costs (793) (8) (334) (305) (1 440) Net payments to contract holders (467) - - (126) (593) Change in actuarial liabilities (26) (26) Other expenses (326) (8) (323) (153) (810) Finance costs - - (11) - (11) (Loss)/Profit before tax (177) (8) 193 (65) (57) Income tax expense 26 2 (50) 8 (14) Non-controlling interest Earnings attributable to ordinary shareholders (151) (6) 143 (54) (68) Total Operating (loss)/profit before tax (195) (8) 130 (65) (138) Tax on operating profit 31 2 (33) 8 8 Investment income Tax on investment income (5) - (18) - (23) Diluted core headline earnings (151) (6) 143 (54) (68) Momentum Short-term Insurance (124) (124) MMI Short-term Insurance Administration (27) (6) - (9) (42) Guardrisk Group Swaziland (2) (2) Tanzania Cannon Short-term (44) (44) (151) (6) 143 (54) (68) 28 MMI HOLDINGS 2017 FINANCIAL RESULTS
31 MMI HOLDINGS GROUP STATUTORY EXCESS STATUTORY EXCESS Group excess per reporting basis Net assets other businesses (2 849) (2 939) Fair value adjustments on Metropolitan business acquisition and other consolidation adjustments (2 946) (3 471) Excess long-term insurance business, net of non-controlling interests (1) Disregarded assets (2) (847) (983) Difference between statutory and published valuation methods (942) (582) Write-down of subsidiaries and associates for statutory purposes (1 328) (1 246) Unsecured subordinated debt Consolidation adjustments (33) (53) Statutory excess long-term insurance business Capital adequacy requirement (CAR) () (3) Ratio of long-term insurance business excess to CAR (times) Discretionary margins The long-term insurance business includes both insurance and investment contract business and is the simple aggregate of all the life insurance companies in the group, including life insurance companies in Africa. In respect of Guardrisk, only MMI s promoter exposure to the South African long-term insurance business, Guardrisk Life Ltd, is included. It excludes the short-term insurance businesses of Guardrisk, Momentum Short-term Insurance and Cannon (Kenya), as well as the other non-life insurance entities, including African health operations. The figures are after non-controlling interests but excludes certain items which are eliminated on consolidation. 2. Disregarded assets are those as defined in the South African Long-term Insurance Act, 52 of 1998, and are only applicable to South African long-term insurance companies. Adjustments are also made for the international insurance companies from reporting excess to statutory excess as required by their regulators. It includes Sage intangible assets of R464 million ( : R491 million). 3. The CAR is an aggregation of the separate CAR s, with no assumption of diversification benefits. MMI elected to adopt the revised actuarial guidance note SAP 104 (version 9) which was published in August 2017 but permitted adoption for reporting dates on or after 30 June FINANCIAL RESULTS MMI HOLDINGS 29
32 MMI HOLDINGS GROUP EMBEDDED VALUE INFORMATION EMBEDDED VALUE RESULTS Restated Covered business Reporting excess long-term insurance business Reclassification to non-covered business (2 206) (1 897) Disregarded assets (1) (504) (531) Difference between statutory and published valuation methods (942) (575) Dilutory effect of subsidiaries (2) (53) (51) Consolidation adjustments (3) (21) (40) Value of MMI Group Ltd preference shares issued (500) (500) Diluted adjusted net worth covered business Net value of in-force business Diluted embedded value covered business Non-covered business Net assets non-covered business within life insurance companies Net assets non-covered business outside life insurance companies Consolidation adjustments and transfers to covered business (3) (2 415) (2 776) Adjustments for dilution (4) Diluted adjusted net worth non-covered business Write-up to directors value Non-covered business Holding company expenses (5) (671) (557) International holding company expenses (5) (575) (550) Diluted embedded value non-covered business Diluted adjusted net worth Net value of in-force business Write-up to directors value Diluted embedded value Required capital covered business (adjusted for qualifying debt) (6) Surplus capital covered business Diluted embedded value per share (cents) Diluted adjusted net worth per share (cents) Diluted number of shares in issue (million) (7) Disregarded assets include Sage intangible assets of R464 million ( : R491 million), goodwill and various other items. 2. For accounting purposes, MMI Holdings Namibia, Metropolitan Kenya and Cannon have been consolidated at 96% in the statement of financial position (in the prior year, Metropolitan Health was consolidated at 100%). For embedded value purposes, disclosed on a diluted basis, the non-controlling interests and related funding have been reinstated. 3. Consolidation adjustments include mainly goodwill and intangibles in subsidiaries that are eliminated. 4. Adjustments for dilution are made up as follows: Dilutory effect of subsidiaries (note 3): R106 million ( : R123 million) Treasury shares held on behalf of contract holders: R353 million ( : R292 million) Liability MMI Holdings Ltd convertible preference shares issued to KTH: R261 million ( : R275 million) 5. The holding company expenses reflect the present value of projected recurring head office expenses. The international holding company expenses reflect the allowance for support services to the international life assurance and health businesses. 6. The required capital for covered business amounts to R million (restated : R9 655 million) and is adjusted for qualifying debt of R3 602 million ( : R3 557 million). 7. The diluted number of shares in issue takes into account all issued shares, assuming conversion of the convertible redeemable preference shares, and includes the treasury shares held on behalf of contract holders. 30 MMI HOLDINGS 2017 FINANCIAL RESULTS
33 MMI HOLDINGS GROUP EMBEDDED VALUE INFORMATION ANALYSIS OF NET VALUE OF IN-FORCE BUSINESS Restated Momentum Retail Gross value of in-force business Less cost of required capital (1 486) (1 338) Metropolitan Retail Gross value of in-force business Less cost of required capital (638) (684) Corporate and Public Sector (1) Gross value of in-force business Less cost of required capital (897) (765) International (2) Gross value of in-force business Less cost of required capital (256) (215) Net value of in-force business Prior year has been restated to exclude Guardrisk Life Ltd from the Corporate and Public Sector. 2. Prior year has been restated to exclude International life and health entities not yet at operating scale FINANCIAL RESULTS MMI HOLDINGS 31
34 MMI HOLDINGS GROUP EMBEDDED VALUE INFORMATION EMBEDDED VALUE DETAIL Adjusted net worth Net value of in-force Restated Covered business Momentum Retail Metropolitan Retail Corporate and Public Sector International (1) Shareholder Capital Total covered business Adjusted net worth Write-up to directors value Restated Non-covered business Momentum Retail Investment and savings Health Short-term insurance Client engagement - (188) (188) (13) Metropolitan Retail - (78) (78) (84) Client engagement - (78) (78) (84) Corporate and Public Sector Investment and savings Health Short-term insurance (2) Client engagement (85) International (1) (215) Investment and savings (3) Life insurance 319 (40) Health Short-term insurance Client engagement - (92) (92) - Other (shared services) (4) (1 203) (575) (1 778) (1 447) Shareholder Capital 944 (322) 622 (5) Short-term insurance Client engagement Other (head office expenses) (4) 475 (322) 153 (331) Total non-covered business Total embedded value Diluted net asset value non-covered business (3 360) Adjustments to covered business net asset value Reporting excess long-term insurance business On 1 July 2015, African life and health entities not yet at operating scale were transferred to non-covered business ( : adjusted net worth of R466 million and value of in-force of R146 million). The prior year has been restated to reflect the transfer. 2. On 1 July 2015, Guardrisk Life Ltd was transferred to non-covered business ( : adjusted net worth of R169 million and value of in-force of R660 million). The prior year has been restated to reflect the transfer. 3. This includes MMI non-covered subsidiaries domiciled in the United Kingdom and related territories. 4. The International shared services impact reflects the allowance for support services to the International life assurance and health businesses. The Shareholder head office expenses impact reflects the present value of projected recurring head office expenses. 32 MMI HOLDINGS 2017 FINANCIAL RESULTS
35 MMI HOLDINGS GROUP EMBEDDED VALUE INFORMATION DIRECTORS VALUE PER VALUATION METHOD Covered methodology Appraisal value Covered methodology Appraisal value Restated Non-covered business Momentum Retail Investment and savings Health Short-term insurance Client engagement - (188) (188) - (13) (13) Metropolitan Retail - (78) (78) - (84) (84) Client engagement - (78) (78) - (84) (84) Corporate and Public Sector Investment and savings Health (20) (20) Short-term insurance Client engagement (85) (85) International (1 083) (308) 822 Investment and savings Life insurance Health Short-term insurance Client engagement - (92) (92) Other (shared services) - (1 778) (1 778) - (1 447) (1 447) Shareholder Capital (5) (5) Short-term insurance Client engagement Other (head office expenses) (331) (331) Total non-covered business Covered methodology refers to APN107 (embedded value methodology) and the risk discount rate of covered business. The Health businesses, Momentum Wealth and Guardrisk are valued using embedded value methodology. For Health business, explicit assumptions are made around large scheme terminations. The key assumption is the long-term profit as a percentage of revenue. Discounted cash flow models for Investment and savings, as well as Short-term insurance business, include assumptions around future new business. To reflect the additional uncertainty introduced, the risk discount rates for these businesses are approximately 2.8% and 1.8% higher than covered business risk discount rates. For Eris, we approximate discounted cash flows using a Price/Earnings multiple. The International shared services impact reflects the allowance for support services to the International life and health bus inesses. The Shareholder head office expenses impact reflects the present value of projected recurring head office expenses FINANCIAL RESULTS MMI HOLDINGS 33
36 MMI HOLDINGS GROUP EMBEDDED VALUE INFORMATION ANALYSIS OF CHANGES IN GROUP EMBEDDED VALUE Notes Adjusted net worth (ANW) Covered business Gross value of inforce (VIF) 12 mths to Restated 12 mths to Cost of CAR Total EV Total EV Profit from new business (1 495) (205) Embedded value from new business A (1 495) (205) Expected return to end of period B Profit from existing business (486) Expected return unwinding of RDR B (348) Release from the cost of required capital C Expected (or actual) net of tax profit transfer to net worth D (4 091) Operating experience variances E 207 (177) (12) Development expenses F (67) - - (67) (99) Operating assumption changes G (628) (76) 403 (981) Embedded value profit from operations (199) Investment return on adjusted net worth H Investment variances I (144) (1 116) (94) (1 354) (126) Economic assumption changes J (1) (177) 14 (164) (124) Exchange rate movements K (24) (16) 4 (36) 53 Embedded value profit covered business (275) Transfer of business to non-covered business L (675) - - (675) (1 333) Changes in share capital M (20) (5) - (25) 4 Dividend paid (3 066) - - (3 066) (2 838) Change in embedded value covered business (1 170) 543 (275) (902) (1 033) Non-covered business Change in directors valuation and other items (696) Change in holding company expenses (139) 961 Embedded value (loss)/profit non-covered business (835) Changes in share capital M 25 (4) Dividend paid Finance costs preference shares (39) (41) Transfer of business from covered business L Change in embedded value non-covered business Total change in group embedded value (466) Total embedded value profit Return on embedded value (%) - internal rate of return 4.7% 12.8% 34 MMI HOLDINGS 2017 FINANCIAL RESULTS
37 MMI HOLDINGS GROUP EMBEDDED VALUE INFORMATION ANALYSIS OF CHANGES IN ADJUSTED NET WORTH 12 mths to Momentum Retail Metropolitan Retail Covered business Corporate and Public Sector International Shareholder Capital Embedded value from new business (827) (201) (213) (254) - (1 495) Expected (or actual) net of tax profit transfer to net worth Operating experience variances Development expenses (36) - (31) - - (67) Operating assumption changes (503) 50 (122) (53) - (628) Embedded value profit from operations Investment return on adjusted net worth Investment variances (178) (5) (144) Economic assumption changes (3) (1) Exchange rate movements (24) - (24) Total Embedded value profit covered business ANALYSIS OF CHANGES IN GROSS VALUE OF IN-FORCE Momentum Retail Covered business Metropolitan Retail Corporate and Public Sector International Total 12 mths to Embedded value from new business Expected return unwinding of RDR Expected (or actual) net of tax profit transfer to net worth (2 257) (810) (604) (420) (4 091) Operating experience variances (50) (2) (143) 18 (177) Operating assumption changes (173) Embedded value profit/(loss) from operations (15) Investment variances (701) (251) (130) (34) (1 116) Economic assumption changes (44) (11) (99) (23) (177) Exchange rate movements (16) (16) Embedded value profit/(loss) covered business (244) FINANCIAL RESULTS MMI HOLDINGS 35
38 MMI HOLDINGS GROUP EMBEDDED VALUE INFORMATION ANALYSIS OF CHANGES IN COST OF CAR Momentum Retail Covered business Metropolitan Retail Corporate and Public Sector International 12 mths to Embedded value from new business (86) (52) (45) (22) (205) Expected return unwinding of RDR (156) (78) (89) (25) (348) Release from the cost of required capital Operating experience variances - - (12) - (12) Operating assumption changes (50) - - (26) (76) Embedded value loss from operations (82) (3) (41) (73) (199) Investment variances (53) 53 (94) - (94) Economic assumption changes (7) (3) (4) Exchange rate movements Embedded value (loss)/profit covered business Total (142) 47 (139) (41) (275) ANALYSIS OF CHANGES IN GROUP EMBEDDED VALUE Momentum Retail Metropolitan Retail Covered business Corporate and Public Sector International Shareholder Capital 12 mths to Embedded value from new business Expected return unwinding of RDR Release from the cost of required capital Operating experience variances (147) Development expenses (36) - (31) - - (67) Operating assumption changes (295) (23) Embedded value profit from operations Investment return on adjusted net worth Investment variances (932) (193) (203) (21) (5) (1 354) Economic assumption changes (54) (14) (103) 7 - (164) Exchange rate movements (36) - (36) Embedded value profit covered business Total Restated 12 mths to Embedded value from new business Expected return unwinding of RDR Release from the cost of required capital Operating experience variances (364) 59 (86) 73 Development expenses (57) (42) (99) Operating assumption changes (140) 82 (729) (147) (47) (981) Embedded value profit/(loss) from operations (282) 214 (131) Investment return on adjusted net worth Investment variances (91) 41 (88) 12 - (126) Economic assumption changes (87) (85) 98 (50) - (124) Exchange rate movements Embedded value profit/(loss) covered business (157) MMI HOLDINGS 2017 FINANCIAL RESULTS
39 A. VALUE OF NEW BUSINESS MMI HOLDINGS GROUP EMBEDDED VALUE INFORMATION VALUE OF NEW BUSINESS (3,4) 12 mths to Momentum Metropolitan Corporate and Public Retail (5) Retail Sector (1) International (2) Total Value of new business Gross Less cost of required capital (86) (52) (45) (22) (205) New business premiums Recurring premiums Single premiums New business premiums (APE) New business premiums (PVP) Profitability of new business as a percentage of APE Profitability of new business as a percentage of PVP Restated 12 mths to Value of new business Gross Less cost of required capital (63) (53) (45) (12) (173) New business premiums Recurring premiums Single premiums New business premiums (APE) New business premiums (PVP) Profitability of new business as a percentage of APE Profitability of new business as a percentage of PVP Value of new business has been restated to exclude Guardrisk Life Ltd that was transferred to non-covered business. 2. Value of new business has been restated to exclude the African entities not yet at operating scale that was transferred to non-covered business. 3. Value of new business and new business premiums are net of non-controlling interests. 4. The value of new business has been calculated on closing assumptions. Investment yields at the point of sale have been used for fixed annuity and guaranteed endowment business; for other business the investment yields at the reporting date have been used. 5. For Momentum Retail, the definition of new business has been amended to exclude negative alterations after the commission clawback period. This change aligns with the definition used internally by Momentum Sales FINANCIAL RESULTS MMI HOLDINGS 37
40 MMI HOLDINGS GROUP EMBEDDED VALUE INFORMATION ANALYSIS OF NEW BUSINESS PREMIUMS Momentum Metropolitan Corporate and Retail (3) Retail Public Sector (1) International (2) Total 12 mths to New business premiums Recurring premiums Risk Savings/Investments Annuities International Single premiums Savings/Investments Annuities International New business premiums (APE) Risk Savings/Investments Annuities International Restated 12 mths to New business premiums Recurring premiums Risk Savings/Investments Annuities International Single premiums Savings/Investments Annuities International New business premiums (APE) Risk Savings/Investments Annuities International Value of new business has been restated to exclude Guardrisk Life Ltd that was transferred to non-covered business. 2. Value of new business has been restated to exclude the African entities not yet at operating scale that was transferred to non-covered business. 3. For Momentum Retail, the definition of new business has been amended to exclude negative alterations after the commission clawback period. This change aligns with the definition used internally by Momentum Sales. 38 MMI HOLDINGS 2017 FINANCIAL RESULTS
41 MMI HOLDINGS GROUP EMBEDDED VALUE INFORMATION RECONCILIATION OF LUMP SUM INFLOWS 12 mths to Restated 12 mths to Total lump sum inflows Inflows not included in value of new business (6 518) (6 853) Term extensions on maturing policies Retirement annuity proceeds invested in living annuities Non-controlling interests and other adjustments (37) 150 Single premiums included in value of new business PRINCIPAL ASSUMPTIONS (South Africa) (1,4) % % Pre-tax investment return Equities Properties Government stock Other fixed-interest stocks Cash Risk-free return (2) Risk discount rate (RDR) Investment return (before tax) balanced portfolio (2) Renewal expense inflation rate (3) The principal assumptions relate only to the South African life insurance business. Assumptions relating to international life insurance businesses are based on local requirements and can differ from the South African assumptions. 2. Risk-free returns are taken from an appropriate market-related, risk-free yield curve as at the valuation date. Appropriate risk premia are added to the risk-free yields in order to derive yields on other asset classes. Expected cash flows at each duration are discounted using yields appropriate to that duration. The investment return on balanced portfolio business was calculated by applying the above returns to an expected long-term asset distribution. 3. An inflation rate of 6.0% p.a. is used over the planning horizon (three years) where after the inflation rate is derived from market inputs as the difference between nominal and real yields across the term structure of these curves. An additional 1% expense inflation is allowed for in some divisions to reflect the impact of closed books that are in run-off. 4. The assumptions quoted in the table are representative rates derived at the 10-year point of the yield curves. B. EXPECTED RETURN The expected return is determined by applying the risk discount rate applicable at the beginning of the reporting year to the present value of inforce covered business at the beginning of the reporting year. The expected return on new business is determined by applying the current risk discount rate to the value of new business from the point of sale to the end of the year. C. RELEASE FROM THE COST OF REQUIRED CAPITAL The release from the cost of required capital represents the difference between the risk discount rate and the expected after tax investment return on the assets backing the required capital over the year. D. EXPECTED (OR ACTUAL) NET OF TAX PROFIT TRANSFER TO NET WORTH The expected profit transfer for covered business from the present value of in-force to the adjusted net worth is calculated on the statutory valuation method FINANCIAL RESULTS MMI HOLDINGS 39
42 MMI HOLDINGS GROUP EMBEDDED VALUE INFORMATION E. OPERATING EXPERIENCE VARIANCES OPERATING EXPERIENCE VARIANCES Notes 12 mths to ANW Net VIF EV Restated 12 mths to EV Momentum Retail 86 (50) Mortality and morbidity Terminations, premium cessations and policy alterations 2 (111) Expense variance (24) Credit risk variance Other 3 (38) (228) (266) 45 Metropolitan Retail 22 (2) Mortality and morbidity Terminations, premium cessations and policy alterations 4 (61) (8) (69) 10 Expense variance (23) - (23) (9) Credit risk variance Other Corporate and Public Sector 8 (143) (135) (321) Mortality and morbidity 5 (152) - (152) (235) Terminations 6 20 (211) (191) (113) Expense variance (122) Credit risk variance FNB Life share of profits Other International Mortality and morbidity Terminations, premium cessations and policy alterations (22) Expense variance (3) - (3) 5 Other Shareholder Capital (86) Opportunity cost of required capital - (12) (12) (43) Total operating experience variances 207 (189) Notes 1. Overall, mortality and morbidity experience for the 12 months were better compared to what was allowed for in the valuation basis. 2. Better than expected experience, especially on voluntary premium increases. 3. Includes one off impact arising from improved modelling of rider benefits as well as increased premium discounts. 4. Unfavourable experience on mainly risk products written by new intermediaries. 5. Worse than expected income disability underwriting experience. 6. Higher than expected terminations on risk business. 7. Includes a release of discretionary liabilities held in respect of data and systems no longer deemed necessary following completion of investigations. 40 MMI HOLDINGS 2017 FINANCIAL RESULTS
43 F. DEVELOPMENT EXPENSES MMI HOLDINGS GROUP EMBEDDED VALUE INFORMATION Business development expenses within segments. G. OPERATING ASSUMPTION CHANGES OPERATING ASSUMPTION CHANGES Notes 12 mths to ANW Net VIF EV Restated 12 mths to EV Momentum Retail (503) (71) Mortality and morbidity assumptions Termination assumptions 2 (680) 620 (60) 24 Renewal expense assumptions (1) (55) (56) 164 Holding company expenses (325) Modelling, methodology and other changes 3 (118) Metropolitan Retail Mortality and morbidity assumptions (12) (3) (15) 271 Termination assumptions 5 (20) (15) (30) Renewal expense assumptions (59) 4 (55) (46) Holding company expenses (345) Modelling, methodology and other changes Corporate and Public Sector (122) (173) (295) (733) Mortality and morbidity assumptions 4 (138) (220) (358) (35) Termination assumptions Renewal expense assumptions 43 (89) (46) (260) Holding company expenses (225) Modelling, methodology and other changes (27) 31 4 (220) International (53) 56 3 (147) Mortality and morbidity assumptions Termination assumptions 2 (63) 7 (56) (25) Renewal expense assumptions (21) Modelling, methodology and other changes (13) (49) (62) (153) Shareholder Capital (47) Methodology change: cost of required capital - (76) (76) (65) Total operating assumption changes (628) (981) Notes 1. Allowance for better than assumed mortality and morbidity experience on risk business. 2. Strengthening of the long-term persistency assumptions. 3. Various modelling and methodology changes including the adoption of the yield curve for valuation purposes and changes in the allowance for future premium reviews on Momentum Retail risk products. 4. Allowance for lower future profitability on income disability business. 5. Allowance made for improved persistency experience, mainly on FundsAtWork FINANCIAL RESULTS MMI HOLDINGS 41
44 MMI HOLDINGS GROUP EMBEDDED VALUE INFORMATION H. INVESTMENT RETURN ON ADJUSTED NET WORTH INVESTMENT RETURN ON ADJUSTED NET WORTH 12 mths to Restated 12 mths to Investment income Capital appreciation and other Preference share dividends paid and change in fair value of preference shares (36) (33) Investment return on adjusted net worth I. INVESTMENT VARIANCES Investment variances represent the impact of higher/lower than assumed investment returns on current and expected future after tax profits from in-force business. J. ECONOMIC ASSUMPTION CHANGES The economic assumption changes include the effect of the change in assumed rate of investment return, expense inflation rate and risk discount rate in respect of local and offshore business. K. EXCHANGE RATE MOVEMENTS The impact of foreign currency movements on International covered businesses. L. TRANSFER OF BUSINESS TO NON-COVERED BUSINESS This transfer represents the alignment of the net assets and value of in-force of subsidiaries between covered and non-covered business. M. CHANGES IN SHARE CAPITAL Changes in share capital include the recapitalisation of some of the International subsidiaries. 42 MMI HOLDINGS 2017 FINANCIAL RESULTS
45 MMI HOLDINGS GROUP EMBEDDED VALUE INFORMATION COVERED BUSINESS: SENSITIVITIES In-force business New business written Adjusted net Gross Cost of Gross Cost of Net value Net value worth value CAR (3) value CAR (3) Base value (3 277) (205) 1% increase in risk discount rate (3 681) (222) % change (9) (6) 12 (26) (17) 8 1% reduction in risk discount rate (2 843) (185) % change 10 7 (13) (10) 10% decrease in future expenses (3 277) (205) % change (1) % decrease in lapse, paid-up and surrender rates (3 277) (222) % change % decrease in mortality and morbidity for assurance business (3 307) (205) % change % decrease in mortality for annuity business (3 250) (205) % change (2) (2) (1) (2) (2) - 1% reduction in gross investment return, inflation rate and risk discount (3 205) (205) rate % change (2) (2) % reduction in inflation rate (3 277) (205) % change % fall in market value of equities and properties (3 215) % change (2) (5) (5) (2) 10% reduction in premium indexation take-up rate (3 277) (205) % change (2) (2) - (7) (5) - 10% decrease in non-commission related acquisition expenses (205) % change % increase in equity/property risk premium (3 277) (205) % change No corresponding changes in variable policy charges are assumed, although in practice it is likely that these will be modified according to circumstances. 2. Bonus rates are assumed to change commensurately. 3. The change in the value of cost of required capital is disclosed as nil where the sensitivity test results in an insignificant change in the value FINANCIAL RESULTS MMI HOLDINGS 43
46 MMI HOLDINGS GROUP ADDITIONAL INFORMATION ANALYSIS OF ASSETS MANAGED AND/OR ADMINISTERED (1) Managed and/or administered by Investments Restated (2) Financial assets Momentum Manager of Managers Momentum Investment Consultants Momentum Collective Investments Metropolitan Collective Investments Momentum Asset Management (3) Momentum Global Investments Momentum Alternative Investments Properties Eris Property Group On-balance sheet Off-balance sheet Momentum Wealth linked product assets under administration On-balance sheet Off-balance sheet Managed internally or by other managers within MMI (on-balance sheet) Managed by external managers (on-balance sheet) Properties managed internally or by other managers within MMI or externally Corporate and Public Sector segregated assets Corporate and Public Sector cell captives on-balance sheet Total assets managed and/or administered Managed and/or administered by Investments On-balance sheet Off-balance sheet Assets managed and/or administered are included where an entity earns a fee on the assets. Non-financial assets (except properties) have been excluded. 2. Momentum Manager of Managers restatement: Recent operating model changes in the Investment business has resulted in the consolidation of asset administration agreements between entities resulting in a decrease in assets under administration with no impact on earnings. 3. In the prior year, MMI performed certain administrative functions for Aluwani Capital Partners (Aluwani) on an arms-length basis. This resulted in R36 billion being included in Momentum Asset Management which was managed by Aluwani. These assets were transferred to Aluwani in the current year. 44 MMI HOLDINGS 2017 FINANCIAL RESULTS
47 MMI HOLDINGS GROUP ADDITIONAL INFORMATION NET FUNDS RECEIVED FROM CLIENTS (1) 12 mths to Gross single inflows Gross recurring inflows Gross inflow Gross outflow Net inflow/ (outflow) Momentum Retail (25 360) (620) Metropolitan Retail (5 321) Corporate and Public Sector (25 574) International (2 624) Long-term insurance business fund flows (58 879) Off-balance sheet fund flows Managed and/or administered by Investments (2) ( ) (37 336) Properties Eris Property Group (8 350) (6 283) Momentum Wealth linked product assets under administration (10 081) (2 713) Corporate and Public Sector segregated assets - (216) (216) Total net funds received from clients ( ) (42 492) Restated 12 mths to Momentum Retail (24 846) 788 Metropolitan Retail (6 037) 779 Corporate and Public Sector (30 568) (3 960) International (2 513) Long-term insurance business fund flows (63 964) (852) Off-balance sheet fund flows Managed and/or administered by Investments (80 887) Properties Eris Property Group (2 227) 745 Momentum Wealth linked product assets under administration (10 837) (387) Corporate and Public Sector segregated assets Total net funds received from clients ( ) Assets managed and/or administered are included where an entity earns a fee on the assets. Non-financial assets (except properties) have been excluded. 2. The Aluwani assets were transferred to Aluwani in the current year FINANCIAL RESULTS MMI HOLDINGS 45
48 MMI HOLDINGS GROUP ADDITIONAL INFORMATION ANALYSIS OF ASSETS BACKING SHAREHOLDER EXCESS Restated % % Equity securities Preference shares Collective investment schemes Debt securities Properties Owner-occupied properties Investment properties Cash and cash equivalents and funds on deposit Intangible assets Other net assets Redeemable preference shares (261) (1.1) (275) (1.1) Subordinated redeemable debt (3 602) (15.7) (3 557) (14.8) Treasury shares (353) (1.5) (292) (1.2) Shareholder excess per reporting basis NUMBER OF EMPLOYEES Restated Indoor staff Segments Momentum Retail Metropolitan Retail Corporate and Public Sector International Centres of Excellence Investments and Savings Solutions Legacy Solutions Life Insurance Solutions Health Solutions Short-term Insurance Solutions Multiply Group services divisions Field staff Momentum Retail Metropolitan Retail International Total The prior year has been restated to align to the group s client centric model. 46 MMI HOLDINGS 2017 FINANCIAL RESULTS

49 Investor presentation 6 September FINANCIAL RESULTS MMI HOLDINGS 47


50 48 MMI HOLDINGS 2017 FINANCIAL RESULTS


51 2017 FINANCIAL RESULTS MMI HOLDINGS 49


52 50 MMI HOLDINGS 2017 FINANCIAL RESULTS

53 2017 FINANCIAL RESULTS MMI HOLDINGS 51


54 52 MMI HOLDINGS 2017 FINANCIAL RESULTS


55 2017 FINANCIAL RESULTS MMI HOLDINGS 53


56 54 MMI HOLDINGS 2017 FINANCIAL RESULTS

57 2017 FINANCIAL RESULTS MMI HOLDINGS 55


58 56 MMI HOLDINGS 2017 FINANCIAL RESULTS

59 2017 FINANCIAL RESULTS MMI HOLDINGS 57


60 58 MMI HOLDINGS 2017 FINANCIAL RESULTS


61 2017 FINANCIAL RESULTS MMI HOLDINGS 59


62 60 MMI HOLDINGS 2017 FINANCIAL RESULTS


63 2017 FINANCIAL RESULTS MMI HOLDINGS 61


64 62 MMI HOLDINGS 2017 FINANCIAL RESULTS


65 2017 FINANCIAL RESULTS MMI HOLDINGS 63


66 64 MMI HOLDINGS 2017 FINANCIAL RESULTS


67 2017 FINANCIAL RESULTS MMI HOLDINGS 65

68 66 MMI HOLDINGS 2017 FINANCIAL RESULTS


69 2017 FINANCIAL RESULTS MMI HOLDINGS 67


70 68 MMI HOLDINGS 2017 FINANCIAL RESULTS


71 2017 FINANCIAL RESULTS MMI HOLDINGS 69


72 70 MMI HOLDINGS 2017 FINANCIAL RESULTS

73 2017 FINANCIAL RESULTS MMI HOLDINGS 71


74 72 MMI HOLDINGS 2017 FINANCIAL RESULTS


75 2017 FINANCIAL RESULTS MMI HOLDINGS 73


76 74 MMI HOLDINGS 2017 FINANCIAL RESULTS


77 2017 FINANCIAL RESULTS MMI HOLDINGS 75


78 76 MMI HOLDINGS 2017 FINANCIAL RESULTS


79 2017 FINANCIAL RESULTS MMI HOLDINGS 77


80 78 MMI HOLDINGS 2017 FINANCIAL RESULTS


81 2017 FINANCIAL RESULTS MMI HOLDINGS 79

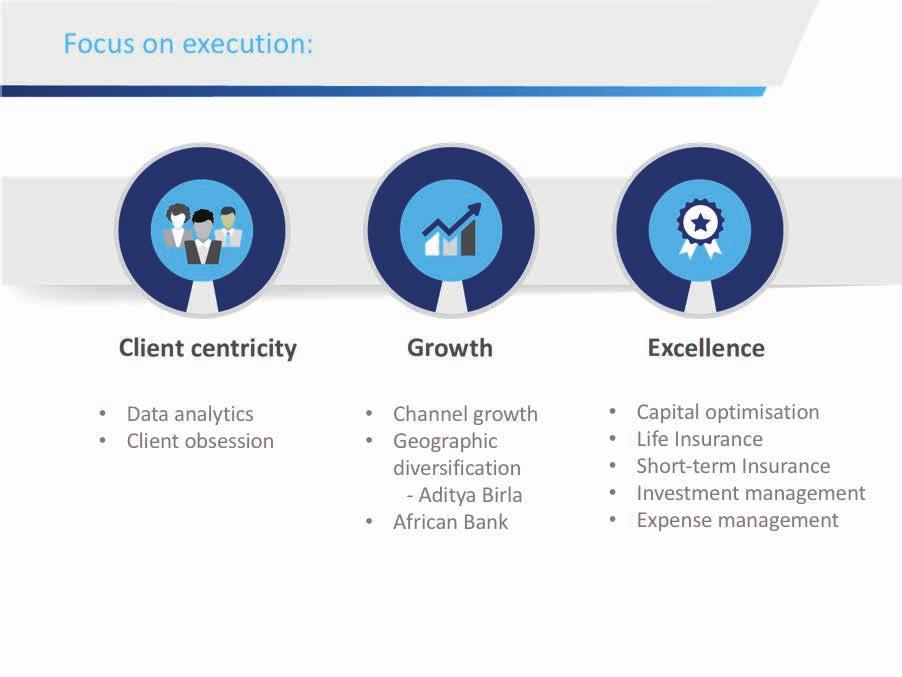
82


83 2017 FINANCIAL RESULTS MMI HOLDINGS 81
MMI HOLDINGS SUMMARISED AND UNAUDITED GROUP RESULTS for the six months ended 31 December 2015
 MMI Holdings Limited Incorporated in the Republic of South Africa Registration Number: 2000/031756/06 JSE share code: MMI NSX share code: MIM ISIN: ZAE000149902 ("MMI" or "the group") MMI HOLDINGS SUMMARISED
Summary of financial information
 Summary of financial information Audited results for the 12 months ended 30 June 2013 MMI HOLDINGS GROUP DIRECTORS STATEMENT The directors take pleasure in presenting the audited results of MMI Holdings
Summary of financial information
 Summary of financial information Unaudited results for the 6 months ended 31 December 2013 MMI HOLDINGS GROUP DIRECTORS STATEMENT The directors take pleasure in presenting the unaudited condensed interim
Reset and grow. Results for the year ended. 30 June 2018 MMI HOLDINGS 2018 FINANCIAL RESULTS 01
 Reset and grow Results for the year ended 30 June 2018 MMI HOLDINGS 2018 FINANCIAL RESULTS 01 Financial Results Results for the year ended 30 June 2018 MMI HOLDINGS 2018 FINANCIAL RESULTS 01 Summary of
CONTENTS MMI HOLDINGS LTD GROUP ANNUAL FINANCIAL STATEMENTS 30 JUNE 2016
 CONTENTS MMI HOLDINGS LTD GROUP ANNUAL FINANCIAL STATEMENTS 30 JUNE 2016 Directors' responsibility and approval 75 Certificate by the group company secretary 75 Report of the independent auditors 76 Definitions
Contents. MMI HOLDINGS Ltd Group annual financial statements 30 June 2017
 Contents MMI HOLDINGS Ltd Group annual financial statements 30 June 2017 Directors' responsibility and approval 105 Certificate by the group company secretary 105 Independent auditor's report 106 Review
Performance. We continue to invest in the capabilities we need to succeed in the world envisioned by the Fourth Industrial Revolution.
 Performance We continue to invest in the capabilities we need to succeed in the world envisioned by the Fourth Industrial Revolution. 46 MMI HOLDINGS INTEGRATED REPORT 2017 MMI HOLDINGS INTEGRATED REPORT
ADDITIONAL DISCLOSURE SUPPLEMENT
 6 ADDITIONAL DISCLOSURE SUPPLEMENT Unaudited Condensed Group Interim Results DO GREAT THINGS EVERY DAY 112 Old Mutual Limited GROUP INTERIM RESULTS for the six months ended 30 June 2018 SUPPLEMENT CONTENTS
MMI HOLDINGS INTEGRATED REPORT INTRODUCTION ABOUT US PERFORMANCE GOVERNANCE REMUNERATION FINANCIAL STATEMENTS
 About us MMI s client-centric corporate strategy is centred on its core fundamental purpose to enhance the lifetime Financial Wellness of people, their communities and their businesses. 4 MMI HOLDINGS
Momentum Retail. Segmental reviews
 Segmental reviews Momentum Retail Momentum Retail offers a wide range of financial solutions to middle and affluent market segments. Our product range spans all major insurance lines (life, disability,
MMI GROUP LIMITED ANNUAL FINANCIAL STATEMENTS. 30 June 2016
 MMI GROUP LIMITED ANNUAL FINANCIAL STATEMENTS 30 June 2016 MMI GROUP LIMITED CONTENTS Directors' responsibility and approval 1 Certificate by the company secretary 2 Certificate by the statutory actuary
integrated report Momentum, Metropolitan, Guardrisk and Multiply form part of MMI Holdings Group, an authorised financial services provider.
 2017 integrated report Momentum, Metropolitan, Guardrisk and Multiply form part of MMI Holdings Group, an authorised financial services provider. Contents Introduction 1 About MMI 2 Our approach to integrated
GROUP CHIEF EXECUTIVE OFFICER S OVERVIEW
 GROUP CHIEF EXECUTIVE OFFICER S OVERVIEW During the past year, MMI implemented the new operating model required to support our client-centric strategy. The focus of the 2016 World Economic Forum Annual
REPORT OF HISTORICAL FINANCIAL INFORMATION ON Momentum
 Annexure 5 1 2 REPORT OF HISTORICAL FINANCIAL INFORMATION ON Momentum INTRODUCTION The historical financial information of the Momentum Group set out below has been extracted from the audited financial
Net insurance benefits and claims of R325.8 million (2015: R300.5 million) were 8% higher than the previous year.
 were 8% higher than the previous year.") Clientèle Limited (Registration number 2007/023806/06) Share code: CLI ISIN: ZAE000117438 Condensed Preliminary Group results for the year ended 30 June 2016 Net insurance premium increased by 13% to R1.7
Clientèle Limited (Registration number 2007/023806/06) Share code: CLI ISIN: ZAE000117438 Condensed Preliminary Group results for the year ended 30 June 2016 Net insurance premium increased by 13% to R1.7
Liberty Holdings Limited. Supplementary information
 Liberty Holdings Limited Supplementary information For the year ended 31 December2017 2 Liberty Holdings Limited Financial results CONTENTS Page Analysis of ordinary shareholders equity 3 Analysis of group
African Bank Holdings Limited Unaudited Consolidated Condensed Interim Financial Statements 31 March 2018
 Unaudited Consolidated Condensed Interim Financial Statements These financial statements were prepared under the supervision of G Raubenheimer CA (SA) Registration number: 2014/176855/06. Consolidated
Investec Bank Limited
 Investec Bank Limited 2017 Reviewed preliminary condensed consolidated financial results for the year ended 31 March 2017 Consolidated income statement For the year to 31 March Reviewed Audited Interest
Liberty Holdings Limited
 Supplementary 2015 information For the year ended 31 December CONTENTS GROUP Analysis of ordinary shareholders' funds 53 Analysis of group earnings core earnings 54 Summary of BEE transaction status 55
African Bank Holdings Limited
 African Bank Holdings Limited Consolidated Unaudited Condensed Interim Financial Statements for the six months ended These financial statements were prepared under the supervision of the Chief Financial
SEGMENTAL REPORT FOR THE YEAR ENDED 30 JUNE 2015
 SEGMENTAL REPORT Management has determined the operating segments based on the way the business is managed. The reports used by the chief operating decision-maker, the members of the executive committee,
SUMMARISED AUDITED CONSOLIDATED RESULTS FOR THE YEAR ENDED 30 JUNE 2016 AND NOTICE OF ANNUAL GENERAL MEETING
 SILVERBRIDGE HOLDINGS LIMITED (INCORPORATED IN THE REPUBLIC OF SOUTH AFRICA) (REGISTRATION NUMBER 1995/006315/06) SHARE CODE: SVB ISIN: ZAE000086229 ( SILVERBRIDGE OR THE GROUP OR THE COMPANY ) SUMMARISED
Liberty Holdings Limited. Financial results presentation
 Liberty Holdings Limited Financial results presentation For the year ended 31 December 2017 Liberty Holdings Limited Financial results 1 FINANCIAL RESULTS PRESENTATION Liberty Holdings Limited Financial
Liberty Holdings Limited
 Liberty Holdings Limited AUDITED PRELIMINARY RESULTS FOR THE YEAR ENDED 31 December 2006 Commentary on results Liberty Holdings Limited (Liberty Holdings) is the holding company of Liberty Group Limited.
HomeChoice International PLC summarised group financial statements for the year ended 31 December 2016 and cash dividend declaration
 HomeChoice International PLC summarised group financial statements for the year ended 31 December and cash dividend declaration HomeChoice International PLC 1 Commentary Group highlights sales up 25.1
REVIEWED INTERIM REPORT FOR THE SIX MONTHS ENDED 30 JUNE 2018
 Santam Limited and its subsidiaries Incorporated in the Republic of South Africa Registration number 1918/001680/06 ISIN ZAE000093779 JSE share code: SNT NSX share code: SNM REVIEWED INTERIM REPORT FOR
Liberty Holdings Limited. Supplementary. information. For the six months ended 30 June
 Liberty Holdings Limited Supplementary information Liberty an Authorised Financial Services Provider In terms of the FAIS Act (Licence No. 2409). For the six months ended Liberty Holdings Limited Financial
28 November Trading update for the three months ended 30 September Group overview and operational highlights
 28 November 2013 Update is a newsletter produced by the investor relations department of MMI Holdings Limited. It provides information on the different divisions in the group. Contact Natalie Amos (investor
Investec records another resilient performance
 21 May 2009 - Investec Investec records another resilient performance Diversified business model, sound balance sheet and recurring revenue base support profitability in challenging economic conditions
Retail health and beauty sales grew by 14.3%, with good volume growth in same stores and market share gains in all product categories.
 CLICKS GROUP LIMITED Registration number: 1996/000645/06 Share code: CLS ISIN: ZAE000134854 CUSIP: 18682W205 INTERIM CONDENSED CONSOLIDATED RESULTS FOR THE SIX MONTHS ENDED 28 FEBRUARY 2018 Group turnover
INTERIM CONDENSED CONSOLIDATED RESULTS FOR THE SIX MONTHS ENDED 28 FEBRUARY 2018
 INTERIM CONDENSED CONSOLIDATED RESULTS FOR THE SIX MONTHS ENDED 28 FEBRUARY CONTENTS 1 Commentary 2 Consolidated statement of comprehensive income 3 Consolidated statement of financial position 3 Consolidated
AVBOB MUTUAL ASSURANC SOCIETY AND IT S SUBSIDIARIES FINANCIAL STATEMENTS FOR THE YEAR ENDED 30 JUNE 2017
 AVBOB MUTUAL ASSURANC SOCIETY AND IT S SUBSIDIARIES FINANCIAL STATEMENTS 98 AVBOB MUTUAL ASSURANCE SOCIETY SUMMARISED FINANCIAL STATEMENTS FOR THE YEAR ENDED 30 JUNE 2017 COMPANY INFORMATION Registration
Condensed, unaudited interim results and cash dividend finalisation announcement for the six months ended 31 December 2014
 RMB Holdings Limited Incorporated in the Republic of South Africa Registration number: 1987/005115/06 JSE ordinary share code: RMH ISIN code: ZAE000024501 (RMH) Condensed, unaudited interim results and
Contents. Overview. Annual financial statements SANLAM ANNUAL RESULTS Group Financial Review 1. Key features 2.
 SANLAM ANNUAL RESULTS 2010 Group Financial Review 1 Contents Overview Key features 2 Salient results 3 Executive review 4 Comments on the results 7 Annual financial statements Accounting policies and basis
SIGNIFICANT SUBSIDIARIES
 SIGNIFICANT SUBSIDIARIES Annexure A Companies Country of incorporation, where not South Africa Interest held Cost Loans capitalised MMI Group Ltd 100 100 18 096.4 18 096.4 Subsidiary companies Momentum
PBT Group Limited (Incorporated in the Republic of South Africa) Registration Number: 1936/008278/06 JSE share code:
 Registration Number: 1936/008278/06 JSE share code:") PBT Group Limited (Incorporated in the Republic of South Africa) Registration Number: 1936/008278/06 JSE share code: PBG ISIN: ZAE000227781 Condensed consolidated provisional financial results for the
PBT Group Limited (Incorporated in the Republic of South Africa) Registration Number: 1936/008278/06 JSE share code: PBG ISIN: ZAE000227781 Condensed consolidated provisional financial results for the
Group UNAUDITED GROUP RESULTS FOR THE PERIOD ENDED 31 MARCH 2018,
 UNAUDITED GROUP RESULTS FOR THE PERIOD ENDED 31 MARCH 2018, SCRIP DISTRIBUTION WITH CASH DIVIDEND ALTERNATIVE, FURTHER CAUTIONARY AND TRADING STATEMENT Group LIFE HEALTHCARE UNAUDITED GROUP RESULTS 2018
PRELIMINARY REVIEWED CONDENSED CONSOLIDATED RESULTS FOR THE YEAR ENDED 31 AUGUST 2017
 PRELIMINARY REVIEWED CONDENSED CONSOLIDATED RESULTS FOR THE YEAR ENDED 31 AUGUST CONTENTS 1 Commentary 2 Consolidated statement of comprehensive income Group turnover up 10.9% 3 Consolidated statement
Condensed unaudited interim results announcement, cash dividend declaration and board changes for the six months ended 31 December 2016
 RMB HOLDINGS LIMITED (Incorporated in the Republic of South Africa) Registration number: 1987/005115/06 JSE Ordinary share code: RMH ISIN code: ZAE000024501 Condensed unaudited interim results announcement,
Condensed, audited results announcement, cash dividend declaration and board changes for the year ended 30 June 2014
 RMB HOLDINGS LIMITED("RMH") (Incorporated in the Republic of South Africa) Registration number: 1987/005115/06 JSE Ordinary share code: RMH ISIN code: ZAE000024501 Condensed, audited results announcement,
ADVANCING MMI S STRATEGY. Results for the year ended 30 June 2017
 ADVANCING MMI S STRATEGY Results for the year ended 30 June 2017 Key financial metrics Key financial metrics Weaker new business volumes, stable earnings Financial aspirations Key financial metrics Growth
Interim Results 30 September 2017
 Page 0 Interim Results - Supplementary Information 26 weeks ended 30 September 2017 Index Page Results (Press) announcement 2 Press release 3 Interim cash dividend declaration 4 Unaudited results for the
2016 integrated report
 2016 integrated report CONTENTS INTRODUCTION 2 Our approach to integrated repor ng REMUNERATION 65 Remunera on report ABOUT US 4 At a glance 6 Five-year financial review 6 Areas of strength 7 MMI s group
unaudited financial results
 Capitec Bank Holdings Limited Registration number: 1999/025903/06 Registered bank controlling company Incorporated in the Republic of South Africa JSE ordinary share code: CPI ISIN code: ZAE000035861 JSE
unaudited financial results for the 6 months ended 31 August 2017
 Capitec Bank Holdings Limited Registration number: 1999/025903/06 Registered bank controlling company Incorporated in the Republic of South Africa JSE ordinary share code: CPI ISIN code: ZAE000035861 JSE
Summary CONSOLIDATED STATEMENT OF CHANGES IN EQUITY. the foschini group UNAUDITED INTERIM CONDENSED CONSOLIDATED RESULTS
 Summary CONSOLIDATED STATEMENT OF CHANGES IN EQUITY for the years 31 March the foschini group limited UNAUDITED INTERIM CONDENSED CONSOLIDATED RESULTS FOR THE HALF-YEAR ENDED 30 SEPTEMBER 1 Summary CONSOLIDATED
PROVISIONAL REVIEWED ANNUAL CONDENSED CONSOLIDATED RESULTS FOR THE YEAR ENDED 28 FEBRUARY 2018
 Dis-Chem Pharmacies Limited ("Dis-Chem" or "the Company") (Incorporated in the Republic of South Africa) (Registration number 2005/009766/06) Share code: DCP ISIN: ZAE000227831 PROVISIONAL REVIEWED ANNUAL
GROUP INTERIM RESULTS August 2018
 GROUP INTERIM RESULTS 2018 31 August 2018 AGENDA 1 2 CONCLUDING OVERVIEW FINANCIAL REVIEW REMARKS Peter Moyo, Group CEO Casper Troskie, Group CFO Peter Moyo, Group CEO 4 3Q&A 2 OVERVIEW Starting our journey,
PBT Group Limited (Previously Prescient Limited) Registration number: 1936/008278/06 JSE share code:
 Registration number: 1936/008278/06 JSE share code:") PBT Group Limited (Previously Prescient Limited) Registration number: 1936/008278/06 JSE share code: PBG ISIN: ZAE000227781 Condensed consolidated provisional financial results for the year ended 31 March
PBT Group Limited (Previously Prescient Limited) Registration number: 1936/008278/06 JSE share code: PBG ISIN: ZAE000227781 Condensed consolidated provisional financial results for the year ended 31 March
SANTAM LTD AND ITS SUBSIDIARIES AUDITED SUMMARY CONSOLIDATED FINANCIAL STATEMENTS FOR THE YEAR ENDED 31 DECEMBER 2016
 SANTAM LTD AND ITS SUBSIDIARIES AUDITED SUMMARY CONSOLIDATED FINANCIAL STATEMENTS FOR THE YEAR ENDED 31 DECEMBER 2016 47 TABLE OF CONTENTS 1 SALIENT FEATURES 2 FINANCIAL REVIEW 5 INDEPENDENT AUDITOR S
City Lodge Hotels Limited
 Registration number: 1986/002864/06 Share code: CLH ISIN: ZAE 000117792 Reviewed group preliminary results for the year ended 30 June 2017 Average occupancies 63% 2016: 66% Normalised diluted HEPS (3%)
PROVISIONAL REVIEWED CONDENSED CONSOLIDATED RESULTS for the year ended 31 August 2017
 REBOSIS PROPERTY FUND LIMITED ("Rebosis" or the "company" or the "group") Registration number 2010/003468/06 (Approved as a REIT by the JSE) JSE share code: REA - ISIN: ZAE000240552 JSE share code: REB
UNAUDITED CONDENSED CONSOLIDATED RESULTS FOR THE SIX MONTHS ENDED 30 SEPTEMBER
 UNAUDITED CONDENSED CONSOLIDATED RESULTS FOR THE SIX MONTHS ENDED 30 SEPTEMBER 2017 FINANCIAL HIGHLIGHTS REVENUE 2.7% TO R4.86 BILLION PROFIT FROM CONTINUING OPERATIONS 6.4% TO R314 MILLION PROFIT BEFORE
CLICKS GROUP LIMITED Registration number: 1996/000645/06 Share code: CLS ISIN: ZAE CUSIP: 18682W205
 CLICKS GROUP LIMITED Registration number: 1996/000645/06 Share code: CLS ISIN: ZAE000134854 CUSIP: 18682W205 INTERIM CONDENSED CONSOLIDATED RESULTS FOR THE SIX MONTHS ENDED 28 FEBRUARY 2017 Group turnover
Dis-Chem Pharmacies Limited ("Dis-Chem" or "the Company") (Incorporated in the Republic of South Africa) (Registration number 2005/009766/06) Share
 (Incorporated in the Republic of South Africa) (Registration number 2005/009766/06) Share") Dis-Chem Pharmacies Limited ("Dis-Chem" or "the Company") (Incorporated in the Republic of South Africa) (Registration number 2005/009766/06) Share code: DCP ISIN: ZAE000227831 Provisional Reviewed Annual
Dis-Chem Pharmacies Limited ("Dis-Chem" or "the Company") (Incorporated in the Republic of South Africa) (Registration number 2005/009766/06) Share code: DCP ISIN: ZAE000227831 Provisional Reviewed Annual
interim results for the six months ended 30 June 2011
 interim results Contents Overview Key features 01 Salient results 02 Executive review 03 Comments on the results 06 Interim financial statements 23 Accounting policies and basis of presentation 24 External
UNAUDITED CONDENSED CONSOLIDATED INTERIM RESULTS
 UNAUDITED CONDENSED CONSOLIDATED INTERIM RESULTS FOR THE SIX MONTHS ENDED 31 DECEMBER 2014 RESULTS HIGHLIGHTS REVENUE 257% to R562.4m EBITDA 276% to R87.2m HEPS 118% to 14.4 cents DPS 3.5 cents 01 UNAUDITED
UNAUDITED CONDENSED CONSOLIDATED INTERIM FINANCIAL STATEMENTS FOR THE SIX MONTH PERIOD ENDED 31 DECEMBER 2016
 SILVERBRIDGE HOLDINGS LIMITED INCORPORATED IN THE REPUBLIC OF SOUTH AFRICA (REGISTRATION NUMBER 1995/006315/06) SHARE CODE: SVB ISIN: ZAE000086229 ( SILVERBRIDGE OR THE GROUP OR THE COMPANY ) UNAUDITED
Transpaco s total comprehensive income grew 0,5% to R66,9 million (June 2012: R66,6 million).
.") Group turnover up 7% Net asset value up 12% Final dividend per share 53,5 cents Introduction Transpaco maintained its consistent performance with good turnover growth and a slight increase in headline
Group turnover up 7% Net asset value up 12% Final dividend per share 53,5 cents Introduction Transpaco maintained its consistent performance with good turnover growth and a slight increase in headline
CIRCULAR. TO SHAREHOLDERS for the year ended 30 June 2009
 2009 CIRCULAR TO SHAREHOLDERS for the year ended 30 June 2009 FIRSTRAND GROUP 1 Financial highlights 2 Key financial results and ratios 3 Statement of headline earnings from continuing and discontinued
Audited preliminary announcement of consolidated financial results for the year ended 28 February 2014 and a cash dividend declaration
 Wilderness Holdings Limited "Wilderness or the Company or the Group Share code: WIL ISIN: BW0000000868 Registration number: 2004/2986 BSE: Primary Listing JSE: Secondary Listing Audited preliminary announcement
31 Aug 17 Change 31 Aug 16 R000 % R000
 PSG Konsult Limited (Incorporated in the Republic of South Africa) Registration number: 1993/003941/06 JSE share code: KST NSX share code: KFS ISIN code: ZAE000191417 ('PSG Konsult' or 'the company' or
Contents. Overview. Interim financial statements SANLAM INTERIM RESULTS Group Financial Review 1. Key features 2.
 SANLAM INTERIM RESULTS 2011 Group Financial Review 1 Contents Overview Key features 2 Salient results 3 Executive review 4 Comments on the results 8 Interim financial statements Shareholders information
Interim Results 1 October 2016
 Interim Results 1 October 2016 Page 0 Interim Results - Supplementary Information 26 weeks ended 1 October 2016 Index Page Results (Press) announcement 2 Press release 3 Interim cash dividend declaration
PRELIMINARY AUDITED SUMMARISED CONSOLIDATED RESULTS AND CASH DIVIDEND DECLARATION FOR THE YEAR ENDED 30 SEPTEMBER 2018 KEY FEATURES
 RHODES FOOD GROUP HOLDINGS LIMITED (Incorporated in the Republic of South Africa) Registration number: 2012/074392/06 JSE share code: RFG ISIN: ZAE000191979 PRELIMINARY AUDITED SUMMARISED CONSOLIDATED
SUMMARY GROUP RESULTS AND FINAL CASH DIVIDEND DECLARATION FOR THE 52 WEEKS ENDED 31 MARCH 2018
 MR PRICE GROUP LIMITED Registration number 1933/004418/06 Incorporated in the Republic of South Africa ISIN: ZAE 000200457 JSE share code: MRP ( Mr Price or the Company or the Group ) MR PRICE GROUP LIMITED
Summary consolidated financial statements for the year ended 30 June 2017
 Sasol Inzalo Public (RF) Limited (Incorporated in the Republic of South Africa) (Registration number 2007/030646/06) Sasol Inzalo Public Ordinary Share code: JSE: SIPBEE Sasol Inzalo Public Ordinary ISIN:
CASHBUILD LIMITED (Registration number: 1986/001503/06) (Incorporated in the Republic of South Africa) Listed on the JSE Securities Exchange South
 (Incorporated in the Republic of South Africa) Listed on the JSE Securities Exchange South") CASHBUILD LIMITED (Registration number: 1986/001503/06) (Incorporated in the Republic of South Africa) Listed on the JSE Securities Exchange South Africa JSE Share Code: CSB ISIN: ZAE000028320 Audited
CASHBUILD LIMITED (Registration number: 1986/001503/06) (Incorporated in the Republic of South Africa) Listed on the JSE Securities Exchange South Africa JSE Share Code: CSB ISIN: ZAE000028320 Audited
JSE LIMITED REVIEWED INTERIM FINANCIAL RESULTS for THE SIX MONTHS ENDED 30 JUNE 2011 and SPECIAL DIVIDEND DECLARATION
 JSE LIMITED REVIEWED INTERIM FINANCIAL RESULTS for THE SIX MONTHS ENDED 30 JUNE 2011 and SPECIAL DIVIDEND DECLARATION contents Diversified revenue 1 Commentary 2 Directors responsibility statement 4 Independent
Audited results for the year ended 28 February Sum-of-the-parts value per share up 26,7% to R3,99
 Zeder Investments Limited Incorporated in the Republic of South Africa (Registration number: 2006/019240/06) JSE share code: ZED ISIN number: ZAE000088431 ("Zeder" or "the Group" or "the Company") Audited
Announcement of the reviewed Group results and cash dividend declaration for the year ended 31 December 2011
 Zurich Insurance Company South Africa Limited (Incorporated in the Republic of South Africa) (Registration number 1965/006764/06) Share code: ZSA ISIN: ZAE000094496 ( Zurich or the Group or the Company
NOTES TO THE FINANCIAL STATEMENTS
 NOTES TO THE FINANCIAL STATEMENTS FOR THE YEAR ENDED 30 JUNE 1 BASIS OF PREPARATION AND ACCOUNTING POLICIES The basis of preparation and accounting policies of the company are the same as that of the group,
REVIEWED INTERIM CONDENSED CONSOLIDATED RESULTS for the six-months ended 31 August 2017
 Dis-Chem Pharmacies Limited ("Dis-Chem" or "the Company") (Incorporated in the Republic of South Africa) (Registration number 2005/009766/06) Share code: DCP ISIN: ZAE000227831 REVIEWED INTERIM CONDENSED
Abridged report relating to the audited financial results for the year ended 31 March 2017 and details of the notice of the annual general meeting
 Nictus Limited (Incorporated in the Republic of South Africa) (Registration number 81/011858/06) JSE Share code: NCS ISIN Code NA0009123481 ( Nictus or the Company or the Group ) Abridged report relating
Unaudited Condensed Consolidated Interim Results for the six months ended 30 September 2015 and Interim Dividend Declaration
 TRUSTCO GROUP HOLDINGS LIMITED Incorporated in the Republic of Namibia (Registration number 2003/058) NSX Share Code: TUC JSE Share Code: TTO ISIN Number: NA000A0RF067 ("Trustco", or "the group") Unaudited
CONDENSED CONSOLIDATED UNAUDITED RESULTS FOR THE SIX MONTHS ENDED 30 SEPTEMBER 2018 HIGHLIGHTS
 Peregrine Holdings Limited (Incorporated in the Republic of South Africa) (Registration number 1994/006026/06) Share code: PGR ISIN: ZAE000078127 ("Peregrine" or "the Group" or "the Company") CONDENSED
GROUP SUMMARY CONSOLIDATED INTERIM FINANCIAL RESULTS ANNOUNCEMENT FOR THE SIX MONTHS ENDED 30 JUNE 2018 SALIENT FEATURES
 South Ocean Holdings Limited (Registration number 2007/002381/06) Incorporated in the Republic of South Africa ( South Ocean Holdings, the Group ) Share code: SOH ISIN: ZAE000092748 GROUP SUMMARY CONSOLIDATED
1925/001431/06) ( ) JSE
 ( ) JSE") Naspers Limited Incorporated in the Republic of South Africa (Registration number: 1925/001431/06) ( Naspers ) JSE share code: NPN ISIN: ZAE000015889 LSE share code: NPSN ISIN: US 6315121003 Provisional
Naspers Limited Incorporated in the Republic of South Africa (Registration number: 1925/001431/06) ( Naspers ) JSE share code: NPN ISIN: ZAE000015889 LSE share code: NPSN ISIN: US 6315121003 Provisional
The derivatives division recorded a 26% year-on-year decline in revenue. The division accounted for 11% of total revenue.
 AVIOR CAPITAL MARKETS HOLDINGS LIMITED (previously Jamispan Proprietary Limited) Incorporated in the Republic of South Africa Registration number: 2015/086358/06 Share Code: AVR ISIN: ZAE000211637 ( Avior
PROVISIONAL REVIEWED ANNUAL CONDENSED CONSOLIDATED RESULTS 2018 FOR THE YEAR ENDED 28 FEBRUARY
 PROVISIONAL REVIEWED ANNUAL CONDENSED CONSOLIDATED RESULTS 2018 FOR THE YEAR ENDED 28 FEBRUARY CONTENTS Commentary 1 Condensed consolidated statement of comprehensive income 3 Condensed consolidated statement
Audited Group Results for the year ended 30 September 2013 and cash dividend declaration
 Life Healthcare Group Holdings Limited Registration number: 2003/002733/06 Income tax number: 9387/307/15/1 ISIN: ZAE000145892 Share code: LHC Audited Group Results for the year ended 30 September 2013
statements annual financial statements 70 Group salient features 71 Five-year summary of results Annexure a: interest-bearing borrowings
 annual financial statements Annual financial statements 70 Group salient features 71 Five-year summary of results 72 Summary of statistics 73 Definitions 74 Ordinary share ownership 75 Financial review
SUMMARISED AUDITED CONSOLIDATED RESULTS FOR THE YEAR ENDED 28 FEBRUARY 2018 AND DIVIDEND DECLARATION NUMBER 7
 NVEST FINANCIAL HOLDINGS LIMITED AND ITS SUBSIDIARIES (Incorporated in the Republic of South Africa) (Registration number 2008/015990/06) ( NVest, the Group or the Company ) ISIN Code: ZAE000199865 JSE
YeboYethu (RF) Limited. Registration no. 2008/014734/06. Historical financial information for the three financial years ended 31 March 2018
 Limited. Registration no. 2008/014734/06. Historical financial information for the three financial years ended 31 March 2018") YeboYethu (RF) Limited Registration no. 2008/014734/06 Historical financial information for the three financial years ended 31 March 2018 "The preparation of the Historical financial information was supervised
YeboYethu (RF) Limited Registration no. 2008/014734/06 Historical financial information for the three financial years ended 31 March 2018 "The preparation of the Historical financial information was supervised
African Bank Holdings Limited Consolidated Annual Financial Statements 30 September 2018
 Consolidated Annual Financial Statements 30 September 2018 These audited financial statements were prepared under the supervision of G Raubenheimer CA (SA) Registration number: 2014/176855/06. CONTENTS
UNAUDITED INTERIM GROUP RESULTS FOR THE 26 WEEKS ENDED 29 SEPTEMBER 2018, CASH DIVIDEND DECLARATION
 MR PRICE GROUP LIMITED Registration number 1933/004418/06 Incorporated in the Republic of South Africa ISIN: ZAE 000200457 JSE share code: MRP ( Mr Price or the Company or the Group ) UNAUDITED INTERIM
OLD MUTUAL LIFE ASSURANCE COMPANY (SOUTH AFRICA) LTD
 LTD") OLD MUTUAL LIFE ASSURANCE COMPANY (SOUTH AFRICA) LTD CONSOLIDATED AND COMPANY ANNUAL FINANCIAL STATEMENTS 31 DECEMBER 2015 and Company Annual Financial Statements For the year ended 31 December 2015 Contacts
OLD MUTUAL LIFE ASSURANCE COMPANY (SOUTH AFRICA) LTD CONSOLIDATED AND COMPANY ANNUAL FINANCIAL STATEMENTS 31 DECEMBER 2015 and Company Annual Financial Statements For the year ended 31 December 2015 Contacts
This announcement covers the results of the Investec group for the year ended 31 March 2018.
 Investec plc and Investec Limited (combined results) Unaudited combined consolidated financial results for the year ended This announcement covers the results of the Investec group for the year ended.
AUDITED SUMMARY CONSOLIDATED FINANCIAL STATEMENTS FOR THE YEAR ENDED 31 DECEMBER 2017
 AUDITED SUMMARY CONSOLIDATED FINANCIAL STATEMENTS FOR THE YEAR ENDED 31 DECEMBER 2017 17 I TABLE OF CONTENTS 1 SALIENT FEATURES 2 FINANCIAL REVIEW 5 INDEPENDENT AUDITOR S REPORT 6 SUMMARY CONSOLIDATED
Summarised audited financial statements for the year ended 28 February Key performance indicators
 Capitec Bank Holdings Limited Registration number: 1999/025903/06 Registered bank controlling company Incorporated in the Republic of South Africa JSE ordinary share code: CPI ISIN code: ZAE000035861 JSE
JSE LIMITED REVIEWED CONSOLIDATED INTERIM FINANCIAL STATEMENTS
 JSE LIMITED REVIEWED CONSOLIDATED INTERIM FINANCIAL STATEMENTS FOR the six months ended 30 June 2013 Contents FINANCIAL RESULTS Commentary 3 4 Consolidated interim statement of comprehensive income 5 Consolidated
Total assets
 GROUP BALANCE SHEET AS AT 31 DECEMBER Notes R 000 R 000 ASSETS Non-current assets Property, plant and equipment 3 3 166 800 2 697 148 Intangible assets 4 66 917 59 777 Retirement benefit asset 27 142 292
working together to achieve great results
 19% Increase in headline earnings per share 18% Increase in dividend/distribution to ordinary shareholders Strong balance sheet and cash flows GRINDROD LIMITED results and final dividend announcement for
CONDENSED AUDITED FINANCIAL RESULTS FOR THE YEAR ENDED 30 SEPTEMBER 2015
 African Bank Investments Limited (in business rescue) Incorporated in the Republic of South Africa (Registration number 1946/021193/06) Ordinary share code: ABL ISIN: ZAE000030060 Hybrid instrument code:
Interim Results 29 September 2018
 Page 0 Interim Results - Supplementary Information 26 weeks ended 29 September 2018 Index Page Results (Press) announcement 2 Press release 3 Interim cash dividend declaration 4 Unaudited results for the
Unaudited Condensed Consolidated Interim Results for the six months ended 30 September 2014 and Interim Dividend Declaration
 Trustco Group Holdings Limited Incorporated in the Republic of Namibia (Registration number: 2003/058) NSX share code: TUC, JSE share code: TTO ISIN: NA000AORF 067 ("the company", "the Group", or "Trustco")
ANNUAL FINANCIAL STATEMENTS FOR THE YEAR ENDED 30 JUNE 2015
 ANNUAL FINANCIAL STATEMENTS FOR THE YEAR ENDED 30 JUNE 2015 These annual financial statements were compiled by the Company s appointed manager, Remgro Management Services Ltd, under the supervision of
ABRIDGED AUDITED GROUP RESULTS FOR THE YEAR ENDED 31 MARCH 2015, NOTICE OF AGM AND FINAL DIVIDEND DECLARATION
 TRUSTCO GROUP HOLDINGS LIMITED Incorporated in the Republic of Namibia (Registration number 2003/058) NSX Share code: TUC JSE share code: TTO ISIN Number: NA 000A0RF067 ("the Group") ABRIDGED AUDITED GROUP
JSE LIMITED UNREVIEWED CONDENSED CONSOLIDATED INTERIM FINANCIAL STATEMENTS FOR THE SIX MONTHS ENDED 30 JUNE 2018 Responsibility for interim results
 JSE LIMITED INTERIM RESULTS FOR THE SIX MONTHS ENDED 30 JUNE 2018 JSE Limited (Incorporated in the Republic of South Africa) Registration number: 2005/022939/06 Share code: JSE ISIN: ZAE000079711 JSE LIMITED
INTERIM RESULTS for the six months ended 31 March ASSETS UNDER MANAGEMENT (AUM) OF R588 BILLION
 OF R588 BILLION") CORONATION FUND MANAGERS (Incorporated in the Republic of South Africa) Registration number: 1973/009318/06 JSE share code: CML ISIN: ZAE000047353 ("Coronation" or "the company") INTERIM RESULTS for the
CORONATION FUND MANAGERS (Incorporated in the Republic of South Africa) Registration number: 1973/009318/06 JSE share code: CML ISIN: ZAE000047353 ("Coronation" or "the company") INTERIM RESULTS for the