Talk Components. Wharton Risk Center & Research Context TC Flood Research Approach Freshwater Flood Main Results
|
|
|
- Edgar Wilkinson
- 6 years ago
- Views:
Transcription


1 Dr. Jeffrey Czajkowski Willis Research Network Autumn Seminar November 1, 2017
2 Talk Components Wharton Risk Center & Research Context TC Flood Research Approach Freshwater Flood Main Results Freshwater flooding risk identification & spatial characterization Statistical results and their utilization Claim Damage Analysis Concluding comments
3
4
 including both wind and surge")
5 Freshwater Flooding from Tropical cyclones continues to be a significant issue in the U.S. Hurricane Matthew - October 2016, inland flooding losses represented about half of the insured losses and three quarters of percent of total loss (insured and uninsured) including both wind and surge loss estimates Hurricane Harvey August 2017, inland flooding nearly all of total insured losses Region Wind Storm Surge Inland Flood Total Texas 2-3 < Louisiana Total 2-3 <


6 A risk that has been recently recognized by the Industry As the private flood insurance market continues to take shape, enhanced flood analytics can be used to gain important insights into potential flood events before they occur, particularly along the coast, allowing (re)insurers to be more proactive than reactive when developing, managing and growing a profitable flood portfolio Exposure, RMS.com


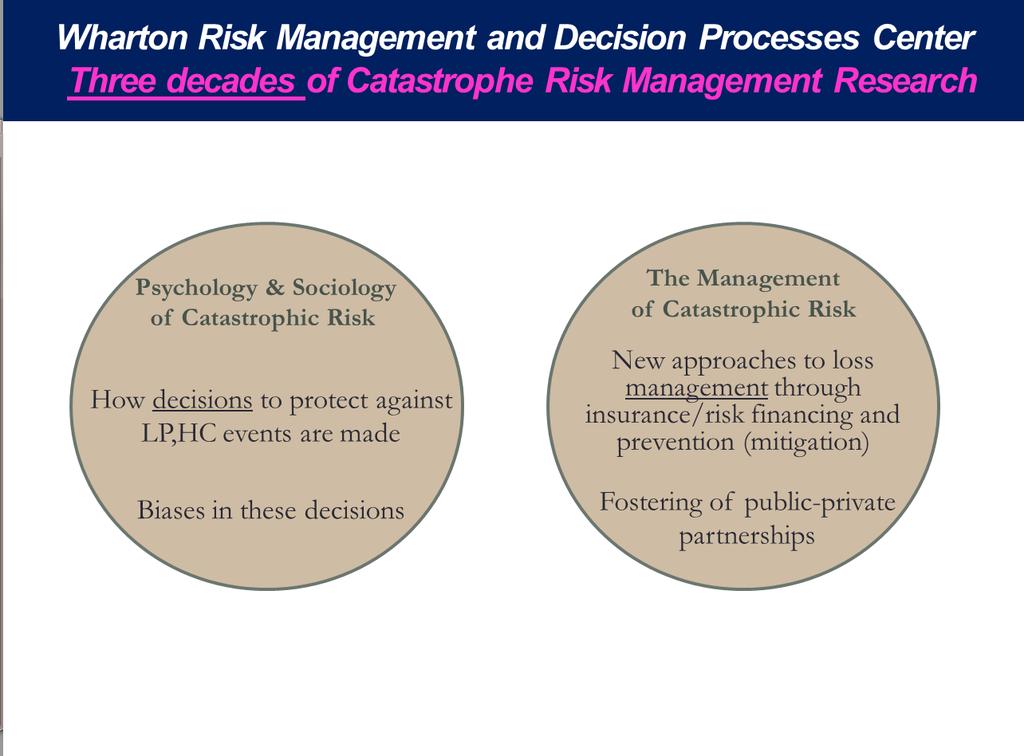
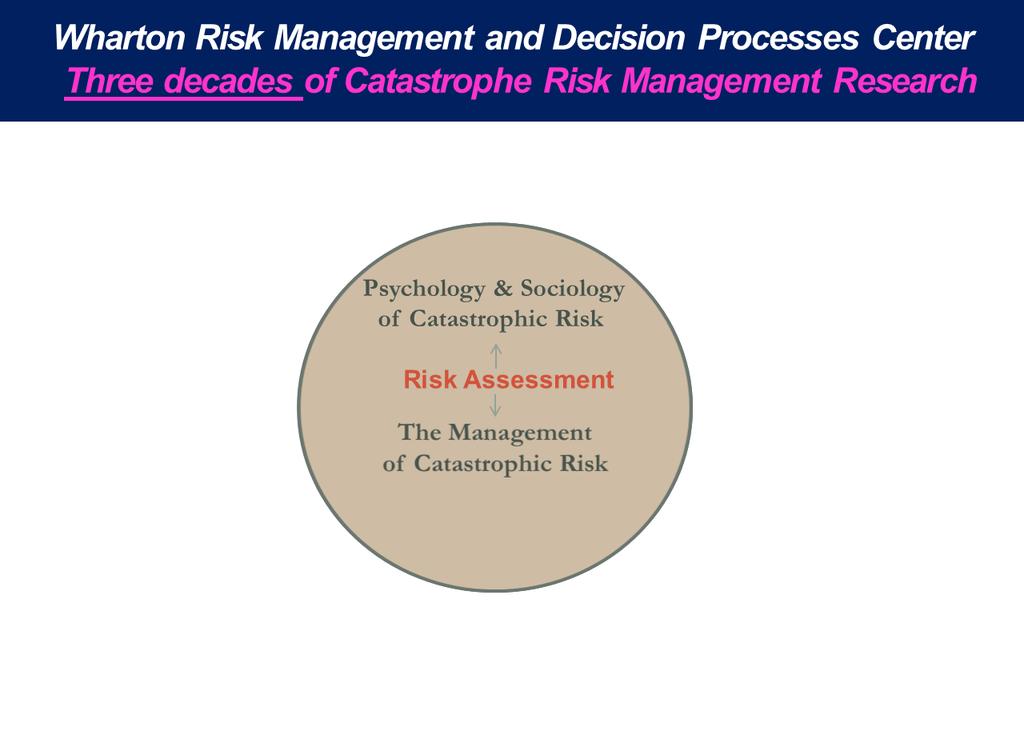
7 Risk Center research on this emerging issue
8 8 An Integrated Approach 1) Quantify the spatial extent and magnitude of freshwater flooding related to TCs at the regional scale 2) Combine the quantified flood magnitudes with associated inland flood claim information from the NFIP database 3) Empirically demonstrate that our approach to quantify flood magnitude is a key driver of the insured economic losses experienced

9 Data from 28 North Atlantic TCs with USGS station located within 500 km from the center of the storm over the period

10 8,030 NFIP communities are impacted on average per TC (>1/3 of total NFIP communities)
 and Hurricane Sandy (2012; right")
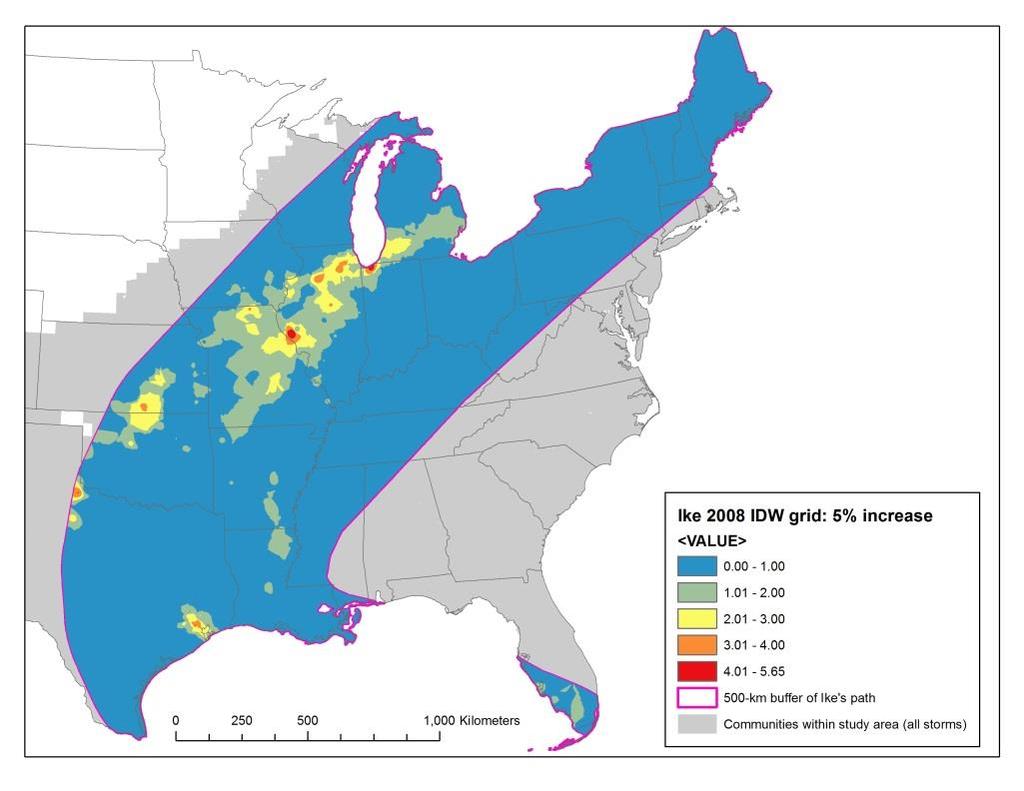
11 Defining the Flood Hazard normalized 2-year flood peak ratios = max flood peak from 2 days prior and 7 days after passage of storm 2 year return period (median of 20+ year historical record) leverage existing NWS flood classifications & interpolate Maps showing the flood ratio values stratified according to the NWS flags for Hurricane Irene (2011; left panel) and Hurricane Sandy (2012; right panel).
12 Relating the flood ratio to flood status classification. This figure shows the relationship between flood ratio values and flood status classification according to the National Weather Service (Action, Bankfull, Minor, Moderate and Major Flooding) for all the stations in our domain. In each boxplot, the limits of the whiskers represent the quantiles, the limits of the box the 0.25 and 0.75 quantiles, while the line in the middle of the box the median (0.5 quantile). The colored horizontal lines represent the limits of the three categories in which we have stratified the flood ratios: a flood ratio below 1 is for bankfull conditions; a flood ratio between 1 and 1.5 represents minor flooding conditions, while values between 1.5 and 2.2 and larger than 2.2 are indicative of moderate and major flooding, respectively.
13 Main outcomes of the research are: 1) the identification of the areas that are more at risk from freshwater flooding from North Atlantic TCs; 2) the characterization of the extent and magnitude of these events; 3) the development of statistical models relating flood magnitude to direct economic losses (number of claims) controlling for exposure and vulnerability aspects 4) the use of the resulting empirical relationships to perform sensitivity analysis examining potential impacts of interest such as climate change precipitation.
14 ~ 10 percent of the impacts NFIP communities have experienced are minor flooding or greater
15 Over 6,000 NFIP community experienced major flooding from these 28 TCs
16 Main outcomes of the research are: 1) the identification of the areas that are more at risk from freshwater flooding from North Atlantic TCs; 2) the characterization of the extent and magnitude of these events; 3) the development of statistical models relating flood magnitude to direct economic losses (number of claims) controlling for exposure and vulnerability aspects 4) the use of the resulting empirical relationships to perform sensitivity analysis examining potential impacts of interest such as climate change precipitation.

17 443,484 total residential non-surge claims with a median of 3,818 claims per storm Total claims are concentrated in 6,600 NFIP communities with at least 1 policy in force

18 Minor flooding or greater, overlaid with claims
19 Regression Results NWS minor, moderate, and major flood classifications (based upon 2 yr. RP) are positive and statistically significant drivers of higher flood claims per impacted community robust across a number of model runs Control for a number of other relevant factors: Number of housing units & NFIP policies-in-force Percent of NFIP community classified as high to low flood risk Percent of NFIP community impervious surface coverage TC type tropical storm, minor hurricane, major hurricane NFIP community distance to coast Year and geographical fixed effects
20 Main outcomes of the research are: 1) the identification of the areas that are more at risk from freshwater flooding from North Atlantic TCs; 2) the characterization of the extent and magnitude of these events; 3) the development of statistical models relating flood magnitude to direct economic losses (number of claims) controlling for exposure and vulnerability aspects 4) the use of the resulting empirical relationships to perform sensitivity analysis examining potential impacts of interest such as climate change precipitation.
21
22 Percentage increase in the number of flood claims 1% increase in flood ratio 0.7% 5% increase in flood ratio 3.5% 10% increase in flood ratio 8.6% 20% increase in flood ratio 17.1% Urbanization increase 2.4%

23 Hurricane Harvey Flood Type % of Communities Mean Housing Units % Impervious Surface % High Risk Zone Bankfull 80% 4,608 10% 39% Minor 6% 4,170 9% 28% Moderate 5% 3,571 9% 37% Major 9% 15,574 16% 31%
24 ANALYZING THE DIFFERENCES IN FRESHWATER AND STORM-SURGE DOLLAR LOSSES FROM THESE EVENTS
25 Existing evidence On Flood Insurance Claim Losses Wharton Risk Center analysis (Kousky and Michel-Kerjan, 2015) 35 years of NFIP claim data, Jan 1978-Dec 2012 Over 1 million single-family residential claims across all 50 states Years Mean Paid Claim Median Paid Claim Number of paid claims $34,478 $12,555 1,119, $54,506 $21, , $91,911 $72, , $34,080 $20, ,434 But no distinction between coastal and freshwater flooding
26 Terminology Surge claim: caused by storm surge/velocity flow tidal water overflow (note, excluded from freshwater claim analysis) Freshwater claim: claims associated with overflow from a stream, river, or lake and claims associated with accumulation of rainfall or snowmelt. [these can be in coastal areas] Flood zones A: Special Flood Hazard Area (SFHA) subject to rising waters V: Special Flood Hazard Area (SFHA) - subject to wave velocity X: outside of the Special Flood Hazard Area (Non-SFHA) Closed vs. open claims Paid claims vs. damage (replacement cost) Note - we decided to exclude Katrina & many of the claims from Sandy were still open
27 Summary of Paid Claims & Damage Paid claims Damage Number of claims Surge (36%) (32%) Freshwater (64%) (68%) Total 231, ,183 Amount Surge (38%) (49%) Freshwater (62%) (51%) Total $6.826B $15.919B Average amount Surge $31,320 $108,972 Freshwater $28,417 $53,455 Overall $32,978 $71,330 For Hurricane Harvey, the NFIP has received more than 87,000 claims and incurred more than $819 million in losses as of September 26. [$9,413 per claim]
28 Surge claims concentrated in a handful of storms 28
29 A: Special Flood Hazard Area (SFHA) subject to rising waters V: Special Flood Hazard Area (SFHA) - subject to wave velocity X: outside of the Special Flood Hazard Area (Non-SFHA) Freshwater claims: inland vs. coastal areas 29
30 A: Special Flood Hazard Area (SFHA) subject to rising waters V: Special Flood Hazard Area (SFHA) - subject to wave velocity X: outside of the Special Flood Hazard Area (Non-SFHA) Surge claims: SFHA vs. Non-SFHA 30
 Boxplot of surge depth-damage ratio by flood")
31 Boxplot of freshwater depthdamage ratio by depth, coastal (C) and inland (I) Boxplot of surge depth-damage ratio by flood zone

32 Depth-damage ratios with USACE depth-damage curve
33 33 Covariate Surge Freshwater A zone property (+) *** V zone property (+) *** PreFIRM property (+) *** (+) *** Repetitive Loss property (+)* (+) *** Elevated structure (-) *** (-) *** Multi-story structure (-) *** (-) *** Structure with basement (-) *** (-) *** Structure replacement cost value (ln) (+) *** (+) *** Community population (in 100,000s) (+) *** (+) *** Community pct. Impervious surface (-) *** (-) *** Flood depth (+) *** (+) *** Property located 0 to 25 mi. from coast (+) *** Property located 100 to 500 mi. from coast Year (+) *** Gulf coast (+) *** (+) *** Florida (+) *** (-) *** Southeast (-) *** (-) *** Northeast (-) *** (-) ***
34 34 Key Points: Freshwater flooding a significant component of U.S. TC risk In both coastal and inland areas Roughly 2/3 of the number of claims, and ½ of the resulting damage Freshwater vs. Surge Dollar Losses While average paid claim amounts are comparable, average damage for surge claims is roughly two times greater Losses increase by flood depth more significantly for storm surge claims Improved risk assessment needs Storm surge risk significant outside V-zones Depth-damage functions may need more calibration at higher flood depth levels
35 35 Research next steps: Fine-tune modeling for individual events Based on the available rainfall forecasts, development of a forecasting system that would forecast insurance claims and losses. The lead time would range between 6 hours and five days.
36 Last but not least - what can we do to reduce the risk? Flood Resilient Communities Measuring resilience in over 100 communities globally Financial, human, natural, physical, and social capital Role of mitigation Community rating system of the NFIP flood insurance premium rates are discounted to reflect the reduced flood risk resulting from the community actions Enhanced building codes demonstrate the economic effectiveness of statewide wind code in Florida Improve communication of the risk - make the risks facing individuals, firms and communities more transparent and to encourage them to invest in protective measures prior rather than after a disaster
37 THANK YOU
35 YEARS FLOOD INSURANCE CLAIMS
 40 RESOURCES NO. 191 WINTER 2016 A Look at 35 YEARS FLOOD INSURANCE CLAIMS of An analysis of more than one million flood claims under the National Flood Insurance Program reveals insights to help homeowners
Catastrophe Economics: Modeling the Losses Due to Tropical Cyclone Related Inland Flooding during Hurricane Ivan in 2004
 Catastrophe Economics: Modeling the Losses Due to Tropical Cyclone Related Inland Flooding during Hurricane Ivan in 2004 Jeffrey Czajkowski 1, Gabriele Villarini 2, Erwann Michel-Kerjan 1, James A. Smith
The AIR Inland Flood Model for Great Britian
 The AIR Inland Flood Model for Great Britian The year 212 was the UK s second wettest since recordkeeping began only 6.6 mm shy of the record set in 2. In 27, the UK experienced its wettest summer, which
Canada s exposure to flood risk. Who is affected, where are they located, and what is at stake
 Canada s exposure to flood risk Who is affected, where are they located, and what is at stake Why a flood model for Canada? Catastrophic losses Insurance industry Federal government Average industry CAT
Quantifying Riverine and Storm-Surge Flood Risk by Single-Family Residence: Application to Texas
 CREATE Research Archive Published Articles & Papers 2013 Quantifying Riverine and Storm-Surge Flood Risk by Single-Family Residence: Application to Texas Jeffrey Czajkowski University of Pennsylvania Howard
Volusia County Floodplain Management Plan 2012
 Volusia County Floodplain Management Plan 2012 Introduction The National Flood Insurance Program (NFIP) provides federally supported flood insurance in communities that regulate development in floodplains.
Determining Tropical Cyclone Inland Flooding Loss on a Large Scale through a New Flood Peak Ratio-based Methodology
 Determining Tropical Cyclone Inland Flooding Loss on a Large Scale through a New Flood Peak Ratio-based Methodology Jeffrey Czajkowski Wharton School Center for Risk Management University of Pennsylvania
INFORMED DECISIONS ON CATASTROPHE RISK
 ISSUE BRIEF INFORMED DECISIONS ON CATASTROPHE RISK Analysis of Flood Insurance Protection: The Case of the Rockaway Peninsula in New York City Summer 2013 The Rockaway Peninsula (RP) in New York City was
Deciphering Flood: A Familiar and Misunderstood Risk
 Special Report Deciphering Flood: A Familiar and Misunderstood Risk May 2017 Deciphering Flood: A Familiar and Misunderstood Risk Among natural disasters, floods are the most common, 1 but from an insurance
CATASTROPHIC RISK AND INSURANCE Hurricane and Hydro meteorological Risks
 CATASTROPHIC RISK AND INSURANCE Hurricane and Hydro meteorological Risks INTRODUCTORY REMARKS OECD IAIS ASSAL VII Conference on Insurance Regulation and Supervision in Latin America Lisboa, 24-28 April
Joel Taylor. Matthew Nielsen. Reid Edwards
 April 28, 2011 Joel Taylor AL DOI and MDI Senior Analyst - Mitigation and Regulatory Affairs Matthew Nielsen Senior Manager Nat Cat & Portfolio Solutions Reid Edwards Senior Director Global Government
Adaptation Practices and Lessons Learned
 Adaptation Practices and Lessons Learned Increased Flooding Risk Due To Sea Level Rise in Hampton Roads: A Forum to Address Concerns, Best Practices and Plans for Adaptation Nov. 16, 2012 Virginia Modeling,
What are the savings? An Assessment of the National Flood Insurance Program s (NFIP) Community Rating System (CRS)
 Community Rating System (CRS)") What are the savings? An Assessment of the National Flood Insurance Program s (NFIP) Community Rating System (CRS) Ajita Atreya Postdoctoral Research Fellow Wharton Risk Management and Decision Processes
What are the savings? An Assessment of the National Flood Insurance Program s (NFIP) Community Rating System (CRS) Ajita Atreya Postdoctoral Research Fellow Wharton Risk Management and Decision Processes
A Methodological Approach for Pricing Flood Insurance and Evaluating Loss Reduction Measures: Application to Texas
 Executive Summary4 January 2012 A Methodological Approach for Pricing Flood Insurance and Evaluating Loss Reduction Measures: Application to Texas Jeffrey Czajkowski, Howard Kunreuther and Erwann Michel-Kerjan
NATURAL PERILS - PREPARATION OR RECOVERY WHICH IS HARDER?
 NATURAL PERILS - PREPARATION OR RECOVERY WHICH IS HARDER? Northern Territory Insurance Conference Jim Filer Senior Risk Engineer Date : 28 October 2016 Version No. 1.0 Contents Introduction Natural Perils
Floodplain Management 101. Mississippi Emergency Management Agency Floodplain Management Bureau
 Floodplain Management 101 Mississippi Emergency Management Agency Floodplain Management Bureau Stafford Act The Stafford Disaster Relief and Emergency Assistance Act (Stafford Act) (Public Law 100-707)
Flood Risk Assessment Insuring An Emerging CAT
 Flood Risk Assessment Insuring An Emerging CAT Vijay Manghnani Analytics and Exposure Officer Chartis Insurance Antitrust Notice The Casualty Actuarial Society is committed to adhering strictly to the
EXAMINING FLOOD INSURANCE CLAIMS IN THE UNITED STATES: SIX KEY FINDINGS
 2015 The Journal of Risk and Insurance (2015). DOI: 10.1111/jori.12106 EXAMINING FLOOD INSURANCE CLAIMS IN THE UNITED STATES: SIX KEY FINDINGS Carolyn Kousky Erwann Michel-Kerjan ABSTRACT We undertake
Evaluating the Effectiveness of the Community Rating System: A Comparative Analysis
 Evaluating the Effectiveness of the Community Rating System: A Comparative Analysis (and other CRS related tidbits) Wesley E. Highfield & Samuel D. Brody Center for Texas Beaches & Shores Department of
G318 Local Mitigation Planning Workshop. Module 2: Risk Assessment. Visual 2.0
 G318 Local Mitigation Planning Workshop Module 2: Risk Assessment Visual 2.0 Unit 1 Risk Assessment Visual 2.1 Risk Assessment Process that collects information and assigns values to risks to: Identify
Hurricane Matthew Finding the Silver Lining through Mitigation and Disaster Recovery
 Hurricane Matthew Finding the Silver Lining through Mitigation and Disaster Recovery Robbie Coates, Grants Manager, Disaster Programs, Virginia Department of Emergency Management Charlie Baker, Floodplain
Georgia Flood M.A.P. Program
 Georgia Flood M.A.P. Program Georgia Flood M.A.P. Program The Upper Chattahoochee River Basin Risk MAP Project Transitioning State Program to align with FEMA s Risk MAP Program Increase focus on risk assessment
Climate Change and The Built Environment
 Climate Change and The Built Environment Committee on the Effect of Climate Change on Indoor Air Quality and Public Health June 7, 2010 Frank Nutter, President Reinsurance Association of America Flooding
NAR Brief MILLIMAN FLOOD INSURANCE STUDY
 NAR Brief MILLIMAN FLOOD INSURANCE STUDY Top Line Summary Independent actuaries studied National Flood Insurance Program (NFIP) rates in 5 counties. The study finds that many property owners are overcharged
Reviving the Culture of Preparedness
 Reviving the Culture of Preparedness May 11, 2018 Dr. Maria Ilcheva HOW CAN SOUTH FLORIDA DEVELOP AND SUSTAIN A CULTURE OF PREPAREDNESS AND RESILIENCE? Preparedness - actions and planning taken before
The AIR Typhoon Model for South Korea
 The AIR Typhoon Model for South Korea Every year about 30 tropical cyclones develop in the Northwest Pacific Basin. On average, at least one makes landfall in South Korea. Others pass close enough offshore
Investing in Business Continuity Planning (BCP) for Coastal Community
 for Coastal Community") Advancing Business Continuity in a Challenging Environment Investing in Business Continuity Planning (BCP) for Coastal Community Dr. Khairul Hisyam Kamarudin May 2018 INTRODUCTION Malaysia has a tropical
Advancing Business Continuity in a Challenging Environment Investing in Business Continuity Planning (BCP) for Coastal Community Dr. Khairul Hisyam Kamarudin May 2018 INTRODUCTION Malaysia has a tropical
Affordability of the National Flood Insurance Program: A Case Study of Charleston County, South Carolina
 University of Pennsylvania ScholarlyCommons Wharton Research Scholars Wharton School 5-7-2014 Affordability of the National Flood Insurance Program: A Case Study of Charleston County, South Carolina Wendy
7. Understand effect of multiple annual exposures e.g., 30-yr period and multiple independent locations yr event over 30 years 3%
 I. FLOOD HAZARD A. Definition 1. Hazard: probability of water height 2. At a Specific XY floodplain location; 3. Z can be expressed as elevation (NAVD88); gauge height; height above ground (depth). 4.
ADVISORY BASE FLOOD ELEVATIONS (ABFEs)
") The Department of Homeland Security s Federal Emergency Management Agency is committed to helping communities that were impacted by Hurricanes Katrina and Rita rebuild safer and stronger. Following catastrophic
The Department of Homeland Security s Federal Emergency Management Agency is committed to helping communities that were impacted by Hurricanes Katrina and Rita rebuild safer and stronger. Following catastrophic
Flood Insurance THE TOPIC OCTOBER 2012
 Flood Insurance THE TOPIC OCTOBER 2012 Because of frequent flooding of the Mississippi River during the 1960s and the rising cost of taxpayer funded disaster relief for flood victims, in 1968 Congress
ACTUARIAL FLOOD STANDARDS
 ACTUARIAL FLOOD STANDARDS AF-1 Flood Modeling Input Data and Output Reports A. Adjustments, edits, inclusions, or deletions to insurance company or other input data used by the modeling organization shall
SECTION V THE LOCAL MITIGATION STRATEGY BLUEPRINT
 SECTION V THE LOCAL MITIGATION STRATEGY BLUEPRINT A. GUIDING MITIGATION PRINCIPLES The Local Mitigation Strategy (LMS) is Hillsborough County s program developed to reduce or eliminate all forms of losses
Flood Risk Valuation Flood Model Evaluation and Risk Pricing Evaluation
 Flood Risk Valuation Flood Model Evaluation and Risk Pricing Evaluation February 26, 2019 Joseph Becker Natural Hazards/Geosciences Group 203.229.8832 joseph.f.becker@guycarp.com GUY CARPENTER Macro forces
Repetitive Loss Area Revisit # 6 Walter Road Area Jefferson Parish
 Repetitive Loss Area Revisit # 6 Walter Road Area Jefferson Parish www.floodhelp.uno.edu Supported by FEMA Acknowledgement The compilation if this report was managed by Erin Patton, CFM, a UNO-CHART Research
New Tools for Mitigation & Outreach. Louie Greenwell Stantec
 New Tools for Mitigation & Outreach Louie Greenwell Stantec Our Discussion Today Background What is Risk MAP? FEMA Products Overview of RiskMAP Data Sets Changes Since Last FIRM Depth and Analysis Grids
Planning for SLR Resiliency in Virginia Beach
 Old Dominion University ODU Digital Commons May 18, 2016: The Economic Impacts of Sea-Level Rise in Hampton Roads Hampton Roads Intergovernmental Pilot Project: Meetings 5-18-2016 Planning for SLR Resiliency
The Global Risk Landscape. RMS models quantify the impacts of natural and human-made catastrophes for the global insurance and reinsurance industry.
 RMS MODELS The Global Risk Landscape RMS models quantify the impacts of natural and human-made catastrophes for the global insurance and reinsurance industry. MANAGE YOUR WORLD OF RISK RMS catastrophe
FLOOD RISK and INSURANCE STUDY FOR ESCAMBIA COUNTY, FL Report 1: Risk Assessment Howard Kunreuther and Marilyn Montgomery 1 February 28, 2017
 FLOOD RISK and INSURANCE STUDY FOR ESCAMBIA COUNTY, FL Report 1: Risk Assessment Howard Kunreuther and Marilyn Montgomery 1 February 28, 2017 Summary This report details an investigation of flood risk
STATISTICAL FLOOD STANDARDS
 STATISTICAL FLOOD STANDARDS SF-1 Flood Modeled Results and Goodness-of-Fit A. The use of historical data in developing the flood model shall be supported by rigorous methods published in currently accepted
Technical Appendix: Protecting Open Space & Ourselves: Reducing Flood Risk in the Gulf of Mexico Through Strategic Land Conservation
 Technical Appendix: Protecting Open Space & Ourselves: Reducing Flood Risk in the Gulf of Mexico Through Strategic Land Conservation To identify the most effective watersheds for land conservation, we
Flood Solutions. Summer 2018
 Flood Solutions Summer 2018 Flood Solutions g Summer 2018 Table of Contents Flood for Lending Life of Loan Flood Determination... 2 Multiple Structure Indicator... 2 Future Flood... 2 Natural Hazard Risk...
Twelve Capital Event Update: Hurricane Michael
 For professional/qualified investors only Twelve Capital Event Update: Hurricane Michael Update Wednesday, 10 October 2018 - Hurricane Michael has strengthened to a category 4 tropical cyclone and is expected
The AIR Inland Flood Model for the United States
 The AIR Inland Flood Model for the United States In Spring 2011, heavy rainfall and snowmelt produced massive flooding along the Mississippi River, inundating huge swaths of land across seven states. As
REAL ESTATE FLOOD DISCLOSURE PROGRAM & FLOOD MAP INFORMATION SERVICES
 REAL ESTATE FLOOD DISCLOSURE PROGRAM & FLOOD MAP INFORMATION SERVICES Lisa Foster, CFM, Floodplain Coordinator ldfoster@pinellascounty.org January 26, 2018 Why are you here? Save your clients money on
THE NATIONAL FLOOD INSURANCE PROGRAM:
 THE NATIONAL FLOOD INSURANCE PROGRAM: Directions for Reform As Congress considers legislative changes to the debt-ridden National Flood Insurance Program, Carolyn Kousky discusses four key issues for reform.
Risk, Mitigation, & Planning
 Risk, Mitigation, & Planning Lessons from Flooding in the Houston Area Russell Blessing, Samuel Brody & Wesley Highfield CUMULATIVE FLOOD LOSS: 1972-2015 INSURED FLOOD LOSS: 1972-2015 THE HOUSTON-GALVESTON
Key Fundamentals of Flood Insurance in the NFIP!
 a Welcome to Key Fundamentals of Flood Insurance in the NFIP! A Before and After approach for Housing Counselors Presented by: 1 Before the Flood Presenter Melanie Graham After the Flood Presenter Erin
Accounting for Long-Term Erosion and Sea Level Rise in New England: A TMAC Recommendation
 Accounting for Long-Term Erosion and Sea Level Rise in New England: A TMAC Recommendation Elena Drei-Horgan, PhD, CFM Jeremy Mull, PE Brian Caufield, PE May 2017 Establishment of TMAC, Definition, Members
Pricing Climate Risk: An Insurance Perspective
 Pricing Climate Risk: An Insurance Perspective Howard Kunreuther kunreuther@wharton.upenn.edu Wharton School University of Pennsylvania Pricing Climate Risk: Refocusing the Climate Policy Debate Tempe,
The AIR Coastal Flood Model for Great Britain
 The AIR Coastal Flood Model for Great Britain The North Sea Flood of 1953 inundated more than 100,000 hectares in eastern England. More than 24,000 properties were damaged, and 307 people lost their lives.
Key Policy Issues for the General Insurance Industry
 16 th General Insurance Seminar Coolum, November 10 2008 Key Policy Issues for the General Insurance Industry Kerrie Kelly Executive Director & CEO Insurance Council of Australia Insurance Council of Australia
Door County Floodplain Program Informational Meeting
 Door County Floodplain Program Informational Meeting Door County Land Use Services Department Wisconsin Department of Natural Resources January 15, 2018 Floodplain = Land affected by flood event with a
BRANDI GABBARD CHAIR, NATIONAL ASSOCIATION OF REALTORS INSURANCE COMMITTEE COUNCIL MEMBER, CITY OF ST. PETERSBURG, FL
 BUILDING CLIMATE RESILIENCE IN THE REAL ESTATE SECTOR BRANDI GABBARD CHAIR, NATIONAL ASSOCIATION OF REALTORS INSURANCE COMMITTEE COUNCIL MEMBER, CITY OF ST. PETERSBURG, FL RESILIENCY THE ABILITY TO PREPARE
Delaware River Basin Commission s Role in Flood Loss Reduction Efforts
 Delaware River Basin Commission s Role in Flood Loss Reduction Efforts There is a strong need to reduce flood vulnerability and damages in the Delaware River Basin. This paper presents the ongoing role
An Introduction to Natural Catastrophe Modelling at Twelve Capital. Dr. Jan Kleinn Head of ILS Analytics
 An Introduction to Natural Catastrophe Modelling at Twelve Capital Dr. Jan Kleinn Head of ILS Analytics For professional/qualified investors use only, Q2 2015 Basic Concept Hazard Stochastic modelling
Individual Flood Preparedness Decisions During Hurricane Sandy in New York City By prof.dr. Wouter Botzen
 Individual Flood Preparedness Decisions During Hurricane Sandy in New York City By prof.dr. Wouter Botzen Agenda 1. Context: Individual adaptation measures in flood risk management 2. Flood risk management
N.C. Floodplain Mapping Program
 N.C. Floodplain Mapping Program Current Status and Update April 23, 2018 NCFMP Program Objectives Purpose: Develop, Maintain, and Disseminate current, accurate, digital flood hazard data for all of NC,
Building a Resilient Energy Gulf Coast: Executive Report
 Building a Resilient Energy Gulf Coast: Executive Report Summary http://americaswetland.com http://entergy.com/gulfcoastadaptation Over the past year, Entergy Corporation has worked to develop a framework
AIR s 2013 Global Exceedance Probability Curve. November 2013
 AIR s 2013 Global Exceedance Probability Curve November 2013 Copyright 2013 AIR Worldwide. All rights reserved. Information in this document is subject to change without notice. No part of this document
Kentucky Risk MAP It s not Map Mod II
 Kentucky Risk MAP It s not Map Mod II Risk Mapping Assessment and Planning Carey Johnson Kentucky Division of Water carey.johnson@ky.gov What is Risk MAP? Risk Mapping, Assessment, and Planning (Risk MAP)
CRT Supplemental Hurricane Disclosure. November 13, 2017
 CRT Supplemental Hurricane Disclosure November 13, 2017 Disclaimer Notice to all Investors: This document is not an offer to sell any Freddie Mac securities. Offers for any given security are made only
REAL ESTATE FLOOD DISCLOSURE PROGRAM & FLOOD MAP INFORMATION SERVICES
 REAL ESTATE FLOOD DISCLOSURE PROGRAM & FLOOD MAP INFORMATION SERVICES Lisa Foster, CFM, Floodplain Coordinator ldfoster@pinellascounty.org January 26, 2018 Why are you here? Save your clients money on
ASFPM Partnerships for Statewide Mitigation Actions. Alicia Williams GIS and HMP Section Manager, Amec Foster Wheeler June 2016
 ASFPM Partnerships for Statewide Mitigation Actions Alicia Williams GIS and HMP Section Manager, Amec Foster Wheeler June 2016 Summary The Concept Leveraging Existing Data and Partnerships to reduce risk
A Discussion of the National Flood Insurance Program
 A Discussion of the National Flood Insurance Program Carolyn Kousky Key Points There is a large flood insurance gap in the United States, with many people exposed to flood risk not covered by flood insurance.
National Institute of Building Sciences
 National Institute of Building Sciences Provider Number: G168 Improving the Flood Resistance of Buildings and Mitigation Techniques WE3B Peter Spanos, P.E., CFM, LEED AP (Gale Associates, Inc.) Stuart
Recommended Edits to the Draft Statistical Flood Standards Flood Standards Development Committee Meeting April 22, 2015
 Recommended Edits to the 12-22-14 Draft Statistical Flood Standards Flood Standards Development Committee Meeting April 22, 2015 SF-1, Flood Modeled Results and Goodness-of-Fit Standard AIR: Technical
Federal Flood Insurance Changes (National Flood Insurance Program NFIP)
") Federal Flood Insurance Changes (National Flood Insurance Program NFIP) Biggert-Waters (BW-12) Flood Insurance Reform Act 2012 HR 4348 Signed by the President on July 6, 2012 Public Works, Engineering
Federal Flood Insurance Changes (National Flood Insurance Program NFIP) Biggert-Waters (BW-12) Flood Insurance Reform Act 2012 HR 4348 Signed by the President on July 6, 2012 Public Works, Engineering
Resilience and the Economics of Risk. NACo s Resilient Counties Advisory Board February 2016
 Resilience and the Economics of Risk NACo s Resilient Counties Advisory Board February 2016 The growing burden of uninsured losses Natural catastrophe losses 1970 2014 (in 2014 USD) 450 400 350 300 Uninsured
Flood Analysis Memo. 629 Orangewood Dr. Dunedin, FL BFE = 21 ft
 Flood Analysis Memo Property Address 629 Orangewood Dr. In Partnership with: ** This property is NOT within a high-risk flood zone ** 629 Orangewood Dr. BFE = 21 ft This property is located in the FEMA
To Cede or Not to Cede
 To Cede or Not to Cede Copyright Ambiental 2015 A Recurring Phenomenon the new normal 2007 2008 2009 2010 2012 2013-14 2015 UK Northumberland Cumbria Cornwall UK & Ireland UK UK 55,000 homes flooded. 13
Reducing Coastal Risk
 Reducing Coastal Risk Committee on U.S. Army Corps of Engineers Water Resources Science, Engineering, and Planning: Coastal Risk Reduction National Research Council Rick Luettich, Committee Chair Committee
Non Regulatory Risk MAP Products Flood Depth and Probability Grids
 Non Regulatory Risk MAP Products Flood Depth and Probability Grids Virginia Floodplain Management Association 2015 Floodplain Management Workshop October 29th, 2015 Nabil Ghalayini, P.E., PMP, D.WRE, CFM
Location: Tampa, Florida March 6, 2013
 Discovery Meeting: West Florida Coastal Study Location: Tampa, Florida March 6, 2013 Agenda Introductions Why we are here Outline Risk MAP products and datasets Discovery Overview: Project scoping and
Flood Insurance Coverage in Dare County: Before and After Hurricane Floyd
 Flood Insurance Coverage in Dare County: Before and After Hurricane Floyd Craig E. Landry Department of Economics Center for Natural Hazards Research East Carolina University National Flood Insurance Program
Private property insurance data on losses
 38 Universities Council on Water Resources Issue 138, Pages 38-44, April 2008 Assessment of Flood Losses in the United States Stanley A. Changnon University of Illinois: Chief Emeritus, Illinois State
July 31, 2017 NFIP Flood Map Open House Flood Maps 101 Flood Mapping acronyms History of the NFIP Flood Mapping Updates Flood Insurance Fairhope,
 July 31, 2017 NFIP Flood Map Open House Flood Maps 101 Flood Mapping acronyms History of the NFIP Flood Mapping Updates Flood Insurance Fairhope, Alabama Flood Maps Fairhope Permitting Jurisdiction Coastal
Community Resilience & NFIP s Community Rating system
 Community Resilience & NFIP s Community Rating system Ajita Atreya Wharton Risk Management and Decision Processes Center University of Pennsylvania National Association of Counties (NACo) Session on Risk
210 W Canal Dr Palm Harbor, FL 34684
 Flood Analysis Memo Property Address In Partnership with: ** This property is within a high risk flood zone ** BFE = 6 ft This property is located in the FEMA designated high-risk zone, Zone AE - an area
AIR Inland Flood Model for Central Europe
 AIR Inland Flood Model for Central Europe In August 2002, an epic flood on the Elbe and Vltava rivers caused insured losses of EUR 1.8 billion in Germany and EUR 1.6 billion in Austria and Czech Republic.
Public Outreach Strategy
 Public Outreach Strategy The Hillsborough County Public Outreach program is a community wide effort and includes participants from all jurisdictions. This report illustrates a commitment by Hillsborough
Quantifying Natural Disaster Risks with Geoinformation
 Quantifying Natural Disaster Risks with Geoinformation Dr James O Brien Risk Frontiers Macquarie University Sydney, NSW, Australia www.riskfrontiers.com Overview Some background Where are the risks? Individual
City of Pensacola and Escambia County Flood Risk and Flood Insurance Study
 City of Pensacola and Escambia County Flood Risk and Flood Insurance Study Preliminary Report 1: Long Hollow and Sanders Beach Tracts Wharton Risk Management and Decision Processes Center November 8, 2016
FREQUENTLY ASKED QUESTION ABOUT FLOODPLAINS Michigan Department of Environmental Quality
 FREQUENTLY ASKED QUESTION ABOUT FLOODPLAINS Michigan Department of Environmental Quality WHAT IS A FLOOD? The National Flood Insurance Program defines a flood as a general and temporary condition of partial
RISK MANAGEMENT NEXT GENERATION
 RISK MANAGEMENT NEXT GENERATION STATE UPDATE July 2014 Marc Stanard / John Dorman Risk Management Key Components and National Status Risk Monitoring No digital tracking Big Elephant to Track Not Tied to
AIR Worldwide Analysis: Exposure Data Quality
 AIR Worldwide Analysis: Exposure Data Quality AIR Worldwide Corporation November 14, 2005 ipf Copyright 2005 AIR Worldwide Corporation. All rights reserved. Restrictions and Limitations This document may
ACTUARIAL & UNDERWRITING COMMITTEE, MARCH 17, 2015 BOARD OF GOVERNORS MEETING, MARCH 18, 2015
 ACTION ITEM BACKGROUND Insurers in Florida, including Citizens, approved by the OIR, designate risks that will be individually rated. Individually rated buildings (also known as Advisory or A-rated risks)
AIRCURRENTS: NEW TOOLS TO ACCOUNT FOR NON-MODELED SOURCES OF LOSS
 JANUARY 2013 AIRCURRENTS: NEW TOOLS TO ACCOUNT FOR NON-MODELED SOURCES OF LOSS EDITOR S NOTE: In light of recent catastrophes, companies are re-examining their portfolios with an increased focus on the
The impact of present and future climate changes on the international insurance & reinsurance industry
 Copyright 2007 Willis Limited all rights reserved. The impact of present and future climate changes on the international insurance & reinsurance industry Fiona Shaw MSc. ACII Executive Director Willis
National Flood Insurance Program
 National Flood Insurance Program A Discussion in Three Parts: The Nature of Flood Risk An Overview of the NFIP Impact of Recent Legislation (BW-12 & HFIAA-14) Nature of Flood Risk FLOODS ARE AN ACT OF
Planning and Flood Risk
 Planning and Flood Risk Patricia Calleary BE MEngSc MSc CEng MIEI After the Beast from the East Patricia Calleary Flood Risk and Planning Flooding in Ireland» Floods are a natural and inevitable part of
Financing Floods in Chicago. Sephra Thomas. GIS for Water Resources C E 394K. Dr. David Maidment
 Financing Floods in Chicago Sephra Thomas GIS for Water Resources C E 394K Dr. David Maidment Fall 2018 Abstract The objective of this term paper is to study the hydrology and social vulnerability of Chicago,
Understanding CCRIF s Hurricane, Earthquake and Excess Rainfall Policies
 Understanding CCRIF s Hurricane, Earthquake and Excess Rainfall Policies Technical Paper Series # 1 Revised March 2015 Background and Introduction G overnments are often challenged with the significant
Mortgage Servicing: Flood Insurance Administration after Biggert-Waters
 NAIC Examination Oversight (E) Task Force Climate Change and Global Warming (E) Working Group Testimony of J. Kevin A. McKechnie, Senior Vice President & Director ABA Office of Insurance Advocacy, to be
Delaware Bay / River Coastal Flood Risk Study. FEMA REGION II and III September 19, 2012
 Delaware Bay / River Coastal Flood Risk Study FEMA REGION II and III September 19, 2012 Agenda Risk MAP Program Overview Risk MAP Non-Regulatory Products & Datasets Region II New Jersey Coastal Flood Study
Recovery Efforts and Legal Issues. Caroline Karp. Senior Lecturer Brown University
 Recovery Efforts and Legal Issues Caroline Karp Senior Lecturer Brown University When retreat is the better part of valor: Analysis of (Some) Strategies to Incentivize Retreat from the Shore EBC/RISEP
Use of FEMA Non regulatory Flood Risk Products in Planning
 Use of FEMA Non regulatory Flood Risk Products in Planning Georgia Association of Floodplain Managers Annual Conference March 24, 2016 What are the Non regulatory Flood Risk products? Go beyond the basic
Risk and Regulation for Extreme Events
 Risk and Regulation for Extreme Events Howard Kunreuther kunreuther@wharton.upenn.edu Wharton School University of Pennsylvania Workshop on Verification, Validation, and Uncertainty Quantification in Regulation
Assurant, Inc. - Climate Change 2018
 Assurant, Inc. - Climate Change 2018 C0. Introduction (C0.1) Give a general description and introduction to your organization. Assurant, Inc. is a global provider of risk management solutions, including
Climate Change Adaptation Plan for Choiseul Bay Township, Solomon Islands
 Climate Change Adaptation Plan for Choiseul Bay Township, Solomon Islands Dr Philip Haines and Ms Shannon McGuire Sustainable Engineering Society - Technical Session 17 March 2015 1 Presentation outline