Annual Financial Report 2017
|
|
|
- Emery Burke
- 6 years ago
- Views:
Transcription
1 Annual Financial Report 2017
2 Annual Financial Report For the year ended 31 December 2017 Contents Page Board of Directors and Executives 1 Forward Looking Statements and Notes 2 Directors Report of Bank of Cyprus Holdings Public Limited Company 3 Consolidated Financial Statements of Bank of Cyprus Holdings Group 25 Independent Auditor s Report to the Members of Bank of Cyprus Holdings Public Limited Company on the Consolidated Financial Statements and the Company Financial Statements 203 Financial Statements of the Bank of Cyprus Holdings Public Limited Company 212 Annual Corporate Governance Report 226 Additional Risk and Capital Management Disclosures 266 Definitions and explanations on Alternative Performance Measures Disclosures 285
3 Board of Directors and Executives as at 26 March 2018 Board of Directors of Bank of Cyprus Holdings Public Limited Company Prof. Dr. Josef Ackermann CHAIRMAN Maksim Goldman VICE CHAIRMAN Arne Berggren Lyn Grobler Dr. Michael Heger John Patrick Hourican Dr. Christodoulos Patsalides Michalis Spanos Ioannis Zographakis Anat Bar-Gera Executive Committee Company Secretary Legal Advisers as to matters of Irish Law Legal Advisers as to matters of English and US Law Legal Advisers as to matters of Cypriot Law Independent Auditors Registered Office John Patrick Hourican CHIEF EXECUTIVE OFFICER Dr. Christodoulos Patsalides DEPUTY CHIEF EXECUTIVE OFFICER AND CHIEF OPERATING OFFICER Michalis Athanasiou CHIEF RISK OFFICER Nick Fahy CHIEF EXECUTIVE OFFICER, BANK OF CYPRUS UK Eliza Livadiotou FINANCE DIRECTOR Panicos Nicolaou DIRECTOR CORPORATE BANKING Louis Pochanis DIRECTOR INTERNATIONAL BANKING, WEALTH AND MARKETS Dr. Charis Pouangare DIRECTOR CONSUMER AND SME BANKING Nicolas Scott Smith DIRECTOR RESTRUCTURING AND RECOVERIES DIVISION Anna Sofroniou DIRECTOR REAL ESTATE MANAGEMENT UNIT Aristos Stylianou EXECUTIVE CHAIRMAN, INSURANCE BUSINESSES Katia Santis Arthur Cox Sidley Austin LLP Chryssafinis & Polyviou LLC Ernst & Young Chartered Accountants Ernst & Young Building Harcourt Centre Harcourt Street Dublin 2 Ireland Arthur Cox 10 Earlsfort Terrace Dublin 2 D02 T380 Ireland 1
4 Forward Looking Statements and Notes Forward Looking Statements and Notes This document contains certain forward-looking statements which can usually be identified by terms used such as expect, should be, will be and similar expressions or variations thereof. These forward-looking statements include, but are not limited to, statements relating to the Bank of Cyprus Holdings Public Limited Company Group (the Group) intentions, beliefs or current expectations and projections about the Group s future results of operations, financial condition, liquidity, performance, prospects, anticipated growth, provisions, impairments, strategies and opportunities. By their nature, forward-looking statements involve risk and uncertainty because they relate to events, and depend upon circumstances, that will or may occur in the future. Factors that could cause actual business, strategy and/or results to differ materially from the plans, objectives, expectations, estimates and intentions expressed in such forward-looking statements made by the Group include, but are not limited to: general economic and political conditions in Cyprus and other European Union (EU) Member States, interest rate and foreign exchange fluctuations, legislative, fiscal and regulatory developments and information technology, litigation and other operational risks. Should any one or more of these or other factors materialise, or should any underlying assumptions prove to be incorrect, the actual results or events could differ materially from those currently being anticipated as reflected in such forward-looking statements. The forward-looking statements made in this document are only applicable as from the date of publication of this document. Except as required by any applicable law or regulation, the Group expressly disclaims any obligation or undertaking to release publicly any updates or revisions to any forward-looking statement contained in this document to reflect any change in the Group s expectations or any change in events, conditions or circumstances on which any statement is based. The definitions and explanations on Alternative Performance Measures Disclosures are presented in Definitions and explanations on Alternative Performance Measures Disclosures of the Annual Financial Report The Annual Financial Report 2017 is available at the Bank of Cyprus Holdings Public Limited Company Registered Office (10 Earlsfort Terrace, Dublin 2, D02 T380, Ireland) and on the Group s website (Investor Relations/Financial Results). 2
5 BANK OF CYPRUS HOLDINGS PUBLIC LIMITED COMPANY Annual Financial Report 2017 Directors Report The Board of Directors submits to the shareholders of the Company their Directors Report together with the audited Consolidated Financial Statements (Consolidated Financial Statements) and Financial Statements of the Company for the year ended 31 December The Annual Financial Report relates to the Bank of Cyprus Holdings Public Limited Company (the Company) and together with its subsidiaries (the Group) which was listed on the London Stock Exchange (LSE) and the Cyprus Stock Exchange (CSE) as at 31 December Group reorganisation On 18 January 2017 the Company became the sole shareholder of Bank of Cyprus Public Company Ltd (BOC PCL). This reorganisation was treated as a reorganisation of an existing entity that has not changed the substance of the reporting entity. The owners of BOC PCL before the reorganisation have the same absolute and relative interests in the net assets of the Group (being the Company, BOC PCL and its subsidiaries) immediately before and after the reorganisation, since the assets and liabilities of the Group and the BOC group (being BOC PCL and its subsidiaries) are the same immediately before and after the reorganisation. Hence, the Group is considered as a continuation of the BOC group. As this transaction did not result in any change of economic substance, it also did not have any effect on the total equity of the Group. The Group s Consolidated Financial Statements reflect the difference in the amounts of share capital, share premium and capital reduction reserves as an adjustment in equity. Activities The Company was incorporated with the intention of becoming the holding company of the Group for the purposes of the Group s listing on the LSE. The principal activities of BOC PCL and its subsidiary companies involve the provision of banking, financial services, insurance services and management and disposal of property predominately acquired in exchange of debt. All Group companies and branches are set out in Note 50 of the Consolidated Financial Statements. The Group has established branches in Greece and Romania. Acquisitions and disposals made during the year 2017 are detailed in Notes 50 and 51 of the Consolidated Financial Statements. Operating environment in Cyprus Economic recovery in Cyprus accelerated in 2017 and the medium term outlook is favourable driven by an improving labour market, broadening investments and increasing resilience. Cyprus continues to face challenges primarily in relation to public and private indebtedness and non-performing exposures (NPEs), but while more remains to be done, considerable progress has been achieved. Real Gross Domestic Product (GDP) in Cyprus increased by 3.9% in 2017 according to the Cyprus Statistical Service, compared with a 3.4% increase the previous year. In the labour market, the unemployment rate dropped to 11% on average in the year from 13% the year before according to the Cyprus Statistical Service. Average consumer inflation was marginally positive at 0.5% after four years of deflation. In the public sector the budget surplus increased significantly and the trend in the public debt to GDP ratio appears to be reversing downwards. In the banking sector funding conditions continued to improve against a backdrop of favourable developments regarding NPEs. The growth momentum is expected to be maintained in the medium term. Real GDP is expected to grow by 3.6% in 2018 and by 2.9% in 2019, slowing towards 2.5% by 2022 according to the International Monetary Fund (IMF) (Cyprus country report, December 2017). Growth will be supported by private consumption and investment expenditures and by an improving and robust labour market. On the supply side, growth is expected to be driven by favourable developments in the tourism sector and robust performance in business services. Tourism remains robust and continues to benefit from geopolitical uncertainties in competing destinations. Tourist arrivals in 2017 reached 3.7 million persons, an all-time high, and revenues reached an estimated 2.6 billion or c.13.7% of GDP. 3
6 BANK OF CYPRUS HOLDINGS PUBLIC LIMITED COMPANY Annual Financial Report 2017 Directors Report Operating environment in Cyprus (continued) The budget surplus increased to 1.9% of GDP in 2017 according to estimates by the IMF (Cyprus country report, December 2017), from 0.5% the previous year. The budget is expected to generate sizeable surpluses in the medium term (IMF, Cyprus country report, December 2017). The debt to GDP ratio is estimated at 97.5% in 2017 according to the Cyprus Statistical Service, and it is expected to decline to 75% by 2022 also according to the IMF (Cyprus country report, December 2017). Debt remains affordable with interest charges at 2.6% of GDP in compared with 3.3% of GDP in 2013 (IMF, Cyprus country report, December 2017). The government took advantage of favourable conditions in debt markets to issue a new 850 million 7-year bond in June 2017 yielding 2.8% to pre-finance borrowing needs through to end-2018, and to smooth its repayment schedule beyond In the banking sector there have been significant improvements in funding conditions and asset quality. Total deposits increased marginally by 0.8% in the year, with resident deposits increasing by 3.3%. Loan deleveraging continued in the year with total loans outstanding dropping by 7.1% and loans to residents dropping by 4.8% (according to Central Bank of Cyprus (CBC) data). Cyprus consistent fiscal outperformance and favourable outlook indicate a more rapid reversal in the public debt ratio and the ratio of NPEs, than previously expected. The outlook over the medium term is generally positive according to the IMF and the European Commission while the economy continues to face challenges. Upside factors relate to a longer period of low oil prices, further improvement of economic fundamentals in the euro area and stronger investment spending as property prices are stabilising and as projects in tourism, energy and public works are being implemented. Downside risks to this outlook are associated with the still high levels of NPEs and public debt ratio, and with a possible deterioration of the external environment. The Cyprus government rating has been repeatedly upgraded following the consistent outperformance in public finances and the progress achieved in the banking sector. Most recently in March 2018, S&P Global Ratings affirmed its long-term sovereign rating at BB+, only one notch below investment grade, and maintained its outlook to positive. Ιn October 2017, Fitch Ratings upgraded its Long-Term Issuer Default ratings to BB from BB- with positive outlook. In July 2017, Moody s Investors Service upgraded the long-term issuer rating of the Cyprus sovereign to Ba3 from B1 to reflect Cyprus economic recovery and maintained its outlook to positive. Moody s Investors Service reiterated its credit rating and positive outlook on the Cyprus sovereign in a February 2018 update. 4
7 BANK OF CYPRUS HOLDINGS PUBLIC LIMITED COMPANY Annual Financial Report 2017 Directors Report Financial results The main financial highlights for 2017 are set out below: Consolidated Income Statement million Net interest income Net fee and commission income Net foreign exchange gains and net gains on other financial instruments and disposal/dissolution of subsidiaries Insurance income net of claims and commissions Net gains from revaluation and disposal of investment properties and on disposal of stock of properties 27 6 Other income Total income Staff costs (228) (224) Other operating expenses (171) (153) Special levy and contribution to Single Resolution Fund (SRF) (23) (20) Total expenses (422) (397) Operating profit Provision charge (779) (370) Impairments of other financial and non-financial assets (65) (47) Provisions for litigation and regulatory matters (98) (18) Total provisions and impairments (942) (435) Share of profit from associates and joint ventures 9 8 (Loss)/profit before tax and restructuring costs (448) 139 Tax (77) (16) Loss/(profit) attributable to non-controlling interests 2 (4) (Loss)/profit after tax and before restructuring costs (523) 119 Advisory, Voluntary Exit Plan and other restructuring costs (29) (114) Net gain on disposal of non-core assets - 59 (Loss)/profit after tax (552) 64 In the consolidated income statement, within the Consolidated Financial Statements for the year ended 31 December 2017: Provision charge includes Provisions for impairment of loans and advances to customers and other customer credit losses and Gain on derecognition of loans and advances to customers and changes in expected cash flows. Advisory, Voluntary Exit Plan and other restructuring costs of 29 million include 28 million presented within Other operating expenses and 1 million presented within Staff costs (2016: 51 million within operating expenses and 63 million within staff costs). The net gain on disposal of non-core assets for the year ended 31 December 2016 represent gains of 58 million and 3 million and losses of 2 million, presented within Net gains on financial instrument transactions and disposal/dissolution of subsidiaries, Other income and Income tax respectively. 5
8 BANK OF CYPRUS HOLDINGS PUBLIC LIMITED COMPANY Annual Financial Report 2017 Directors Report Financial results (continued) Net Interest Margin 3.02% 3.47% Cost to income ratio 47% 41% Cost to income ratio excluding special levy and contribution to Single Resolution Fund 44% 39% Operating profit return on average assets 2.1% 2.5% Basic and diluted (losses)/earnings per share attributable to the owners of the Company/BOC PCL ( cent) (123.72) Key Balance Sheet figures and ratios 31 December December 2016 Gross loans ( million) 18,755 20,130 Accumulated provisions ( million) 4,204 4,519 Customer deposits ( million) 17,850 16,510 Loans to deposits ratio (net) 82% 95% 90+ DPD ratio 37% 41% 90+ DPD provisioning coverage ratio 61% 54% NPE ratio 47% 55% NPE provisioning coverage ratio 48% 41% Quarterly average interest earning assets ( million) 19,826 19,060 Leverage ratio 10.4% 13.2% Capital ratios and risk weighted assets Common Equity Tier 1 capital ratio (CET1) (transitional) 12.7% 14.5% CET1 (fully loaded) 12.2% 13.9% Total capital ratio 14.2% 14.6% Risk weighted assets ( million) 17,260 18,865 Balance Sheet Capital Base Shareholders equity totalled 2,586 million at 31 December The CET1 ratio (transitional) stood at 12.7% at 31 December 2017, compared to 14.5% at 31 December Adjusting for deferred tax assets, the CET1 ratio on a fully-loaded basis totalled 12.2% at 31 December 2017 (2016: 13.9%). During 2017 the CET1 ratio was negatively affected by the loss for the year and the deferred tax asset phasing-in, despite the reduction in risk-weighted assets (RWAs). As at 31 December 2017 the Total Capital ratio (transitional) stood at 14.2%, above the minimum required as from 1 January 2017 of 13%, positively affected mainly by the issuance of 30 million Tier 2 Capital Loan by the UK subsidiary. The Group s minimum phased-in CET1 capital ratio requirement for 2017 was 9.50%, comprised of a 4.50% Pillar I requirement, a 3.75% Pillar II requirement and the Capital Conservation Buffer (CCB) of 1.25% applicable for Following the Supervisory Review and Evaluation Process (SREP) performed by the European Central Bank (ECB) in 2017 and based on the confirmation received in December 2017, the Pillar II requirement applicable from 1 January 2018 has been reduced to 3.00% from 3.75%. As a result, the Group s minimum phased-in CET1 capital ratio has been reduced to 9.375% from 9.50%, comprising of a 4.50% Pillar I requirement, a 3.00% Pillar II requirement and the CCB of 1.875% applicable as from 1 January The ECB has also provided revised lower non-public guidance for an additional Pillar II CET1 buffer. The Group CET1 ratio remains comfortably above this combined Pillar II requirement and guidance. 6
9 BANK OF CYPRUS HOLDINGS PUBLIC LIMITED COMPANY Annual Financial Report 2017 Directors Report Financial results (continued) Balance Sheet (continued) Capital Base (continued) The overall Total Capital Ratio requirement for 2017 was 13.00%, comprising of a Pillar I requirement of 8.00% (of which up to 1.50% can be in the form of Additional Tier 1 (AT1) capital and up to 2.00% in the form of Tier 2 capital), a Pillar II requirement of 3.75% (in the form of CET1), and the CCB of 1.25% applicable for Following the final 2017 SREP decision, the overall Total Capital Ratio requirement has been reduced to % from 13.00%, comprising of 8.00% Pillar I requirement, a 3.00% Pillar II requirement and the CCB of 1.875% applicable as from 1 January The Group continues to explore opportunities, subject to market conditions, to raise up to 1.5% of AT1 in the near term to further strengthen the Group s capital base. In preparation for a potential issuance of AT1 capital instruments and following the approvals of the Cypriot courts in July 2017 and December 2017, BOC PCL proceeded with the full reduction of its capital reduction reserve, in order to eliminate the BOC PCL s accumulated losses. The reduction of capital did not have any impact on regulatory capital or the total equity position of the BOC PCL or the Group. The retained earnings will provide the basis for the calculation of distributable items under the Capital Requirements Regulation (EU) No. 575/2013 (CRR). The CRR provides that coupons on AT1 capital instruments may only be paid out of distributable items. Distributable items for the purposes of the CRR are determined, in part, by reference to retained earnings. At 31 December 2017, BOC PCL had 0.7 billion in distributable items. The BOC PCL is currently under a dividend distribution prohibition which will continue in 2018 following the final 2017 SREP decision received in December However, based on the decision, such prohibition will not apply to the payment of coupons on any AT1 capital instruments issued by BOC PCL. Both the retained earnings and distributable items of BOC PCL will partly decrease as a result of the IFRS 9 implementation on 1 January IFRS 9 Financial Instruments The Group IFRS 9 implementation has been largely completed by 1 January The new accounting standard requires the impact on the implementation date, 1 January 2018, to be recognised through equity rather than the income statement. As a result, the impact on transition, 1 January 2018, will affect the equity of the Group and not the income statement. The Group s IFRS 9 preliminary impact on transition, which is subject to change due to final parameter calibrations, is assessed to a decrease of shareholders equity of c. 300 million, and is primarily driven by credit impairment provisions. This estimated reduction in shareholders equity equates to a decrease in the tangible net asset value at 31 December 2017 of 0.67 per share. The Group will implement the transitional arrangements for regulatory capital purposes which result in only 5% of the estimated IFRS 9 impact affecting the capital ratios during Allowing for IFRS 9 transitional arrangements the impact is a decrease of c.9 bps on Group capital ratios. On a transitional basis and on a fully phased-in basis after the period of transition is complete, the impact of IFRS 9 is expected to be manageable and within the Group s capital plans. Default Definition According to the European Banking Authority (EBA) guidelines that govern the CRR default definition, issued in January 2017, the default definition will gradually evolve to align with the NPE definition by 1 January The Group, in line with regulatory discussions, intends to early adopt changes that will almost align the EBA CRR definition with the NPE definition as from 1 January This will result in an increase in RWAs, equivalent to a decrease of c.40 bps on CET1 ratio and a decrease of c.50 bps on total capital ratio based on 31 December 2017 figures. 7
10 BANK OF CYPRUS HOLDINGS PUBLIC LIMITED COMPANY Annual Financial Report 2017 Directors Report Financial results (continued) Balance Sheet (continued) Funding and Liquidity At 31 December 2017, the BOC PCL s funding from central banks totalled 930 million, which relates wholly to ECB funding, compared to funding from central banks at 31 December 2016 of 850 million, which comprised Emergency Liquidity Assistance (ELA) of 200 million and ECB funding of 650 million. The ECB funding of 930 million at the year-end comprises 830 million of funding through Targeted Longer-Term Refinancing Operations (TLTRO II) and 100 million of funding through Main Refinancing Operations (MRO). BOC PCL fully repaid ELA in January Group customer deposits totalled 17,850 million at 31 December 2017, compared to 16,510 million at 31 December Cyprus deposits stood at 15,983 million at 31 December 2017, accounting for 90% of Group customer deposits. The BOC PCL s deposit market share in Cyprus reached 32.8% at 31 December Customer deposits accounted for 76% of total assets at 31 December The Loan to Deposit ratio (L/D) stood at 82% at 31 December 2017, compared to a high of 151% at 31 March In December 2017, the BOC PCL s subsidiary in the UK issued a 30 million unsecured and subordinated Tier 2 Capital Loan. In January, 2017 BOC PCL accessed the debt capital markets and issued a 250 million unsecured and subordinated Tier 2 Capital Note. At 31 December 2017 the Group Liquidity Coverage Ratio (LCR) stood at 190% (compared to 49% at 31 December 2016) and was in compliance with the minimum regulatory requirement of 80% (which increased to 100% on 1 January 2018). The LCR of BOC PCL amounted to 188%. The Net Stable Funding Ratio (NSFR) was not introduced on 1 January 2018, as per expectations. The minimum requirement of NSFR will be 100%. At 31 December 2017 the Group s NSFR, on the basis of the Basel ΙΙΙ standards, stood at 111% (compared to 95% at 31 December 2016). On 1 January 2018, the local regulatory liquidity requirements were abolished, in accordance with the CRR and in December 2017 the CBC introduced a macro-prudential measure in the form of a liquidity add-on that was imposed on top of the LCR with effect on 1 January The objective of the measure is to ensure that there will be a gradual release of the excess liquidity arising from the lower liquidity requirements under the LCR compared to the ones under the local regulatory liquidity requirements previously in place. The LCR add-on applies stricter outflow and inflow rates than those defined in the Commission Delegated Regulation (EU) 2015/61. The measure will be implemented in two stages. The first stage requires stricter outflow and inflow rates which are applicable from 1 January 2018 until 30 June The second stage requires more relaxed outflow and inflow rates compared to the initial ones and are applicable from 1 July 2018 until 31 December Specifically there will be a reduction of 50% of the LCR add-on rates on 1 July The additional liquidity requirement is expected to be implemented up to 31 December The CBC may propose to modify or extend the period of application of this macro-prudential measure depending on the results of the follow-up of the banks actions on how the excess liquidity is utilised. The Group and BOC PCL are currently in compliance with the LCR including the LCR add-on. Loans and loan portfolio quality Group gross loans totalled 18,755 million at 31 December 2017, compared to 20,130 million at 31 December Gross loans in Cyprus totalled 16,814 million at 31 December 2017 and accounted for 90% of Group gross loans. BOC PCL is the single largest credit provider in Cyprus with a market share of 39.2% at 31 December Gross loans in the UK amounted to 1,621 million at 31 December 2017 and accounted for 9% of Group total gross loans. New loan originations for the Group reached 2,231 million for the 2017 (of which 1,653 million were granted in Cyprus and 578 million by the UK subsidiary), exceeding new lending in 2016 by 53%. At 31 December 2017, the Group net loans and advances to customers totalled 14,602 million (2016: 15,649 million). At 31 December 2017, there were no net loans and advances to customers which were classified as held for sale in line with IFRS 5 (2016: nil). 8
11 BANK OF CYPRUS HOLDINGS PUBLIC LIMITED COMPANY Annual Financial Report 2017 Directors Report Financial results (continued) Balance Sheet (continued) Loans and loan portfolio quality (continued) Tackling the Group s loan portfolio quality remains the top priority for the Group. The Group continues to make steady progress across all asset quality metrics and the loan restructuring activity continues. The Group has been successful in engineering restructuring solutions across the spectrum of its loan portfolio. NPEs as defined by the EBA were reduced by 2.2 billion or 20% during 2017 to 8,804 million at 31 December 2017, accounting for 46.9% of gross loans, compared to 54.8% at 31 December The provisioning coverage ratio of NPEs stood at 48% at 31 December 2017, compared to 41% at 31 December When taking into account tangible collateral at fair value, NPEs are fully covered. The 31 December 2017 NPE provisioning coverage ratio increases from 48% to 51% upon IFRS 9 first time adoption. 31 December December 2016 million % of gross loans million % of gross loans NPEs as per EBA definition 8, % 11, % Of which: - NPEs with forbearance measures, no arrears 1, % 2, % The Group has recorded significant organic NPE reductions for eleven consecutive quarters and expects the organic reduction of NPEs to continue during the coming quarters. In parallel the Group continues to be actively exploring alternative avenues to accelerate this reduction. Loans in arrears for more than 90 days (90+ DPD) were reduced by 1.4 billion or 17% in The decrease was the result of restructuring activity, debt for asset swaps and write offs. 90+ DPD stood at 6,905 million at 31 December 2017, accounting of 37% of gross loans (90+DPD ratio), compared to 41% at 31 December The provisioning coverage ratio of 90+ DPD stood at 61% at 31 December 2017, compared to 54% at 31 December When taking into account tangible collateral at fair value, 90+ DPD loans are fully covered. 31 December December 2016 million % of gross loans million % of gross loans 90+ DPD 6, % 8, % Comprising: - Loans with arrears for over 90 days but not impaired 1, % 1, % - Impaired loans 5, % 6, % Of which: - Impaired with no arrears % % - Impaired with arrears less than 90 days % % Real Estate Management Unit The Real Estate Management Unit (REMU) on-boarded 520 million of assets in 2017, via the execution of debt for asset swaps. The focus for REMU is increasingly shifting from on-boarding of assets resulting from debt for asset swaps towards the disposal of these assets. The Group completed disposals of 258 million in In addition in 2017 the Group disposed of a property with carrying value of 10 million, classified as investment property. As at 31 December 2017, assets held by REMU had a carrying value of 1.6 billion. 9
12 BANK OF CYPRUS HOLDINGS PUBLIC LIMITED COMPANY Annual Financial Report 2017 Directors Report Financial results (continued) Balance Sheet (continued) Real Estate Management Unit (continued) Assets held by REMU (Group) 31 December December 2016 million million Opening balance 1, On-boarded assets 520 1,086 Sales (258) (166) Closing balance 1,641 1,427 Non-core overseas exposures The remaining non-core overseas net exposures (including both on-balance sheet and off-balance sheet exposures) at 31 December are as follows: million 31 December December 2016 Greece Romania Serbia 9 42 Russia The Group continues its effort for further deleveraging and disposal of non-essential assets and operations in Greece, Romania and Russia. In accordance with the Group s strategy to exit from overseas non-core operations, the operations of the branch in Romania are expected to be terminated, subject to the completion of deregistration formalities with respective authorities. Most of the remaining assets and liabilities of the branch in Romania with third parties have been transferred to other entities of the Group. In addition to the above, at 31 December 2017 there were overseas exposures of 168 million in Greece not identified as non-core exposures, since they are considered by management as exposures arising in the normal course of business. Income Statement Net interest income (NII) for 2017 amounted to 583 million down by 15% compared to 686 million a year earlier and the net interest margin (NIM) for 2017 stood at 3.02% (2016: 3.47%). Average interest earning assets for 2017 amounted to 19,301 million, down by 2% a year earlier. Non-interest income for 2017 amounted to 324 million, mainly comprising of net fee and commission income of 180 million, net insurance income of 50 million and net foreign exchange income and net gains on financial instruments and disposal/dissolution of subsidiaries of 48 million. Non-interest income for 2017 increased by 17%, largely driven by the increase in gains from REMU sales and the new and increased commission charges introduced in late Total income for 2017 amounted to 907 million, compared to 963 million for 2016 (6% decrease since last year), with the reduction reflecting mainly the 2017 reduction in NII. Total expenses for 2017 were 422 million, 54% of which related to staff costs ( 228 million), 41% to other operating expenses ( 171 million) and 5% to special levy and contribution to SRF ( 23 million). 10
13 BANK OF CYPRUS HOLDINGS PUBLIC LIMITED COMPANY Annual Financial Report 2017 Directors Report Financial results (continued) Income Statement (continued) The 2017 annual SRF contribution of 6 million was reversed following the amendment of the Imposition of Special Credit Institution Tax Law to allow the offsetting of the SRF contribution with the special levy charge. The cost to income ratio for 2017 was 47%, compared to 41% for 2016, principally reflecting lower interest income. Operating profit for 2017 was 485 million compared to 566 million for Provisions for 2017 totalled 779 million, up by 111% compared to The elevated provisioning levels reflect changes in BOC PCL s provisioning assumptions as a result of the Group s reconsideration of its strategy to more actively explore other innovative strategic solutions to further accelerate balance sheet de-risking. The provisioning charge for 2017 accounted for 4.0% of gross loans. An amount of c. 500 million reflecting the one-off effect of the change in the provisioning assumptions is included in the cost of risk. At 31 December 2017, accumulated provisions, including fair value adjustment on initial recognition and provisions for off-balance sheet exposures, totalled 4,204 million (compared to 4,519 million at 31 December 2016) and accounted for 22.4% of gross loans at 31 December 2017 and 31 December Impairments of other financial and non-financial assets for the year 2017 totalled 65 million, compared to 47 million for 2016, primarily affected by impairment charges relating to legacy exposures and legacy stock of properties in Cyprus and Greece. Provisions for litigation and regulatory matters for 2017 amounted to 98 million, primarily relating to redress provisions for the UK operations and a fine imposed by the Cyprus Commission for the Protection of Competition. The tax charge for 2017 totalled 77 million compared to 16 million in The elevated tax charge of 2017 reflects the reduction of deferred tax assets by 62 million, following the increase in provisions for impairment of loans and advances to customers and evaluation of the recoverability assessment of the DTA balance. Advisory, VEP and other restructuring costs for 2017 totalled 29 million, compared to 114 million for 2016 (down by 74% compared to last year). The elevated levels in the previous year relate mainly to the Voluntary Exit Plan (VEP). Loss after tax attributable to the owners of the Company for 2017 was 552 million, compared to a profit after tax of 64 million for Going concern The Directors have made an assessment of the Group s ability to continue as a going concern. The conditions that existed during 2017 and the developments up to the date of approval of these Consolidated Financial Statements that have been considered in the going concern assessment include, amongst others, the operating environment in Cyprus and of the Group (Note 4 of the Consolidated Financial Statements). The Directors believe that the Group is taking all necessary measures to maintain its viability and the development of its business in the current economic environment. The Directors, taking into consideration the factors described below and the uncertainties that existed at the reporting date, are satisfied that the Group has the resources to continue in business for a period of at least 12 months from the date of approval of the Consolidated Financial Statements and, therefore, the going concern principle is appropriate for the reasons set out below. 11
14 BANK OF CYPRUS HOLDINGS PUBLIC LIMITED COMPANY Annual Financial Report 2017 Directors Report Going concern (continued) The Common Equity Tier 1 (CET1) ratio and the total capital ratio on a transitional basis stood at 12.7% and 14.2% respectively at 31 December 2017, higher than the minimum required ratios (Note of the Consolidated Financial Statements). The IFRS 9 impact on a transitional and on a fully phased-in basis, after the period of transition is complete, is expected to be manageable and within the Group s capital plan. The increasing level of Group customer deposits (increase of 1,340 million during 2017). Customer deposits stood at 17,850 million at 31 December The continuous improvement in the Group liquidity position and its liquidity ratios. Following the repayment of ELA in January 2017 (2016: 200 million), the Group achieved compliance with the LCR. The Group is also in compliance with the LCR add-on, which was introduced by the CBC as a macro-prudential measure and is applicable from 1 January 2018 (Notes and 46 of the Consolidated Financial Statements). As at 31 December 2017, the Group was not in compliance with all liquidity regulatory requirements with respect to its operations in Cyprus, however, these ratios were abolished on 1 January The significant reduction of Group loans that are impaired or past due for more than 90 days (90+ DPD), which have decreased by 17% during 2017 and totalled 6,905 million at 31 December 2017 and the increase of provisions coverage to 61% compared to 54% at 31 December 2016 (Note of the Consolidated Financial Statements). The Cyprus government rating has been repeatedly upgraded following the consistent outperformance in public finances and the progress achieved in the banking sector. Most recently in March 2018, S&P Global Ratings affirmed its long-term sovereign rating at BB+, only one notch below investment grade, and maintained its outlook to positive. Ιn October 2017, Fitch Ratings upgraded its Long-Term Issuer Default ratings to BB from BB- with positive outlook. In July 2017, Moody s Investors Service upgraded the longterm issuer rating of the Cyprus sovereign to Ba3 from B1 to reflect Cyprus economic recovery and maintained its outlook to positive. Moody s Investors Service reiterated its credit rating and positive outlook on the Cyprus sovereign in a February 2018 update. BOC PCL regained access to the debt capital markets in January 2017 with the issuance of a 250 million unsecured subordinated Tier 2 Capital Note. Viability statement In accordance with the requirements of the UK Corporate Governance Code 2016 (UK Code), the Directors have assessed the viability of the Group, taking account of the Group s current position and the potential impact of the main risks that the Group is facing. The Directors have selected a three-year period for this assessment in arriving at the viability statement, which is also within the usual planning process of the Group. The Directors have assessed the prospects of the Group through a number of sources, including the latest 3 year plan of the Group, the NPE strategy, the Internal Capital Adequacy Assessment Process (ICAAP) and the Internal Liquidity Assessment Process (ILAAP) reports. The Group prepared a detailed NPE Strategy Plan for the 5 year period as requested by the Single Supervisory Mechanism (SSM). The plan was approved by the Board of Directors of the Company and submitted to the SSM in March The Group is currently preparing its first annual review of its NPE Strategy Plan. The ICAAP is an annual process that demonstrates whether the Group has all the necessary procedures in place in adequately identifying, measuring and monitoring the Group s risks and ensures that the Group holds adequate capital to support its risk profile, under both a base case and a stress case. The Group also undertakes a quarterly review of its ICAAP results considering the latest actual and forecasted information. During the quarterly review, the Group s risk profile and risk management policies and processes are reviewed and any changes since the annual ICAAP exercise are taken into consideration. The ICAAP process demonstrates that the Group has sufficient capital under both the base and stress case scenarios to support its business and achieve its objectives having regard to its Board approved Risk Appetite and Strategy, and to meet its regulatory capital, leverage and liquidity requirements. 12
15 BANK OF CYPRUS HOLDINGS PUBLIC LIMITED COMPANY Annual Financial Report 2017 Directors Report Viability statement (continued) The Group s ILAAP analysis demonstrates that the volume and capacity of liquidity resources available to the Group are adequate to support its business model, to achieve its strategic objectives under both the business as usual and severe stress scenarios and to meet regulatory requirements including the LCR and NSFR. The Group prepares the ICAAP and ILAAP reports annually. Both reports for year 2016 were approved by the Board of Directors and submitted to the SSM in April The current year ICAAP and ILAAP reports are in progress and are expected to be finalised and submitted to the SSM by the end of April The base case of the ICAAP report is the latest 3 year plan of the Group approved by the Board in December 2017, updated if necessary for any developments. The Directors confirm that based on their assessment of the principal risks which the Group is exposed, the most significant of which are credit risk, liquidity risk, litigation risk, market risk (arising from adverse movements in exchange rates, interest rates and security prices) and risk on changes in the fair value of property, those risks are monitored and mitigated through various control mechanisms and processes (refer to Risk management section below). Based on this, and the assessment of the Group s prospects, the Directors have a reasonable expectation that the Group will be able to continue in operation and meet its liabilities as they fall due over the period to 31 December Business Overview As the Cypriot operations account for 90% of gross loans and 90% of customer deposits, the Group s financial performance is highly correlated to the economic and operating conditions in Cyprus and will consequently benefit from the country s recovery. Most recently in October 2017, Standard and Poor s assigned BOC PCL 'B/B' long- and short-term issuer credit ratings with positive outlook. BOC PCL currently has a long-term deposit rating from Moody s Investors Service of Caa1 with a positive outlook and a long-term issuer default rating from Fitch Ratings Limited of B- with stable outlook. The key drivers for the ratings were the improvement in the Group s financial fundamentals mainly in asset quality and its funding position. Tackling the Group s loan portfolio quality is of utmost importance for the Group. During the year an internal reorganisation of the Restructuring and Recoveries Division (RRD) was implemented with the aim of boosting resources on both the Retail and Small and medium-sized enterprises (SME) portfolios of RRD in order to further improve pace and sustainability in these portfolios. Additionally, the Group has created an incremental servicing engine powered by Pepper Cyprus Limited, to support BOC PCL in resolving nonperforming loans from its SME and retail portfolios. The strategic focus of the Group is to reshape its business model to grow in the core Cypriot market through prudent new lending and carefully developing the UK franchise. The Group s capital position remains adequate and the Group expects to continue to be able to support the recovery of the Cyprus economy through the provision of new lending. Growth in new lending in Cyprus is focused on selected industries that are more in line with BOC PCL's target risk profile, such as tourism, trade, professional services, information/communication technologies, energy, education and green projects. BOC PCL is currently looking to carefully expand its UK operations, remaining consistent with the Group s overall credit appetite and regulatory environment. With selective presence in London and Birmingham and a predominantly retail funded franchise, the UK strategy is to support its core proposition in the property market, specifically targeting the professional buy-to-let market and further expanding its mortgage business and its savings, current accounts and trade-related products for SMEs, professionals and Cypriot residents. Aiming at supporting investments by SMEs and mid-caps to boost the Cypriot economy and create new jobs for young people, BOC PCL continues to provide joint financed schemes. To this end, BOC PCL continues its partnership with the European Investment Bank (EIB), the European Investment Fund (EIF), the European Bank for Reconstruction and Development (EBRD) and the Cyprus Government. 13
16 BANK OF CYPRUS HOLDINGS PUBLIC LIMITED COMPANY Annual Financial Report 2017 Directors Report Business Overview (continued) Management is also placing emphasis on diversifying income streams by boosting fee income from international transaction services, wealth management and insurance. The Group s insurance companies, EuroLife Ltd and General Insurance of Cyprus Ltd operating in the sectors of life and general insurance respectively, are leading players in the insurance business in Cyprus, with such businesses providing a recurring income, further diversifying the Group s income streams. The insurance income net of insurance claims for 2017 amounted to 50 million, up by 13% during 2017, compared to 44 million for 2016, contributing to 16% of non-interest income. In order to further improve its funding structure, BOC PCL is stepping up its efforts to manage the deposit mix to ensure continued compliance with liquidity requirements, taking advantage of the increased customer confidence towards the Group, as well as improving macroeconomic conditions in Cyprus. Strategy and Outlook The Group remains on track for implementing its strategic objectives aiming to become a stronger, safer and a more focused institution capable of supporting the recovery of the Cypriot economy and delivering appropriate shareholder returns in the medium term. The key pillars of the Group s strategy are to: Materially reduce the level of delinquent loans Further improve the funding structure Maintain an appropriate capital position by internally generating capital Focus on the core Cyprus market and the UK operations Achieve a lean operating model Deliver value to shareholders and other stakeholders 14
17 BANK OF CYPRUS HOLDINGS PUBLIC LIMITED COMPANY Annual Financial Report 2017 Directors Report Strategy and Outlook (continued) KEY PILLARS 1. Materially reduce the level of delinquent loans 2. Further improve the funding structure 3. Maintain an appropriate capital position 4. Focus on core markets 5. Achieve a lean operating model 6. Deliver returns PLAN OF ACTION Sustain momentum in restructuring Focus on terminated portfolios (in Recovery Unit) accelerated consensual foreclosures Real estate management via REMU Explore alternative accelerating NPE reduction measures such as NPE sales, securitisations etc. Focus on shape and cost of deposit franchise Increase loan pool for the Additional Credit Claim framework of ECB Further diversify funding sources Internally generate capital Potential AT1 issuance Targeted lending in Cyprus into promising sectors to fund recovery New loan origination, while maintaining lending yields Revenue diversification via fee income from international business, wealth, and insurance Careful expansion of UK franchise by leveraging the UK subsidiary Implementation of digital transformation program underway, aimed at enhancing productivity distribution channels and reducing operating costs over time Deliver appropriate medium term riskadjusted returns 15
18 BANK OF CYPRUS HOLDINGS PUBLIC LIMITED COMPANY Annual Financial Report 2017 Directors Report Strategy and Outlook (continued) The table below shows the Group s performance against the 2018 Target and the Medium Term Guidance. Group Key Performance Indicators Asset Quality NPE ratio 55% 47% 2018 Target <40% ~ 2 billion organic reduction Medium-Term Guidance <25% NPE coverage ratio 41% 48% >50% >50% Cost of Risk (Provisioning charge) 2 1.7% 4.0% 2 <1.0% <1.0% Capital CET1 Ratio 14.5% 12.7% >13% 3,4 >13% 3,4 Total Capital Ratio 14.6% 14.2% >15% 3,4 >15% 3,4 Profitability Total income 963 million 907 million > 800 million Cost to Income ratio 41% 47% <50%5 Total income to grow in excess of cost 5 Net fee and commission income / total income 17% 6 20% >20% >20% Balance Sheet Total assets 22.2 billion 23.6 billion ~ 23 billion > 25 billion Earnings per share EPS ( cent) (123.72) ~ The NIM and the Net Loans to Deposits (L/D) targets have been removed. A new target on Total Income has been included in the key metrics considering the focus of the Group on total revenue generation and the shift of income to other lines of the Income Statement. The L/D ratio has been removed as it is not considered representative following the efforts of the Group to comply with the LCR ratio including the LCR add-on. 2 An amount of c. 500 million reflecting the one-off effect of the change in the provisioning assumptions is included in the cost of risk. 3 Allowing for IFRS 9 transitional arrangements for regulatory capital purposes in line with European Union (EU) Regulation (2018: 5%, 2019: 15%, 2020: 30%, 2021: 50% and 2022: 75%). 4 Including the impact of the adoption of the changes aligning the EBA CRR default definition with the NPE definition. 5 Excluding the special levy and SRF contribution. 6 The net fee and commission income over total income for 2016 excludes non-recurring fees of ~ 7 million. 7 The 2018 target for the earnings per share does not include the impact of any trades or any unplanned or unforeseen events. 16
19 BANK OF CYPRUS HOLDINGS PUBLIC LIMITED COMPANY Annual Financial Report 2017 Directors Report Capital base Shareholders equity totalled 2,586 million at 31 December The CET1 ratio (transitional) totalled 12.7% at 31 December 2017 (2016: 14.5%). Adjusting for DTA, the CET1 ratio on a fully-loaded basis totalled 12.2% at 31 December 2017 (2016: 13.9%). The Total Capital ratio (transitional), at 31 December 2017, stood at 14.2% (2016: 14.6%). Additional information on regulatory capital is disclosed in the Additional Risk and Capital Management Disclosures which form part of this Annual Report and in the Pillar 3 Disclosures Report, which is available on the Group s website (Investor Relations). Share capital As at 31 December 2017, there were 446,199,933 issued ordinary shares with a nominal value of 0.10 each. Information about the changes on the authorised and issued share capital during 2017 and 2016 is disclosed in Note 35 of the Consolidated Financial Statements. Share-based payments - share options Following the incorporation of the Company and its introduction as the new holding company of the Group in January 2017, the Long Term Incentive Plan (as approved on 24 November 2015 by the Annual General Meeting of BOC PCL) was replaced by the Share Option Plan which operates at the level of the Company. The Share Option Plan is identical to the Long Term Incentive Plan except that the number of shares in the Company to be issued pursuant to an exercise of options under the Share Option Plan should not exceed 8,922,945 ordinary shares of a nominal value of 0.10 each and the exercise price was set at 5.00 per share. The term of the options was also extended to between 4-10 years after the grant date. No share options were granted since the date of replacement of the Long Term Incentive Plan by the Share Option Plan at the level of the Company. Any shares related to the Share Option Plan carry rights with regards to control of the Company that are only exercisable directly by the employee. Treasury shares of the Company Shares of the Company held by entities controlled by the Group are deducted from equity on the purchase, sale, issue or cancellation of such shares. No gain or loss is recognised in the consolidated income statement. The life insurance subsidiary of the Group, as at 31 December 2017, held a total of 142 thousand ordinary shares of the Company of a nominal value of 0.10 each (2016: 2,889 thousand ordinary shares of BOC PCL of a nominal value of 0.10 each), as part of its financial assets which are invested for the benefit of insurance policyholders (Note 24 of the Consolidated Financial Statements). The cost of acquisition of these shares was 21,463 thousand (2016: 25,333 thousand). For additional disclosures refer to Note 35 of the Consolidated Financial Statements. 17
20 BANK OF CYPRUS HOLDINGS PUBLIC LIMITED COMPANY Annual Financial Report 2017 Directors Report Change of control There are no significant agreements to which the Company is a party and which take effect following a change of control of the Company, but the Company is party to a number of agreements that may allow the counterparties to alter or terminate the agreements following a change of control. These agreements are not deemed to be significant in terms of their potential effect on the Group as a whole. The Group also has agreements which provide for termination if, upon a change of control of the Company, the Company s creditworthiness is materially worsened. Other information During 2017 and 2016 there were no restrictions on the transfer of the Company s ordinary shares or securities and no restrictions on voting rights other than the provisions of the Banking Law of Cyprus which requires the CBC approval prior to acquiring shares of the Company in excess of certain thresholds and the requirements of the Directive on Insider Dealing and Market Manipulation, which relates to transactions with related parties. Shares of the Company held by the life insurance subsidiary of the Group as part of its financial assets which are invested for the benefit of insurance policyholders carry no voting rights, pursuant to the insurance law. The Company does not have any shares in issue which carry special control rights. There are no agreements between shareholders, known to the Company, which may result in restrictions on the transfer of securities or voting rights. Rights and obligations of ordinary shares In accordance with the Company s Constitution, the rights and restrictions attaching to the ordinary shares are as follows: subject to the right of the Company to set the record dates for the purposes of determining the identity of members entitled to notice of and/or to vote at a general meeting, the right to attend and speak at any general meeting of the Company and to exercise one vote per ordinary share at any general meeting of the Company; the right to participate pro rata in all dividends declared by the Company; and the right, in the event of the Company s winding up, to participate pro rata in the total assets of the Company. Shareholders holding more than 3% of the share capital of the Company As at 31 December 2017 and 15 March 2018 the following shareholders held more than 3% of the share capital of the Company: Lamesa Holdings S.A. (affiliate of Renova Group) European Bank for Reconstruction and Development 31 December March 2018 Number of ordinary or Depositary Interests representing Company ordinary shares % held Number of ordinary or Depositary Interests representing Company ordinary shares % held 41,383, % 41,383, % 22,401, % 22,401, % Cyprus Popular Bank Public Co Ltd 21,467, % 21,467, % TD Asset Management 19,365, % 19,365, % Senvest Management LLC 16,383, % 16,383, % Osome Investments Ltd 14,809, % 14,809, % Eaton Vance 13,708, % 16,182, % 18
21 BANK OF CYPRUS HOLDINGS PUBLIC LIMITED COMPANY Annual Financial Report 2017 Directors Report Dividends The Company and BOC PCL are currently under a regulatory dividend distribution prohibition and therefore no dividends were declared or paid during the years 2017 and Events after the reporting date There are no material events which occurred after the reporting date. Risk management Like other financial organisations, the Group is exposed to risks, the most significant of which are credit risk, liquidity risk, market risk (arising from adverse movements in exchange rates, interest rates and security prices) and insurance risk. The Group monitors, manages and mitigates these risks through various control mechanisms. Detailed information relating to Group risk management is set out in Notes 44 to 47 of the Consolidated Financial Statements and in the Additional Risk and Capital Management Disclosures which form part of the Annual Financial Report The Group is also exposed to litigation risk, arising from claims, investigations and regulatory matters. Further information is disclosed in Note 39 of the Consolidated Financial Statements. Additionally, the Group is exposed to the risk on changes in the fair value of property which is held either for own use or as stock of property or as investment property. Stock of property is predominately acquired in exchange of debt and is intended to be disposed of in line with the Group s strategy. Further information is disclosed in Notes 22, 25 and 27 of the Consolidated Financial Statements. In addition, details of the significant judgements, estimates and assumptions which may have a material impact on the Group s financial performance and position are set out in Note 5 of the Consolidated Financial Statements. Details of the financial instruments and hedging activities of the Group are set out in Notes 22 and 44 to 46 of the Consolidated Financial Statements. The Pillar 3 Disclosures Report (unaudited) of the Group required with respect to the requirements of the Capital Requirement Regulation (EU) No 575/2013 is published on the Group s website (Investor Relations). Books and significant records The measures that the Directors have taken to secure compliance with the requirements of sections 281 to 285 of the Companies Act 2014 of Ireland (Companies Act 2014), with regard to the keeping of accounting records, include the provision of appropriate resources to maintain adequate accounting records throughout the Company and the Group, including the appointment of personnel with appropriate qualifications, experience and expertise. The accounting records are maintained at the Company s registered office at 10 Earlsfort Terrace, Dublin 2, D02 T380, Ireland and at 51 Stassinos Street, Ayia Paraskevi, Strovolos, P.O.Box 24884, 1398 Nicosia, Cyprus. Research and development The Group did not incur any expenditure in research and development for the year ended 31 December Political donations Political donations are required to be disclosed under the Electoral Act 1997 of Ireland (as amended). The Directors, on enquiry, have satisfied themselves that there were no political donations made during the year ended 31 December
22 BANK OF CYPRUS HOLDINGS PUBLIC LIMITED COMPANY Annual Financial Report 2017 Directors Report Relevant audit information In the case of persons who are Directors at the time this report is approved in accordance with section 330 of the Companies Act 2014: the Directors hereby individually and collectively acknowledge, that so far as each Director is aware, there is no relevant material audit information of which the Company s statutory auditors are unaware; and that he/she has taken all the steps that he/she ought to have taken as a Director in order to make himself/herself aware of any relevant audit information and to establish that the Company s statutory auditors are aware of that information. Preparation of periodic reporting The Board is responsible for ensuring that the management maintains an appropriate system of internal controls which provides assurance of effective operations, internal financial controls and compliance with rules and regulations. It has the overall responsibility for the Group and approves and oversees the implementation of the Group s strategic objectives, risk strategy and internal governance. The Group has appropriate internal control mechanisms, including sound administrative and accounting procedures, Information Technology (IT) systems and controls. The governance framework is subject to review at least once a year. Policies and procedures have been designed in accordance with the nature, scale and complexity of the Group s operations in order to provide reasonable but not absolute assurance against material misstatements, errors, losses, fraud or breaches of laws and regulations. The Board, through the Audit Committee, conducts reviews on a frequent basis, regarding the effectiveness of the Group s internal controls and information systems, as well as in relation to the procedures used to ensure the accuracy, completeness and validity of the information provided to investors. The reviews cover all systems of internal controls, including financial, operational and compliance controls, as well as risk management systems. The role of the Audit Committee is inter alia to ensure the financial integrity and accuracy of the Company s financial reporting. The Group s financial reporting process is controlled using documented accounting policies and procedures supported by instructions and guidance on reporting requirements, issued to all reporting entities within the Group in advance of each reporting period. The submission of financial information from each reporting entity is subject to sign off by the responsible financial officer. Further analytical review procedures are performed at Group level. The internal control system also ensures that the integrity of the accounting and financial reporting systems, including financial and operational controls and compliance with legal and regulatory requirements and relevant standards, is adequate. The Group has in place an effective financial statement closing process by which transactions and events reflected in the Group s accounting records are processed to produce the financial statements, related disclosures and other financial reports. The Annual Report pre its submission to the Board is reviewed and approved by the Executive Committee. The Board, through the Audit Committee scrutinises and approves the financial statements, results announcements and the Annual Report and ensures that appropriate disclosures have been made. This governance process ensures that both management and the Board are given sufficient opportunity to challenge the Group s financial statements and other significant disclosures before their publication. 20
23 BANK OF CYPRUS HOLDINGS PUBLIC LIMITED COMPANY Annual Financial Report 2017 Directors Report Corporate Governance Statement In April 2014 the CSE issued the 4th Edition (Revised) of the Corporate Governance Code (the CSE Code). Listed companies have an obligation to include in their Annual Financial Report, a Report by the Board of Directors on Corporate Governance. In the first part of the Report, companies should report whether they comply with the CSE Code and the extent to which they implement its principles. In the second part of the Report, companies should confirm that they have complied with the CSE Code provisions and in the event that they have not, they should give adequate explanation. The Company has also chosen to comply with the UK Corporate Governance Code 2016 published by the Financial Reporting Council in the UK (the UK Code) following the decision to proceed with a Listing on the London Stock Exchange. Regarding the first part of the Report, as a company listed on the CSE, the Company has adopted the CSE Code and implements its principles. Regarding the second part of the Report, the Company complies with the provisions of the CSE Code. Throughout the Corporate Governance Report for 2017 a narrative statement is provided on how the principles of the CSE Code have been applied. The narrative also covers principles of the UK Code and how these have been applied throughout the year. The rules governing the composition of the Board of Directors and the appointment and replacement of its members are set out in Section 1 of the Corporate Governance Report for The powers of the Board of Directors and committees of the Board with administrative, management and supervisory functions, including any powers of the Directors in relation to the issuing or buying back by the Company of its shares, are also set out in the Corporate Governance Report. Any amendment or addition to the Articles of Association of the Company is only valid if approved by a special resolution at a shareholders meeting. A description of the operation of the shareholder meeting, the key powers of the shareholder meeting, shareholders rights and the exercise of such right is contained in Section 7 of the Corporate Governance Report. Details of restrictions in voting rights and special control rights in relation to the shares of the Company are set out in the section Other information above. Other information required to be disclosed for the purposes of the European Communities (Takeover Bids (Directive 2004/25/EC)) Regulations 2006 is contained on pages 3 to 24. In accordance with section 167 of the Companies Act 2014, the Directors confirm that a Board Audit Committee is established. Details of the Board Audit Committee s membership and activities are included in Corporate Governance Report for The Corporate Governance Report for 2017 is included within this Annual Financial Report on pages 226 to 265. The statements and information referred in this Corporate Governance Statement are deemed to be incorporated herein. 21
24 BANK OF CYPRUS HOLDINGS PUBLIC LIMITED COMPANY Annual Financial Report 2017 Directors Report Directors Compliance Statement As required by section 225 of the Companies Act 2014, the Directors acknowledge that they are responsible for securing the Company s compliance with its relevant obligations (as defined in section 225(1)). The Directors confirm that a compliance statement has been drawn up setting out the Company s policies and that appropriate arrangements and structures have been put in place that are, in the Directors opinion, designed to secure material compliance with the relevant obligations. A review of those arrangements and structures has been conducted in the financial year to which this report relates. Service termination agreements The service contract of one of the executive directors in office as at 31 December 2017 includes a clause for termination, by service of four months notice to that effect upon the executive director, without cause but at BOC PCL s sole discretion. In such a case, BOC PCL shall have the obligation to pay the executive director in lieu of notice for immediate termination. The terms of employment of the other executive director are mainly based on the provisions of the collective agreement in place, which provides for notice or compensation by the BOC PCL based on years of service and for a four month prior written notice by the executive director in the event of a voluntary resignation. Board of Directors The members of the Board of Directors of the Company as at the date of this Directors Report are listed on page 1. All Directors were members of the Board throughout the year and up to the date of this Directors Report except as disclosed below. Ms Lyn Grobler was appointed as member of the Board of Directors following ECB approval on 7 February On 27 April 2017 the Board of Directors decided to appoint Ms Anat Bar- Gera as member of the Board of Directors and her appointment was approved by the ECB on 27 October Messrs Wilbur L. Ross Jr. and Marios Kalochoritis resigned on 1 March 2017 and on 27 June 2017 respectively. On 23 January 2018, the Board of Directors decided to appoint Ms Paula Hadjisotiriou and Ms Maria Philippou as members of the Board of Directors. Their appointment is subject to approval by the ECB. In accordance with the Articles of Association at each annual general meeting of the Company every Director who has been in office at the completion of the most recent annual general meeting since they were last appointed or reappointed, shall retire from office and offer themselves for re-election if they wish. The remuneration of the Board of Directors is disclosed in Note 49 of the Consolidated Financial Statements. 22
25 BANK OF CYPRUS HOLDINGS PUBLIC LIMITED COMPANY Annual Financial Report 2017 Directors Report Directors and Secretary s interests The interest in the share capital of the Company held by each member of the Board of Directors and Company Secretary is presented in the table below: Non-executive directors Ordinary shares or Depositary Interests representing Company ordinary shares of 0.10 each at 31 December 2017 Company Ordinary shares or Depositary Interests representing Company ordinary shares of 0.10 each at 1 January 2017 BOC PCL Ordinary shares of 0.10 each at 1 January 2017 or at the date of appointment Prof. Dr. Josef Ackermann 150,000-3,000,000 Maksim Goldman 7, ,821 Arne Berggren 25, ,000 Michalis Spanos 61,430-1,228,595 Ioannis Zographakis 3,012-60,240 Executive directors Dr. Christodoulos Patsalides ,390 Company Secretary Katia Santis , ,936,112 Apart from the interests set out above, the Board of Directors and Secretary had no other interests in the shares of the Company or its subsidiaries at 31 December Environmental and employee matters The Group s policy on environmental and employee matters is available at (Responsibility, CSR Reports). Statement of Directors Responsibilities The Directors are responsible for preparing the Annual Financial Report and the financial statements in accordance with International Financial Reporting Standards (IFRS) adopted by the EU and with those parts of the Companies Act 2014 applicable to companies reporting under IFRSs and, in respect of the consolidated financial statements, Article 4 of the International Accounting Standards (IAS) Regulation. Under Irish law the Directors shall not approve the financial statements unless they are satisfied that they give a true and fair view of the Group s and Company s assets, liabilities and financial position as at the end of the financial year and of the profit or loss of the Group and the Company for the financial year. In preparing these financial statements, the Directors are required to: select suitable accounting policies and apply them consistently make judgements and estimates that are reasonable and prudent state whether the financial statements have been prepared in accordance with IFRSs as adopted by the EU and ensure that they contain the additional information required by the Companies Act 2014; and prepare the financial statements on a going concern basis unless it is inappropriate to presume that the Company will continue in business. 23

26
27 Consolidated Financial Statements 25
28 Consolidated Financial Statements - Contents For the year ended 31 December 2017 Contents Page Page Consolidated Income Statement 27 Consolidated Statement of Comprehensive Income 28 Consolidated Balance Sheet 29 Consolidated Statement of Changes in Equity 30 Consolidated Statement of Cash Flows Corporate information Summary of significant accounting policies Group reorganisation Basis of preparation Accounting policies and changes in accounting policies and disclosures Standards and interpretations that are issued but not yet effective Basis of consolidation Business combinations Investments in associates and joint ventures Foreign currency translation Segmental reporting Turnover Revenue recognition Retirement benefits Tax Financial instruments Derecognition of financial assets and financial liabilities Impairment of financial assets Hedge accounting Offsetting financial instruments Cash and cash equivalents Insurance business Repurchase and reverse repurchase agreements Finance leases The Group as lessor Operating leases Property and equipment Investment properties Stock of property Non-current assets held for sale and discontinued operations Intangible assets Share capital Treasury shares Provisions Financial guarantees Comparative information Going concern Operating environment Significant judgements, estimates and assumptions Segmental analysis Interest income Interest expense Fee and commission income and expense Net foreign exchange gains Net gains on financial instrument transactions and disposal/dissolution of subsidiaries Insurance income net of claims and commissions Other income Staff costs Other operating expenses Provisions for impairment of financial and nonfinancial instruments Income tax Earnings per share Cash, balances with central banks and loans and advances to banks Investments Derivative financial instruments Fair value measurement Loans and advances to customers Life insurance business assets attributable to policyholders Property and equipment Intangible assets Stock of property Prepayments, accrued income and other assets Non-current assets held for sale Funding from central banks Customer deposits Insurance liabilities Subordinated loan stock Accruals, deferred income and other liabilities Share capital Dividends Accumulated losses Fiduciary transactions Contingent liabilities and commitments Net cash flow from operating activities Cash and cash equivalents Operating leases The Group as lessee Analysis of assets and liabilities by expected maturity Risk management Credit risk Risk management Market risk Risk management Liquidity risk and funding Risk management Insurance risk Capital management Related party transactions Group companies Acquisitions and disposals Investments in associates and joint ventures Country by country reporting
29 Consolidated Income Statement for the year ended 31 December 2017 Notes Turnover ,165,177 1,234,098 Interest income 7 811, ,298 Interest expense 8 (228,291) (204,116) Net interest income 582, ,182 Fee and commission income 9 190, ,865 Fee and commission expense 9 (10,179) (10,207) Net foreign exchange gains 10 45,409 43,471 Net gains on financial instrument transactions and disposal/dissolution of subsidiaries 11 2,964 63,373 Insurance income net of claims and commissions 12 50,401 44,432 Net (losses)/gains from revaluation and disposal of investment properties (4,061) 4,974 Net gains on disposal of stock of property 30,447 1,361 Other income 13 19,052 14, ,350 1,025,356 Staff costs 14 (228,212) (287,172) Special levy on deposits on credit institutions in Cyprus 15 (22,846) (19,968) Other operating expenses 15 (297,979) (222,987) 358, ,229 Gain on derecognition of loans and advances to customers and changes in expected cash flows 173,443 63,315 Provisions for impairment of loans and advances to customers and other customer credit losses 16 (952,926) (433,609) Impairment of other financial instruments 16 (6,459) (11,293) Impairment of non-financial instruments 16 (58,972) (36,220) (Loss)/profit before share of profit from associates and joint ventures (486,601) 77,422 Share of profit from associates and joint ventures 52 8,957 8,194 (Loss)/profit before tax (477,644) 85,616 Income tax 17 (76,681) (18,385) (Loss)/profit after tax for the year (554,325) 67,231 Attributable to: Owners of the Company/BOC PCL (551,852) 63,656 Non-controlling interests (2,473) 3,575 (Loss)/profit for the year (554,325) 67,231 Basic and diluted (losses)/earnings per share ( cent) attributable to the owners of the Company/BOC PCL 18 (123.7)
30 Consolidated Statement of Comprehensive Income for the year ended 31 December 2017 Notes (Loss)/profit for the year (554,325) 67,231 Other comprehensive income (OCI) OCI to be reclassified in the consolidated income statement in subsequent periods Foreign currency translation reserve Profit/(loss) on translation of net investments in foreign branches and subsidiaries (Loss)/profit on hedging of net investments in foreign branches and subsidiaries Transfer to the consolidated income statement on disposal/dissolution of foreign operations Available-for-sale investments 742 (43,763) 21 (1,166) 53,408 (104) (3,958) (528) 5,687 Net gains from fair value changes before tax 46, Share of net gains from fair value changes of associates 1,709 1,677 Transfer to the consolidated income statement on impairment (37) 839 Transfer to the consolidated income statement on sale (606) (47,960) OCI not to be reclassified in the consolidated income statement in subsequent periods Property revaluation 47,572 (44,602) 47,044 (38,915) Fair value gain before tax 25 9,319 - Share of fair value gain of associates 11 - Tax 17 (522) 219 Actuarial gains/(losses) on the defined benefit plans 8, Remeasurement gains/(losses) on defined benefit plans 14 10,819 (14,255) 19,627 (14,036) Other comprehensive income/(loss) after tax 66,671 (52,951) Total comprehensive (loss)/income for the year (487,654) 14,280 Attributable to: Owners of the Company/BOC PCL (485,595) 15,321 Non-controlling interests (2,059) (1,041) Total comprehensive (loss)/income for the year (487,654) 14,280 28

31
32 Consolidated Statement of Changes in Equity for the year ended 31 December 2017 Attributable to the owners of the Company Share capital (Note 35) Share premium (Note 35) Capital reduction reserve (Note 35) Treasury shares (Note 35) Accumulated losses (Note 37) Property revaluation reserve Revaluation reserve of availablefor-sale investments Other reserves Life insurance inforce business reserve Foreign currency translation reserve Total Noncontrolling interests Total equity January , ,618 1,952,486 (25,333) (544,930) 90,936 7,139 6, ,251 36,626 3,071,146 34,959 3,106,105 Loss for the year (551,852) (551,852) (2,473) (554,325) Other comprehensive income/(loss) after tax for the year Total comprehensive (loss)/income for the year Increase in value of inforce life insurance business Tax on increase in value of in-force life insurance business Transfer of realised profits on disposal of properties Cancellation of shares due to reorganisation (Note 2.1) Change of parent company to Bank of Cyprus Holdings Public Limited Company and issue of new shares (Note 2.1) Disposals of treasury shares Dividends paid to noncontrolling interests ,819 8,620 47, (528) 66, , (541,033) 8,620 47, (528) (485,595) (2,059) (487,654) (2,743) , (343) ,678 (6,678) (892,294) , (870,831) - (870,831) 44,620 2,241,740 (1,952,486) (21,463) 558, , , ,870 (3,863) (1,750) (1,750) 31 December ,620 2,794,358 - (21,463) (527,128) 92,878 54,485 6, ,651 36,098 2,585,558 31,150 2,616,708 30
33 Consolidated Statement of Changes in Equity for the year ended 31 December 2017 Share capital (Note 35) Share premium (Note 35) Capital reduction reserve (Note 35) Treasury shares (Note 35) Accumulated losses (Note 37) Attributable to the owners of BOC PCL Property revaluation reserve Revaluation reserve of available-forsale investments Other reserves Life insurance in-force business reserve Foreign currency translation reserve Reserve of disposal group and assets held for sale Total Noncontrolling interests January , ,618 1,952,486 (41,301) (601,152) 99,218 47,125 6,059 99,050 30,939 17,619 3,054,955 22,376 3,077,331 Profit for the year , ,656 3,575 67,231 Other comprehensive (loss)/income after tax for the year Total comprehensive income/(loss) for the year Increase in value of inforce life insurance business Tax on increase in value of in-force life insurance business Transfer of realised profits on disposal of properties Disposal of subsidiary (Note ) Acquisition of subsidiary (Note ) Disposals of treasury shares Change in presentation of life insurance subsidiary s treasury shares Increase in shareholding of subsidiary Dividends paid to noncontrolling interests (14,255) 219 (39,986) - - 5,687 - (48,335) (4,616) (52,951) , (39,986) - - 5,687-15,321 (1,041) 14, (4,680) , (479) ,501 (8,501) , (17,619) ,753 18, ,301 (40,560) (25,333) 25, (129) (5,000) (5,000) 31 December , ,618 1,952,486 (25,333) (544,930) 90,936 7,139 6, ,251 36,626-3,071,146 34,959 3,106,105 Total equity 31
34 Consolidated Statement of Cash Flows for the year ended 31 December 2017 Notes Net cash flow from operating activities 40 1,993,266 3,162,625 Cash flows from investing activities Purchases of debt securities and equity securities (402,977) (213,032) Proceeds on disposal/redemption of investments: - debt securities 91, ,640 - equity securities 1,549 50,143 Interest received from debt securities 19,546 28,084 Dividend income from equity securities Dividend income from associates 6,621 4,939 Proceeds on disposal of subsidiaries 1,580 26,500 Purchases of property and equipment 25 (10,299) (12,096) Purchases of intangible assets 26 (25,723) (16,363) Proceeds on disposals of property and equipment and intangible assets Proceeds on disposals of investment properties and investment properties held for sale ,568 14,076 Net cash flow (used in)/from investing activities (302,623) 349,444 Cash flows from financing activities Net proceeds/(repayments) of funding from central banks 79,986 (3,602,836) Net proceeds from the issue of subordinated loan stock 280,983 - Redemption of debt securities in issue - (712) Interest on funding from central banks (28) (29,656) Proceeds from disposal of treasury shares Dividend paid by subsidiaries to non-controlling interests (1,750) (5,000) Net cash flow from/(used in) financing activities 359,198 (3,637,463) Net increase/(decrease) in cash and cash equivalents for the year Cash and cash equivalents 2,049,841 (125,394) 1 January 2,231,028 2,347,408 Foreign exchange adjustments (638) 9,014 Net increase/(decrease) in cash and cash equivalents for the year 2,049,841 (125,394) 31 December 41 4,280,231 2,231,028 Details on non-cash transactions are presented in Note
35 1. Corporate information Bank of Cyprus Holdings Public Limited Company (the Company) was incorporated in Ireland on 11 July 2016, as a public limited company under company number in accordance with the provisions of the Companies Act 2014 of Ireland (Companies Act 2014). The Company s name on incorporation was Aion Cyprus Public Limited Company and on 10 August 2016 the Company changed its name to Bank of Cyprus Holdings Public Limited Company. Its registered office for the period from 11 July 2016 to 19 March 2017 was at Earlsfort Centre, Earlsfort Terrace, Dublin 2, Ireland. Since 20 March 2017 the Company s registered office is 10 Earlsfort Terrace, Dublin 2, D02 T380, Ireland. The Company is the holding company of the Bank of Cyprus Public Company Limited (BOC PCL). The Bank of Cyprus Holdings Group (the Group) comprises the Company, its subsidiary BOC PCL and the subsidiaries of BOC PCL. The Company was incorporated with the intention of becoming the holding company of the Group for the purposes of the Group s listing on the London Stock Exchange (LSE). The Company is tax resident in Cyprus. The principal activities of BOC PCL and its subsidiary companies (the BOC group) involve the provision of banking, financial services, insurance services and management and disposal of property predominately acquired in exchange of debt. On 13 December 2016, at an Extraordinary General Meeting of the shareholders of BOC PCL a scheme of arrangement between the Company, BOC PCL and the shareholders of BOC PCL has been approved. The scheme of arrangement which became effective on 18 January 2017 introduces the Company as the new holding company of the Group which is also the sole shareholder of BOC PCL. On 19 January 2017 the shares of the Company were admitted to listing and trading on the LSE and the Cyprus Stock Exchange (CSE). The Consolidated Financial Statements are available at the registered office of Bank of Cyprus Holdings Public Limited Company (at 10 Earlsfort Terrace, Dublin 2, D02 T380, Ireland) and on the Group s website (Investor Relations). Consolidated Financial Statements The Consolidated Financial Statements of the Company for the year ended 31 December 2017 (the Consolidated Financial Statements) were authorised for issue by a resolution of the Board of Directors on 26 March The Consolidated Financial Statements have been prepared in both, the English and the Greek language. In case of a difference or inconsistency between the two, the English version prevails. 2. Summary of significant accounting policies 2.1 Group reorganisation As described in Note 1 above, on 18 January 2017 the Company became the sole shareholder of BOC PCL. This reorganisation was treated as a reorganisation of an existing entity that has not changed the substance of the reporting entity. The owners of BOC PCL before the reorganisation have the same absolute and relative interests in the net assets of the Group immediately before and after the reorganisation, since the assets and liabilities of the Group and the BOC group are the same immediately before and after the reorganisation. Hence, the Group is considered as a continuation of BOC group. As this transaction did not result in any change of economic substance it also did not have any effect on the total equity of the Group. The Group s Consolidated Financial Statements reflect the difference in the amounts of share capital, share premium and capital reduction reserves as an adjustment in equity. 33
36 2. Summary of significant accounting policies (continued) 2.2 Basis of preparation The Consolidated Financial Statements have been prepared on a historical cost basis, except for properties held for own use and investment properties, available-for-sale investments, derivative financial instruments and financial assets at fair value through profit or loss, that have been measured at fair value, non-current assets held for sale measured at fair value less costs to sell and stock of property measured at net realisable value where this is lower than cost. The carrying values of recognised assets and liabilities that are hedged items in fair value hedges, and otherwise carried at cost, are adjusted to record changes in fair value attributable to the risks that are being hedged. Presentation of Consolidated Financial Statements The Consolidated Financial Statements are presented in Euro ( ) and all amounts are rounded to the nearest thousand, except where otherwise indicated. A comma is used to separate thousands and a dot is used to separate decimals. The Group presents its balance sheet broadly in order of liquidity. An analysis regarding expected recovery or settlement of financial assets and liabilities within twelve months after the balance sheet date and more than twelve months after the balance sheet date is presented in Note 43. Statement of compliance The Consolidated Financial Statements have been prepared in accordance with the International Financial Reporting Standards (IFRSs) as adopted by the European Union (EU) and with those parts of the Companies Act 2014 applicable to companies reporting under IFRSs. 2.3 Accounting policies and changes in accounting policies and disclosures The Consolidated Financial Statements contain a summary of the accounting policies adopted in the preparation of the Consolidated Financial Statements in Notes 2.5 to As described in Note 2.2, the accounting policies adopted are consistent with those of the previous financial year, except for the adoption of new and amended standards and interpretations as explained in Note below New and amended standards and interpretations The Group applied for the first time certain standards and amendments, which are effective for annual periods beginning on or after 1 January The Group has not early adopted any other standard, interpretation or amendment that has been issued but is not yet effective. Although these new standards and amendments were applied for the first time in 2017, they did not have a material impact on the Consolidated Financial Statements of the Group. The nature of each new standard or amendment is described below. Amendments to IAS 12 Income Taxes: Recognition of deferred tax assets for unrealised losses The objective of the amendments is to clarify the requirements of deferred tax assets for unrealised losses in order to address diversity in practice in the application of IAS 12 Income Taxes. The specific issues where diversity in practice existed relate to the existence of a deductible temporary difference upon a decrease in fair value, to recovering an asset for more than its carrying amount, to probable future taxable profit and to combined versus separate assessment. This amendment did not have an impact on the Consolidated Financial Statements. Amendments to IAS 7: Disclosure initiative The objective of the amendments is to provide disclosures that enable users of financial statements to evaluate changes in liabilities arising from financing activities, including both changes arising from cash flows and noncash changes. The amendments specify that one way to fulfil the disclosure requirement is by providing a tabular reconciliation between the opening and closing balances in balance sheet for liabilities arising from financing activities, including changes from financing cash flows, changes arising from obtaining or losing control of subsidiaries or other businesses, the effect of changes in foreign exchange rates, changes in fair values and other changes. The Group has provided the information for the current year in Note
37 2. Summary of significant accounting policies (continued) 2.3 Accounting policies and changes in accounting policies and disclosures (continued) New and amended standards and interpretations (continued) Annual Improvements IFRSs Cycle The International Accounting Standards Board (IASB) has issued the Annual Improvements to IFRSs Cycle which is a collection of amendments to IFRSs. These did not have an impact on the Consolidated Financial Statements. These include: IFRS 12 Disclosure of interests in other entities: The amendments clarify that the disclosure requirements in IFRS 12, other than those of summarised financial information for subsidiaries, joint ventures and associates, apply to an entity s interest in a subsidiary, a joint venture or an associate that is classified as held for sale, as held for distribution, or as discontinued operations in accordance with IFRS Standards and interpretations that are issued but not yet effective Standards and interpretations issued by the IASB and adopted by the EU IFRS 9 Financial Instruments IFRS 9 Financial Instruments (IFRS 9) replaces IAS 39 Financial Instruments: Recognition and Measurement and introduces new requirements for classification and measurement, impairment, and hedge accounting. IFRS 9 is effective for annual periods beginning on or after 1 January 2018 with early adoption permitted. The Group will apply IFRS 9 on 1 January The Group IFRS 9 implementation has been largely completed by 1 January The IFRS 9 project had a formalised governance process whereby the Group Chief Risk Officer (GCRO) was the project owner. The main divisions involved in the project at the highest level are the Risk Management, Finance, Information Technology (IT) and Operations. A Steering Committee was set up to monitor the project, chaired by the Group Chief Executive Officer (CEO) and comprising of members of the Executive Management team, the Chief Risk Officer (CRO), the Deputy CEO & Chief Operating Officer, the Finance Director and other representatives from Risk Management and Finance, while the Group Internal Audit Director participated as an observer. The Steering Committee was monitoring the progress of the project and was reviewing the results, key assumptions policies and methodologies and reported to the Risk and Audit Committees of the Group, which had an oversight role and provided relevant approvals. The project covered all aspects of IFRS 9. A significant part was related to the development of methodologies for the calculation of impairment of customer loans and advances based on expected credit losses (ECL), in line with the requirements of IFRS 9. This change requires significant judgement in assessing available information for the ECL. Impact of IFRS 9 The Group s IFRS 9 preliminary impact on transition including the insurance subsidiaries of the Group, which is subject to change due to final parameter calibrations, is assessed to be a decrease of shareholders equity of c. 300 million and is primarily driven by credit impairment provisions. The new accounting processes, internal controls, governance framework, judgements and estimation techniques will continue to be refined and undergo validation. Transition The classification, measurement and impairment requirements are applied retrospectively by adjusting the balance sheet at the date of initial application, and as permitted by IFRS 9 the Group will not restate comparative information for prior periods. The impact on the implementation date, 1 January 2018, is therefore recognised through equity rather than the consolidated income statement. No deferred tax asset will be recognised on IFRS 9 impact upon transition. 35
38 2. Summary of significant accounting policies (continued) 2.4 Standards and interpretations that are issued but not yet effective (continued) Standards and interpretations issued by the IASB and adopted by the EU (continued) IFRS 9 Financial Instruments (continued) Regulatory transitional arrangements The Group has elected to apply the EU transitional arrangements for regulatory capital purposes (EU Regulation 2017/2395) where the impact on the impairment amount from the initial application of IFRS 9 on the capital ratios will be phased-in gradually. From the date of initial application of IFRS 9 and for five years the amount of the difference in provisions that will result from the transition to the new IFRS 9 in relation to the provisions that have been recognised at 31 December 2017 in accordance with IAS 39 will be added to the capital ratios. The amount that will be added each year will decrease based on a weighting factor until the impact of IFRS 9 is fully absorbed at the end of the five-years. For the year 2018 the impact on the capital ratios will be 5% of the impact on the difference in the impairment amounts. Classification and measurement The classification and measurement of financial assets will depend on how these are managed as part of the Business Models the Group operates under and their contractual cash flow characteristics (whether the cash flows represent solely payments of principle and interest (SPPI)). These factors determine whether the financial assets are measured at amortised cost, fair value through other comprehensive income (FVOCI) or fair value through profit or loss (FVPL). The combined effect of the application of the business model and the contractual cash flow characteristics tests resulted in some differences in the population of financial assets measured at amortised cost under IAS 39 as described below. Business models are determined on the date of initial application based on fact and circumstances that existed on 1 January The Group assesses the business model at a portfolio level. The portfolio level is determined at the aggregation level that reflects how the Group manages its financial assets. Information that is considered in determining the business model includes (i) policies and objectives for the relevant portfolio, (ii) how the performance and risks of the portfolio are managed, evaluated and reported to management and (iii) the frequency, volume and timing of sales in prior periods and sales expectation for future periods, including the reasons for such sales. Where the business model is to hold financial assets to collect contractual cash flows or to collect contractual cash flows and sell, the Group assesses whether individual financial assets cash flows represent solely payments of principal and interest (SPPI test). For the purposes of this assessment, principal is defined as the fair value of the financial asset on initial recognition. Interest is defined as consideration for the time value of money, for the credit risk associated with the principal amount outstanding during a particular period of time and for other basic lending risks and costs (e.g. liquidity risk and administrative costs), as well as a profit margin. In assessing whether contractual cash flows are SPPI, the Group considers the terms that could change the contractual cash flows so that it would not meet the condition for SPPI, including: (i) contingent and leverage features, (ii) interest rates which are beyond the control of the Group or variable interest rate consideration, (iii) features that could modify the time value of money, (iv) prepayment and extension options, (v) non-recourse arrangements and (vi) convertible features. Financial assets are measured at amortised cost if they are held within a business model whose objective is to hold financial assets in order to collect contractual cash flows and their contractual cash flows represent SPPI. Financial assets are measured at fair value through other comprehensive income if they are held within a business model whose objective is achieved by both collecting contractual cash flows and selling financial assets and their contractual cash flows represent SPPI. Financial assets managed on a fair value basis and those that are held for trading are held at fair value through profit and loss. In addition, where the contractual terms of a financial asset introduce exposure to risk or volatility that are inconsistent with a basic lending arrangement, the related financial asset will be measured at FVPL. 36
39 2. Summary of significant accounting policies (continued) 2.4 Standards and interpretations that are issued but not yet effective (continued) Standards and interpretations issued by the IASB and adopted by the EU (continued) IFRS 9 Financial Instruments (continued) Classification and measurement (continued) Equity investments are measured at fair value through profit and loss. On transition to IFRS 9 and on initial recognition thereafter, there is an option to make an irrevocable election for non traded equity investments to be measured at fair value through other comprehensive income, in which case dividends are recognised in the consolidated income statement, and subsequent fair value gains or losses are recorded in other comprehensive income and are not reclassified to profit or loss upon derecognition. Classification and measurement impact assessment Following the Group IFRS 9 implementation project, with respect to classification and measurement of financial assets and financial liabilities on 1 January 2018, the impact is as follows: Placements with central banks, bank placements and customer loans and advances that were classified as loans and receivables and measured at amortised cost under IAS 39 will continue to be measured at amortised cost under IFRS 9 with the exception of certain customer loans and advances with carrying value of c. 390 million as at 31 December 2017 which failed the SPPI tests and as a result have been classified at FVPL and will be measured at fair value. The Group has made an irrevocable election to classify the majority equity investments that were previously classified as available-for-sale under IAS 39, in FVOCI on transition to IFRS 9. Debt and other non-equity securities that were classified as available-for-sale under IAS 39 will be measured at FVOCI under IFRS 9 with the exception of certain instruments that failed the SPPI test and will be classified as FVPL. Debt securities that were classified as loans and receivables under IAS 39 will be measured at amortised cost under IFRS 9. The equity investments that were held for trading e.g. acquired principally for the purpose of selling or repurchasing in the near term will be measured at FVPL under IFRS 9. Certain equity instruments which were classified at FVPL will be classified at FVOCI under IFRS 9 as they were not held for trading on 1 January Derivatives (assets and liabilities) will continue to be measured at FVPL under IFRS 9. All financial liabilities, other than derivatives, will be measured at amortised cost. The Group has estimated that on adoption of IFRS 9, the impact following the changes on the classification and measurement of financial assets and financial liabilities is an increase of shareholders equity of approximately 1 million. Impairment IFRS 9 moves away from the IAS 39 incurred loss model to a forward looking ECL model. This change requires more judgement, estimates and assumptions in considering information for current and future provisioning. The ECL model will also result in earlier recognition of credit losses and thus a higher provision charge because it includes not only credit losses already incurred, but also losses that are expected in the future. The impairment requirements apply to financial assets that are not measured at FVPL. Specifically it applies to financial assets measured at amortised cost and FVOCI, lease receivables, certain loan commitments and financial guarantee contracts. Under IFRS 9, no impairment loss is recognised on equity investments. At initial recognition, allowance (or provision in the case of commitments and guarantees) is required for ECL resulting from default events that are possible within the next 12 months (12 month ECL), unless assets are deemed as purchased or originated credit impaired (POCI). Subsequently, in the event of a significant increase in credit risk since initial recognition, a provision is required resulting from all possible default events over the expected life of the financial instrument (lifetime ECL). Financial assets which have not had a significant increase in credit risk since initial recognition and where 12- month ECL is recognised are considered to be Stage 1. Financial assets that are considered to have experienced a significant increase in credit risk since initial recognition and where lifetime losses are recognised are considered to be Stage 2. Financial assets for which there is objective evidence of impairment are considered to be in default or creditimpaired and are considered to be Stage 3. 37
40 2. Summary of significant accounting policies (continued) 2.4 Standards and interpretations that are issued but not yet effective (continued) Standards and interpretations issued by the IASB and adopted by the EU (continued) IFRS 9 Financial Instruments (continued) Impairment (continued) Purchased or originated financial assets that are credit-impaired on initial recognition include loans purchased or originated financial assets at a deep discount that reflect incurred credit losses. The reconciliation of the net carrying value on customer loans and advances measured at amortised cost under IAS 39 with those measured at amortised cost under IFRS 9 is disclosed below: 000 Carrying value IAS 39 at 31 December ,602,454 Transfer to FVPL carrying amount (388,972) IFRS 9 ECL remeasurement (300,266) Carrying value under IFRS 9 at 1 January ,913,216 The table below discloses the breakdown of the carrying value of customer loans and advances at amortised cost under by IFRS 9 by staging as at 1 January Carrying Value under IFRS Stage 1 5,089,673 Stage 2 4,350,173 Stage 3 3,883,705 POCI 589,665 Total 13,913,216 Key impairment concepts The impairment introduces a number of key concepts as described below. Significant increase in credit risk IFRS 9 requires that, in the event of a significant increase in credit risk, since initial recognition, the calculation basis of the loss allowance would change from 12 month ECLs to lifetime ECLs. The assessment of whether credit risk has increased significantly since initial recognition is performed at each reporting period by considering the change in the risk of default occurring over the remaining life of the financial instrument since initial recognition. The Group s assessment usually combines a qualitative and a quantitative assessment of the loan, with the quantitative element being the primary indicator of significant increase in credit risk. Past, current, as well as forward-looking reasonable and supportable information are considered in the assessment. The Group uses the lifetime probability of default (PDs) as the primary quantitative metric in order to assess transition from Stage 1 to Stage 2 for all portfolios by considering whether the lifetime PD at the reporting date exceeds the lifetime PD at origination by an established relative threshold. For each portfolio there are specific qualitative criteria that indicate if an exposure has experienced a significant increase in its credit risk, independent of any changes in the PD. 38
41 2. Summary of significant accounting policies (continued) 2.4 Standards and interpretations that are issued but not yet effective (continued) Standards and interpretations issued by the IASB and adopted by the EU (continued) IFRS 9 Financial Instruments (continued) Impairment (continued) Significant increase in credit risk (continued) For retail exposures qualitative criteria indicating significant increase in credit risk, are considered on a loan-byloan basis and consider among others the following: expectations of forbearance and payment holidays, covenant breaches, credit and scorecards, events such as death, unemployment, bankruptcy, or divorce. For corporate exposures qualitative factors in addition to the ones incorporated in the PD calculation, are considered on a loan-by-loan basis and consider among others the following: significant change in collateral value or guarantee or financial support provided by shareholders/directors, significant adverse changes in business, financial and/or economic conditions in which the borrower operates, expected change in loan documentation. The Group also considers, as a backstop criterion, that a significant increase in the credit risk occurs when contractual payments are more than 30 days past due and loans that meet this condition are classified in Stage 2. Low credit risk simplification is adopted for debt security instruments with external credit ratings that are rated as investment grade. The assessment of low credit risk is based on both the external credit rating and the internal scoring (which considers latest available information on the instrument and issuer). The combination of the two will provide an adjusted credit rating. An adjusted rating which remains investment grade is considered as having low credit risk. For debt securities which are below investment grade, the low credit risk exemption does not apply and therefore an assessment of significant credit deterioration takes place, by comparing their credit rating at origination with the credit rating on the reporting date. Financial assets (other than POCI) can be transferred between stages depending on their relative change in credit risk since initial recognition. Financial assets are transferred out of Stage 2, if their credit risk is no longer considered to be significantly increased since initial recognition based on the assessments described above. Credit impaired and definition of default Exposures that meet the non performing exposure (NPE) definition as per EBA standards are considered to be in default and hence credit-impaired and are considered to be in Stage 3 and have ECL calculated on a lifetime basis. Such loans are also considered to be in default for credit risk management purposes. According to the European Banking Authority (EBA) standards and European Central Bank s (ECB) Guidance to Banks on NPE (which was published in March 2017), NPEs are defined as those exposures that satisfy one of the following conditions: (i) The borrower is assessed as unlikely to pay its credit obligations in full without the realisation of the collateral, regardless of the existence of any past due amount or of the number of days past due. (ii) Defaulted or impaired exposures as per the approach provided in the Capital Requirement Regulation (CRR), which would also trigger a default under specific credit adjustment, distress restructuring and obligor bankruptcy. (iii) Material exposures as set by the Central Bank of Cyprus (CBC), which are more than 90 days past due. (iv) (v) Performing forborne exposures under probation for which additional forbearance measures are extended. Performing forborne exposures under probation that present more than 30 days past due within the probation period. 39
42 2. Summary of significant accounting policies (continued) 2.4 Standards and interpretations that are issued but not yet effective (continued) Standards and interpretations issued by the IASB and adopted by the EU (continued) IFRS 9 Financial Instruments (continued) Impairment (continued) Credit impaired and definition of default (continued) When the problematic exposures of a customer that fulfil the NPE criteria set out above are greater than 20% of the gross carrying amount of all on balance sheet exposures of that customer, then the total customer exposure is classified as non-performing; otherwise only the problematic part of the exposure is classified as non-performing. Exposures cease to be considered as NPEs and in such case are transferred out of Stage 3, only when all of the following conditions are met: (i) The extension of forbearance measures does not lead to the recognition of impairment or default. (ii) One year has passed since the forbearance measures were extended. (iii) Following the forbearance measures and according to the post-forbearance conditions, there is no past due amount or concerns regarding the full repayment of the exposure. (iv) No Unlikely-to-Pay criteria exist for the debtor. (v) The debtor has made post-forbearance payments of a not-insignificant amount of capital (different capital thresholds exist according to the facility type). Forward-looking inputs IFRS 9 requires the use of reasonable and supportable information, including forward-looking information, in the calculation of ECLs. ECLs are the unbiased probability-weighted credit losses determined by evaluating a range of possible outcomes and considering future economic conditions. ECLs are calculated on the basis of weighted average of three macroeconomic scenarios, baseline, downside and upside. Scenarios impact the collection of contractual cash flows, taking into account the time-value of money, all available information relevant to past events, and current conditions and projections of macroeconomic factors deemed relevant to the estimation of this amount (e.g. Gross Domestic Product (GDP) growth, property prices, unemployment rate, consumer inflation). This process involves consideration of a variety of external actual and forecast information (International Monetary Fund (IMF), European Commission, Economist Intelligence Unit (EIU), Moody s Analytics) adjusted by economic expert judgement to derive the base scenario, which represents the most-likely outcome. The other scenarios represent a more pessimistic outcome and a more optimistic outcome. Predicted relationships between the key indicators and default and loss rates on the portfolios of financial assets have been developed based on analysis of historical data over the past 5 years. Inputs into measurement of ECL The Group calculates ECL using the following three components: exposure at default (EAD), loss given default (LGD) and probability of default (PD). These parameters are derived from internally developed statistical models based on historical data that are adjusted if deemed necessary, following the internal approval processes of the Group, in order to reflect forward looking information. EAD represents the expected exposure in the event of a default. EAD methodology is differentiated in the following categories: revolving and non-revolving exposures. In case of revolving exposures all future EAD changes are recognised by a credit conversion factor parameter. For non-revolving exposures the term is based on the contractual term of the exposure and both on-balance sheet and off-balance sheet exposures are amortised in accordance with the principal contractual payment schedule of each exposure. In regards to the credit-impaired exposures, the EAD is equal to the on balance sheet amount as at the reporting date. LGD represents the likely loss if there is a default and takes into account parameters such as historical loss and/or recovery rates as well as the collateral value at the time it is expected to be realised and the time value of money. 40
43 2. Summary of significant accounting policies (continued) 2.4 Standards and interpretations that are issued but not yet effective (continued) Standards and interpretations issued by the IASB and adopted by the EU (continued) IFRS 9 Financial Instruments (continued) Impairment (continued) Inputs into measurement of ECL (continued) The structure of the LGD model considers the following: Curing: the probability of cure model was derived based on historical observations. Non-curing is further broken down into: (i) Collateral realisation: the collateralised part of EAD of a defaulted account could be recovered through collateral realisation. The process was considered to be either voluntary (amicable sale, debt for asset swap) or forced sale or through foreclosure and receivership. (ii) Cash recovery: calculated based on observed cash flows. PD is calculated based on statistical rating models calculated per segment level and taking into consideration each individual s exposure rating and forward looking information based on macroeconomic inputs. ECL is discounted at the effective interest rate at initial recognition or an approximation thereof. Loan modifications and derecognition The derecognition requirements of IAS 39 were carried forward into the IFRS 9. The contractual terms of a loan may be modified following various reasons, either due to commercial renegotiations or due to distressed restructurings with a view to maximise recovery. In the event that the terms and conditions of a financial asset are renegotiated or otherwise modified, the Group considers whether the modification results in derecognition of the existing financial asset and the recognition of a new financial asset. Modifications to, and exchanges of, financial liabilities are treated as extinguishments and derecognised, when the revised terms are substantially different to the original term. A derecognition of a financial asset (or part of a financial asset) and a recognition of a new financial asset would occur where there has been a substantial modification on the revised terms to the original cash flows. Judgement is required to assess whether a change in the contractual terms is substantial enough to lead to derecognition. The Group considers a series of factors of both qualitative and quantitative nature when making such judgements on a modification in the contractual cash flows. When a substantial modification in the original financial asset is deemed to exist, then the original financial asset is derecognised and a new financial asset is recognised. In the case of a new loan an assessment is performed on whether it should be classified as Stage 1 or POCI. Write off The Group reduces the gross carrying amount of a financial asset when there is no reasonable expectation of recovering it. In such case, financial assets are written off either partially or in full. Write off refers to both contractual and non-contractual write offs. Interest revenue recognition For loans considered to be Stage 1 and 2 and are not POCI, interest revenue is calculated on the gross carrying amount using the Original Effective Interest Rate (OEIR). When a financial asset becomes credit-impaired and is, therefore, regarded as Stage 3, interest income is calculated by applying the effective interest rate to the net amortised cost of the financial asset. If the financial asset cures and is no longer credit-impaired, the Group reverts to calculating interest income on the gross carrying amount. Interest revenue on POCI financial assets is recognised using the Credit Adjusted Effective Interest Rate (CAEIR) calculated at initial recognition. The CAEIR is applied on the amortised cost of the financial asset, being the gross carrying amount of the financial asset less any loss allowance. 41
44 2. Summary of significant accounting policies (continued) 2.4 Standards and interpretations that are issued but not yet effective (continued) Standards and interpretations issued by the IASB and adopted by the EU (continued) IFRS 9 Financial Instruments (continued) Hedge accounting The Group elected, as a policy choice permitted by IFRS 9, to continue to apply hedge accounting in accordance with IAS 39. The Group will implement the amended IFRS 7 hedge disclosure requirements. IFRS 15 Revenue from contracts with customers IFRS 15 was issued in May 2014 and establishes a five-step model that will apply to revenue earned from a contract with a customer (with limited exceptions), regardless of the type of revenue transaction or the industry. The standard s requirements will also apply to the recognition and measurement of gains and losses on the sale of some non-financial assets that are not an output of the entity s ordinary activities (e.g., sales of property, plant and equipment or intangibles). Extensive disclosures will be required, including disaggregation of total revenue; information about performance obligations; changes in contract asset and liability account balances between periods and key judgements and estimates. Either a full retrospective application or a modified retrospective application is required for annual periods beginning on or after 1 January The Group will apply IFRS 15 on 1 January The Group has performed an assessment and does not expect this standard to have a material impact on its results and financial position. IFRS 15 Revenue from contracts with customers (clarifications) The objective of the clarifications is to clarify the IASB s intentions when developing the requirements in IFRS 15 Revenue from contracts with customers, particularly the accounting of identifying performance obligations amending the wording of the separately identifiable principle, of principal versus agent considerations including the assessment of whether an entity is a principal or an agent as well as applications of control principle and of licensing providing additional guidance for accounting of intellectual property and royalties. The clarifications also provide additional practical expedients for entities that either apply IFRS 15 fully retrospectively or that elect to apply the modified retrospective approach. The Group will apply these clarifications on 1 January The Group has performed an assessment and does not expect these clarifications to have a material impact on its results and financial position. Annual improvements IFRSs cycle The IASB has issued the Annual improvements to IFRSs cycle, which is a collection of amendments to IFRSs. The amendments are effective for annual periods beginning on or after 1 January 2018 for IFRS 1 First-time adoption of IFRS and for IAS 28 Investments in associates and joint ventures. Earlier application is permitted for IAS 28 Investments in associates and joint ventures. The Group does not expect these to have any impact on its results and financial position. IFRS 1 First-time adoption of IFRS: This improvement deletes the short-term exemptions regarding disclosures about financial instruments, employee benefits and investment entities, applicable for first time adopters. IAS 28 Investments in associates and joint ventures: The amendments clarify that the election to measure at fair value through profit or loss an investment in an associate or a joint venture that is held by an entity that is venture capital organisation, or other qualifying entity, is available for each investment in an associate or joint venture on an investment-by-investment basis, upon initial recognition. IFRS 4 Applying IFRS 9 Financial instruments with IFRS 4 Insurance contracts (amendments) The amendments are effective for annual periods beginning on or after 1 January The amendments address concerns arising from implementing the new financial instruments standard, IFRS 9, before implementing the new insurance contracts standard that the IASB is developing to replace IFRS 4. The amendments introduce two options for entities issuing insurance contracts: a temporary exemption from applying IFRS 9 and an overlay approach, which would permit entities that issue contracts within the scope of IFRS 4 to reclassify, from profit or loss to other comprehensive income, some of the income or expenses arising from designated financial assets. Since the insurance subsidiaries of the Group have adopted IFRS 9 on 1 January 2018, these amendments do not have any impact on the results and financial position of the Group. 42
45 2. Summary of significant accounting policies (continued) 2.4 Standards and interpretations that are issued but not yet effective (continued) Standards and interpretations issued by the IASB and adopted by the EU (continued) IFRS 16 Leases The standard is effective for annual periods beginning on or after 1 January IFRS 16 sets out the principles for the recognition, measurement, presentation and disclosure of leases for both parties to a contract, i.e. the customer (lessee) and the supplier (lessor). The new standard requires lessees to recognise most leases on their financial statements. Lessees will have a single accounting model for all leases, with certain exemptions. Lessor accounting is substantially unchanged. The Group will apply IFRS 16 on 1 January The Group is in the process of assessing the impact of this standard on its results and financial position. Existing operating lease commitments are disclosed in Note Standards and interpretations issued by the IASB but not yet adopted by the EU Amendment in IFRS 10 Consolidated financial statements and IAS 28 Investments in associates and joint ventures: sale or contribution of assets between an investor and its associate or joint venture The amendments address an acknowledged inconsistency between the requirements in IFRS 10 and those in IAS 28, in dealing with the sale or contribution of assets between an investor and its associate or joint venture. The main consequence of the amendments is that a full gain or loss is recognised when a transaction involves a business (as defined in IFRS 3). A partial gain or loss is recognised when a transaction involves assets that do not constitute a business. In December 2015, the IASB postponed the effective date of this amendment indefinitely pending the outcome of its research project on the equity method of accounting. The Group does not expect these amendments to have a material impact on its results and financial position. Amendments IFRS 2: Classification and measurement of share based payment transactions The amendments provide requirements on the accounting for the effects of vesting and non-vesting conditions on the measurement of cash-settled share-based payments, for share-based payment transactions with a net settlement feature for withholding tax obligations and for modifications to the terms and conditions of a sharebased payment that changes the classification of the transaction from cash-settled to equity-settled. The amendments are effective for annual periods beginning on or after 1 January 2018 with earlier application permitted. The Group does not expect these amendments to have a material impact on its results and financial position. IAS 40: Transfers to investment property (amendments) The amendments clarify when an entity should transfer property, including property under construction or development into, or out of investment property. The amendments state that a change in use occurs when the property meets, or ceases to meet, the definition of investment property and there is evidence of the change in use. A mere change in management s intentions for the use of a property does not provide evidence of a change in use. The amendments are effective for annual periods beginning on or after 1 January 2018 with earlier application permitted. The Group does not expect these amendments to have a material impact on its results and financial position. Amendment to IFRS 9: Prepayment features with negative compensation The amendment allows financial assets with prepayment features that permit or require a party to a contract either to pay or receive reasonable compensation for the early termination of the contract (so that, from the perspective of the holder of the asset there may be negative compensation), to be measured at amortised cost or at fair value through other comprehensive income. The amendment is effective for annual reporting periods beginning on or after 1 January 2019 with earlier application permitted. The Group is in the process of assessing the impact of this amendment on its results and financial position. Amendments to IAS 28: Long-term interests in associates and joint ventures The amendments relate to whether the measurement, in particular impairment requirements, of long term interests in associates and joint ventures that, in substance, form part of the net investment in the associate or joint venture should be governed by IFRS 9, IAS 28 or a combination of both. The amendments clarify that an entity applies IFRS 9 before it applies IAS 28, to such long-term interests for which the equity method is not applied. In applying IFRS 9, the entity does not take account of any adjustments to the carrying amount of long-term interests that arise from applying IAS 28. The amendments are effective for annual reporting periods beginning on or after 1 January 2019 with earlier application permitted. The Group is in the process of assessing the impact of these amendments on its results and financial position. 43
46 2. Summary of significant accounting policies (continued) 2.4 Standards and interpretations that are issued but not yet effective (continued) Standards and interpretations issued by the IASB but not yet adopted by the EU (continued) International Financial Reporting Interpretations Committee (IFRIC) Interpretation 22: Foreign currency transactions and advance consideration The interpretation clarifies the accounting for transactions that include the receipt or payment of advance consideration in a foreign currency. The interpretation covers foreign currency transactions when an entity recognises a non-monetary asset or a non-monetary liability arising from the payment or receipt of advance consideration before the entity recognises the related asset, expense or income. The interpretation states that the date of the transaction, for the purpose of determining the exchange rate, is the date of initial recognition of the non-monetary prepayment asset or deferred income liability. If there are multiple payments or receipts in advance, then the entity must determine a date of the transactions for each payment or receipt of advance consideration. The interpretation is effective for annual periods beginning on or after 1 January 2018 with earlier application permitted. The Group does not expect this interpretation to have a material impact on its results and financial position. IFRIC Interpretation 23: Uncertainty over income tax treatments The interpretation addresses the accounting for income taxes when tax treatments involve uncertainty that affects the application of IAS 12. The interpretation provides guidance on considering uncertain tax treatments separately or together, examination by tax authorities, the appropriate method to reflect uncertainty and accounting for changes in facts and circumstances. The interpretation is effective for annual periods beginning on or after 1 January 2019 with earlier application permitted. The Group is in the process of assessing the impact of this amendment on its results and financial position. Annual improvements IFRSs cycle The IASB has issued the Annual improvements to IFRSs cycle, which is a collection of amendments to IFRSs. The amendments are effective for annual periods beginning on or after 1 January 2019, with early application permitted. The Group does not expect these to have material impact on its results and financial position. IFRS 3 Business combinations: The amendments clarify that a company remeasures its previously held interest in a joint operation when it obtains control of the business. IFRS 11 Joint arrangements: The amendments clarify that a company does not remeasure its previously held interest in a joint operation when it obtains joint control of the business. IAS 12 Income taxes: The amendments clarify that a company accounts for all income tax consequences of dividend payments in the same way. IAS 23 Borrowing costs: The amendments clarify that a company treats as part of general borrowings any borrowing originally made to develop an asset when the asset is ready for its intended use or sale. IFRS 17: Insurance Contracts The standard is effective for annual periods beginning on or after 1 January 2021 with earlier application permitted if both IFRS 15 Revenue from contracts with customers and IFRS 9 Financial instruments have also been applied. IFRS 17 Insurance contracts establishes principles for the recognition, measurement, presentation and disclosure of insurance contracts issued. It also requires similar principles to be applied to reinsurance contracts held and investment contracts with discretionary participation features issued. The objective is to ensure that entities provide relevant information in a way that faithfully represents those contracts. This information gives a basis for users of financial statements to assess the effect that contracts within the scope of IFRS 17 have on the financial position, financial performance and cash flows of an entity. The Group is in the process of assessing the impact of this standard on its results and financial position. IAS 19: Plan amendment, curtailment or settlement (amendments) The amendments are effective for annual periods beginning on or after 1 January 2019 with earlier application permitted. The amendments require entities to use updated actuarial assumptions to determine current service cost and net interest for the remainder of the annual reporting period after a plan amendment, curtailment or settlement has occurred. The amendments also clarify how the accounting for a plan amendment, curtailment or settlement affects applying the asset ceiling requirements. The Group is in the process of assessing the impact of this amendment on its results and financial position. 44
47 2. Summary of significant accounting policies (continued) 2.5 Basis of consolidation The Consolidated Financial Statements comprise the Consolidated Financial Statements of the Group as at and for the year ended 31 December The financial statements of the subsidiaries are prepared as of the same reporting date as that of the Company, using consistent accounting policies. Subsidiaries are fully consolidated from the date on which control is transferred to the Group. Control is achieved when the Group is exposed, or has rights, to variable returns from its involvement with the investee and has the ability to affect those returns through its power over the investee. Specifically, the Group controls an investee if, and only if, the Group has: power over an investee (i.e. existing rights that give it the current ability to direct the relevant activities of the investee) exposure, or rights, to variable returns from its involvement with the investee the ability to use its power over the investee to affect its returns. Generally, there is a presumption that a majority of voting rights results in control. To support this presumption and when the Group has less than a majority of the voting rights of an investee, the Group considers all relevant facts and circumstances in assessing whether it has power over an investee including the contractual arrangement with the other vote holders, rights arising from other contractual arrangements, and the Group s voting and potential voting rights. The Group re-assesses whether or not it controls an investee if facts indicate that there are changes to any of the three elements of control. Assets, liabilities, income and expenses of subsidiaries acquired or disposed of during the year are included in the Consolidated Financial Statements from the date of acquisition or up to the date of disposal, respectively. Profit or loss and each component of other comprehensive income (OCI) are attributed to the equity holders of the parent of the Group and to the non-controlling interests, even if this results in the non-controlling interests having a deficit balance. Non-controlling interests represent the portion of profit or loss and net assets not held by the Group, directly or indirectly. The non-controlling interests are presented separately in the consolidated income statement and within equity from the Company owners equity. All intra-group balances and transactions are eliminated on consolidation. A change in the ownership interest of a subsidiary, without loss of control, is accounted for as a transaction between the owners, which affects equity. As a result, no goodwill arises nor any gain/loss is recognised in the income statement from such transactions. The foreign exchange differences which relate to the share of noncontrolling interests being sold/acquired are reclassified between the foreign currency reserve and noncontrolling interests. 2.6 Business combinations Business combinations are accounted for using the acquisition method. The cost of an acquisition is measured as the aggregate of the consideration transferred, measured at the acquisition date fair value and the amount of any non-controlling interests in the acquiree. For each business combination the Group elects whether to measure the non-controlling interests in the acquiree at fair value or at the proportionate share of the acquiree s identifiable net assets. Any excess of the cost of acquisition over the Group s share of the fair values of the identifiable net assets acquired, is recognised as goodwill on the consolidated balance sheet. Where the Group s share of the fair values of the identifiable net assets are greater than the cost of acquisition (i.e. negative goodwill), the difference is recognised directly in the consolidated income statement in the year of acquisition. Acquisition related costs are expensed as incurred and included in other operating expenses. If the business combination is achieved in stages, the previously held equity interest is remeasured at fair value and any resulting gain or loss is recognised in the consolidated income statement. When the Group acquires a business, it assesses the financial assets and liabilities assumed for appropriate classification and designation in accordance with contractual terms, economic circumstances and pertinent conditions as at the acquisition date. 45
48 2. Summary of significant accounting policies (continued) 2.7 Investments in associates and joint ventures An associate is an entity over which the Group has significant influence. Significant influence is the power to participate in the financial and operating policy decisions of the investee, but is not control or joint control over those policies. A joint venture is a type of joint arrangement whereby the parties that have joint control of the arrangement have rights to the net assets of the joint venture. Joint control is the contractually agreed sharing of control of an arrangement, which exists only when decisions about the relevant activities require unanimous consent of the parties sharing control. The considerations made in determining significant influence or joint control are similar to those necessary to determine control over subsidiaries. In the Consolidated Financial Statements, the Group s investments in associates and joint ventures are accounted for using the equity method of accounting. Under the equity method, the investment in an associate or a joint venture is carried in the consolidated balance sheet at cost plus post-acquisition changes in the Group s share of the net assets of the associate or joint venture. The Group s share of the results of the associate or joint venture is included in the consolidated income statement. Losses of the associate or joint venture in excess of the Group s cost of the investment are recognised as a liability only when the Group has incurred obligations on behalf of the associate or joint venture. Goodwill relating to an associate or joint venture is included in the carrying amount of the investment and is not amortised. Any excess of the Group s share of the net fair value of the associate s or joint venture s identifiable assets over the cost of the investment (i.e. negative goodwill) is included as income in the determination of the Group s share of the associate s or joint venture s profit or loss in the period in which the investment is acquired. The aggregate of the Group s share of profit or loss of an associate or a joint venture is shown on the face of the consolidated income statement outside operating profit and represents profit or loss before tax. The associated tax charge is disclosed in income tax. The Group recognises its share of any changes in the equity of the associate or the joint venture through the consolidated statement of changes in equity. Profits and losses resulting from transactions between the Group and the associate or the joint venture are eliminated to the extent of the Group s interest in the associate or the joint venture. The financial statements of the associates or joint ventures are prepared as of the same reporting date as that of the Company, using consistent accounting policies. After application of the equity method, the Group determines whether it is necessary to recognise an impairment loss on its investments in associates or joint ventures. 2.8 Foreign currency translation The Consolidated Financial Statements are presented in Euro ( ), which is the functional and presentation currency of the Company and its subsidiaries in Cyprus. Each overseas branch or subsidiary of the Group determines its own functional currency and items included in the financial statements of each entity are measured using that functional currency. The Group uses the direct method of consolidation and has elected to recycle in the consolidated statement of comprehensive income the gain or loss that arises from using this method. 46
49 2. Summary of significant accounting policies (continued) 2.8 Foreign currency translation (continued) Transactions and balances Transactions in foreign currencies are recorded using the functional currency rate of exchange ruling at the date of the transaction. Monetary assets and liabilities denominated in foreign currencies are retranslated at the functional currency rate of exchange ruling at the reporting date. All differences are taken to Net foreign exchange gains/losses in the consolidated income statement, with the exception of differences on foreign currency liabilities that provide a hedge against the net investments in subsidiaries and overseas branches. These differences are recognised in other comprehensive income in the Foreign currency translation reserve until the disposal or liquidation of the net investment, at which time the cumulative amount is reclassified to the consolidated income statement. Non-monetary items that are measured at historic cost in a foreign currency are translated using the exchange rates ruling as at the dates of the initial transactions. Non-monetary items measured at fair value in a foreign currency are translated using the exchange rates ruling at the date when the fair value is determined Subsidiary companies and branches At the reporting date, the assets and liabilities of subsidiaries (including special purpose entities that the Group consolidates) and branches whose functional currency is other than the Group s presentation currency are translated into the Group s presentation currency at the rate of exchange ruling at the reporting date, and their income statements are translated using the average exchange rates for the year. Foreign exchange differences arising on translation are recognised in other comprehensive income in the Foreign currency translation reserve. On disposal or liquidation of a subsidiary or branch, the cumulative amount of the foreign exchange differences relating to that particular overseas operation, is reclassified to the consolidated income statement as part of the profit/loss on disposal/dissolution of subsidiaries. 2.9 Segmental reporting Operating segments are reported in a manner consistent with the internal reporting provided to the chief operating decision-maker. The chief operating decision-maker is the person or group of persons that allocate resources to and assess the performance of the operating segments. The chief operating decision-maker is the Group Executive Committee Turnover Group turnover comprises interest income, fee and commission income, foreign exchange gains, gross insurance premiums, gains/losses of investment properties and stock of properties, turnover of property and hotel business and other income Revenue recognition Revenue is recognised when it is probable that economic benefits will flow to the Group and the revenue can be reliably measured. The following specific recognition criteria must also be met before revenue is recognised Interest income and expense For all financial instruments measured at amortised cost, interest bearing financial assets classified as available-for-sale investments or at fair value through profit or loss, interest income or expense is recognised using the effective interest method. The effective interest rate is the rate that exactly discounts the estimated future cash receipts or payments through the expected life of the financial instruments, or where appropriate a shorter period, to the carrying amount of the financial instruments. Interest income is recognised on the recoverable portion of impaired loans. The Group holds loans and advances to banks and central banks with negative interest rates. discloses interest paid on these assets as interest expense. Negative interest is disclosed in Note 8. The Group 47
50 2. Summary of significant accounting policies (continued) 2.11 Revenue recognition (continued) Interest income and expense (continued) The carrying amount of a financial asset or liability is adjusted if the Group revises its estimates of payments or receipts. The adjusted carrying amount is calculated based on the original effective interest rate and the change in carrying amount is recorded in Net gains on financial instrument transactions for debt securities, or Gain on derecognition of loans and advances to customers and changes in expected cash flows for loans and advances to customers Fee and commission income Fee and commission income is generally recognised on the basis of work done so as to match the cost of providing the service, whereas fees and commissions in respect of loans and advances are recognised using the effective interest method as part of interest income Dividend income Dividend income is recognised in the consolidated income statement when the Group s right to receive payment is established i.e. upon approval by the general meeting of the shareholders Rental income Rental income from investment properties and stock of property is accounted for on a straight-line basis over the period of the lease and is recognised in the consolidated income statement in Other income Gains from the disposal of investment property Gains on disposal of investment property are recognised in the consolidated income statement in Net (losses)/gains from revaluation and disposal of investment properties when the buyer accepts delivery and the transfer of risks and rewards to the buyer is completed Gains on the disposal of stock of property Net gains on disposal of stock of property are recognised in the consolidated income statement when the buyer accepts delivery and the transfer of risks and rewards to the buyer is completed Retirement benefits The Group operates several defined contribution and defined benefit retirement plans. Defined contribution plans The Group recognises obligations, in respect of the accounting period in the consolidated income statement. Any unpaid contributions at the reporting date are included as a liability. Defined benefit plans The cost of providing benefits for defined benefit plans is estimated separately for each plan using the Projected Unit Credit Method of actuarial valuation. The defined benefit asset or liability comprises the present value of the defined benefit obligations (using a discount rate based on high quality corporate bonds), reduced by the fair value of plan assets out of which the obligations are to be settled. Plan assets are assets that are held by a funded plan or qualifying insurance policies. Any net defined benefit surplus is limited to the present value of available refunds and reductions in future contributions to the plan. Fair value is based on market price information and in the case of quoted securities it is the published bid price. The net charge to the consolidated income statement mainly comprises the service costs and the net interest on the net defined benefit asset or liability, and is presented in staff costs. Service costs comprise current service costs, past-service costs, gains and losses or curtailments and non-routine settlements. Remeasurements, comprising actuarial gains and losses, the effect of the asset ceiling (excluding net interest), and the return on plan assets (excluding net interest), are recognised immediately on the consolidated balance sheet with a corresponding debit or credit in other comprehensive income. Re-measurements are not reclassified to profit or loss in subsequent periods. 48
51 2. Summary of significant accounting policies (continued) 2.12 Retirement benefits (continued) Defined benefit plans (continued) Actuarial gains and losses comprise experience adjustments (the effects of differences between the previous actuarial assumptions and what has actually occurred), as well as the effects of changes in actuarial assumptions Tax Current income tax and deferred tax Tax on income is provided in accordance with the fiscal regulations and rates which apply in the countries where the Group operates and is recognised as an expense in the period in which the income arises. Deferred tax is provided using the liability method. Current income tax assets and liabilities are measured at the amount expected to be recovered from or paid to the tax authorities. Current income tax and deferred tax relating to items recognised directly in equity is recognised directly in equity. Deferred tax liabilities are recognised for all taxable temporary differences between the tax basis of assets and liabilities and their carrying amounts at the reporting date, which will give rise to taxable amounts in future periods. Deferred tax liabilities are recognised for all taxable temporary differences associated with investments in subsidiary and associate companies and branches except where the timing of the reversal of the temporary differences can be controlled and it is probable that the temporary differences will not reverse in the foreseeable future. Deferred tax assets are recognised for all deductible temporary differences and carry-forward of unutilised tax losses to the extent that it is probable that taxable profit will be available, against which the deductible temporary differences and carry-forward of unutilised tax losses can be utilised. The carrying amount of deferred tax assets is reviewed at each reporting date and reduced to the extent that it is no longer probable that sufficient taxable profit will be available to utilise all or part of the deductible temporary differences or tax losses. Unrecognised deferred tax assets are reassessed at each reporting date and are recognised to the extent that it has become probable that future taxable profit will allow the deferred tax asset to be recovered. Deferred tax assets and liabilities are measured at the amount that is expected to be paid to or recovered from the tax authorities, after taking into account the tax rates and legislation that have been enacted or substantially enacted by the reporting date. Current and deferred tax assets and liabilities are offset when they arise from the same tax reporting entity and relate to the same tax authority and when the legal right to offset exists. Indirect Tax Value Added Tax (VAT) Expenses and assets are recognised net of the amount of VAT, except: when the VAT incurred on a purchase of assets or services is not recoverable from the tax authorities, in which case, the VAT suffered is recognised as part of the cost of acquisition of the asset or as part of the expense item, as applicable. when receivables and payables are stated with the amount of VAT charged. The amount of VAT recoverable from, or payable to the tax authorities, is included as part of receivables or payables in the consolidated balance sheet Financial instruments Date of recognition All financial assets and liabilities are initially recognised on the trade date. Purchases or sales of financial assets, where delivery is required within a time frame established by regulations or by market convention, are also recognised on the trade date, i.e. the date that the Group commits to purchase or sell the asset. Derivatives are also recognised on a trade date basis. Balances with central banks, Funding from central banks, Deposits by banks, Customer deposits, Loans and advances to banks and Loans and advances to customers are recognised when cash is received by the Group or advanced to the borrowers. 49
52 2. Summary of significant accounting policies (continued) 2.14 Financial instruments (continued) Initial recognition and measurement of financial instruments The classification of financial instruments on initial recognition depends on the purpose for which the financial instruments were acquired and their characteristics. All financial instruments are measured initially at their fair value plus, in the case of financial assets and liabilities not measured at fair value through profit or loss, any directly attributable incremental costs of acquisition or issue. Fair value is the price that would be received to sell an asset or paid to transfer a liability in an orderly transaction between market participants at the measurement date Derivative financial instruments Derivatives are recorded at fair value and classified as assets when their fair value is positive and as liabilities when their fair value is negative. Subsequently, derivatives are measured at fair value. Revaluations of trading derivatives are included in the consolidated income statement in Net foreign exchange gains in the case of currency derivatives and in Net gains on financial instrument transactions and disposal/dissolution of subsidiaries in the case of all other derivatives. Interest income and expense are included in the corresponding captions in the consolidated income statement. Derivatives embedded in other financial instruments, such as the conversion option in an acquired convertible bond, are treated as separate derivatives and recorded at fair value if their economic characteristics and risks are not closely related to those of the host contract, and the host contract is not itself measured at fair value with revaluation recognised in the consolidated income statement. The embedded derivatives separated from the host are carried at fair value, with revaluations recognised in Net gains on financial instrument transactions and disposal/dissolution of subsidiaries in the consolidated income statement Financial assets or financial liabilities held for trading Financial assets or financial liabilities held for trading represent assets and liabilities acquired or incurred principally for the purpose of selling or repurchasing them in the near term and are recognised in the consolidated balance sheet at fair value. Changes in the fair value are recognised in Net gains on financial instrument transactions and disposal/dissolution of subsidiaries in the consolidated income statement. Interest income and expense are included in the corresponding captions in the consolidated income statement according to the terms of the relevant contract, while dividend income is recognised in Other income when the right to receive payment has been established Financial assets or financial liabilities designated upon initial recognition at fair value through profit or loss Financial assets and financial liabilities classified in this category are designated by management on initial recognition when the following criteria are met: (a) the designation eliminates or significantly reduces the inconsistency that would otherwise arise from the measurement of the assets or liabilities or the recognition of gains or losses on them on a different basis, or (b) the assets and liabilities are part of a group of financial assets, financial liabilities or both which are managed and their performance is evaluated on a fair value basis, in accordance with a documented risk management or investment strategy, or (c) the financial instrument contains an embedded derivative, unless the embedded derivative does not significantly modify the cash flows of the instrument or it is clear, with little or no analysis, that the embedded derivative could not be separated. These assets do not form part of the trading portfolio because no recent pattern of short-term profit taking exists. They include listed debt securities economically hedged by derivatives, and not designated for hedge accounting, as well as unlisted equities which are managed on a fair value basis. 50
53 2. Summary of significant accounting policies (continued) 2.14 Financial instruments (continued) Financial assets or financial liabilities designated upon initial recognition at fair value through profit or loss (continued) Financial assets and financial liabilities designated upon initial recognition at fair value through profit or loss are recognised in the consolidated balance sheet at fair value. Changes in fair value are recognised in Net gains on financial instrument transactions and disposal/dissolution of subsidiaries in the consolidated income statement. Interest income and expense are included in the corresponding captions in the consolidated income statement according to the terms of the relevant contract, while dividend income is recognised in Other income when the right to receive payment has been established Held-to-maturity investments Held-to-maturity investments are those with fixed or determinable payments and fixed maturities and which the Group has the intention and ability to hold to maturity. After initial measurement, held-to-maturity investments are subsequently measured at amortised cost using the effective interest method. Amortised cost is calculated by taking into account any discount or premium on acquisition and fees that are an integral part of the effective interest rate. The amortisation is included in Interest income in the consolidated income statement. Losses arising from impairment of such investments are recognised in Impairment of other financial instruments in the consolidated income statement. If, as a result of a change in intention or ability, it is no longer appropriate to classify an investment as held-to-maturity, it shall be reclassified as available-forsale and remeasured at fair value, and the difference between its carrying amount and fair value shall be accounted for, accordingly Loans and receivables Loans and receivables are financial assets with fixed or determinable payments that are not quoted in an active market. They are not entered into with the intention of immediate or short-term resale and are not classified as Trading investments, Investments available-for-sale or Investments at fair value through profit or loss. This accounting policy covers the captions Loans and advances to banks, Reverse repurchase agreements, Loans and advances to customers and Investments classified as loans and receivables in the consolidated balance sheet. After their initial recognition, loans and receivables are subsequently measured at amortised cost using the effective interest method, less any provision for impairment. The losses arising from impairment are recognised in the consolidated income statement in Provisions for impairment of loans and advances and other customer credit losses in the case of loans and advances to customers and in Impairment of other financial instruments for all other instruments Available-for-sale investments Available-for-sale investments are those which are designated as such or do not qualify for classification as Investments at fair value through profit or loss, Investments held-to-maturity or Loans and receivables. These investments can be sold in response to changes in market risks or liquidity requirements and include equity securities and debt securities. After initial recognition, available-for-sale investments are measured at fair value. Unrealised gains and losses from changes in fair value are recognised directly in other comprehensive income in the Available-for-sale investments caption. When the investment is disposed of, the cumulative gain or loss previously recognised in other comprehensive income is transferred to the consolidated income statement in Net gains on financial instrument transactions and disposal/dissolution of subsidiaries. Where the Group holds more than one investment in the same security, they are deemed to be disposed of on a weighted average cost basis. Interest income from available-for-sale debt securities is recorded in Interest income using the effective interest method. Dividend income from available-for-sale equity securities is recognised in the consolidated income statement in Other income when the right to receive payment has been established. Impairment losses on available-for-sale investments are recognised in the consolidated income statement in Impairment of other financial instruments caption. 51
54 2. Summary of significant accounting policies (continued) 2.14 Financial instruments (continued) Subordinated loan stock Subordinated loan stock is initially measured at the fair value of the consideration received, net of any issue costs. It is subsequently measured at amortised cost using the effective interest method, in order to amortise the difference between the cost at inception and the redemption value, over the period to the earliest date that the Group has the right to redeem the subordinated loan stock. Interest on subordinated loan stock is included in Interest expense in the consolidated income statement Other financial liabilities at amortised cost Other financial liabilities include Customer deposits, Deposits by banks and Funding from central banks. Financial liabilities are recognised when the Group enters into the contractual provisions of the arrangements with counterparties, which is generally on trade date, and initially measured at fair value, which is normally the consideration received, net of directly attributable transaction costs incurred. Subsequent measurement of deposits by customers, funding from central banks and deposits by banks is at amortised cost, using the effective interest method Derecognition of financial assets and financial liabilities Financial assets A financial asset is derecognised when: (a) the contractual rights to receive cash flows from the asset have expired, or (b) the Group has transferred its contractual rights to receive cash flows from the asset or (c) has assumed an obligation to pay the received cash flows in full to a third party and has: either (i) transferred substantially all the risks and rewards of the asset, or (ii) has neither transferred nor retained substantially all the risks and rewards of the asset, but has transferred control of the asset. Renegotiated loans A loan that is renegotiated is derecognised if the existing agreement is cancelled and a new agreement made on substantially different terms, or if the terms of an existing agreement are modified, such that the renegotiated loan is substantially a different financial instrument Financial liabilities A financial liability is derecognised when the obligation under the liability is discharged, cancelled or expired Impairment of financial assets Loans and receivables The Group assesses at each reporting date whether there is any objective evidence that a financial asset or a group of financial assets is impaired. A financial asset or a group of financial assets is impaired if there is objective evidence of impairment as a result of one or more events that have occurred after the initial recognition of the asset (an incurred loss event) and that loss event (or events) has an impact on the estimated future cash flows of the financial asset or the group of financial assets, that can be reliably estimated. Objective evidence of impairment may include indications that the borrower or group of borrowers is experiencing significant financial difficulty, default or delinquency in interest or principal payments, the probability that the borrower might be declared bankrupt or proceed with a financial restructuring and where observable data indicate that there is a measurable decrease in the estimated future cash flows, such as changes in arrears or the economic conditions that correlate with defaults. There is objective evidence that a loan is impaired when it is probable that the Group will not be able to collect all amounts due, according to the original contract terms. For loans and advances to customers carried at amortised cost, the Group first assesses individually whether objective evidence of impairment exists for loans and advances that are individually significant. Furthermore, a collective impairment assessment is made for loans and advances that are not individually significant and for losses that have been incurred but are not yet identified relating to loans and advances that have been assessed individually and for which no provision has been made. 52
55 2. Summary of significant accounting policies (continued) 2.16 Impairment of financial assets (continued) Loans and receivables (continued) Provisions for impairment of loans are determined using the incurred loss model as required by IFRSs, which requires recognition of impairment losses that arose from past events and prohibits recognition of impairment losses that could arise from future events, no matter how likely those events are. If there is objective evidence that an impairment loss has been incurred, the amount of the loss is measured as the difference between the carrying amount of the loan and the present value of the estimated future cash flows including the cash flows which may arise from guarantees and tangible collaterals. The collectability of individually significant loans and advances is evaluated based on the customer s overall financial condition, resources and payment record, the prospect of support from creditworthy guarantors and the realisable value of any collateral. The present value of the estimated future cash flows is calculated using the loan s original effective interest rate. If a loan bears a variable interest rate, the discount rate used for measuring any impairment loss is the current reference rate plus the margin specified in the initial contract. For the purposes of a collective evaluation of impairment, loans are grouped based on similar credit risk characteristics taking into account the type of the loan, geographic location, past-due days and other relevant factors. Future cash flows for a group of loans and advances that are collectively evaluated for impairment are estimated on the basis of historical loss experience for loans with similar credit risk characteristics to those of the group. Historical loss experience is adjusted on the basis of current observable data to reflect the impact of current conditions that did not affect the period on which the historical loss experience is based and to remove the impact of conditions in the historical period that do not currently apply. The methodology and assumptions used for estimating future cash flows are reviewed regularly to reduce any differences between loss estimates and actual loss experience. The carrying amount of the loan is reduced through the use of a provision account and the amount of the loss is recognised in the consolidated income statement. Loans together with the associated provisions are written off when there is no realistic prospect of future recovery. Partial write-offs, including non contractual write-offs, may also occur when it is considered that there is no realistic prospect for the recovery of the contractual cash flows. If, in a subsequent period, the amount of the estimated impairment loss decreases and the decrease is due to an event occurring after the impairment was recognised, when the creditworthiness of the customer has improved to such an extent that there is reasonable assurance that all or part of the principal and interest according to the original contract terms of the loan will be collected timely, the previously recognised impairment loss is reduced by adjusting the impairment provision account. If a previously written-off loan is subsequently recovered, any amounts previously charged are credited to Provisions for impairment of loans and advances and other customer credit losses in the consolidated income statement Investments classified as held-to-maturity and loans and receivables For held-to-maturity investments and loans and receivables investments, the Group assesses at each reporting date whether there is objective evidence of impairment. If there is objective evidence that an impairment loss has been incurred, the amount of the loss is measured as the difference between the asset s carrying amount and the present value of estimated future cash flows (excluding future credit losses not yet incurred). The carrying amount of the asset is reduced and the amount of the loss is recognised in Impairment of other financial instruments caption in the consolidated income statement. If, in a subsequent period, the amount of the estimated impairment loss decreases because of an event occurring after the impairment was recognised, the impairment loss previously recognised is reversed and the reversal is credited to the Impairment of other financial instruments caption in the consolidated income statement. 53
56 2. Summary of significant accounting policies (continued) 2.16 Impairment of financial assets (continued) Available-for-sale investments For available-for-sale investments, the Group assesses whether there is objective evidence of impairment at each reporting date. In the case of equity securities classified as available-for-sale, objective evidence would include a significant or prolonged decrease, in the fair value of the investment below cost. Where there is evidence of impairment, the cumulative loss measured as the difference between the acquisition cost and the current fair value, less any impairment loss on that investment previously recognised in the consolidated income statement is deducted from the Revaluation reserve of available-for-sale investments in other comprehensive income and recognised in Impairment of other financial instruments caption in the consolidated income statement. Impairment losses on equity securities are not reversed through the consolidated income statement. Increases in their fair value after impairment are recognised in the Revaluation of available-for-sale investments in other comprehensive income. In the case of debt securities classified as available-for-sale, impairment is assessed based on the same criteria applicable to financial assets carried at amortised cost. If, in a subsequent period, the impairment loss decreases and the decrease can be objectively related to an event occurring after the impairment loss was recognised, the impairment loss previously recognised is reversed through Impairment of other financial instruments caption in the consolidated income statement Hedge accounting The Group uses derivative financial instruments to hedge exposures to interest rate and foreign exchange risks and in the case of the hedge of net investments, the Group uses also non-derivative financial liabilities. The Group applies hedge accounting for transactions which meet the specified criteria. At inception of the hedging relationship, the Group formally documents the relationship between the hedged item and the hedging instrument, including the nature of the risk and the objective and strategy for undertaking the hedge. The method that will be used to assess the effectiveness both at the inception and at ongoing basis, of the hedging relationship also forms part of the Group s documentation. At inception of the hedging relationship and at each hedge effectiveness assessment date, a formal assessment is undertaken to ensure that the hedging relationship is highly effective regarding the offsetting of the changes in fair value or the cash flows attributable to the hedged risk. A hedge is regarded as highly effective if the changes in fair value or cash flows attributable to the hedged risk of the hedging instrument and the hedged item during the period for which the hedge is designated, are expected to offset in a range of 80% to 125%. In the case of cash flow hedges where the hedged item is a forecast transaction, the Group assesses whether the transaction is highly probable and presents an exposure to variations in cash flows that could ultimately affect the consolidated income statement Fair value hedges In the case of fair value hedges that meet the criteria for hedge accounting, the change in the fair value of a hedging instrument is recognised in the consolidated income statement in Net gains on financial instrument transactions and disposal/dissolution of subsidiaries. The change in the fair value of the hedged item attributable to the risk hedged is recorded as part of the carrying value of the hedged item and is also recognised in the consolidated income statement in Net gains on financial instrument transactions and disposal/dissolution of subsidiaries. If the hedging instrument expires or is sold, terminated or exercised, or where the hedge no longer meets the criteria for hedge accounting, the hedging relationship is discontinued prospectively. For hedged items recorded at amortised cost, the difference between the carrying value of the hedged item on termination and the face value is amortised to the consolidated income statement, over the remaining term of the original hedge. If the hedged item is derecognised, the unamortised fair value adjustment is recognised immediately in the consolidated income statement. 54
57 2. Summary of significant accounting policies (continued) 2.17 Hedge accounting (continued) Cash flow hedges In the case of cash flow hedges that meet the criteria for hedge accounting, the effective portion of the gain or loss on the hedging instrument is recognised directly in other comprehensive income in the Cash flow hedge reserve. The ineffective portion of the gain or loss on the hedging instrument is recognised in Net gains on financial instrument transactions and disposal/dissolution of subsidiaries in the consolidated income statement. When the hedged cash flows affect the consolidated income statement, the gain or loss previously recognised in the Cash flow hedge reserve is transferred to the consolidated income statement Hedges of net investments in foreign operations Hedges of net investments in overseas branches or subsidiaries are accounted for in a way similar to cash flow hedges. Gains or losses on the hedging instrument relating to the effective portion of the hedge are recognised in other comprehensive income while gains or losses relating to the ineffective portion are recognised in Net foreign exchange gains in the consolidated income statement. On disposal or liquidation of an overseas branch or subsidiary, the cumulative gains or losses recognised in other comprehensive income are transferred in the consolidated income statement within profit/(loss) on disposal/dissolution of subsidiaries Offsetting financial instruments Financial assets and financial liabilities are offset and the net amount reported in the consolidated balance sheet if there is a currently enforceable legal right to offset the recognised amounts and there is an intention to settle on a net basis, or to realise the asset and settle the liability simultaneously Cash and cash equivalents Cash and cash equivalents for the purposes of the consolidated statement of cash flows consist of cash, nonobligatory balances with central banks, loans and advances to banks and other securities that are readily convertible into known amounts of cash or are repayable within three months of the date of their acquisition Insurance business The Group undertakes both life insurance and general insurance business and issues insurance and investment contracts. An insurance contract is a contract under which one party (the insurer) accepts significant insurance risk from another party (the policyholder) by agreeing to compensate the policyholder if a specified uncertain future event (the insured event) adversely affects the policyholder. Investment contracts are those contracts that transfer financial risk. Investment contracts can, however, be reclassified as insurance contracts after inception if insurance risk becomes significant. Once a contract has been classified as an insurance contract, it remains an insurance contract until expiry or until all of the rights and obligations under the contract have been fulfilled, even if the insurance risk has been significantly reduced during its term. 55
58 2. Summary of significant accounting policies (continued) 2.20 Insurance business (continued) Life insurance business Premium income from unit-linked insurance contracts is recognised when received and when the units have been allocated to policyholders. Premium income from non-linked insurance contracts is recognised when due, in accordance with the terms of the relevant insurance contracts. Fees and other expenses chargeable to the long-term assurance funds in accordance with the terms of the relevant insurance contracts, as well as the cost of death cover, are recognised in a manner consistent with the recognition of the relevant insurance premiums. Claims are recorded as an expense when they are incurred. Life insurance contract liabilities are determined on the basis of an actuarial valuation and for unit-linked insurance contracts they include the fair value of units allocated to policyholders on a contract by contract basis Life insurance in-force business The Group recognises as an intangible asset the value of in-force business in respect of life insurance contracts. The asset represents the present value of the shareholders interest in the profits expected to emerge from those contracts written at the reporting date, using appropriate economic and actuarial assumptions, similar to the calculation of the respective life insurance contract liabilities. The change in the present value is determined on a post-tax basis. For presentation purposes, the change in value is grossed up at the underlying rate of tax General insurance business Premiums are recognised in the consolidated income statement in the period in which insurance cover is provided. Unearned premiums relating to the period of risk after the reporting date are deferred to subsequent reporting periods. An increase in liabilities arising from claims is made for the estimated cost of claims notified but not settled and claims incurred but not notified at the reporting date. The increase in liabilities for the cost of claims notified but not settled is made on a case by case basis after taking into consideration all known facts, the cost of claims that have recently been settled and assumptions regarding the future development of outstanding cases. Similar statistical techniques are used to determine the increase in liabilities for claims incurred but not notified at the reporting date Investment contracts The Group offers deposit administration funds which provide a guaranteed investment return on members contributions. Policies are written to employees of companies, which define the benefits to be received. Any shortfalls are covered by the companies which employ the staff being insured. The Group has no liability for any actuarial deficit Liability adequacy test At each reporting date, liability adequacy tests are performed to ensure the adequacy of insurance contract liabilities. In performing these tests, current best estimates of discounted future contractual cash flows and claims, expenses and investment returns are used. Any deficiency is charged to the consolidated income statement Repurchase and reverse repurchase agreements Securities sold under agreements to repurchase (repos) at a specific future date are not derecognised from the consolidated balance sheet. The corresponding cash received, including accrued interest, is recognised on the consolidated balance sheet as Repurchase agreements, reflecting its economic substance as a loan to the Group. The difference between the sale price and repurchase price is treated as interest expense and is accrued over the life of the agreement using the effective interest method. Repos outstanding at the reporting date relate to agreements with financial institutions. The investments pledged as security for the repurchase agreements can be sold or repledged by the counterparty. When the counterparty has the right to sell or repledge the securities, the Group reclassifies those securities in its consolidated balance sheet to Investments pledged as collateral. 56
59 2. Summary of significant accounting policies (continued) 2.21 Repurchase and reverse repurchase agreements (continued) Securities purchased under agreements to resell (reverse repos) at a specific future date, are recorded as reverse repo transactions. The difference between the purchase and the resale price is treated as interest income and is accrued over the life of the agreement using the effective interest method. Reverse repos outstanding at the reporting date relate to agreements with banks. The investments received as security under reverse repurchase agreements can either be sold or repledged by the Group Finance leases The Group as lessor Finance leases, where the Group transfers substantially all the risks and rewards incidental to ownership of the leased item to the lessee, are included in the consolidated balance sheet in Loans and advances to customers. A receivable is recognised over the lease period of an amount equal to the present value of the lease payments using the implicit rate of interest and including any guaranteed residual value. Finance income is recognised in Interest income in the consolidated income statement Operating leases Group as lessee Leases that do not transfer to the Group substantially all the risks and benefits incidental to ownership of the leased items are operating leases. Operating lease payments are recognised as an expense in the consolidated income statement on a straight line basis over the lease term in Other operating expenses Group as lessor Leases in which the Group does not transfer substantially all the risks and rewards of ownership of an asset are classified as operating leases Property and equipment Owner-occupied property is property held by the Group for use in the supply of services or for administrative purposes. Investment property is property held by the Group to earn rentals and/or for capital appreciation. If a property of the Group includes a portion that is owner-occupied and another portion that is held to earn rentals or for capital appreciation, the classification is based on whether or not these portions can be sold separately. Otherwise, the whole property is classified as owner-occupied property unless the owner-occupied portion is insignificant. The classification of property is reviewed on a regular basis to account for major changes in its use. Owner-occupied property is initially measured at cost and subsequently measured at fair value less accumulated depreciation and impairment. Valuations are carried out periodically between 3 to 5 years, depending on the property (but more frequent revaluations may be performed where there are significant and volatile movement in values), by independent, qualified valuers or by the internal qualified valuers of the Group applying a valuation model recommended by the International Valuation Standards Council. Depreciation is calculated on the revalued amount less the estimated residual value of each building on a straight line basis over its estimated useful life. Gain or losses from revaluations are recognised in other comprehensive income in Property revaluation. The Property revaluation reserve includes revaluation of property initially used by the Group for its operations which was subsequently transferred to Investment properties. Useful life is in the range of 30 to 67 years. Freehold land is not depreciated. On disposal of freehold land and buildings, the relevant revaluation reserve balance is transferred to Accumulated losses. The cost of adapting/improving leasehold property is amortised over 5 years. Equipment is measured at cost less accumulated depreciation. Depreciation of equipment is calculated on a straight line basis over its estimated useful life of 5 to 10 years. At the reporting date, when events or changes in circumstances indicate that the carrying value may not be recovered, property and equipment is assessed for impairment. Where the recoverable amount is less than the carrying amount, equipment is written down to its recoverable amount. 57
60 2. Summary of significant accounting policies (continued) 2.25 Investment properties Investment properties comprise land and buildings that are not occupied for use by, or in the operations of the Group, nor for sale in the ordinary course of business, but are held primarily to earn rental income and capital appreciation. These buildings are substantially rented to tenants and not intended to be sold in the ordinary course of business. Investment properties are measured initially at cost, including transaction costs. Subsequent to initial recognition, investment properties are measured at fair value, as at the reporting date. Gains or losses arising from changes in the fair values of investment properties are included in Net (losses)/gains from revaluation and disposal of investment properties in the consolidated income statement. Valuations are carried out by independent, qualified valuers or by the internal qualified valuers of the Group applying a valuation model recommended by the International Valuation Standards Council. Transfers are made to (or from) investment property only when there is a change in use. For a transfer from owner-occupied property to investment property, the Group accounts for such property in accordance with the policy described in Note 2.24 Property and equipment up to the date of change in use. For a transfer from investment property to stock of property, the property s deemed cost for subsequent accounting is its fair value at the date of change in use Stock of property The Group in its normal course of business acquires properties in exchange of debt, which are held either directly or by entities set up and controlled by the Group for the sole purpose of managing these properties with an intention to be disposed of. These properties are recognised in the Consolidated Financial Statements as Stock of property, reflecting the substance of these transactions. Stock of property is initially measured at cost and subsequently measured at the lower of cost and net realisable value. Net realisable value is the estimated selling price, less the estimated costs necessary to make the sale. If net realisable value is below the cost of the stock of property, impairment is recognised in Impairment of non-financial instruments in the consolidated income statement Non-current assets held for sale and discontinued operations The Group classifies non-current assets and disposal groups as held for sale if their carrying amounts will be recovered principally through a sale or distribution rather than through continuing use. The condition is regarded as met only when the sale is highly probable and the asset or disposal group is available for immediate sale in its present condition. Actions required to complete the sale should indicate that it is unlikely that significant changes to the plan will be made or that the plan will be withdrawn. Management must be committed to the sale, which should be expected to qualify for recognition as a completed sale within one year from the date of classification. Such non-current assets and disposal groups held for sale are measured at the lower of their carrying amount and fair value less costs to sell, except for those assets and liabilities that are not within the scope of the measurement requirements of IFRS 5 Non-current assets held for sale and discontinued operations such as deferred taxes, financial instruments, investment properties measured at fair value, insurance contracts and assets and liabilities arising from employee benefits. These are measured in accordance with the Group s relevant accounting policies described elsewhere in this note. Immediately before the initial classification as held for sale, the carrying amount of the asset (or assets and liabilities in the disposal group) is measured in accordance with applicable IFRSs. On subsequent remeasurement of a disposal group, the carrying amounts of the assets and liabilities noted above that are not within the scope of the measurement requirements of IFRS 5 are remeasured in accordance with applicable IFRSs before the fair value less costs to sell of the disposal group is determined. 58
61 2. Summary of significant accounting policies (continued) 2.27 Non-current assets held for sale and discontinued operations (continued) If fair value less costs to sell of the disposal group is below the aggregate carrying amount of all of the assets and liabilities included in the disposal group, the disposal group is written down. The impairment loss is recognised in the income statement for the year. Where an impairment loss is recognised (or reversed) for a disposal group, it is allocated between the scoped-in non current assets using the order of allocation set out in IAS 36 and no element of the adjustment is allocated to the other assets and liabilities of the disposal group. In case that the carrying amount of scoped-in non-current assets is less than the amount by which a disposal group s carrying amount exceeds its fair value less costs to sell, the excess is not recognised. Property and equipment and intangible assets are not depreciated or amortised once classified as held for sale. Assets and liabilities classified as held for sale are presented separately in the consolidated balance sheet. A disposal group qualifies as discontinued operation if an entity or a component of an entity has been disposed of or is classified as held for sale and a) represents a separate major line of business or geographical area of operations, b) is part of a single co-ordinated plan to dispose of a separate major line of business or geographical area of operations, or c) is a subsidiary acquired exclusively with a view to resale. Net loss/profit from discontinued operations includes the net total of operating profit and loss before tax from discontinued operations (including net gain or loss on sale before tax and gain or loss on measurement to fair value less cost to sell of a disposal group constituting a discontinued operation) and discontinued operations tax expense. Discontinued operations are excluded from the results of continuing operations and are presented as a single amount, as profit or loss after tax from discontinued operations in the consolidated income statement Intangible assets Intangible assets include among others computer software and acquired insurance portfolio customer lists. Intangible assets acquired separately are measured on initial recognition at cost. The cost of intangible assets acquired in a business combination is their fair value as at the date of acquisition. Following initial recognition, intangible assets are carried at cost less any accumulated amortisation and any accumulated impairment losses. Amortisation is calculated on a straight line basis over the estimated useful life of the assets which is 3 to 8 years for computer software. For the accounting policy of in-force life insurance business, refer to Note Intangible assets are reviewed for impairment when events relating to changes to circumstances indicate that the carrying value may not be recoverable. If the carrying amount exceeds the recoverable amount then the intangible assets are written down to their recoverable amount Share capital Any difference between the issue price of share capital and the nominal value is recognised as share premium. The costs incurred attributable to the issue of share capital are deducted from equity Treasury shares Own equity instruments which are acquired by the Company or by any of its subsidiaries are presented as treasury shares at their acquisition cost. Treasury shares are deducted from equity until they are cancelled or reissued. No gain or loss is recognised in the consolidated income statement on the purchase, sale, issue or cancellation of the Company s own equity shares Provisions Provisions for pending litigation, claims and regulatory matters Provisions for pending litigation, claims and regulatory matters against the Group are made when: (a) there is a present obligation (legal or constructive) arising from past events, (b) the settlement of the obligation is expected to result in an outflow of resources embodying economic benefits, and (c) a reliable estimate of the amount of the obligation can be made. 59
62 2. Summary of significant accounting policies (continued) 2.31 Provisions (continued) Provisions for undrawn loan commitments Provisions are made for undrawn loan commitments if it is probable that the facility will be drawn and result in the recognition of an asset at an amount less than the amount advanced Financial guarantees The Group issues financial guarantees to its customers, consisting of letters of credit, letters of guarantee and acceptances. Financial guarantees are initially recognised in the Consolidated Financial Statements at fair value, in Accruals, deferred income and other liabilities. Subsequently, the Group s liability under each guarantee is measured at the higher of: (a) the amount initially recognised reduced by the cumulative amortised premium which is periodically recognised in the consolidated income statement in Fee and commission income in accordance with the terms of the guarantee, and (b) the best estimate of the expenditure required to settle any financial obligation arising as a result of the guarantee. Any increase in the liability relating to financial guarantees is recognised in the consolidated income statement in Provisions for impairment of loans and advances to customers and other customer credit losses. The balance of the liability for financial guarantees that remains is recognised in Fee and commission income in the consolidated income statement when the guarantee is fulfilled, cancelled or expired Comparative information As described in Note 2.1, the Group is considered to be a continuation of the BOC group. As a result, the Consolidated Financial Statements, including comparative amounts, were prepared as if the Group existed at the beginning of the earlier period presented in the Consolidated Financial Statements. In addition reclassifications to comparative information were made to conform to current year presentation. Specifically, special levy on deposits on credit institutions in Cyprus amounting to 19,968 thousand was reclassified from Other operating expenses to being presented separately on the face of the consolidated income statement. Additionally, negative interest income on loans and advances to banks and central banks amounting to 3,716 thousand was reclassified from Interest income (Note 7) to Interest expense (Note 8). Such reclassification did not have an impact on the results for the year or equity of the Group. 3. Going concern The Directors have made an assessment of the Group s ability to continue as a going concern. The conditions that existed during 2017 and the developments up to the date of approval of these Consolidated Financial Statements that have been considered in the going concern assessment include, amongst others, the operating environment in Cyprus and of the Group (Note 4). The Directors believe that the Group is taking all necessary measures to maintain its viability and the development of its business in the current economic environment. The Directors, taking into consideration the factors described below and the uncertainties that existed at the reporting date, are satisfied that the Group has the resources to continue in business for a period of at least 12 months from the date of approval of the Consolidated Financial Statements and, therefore, the going concern principle is appropriate for the reasons set out below. The Common Equity Tier 1 (CET1) ratio and the total capital ratio on a transitional basis stood at 12.7% and 14.2% respectively at 31 December 2017, higher than the minimum required ratios (Note 4.2.1). The IFRS 9 impact on a transitional and on a fully phased-in basis, after the period of transition is complete, is expected to be manageable and within the Group s capital plan. The increasing level of Group customer deposits (increase of 1,340 million during 2017). Customer deposits stood at 17,850 million at 31 December The continuous improvement in the Group liquidity position and its liquidity ratios. Following the repayment of Emergency Liquidity Assistance (ELA) in January 2017 (2016: 200 million), the Group achieved compliance with the Liquidity Coverage Ratio (LCR). The Group is also in compliance with the LCR add-on, which was introduced by the CBC as a macro-prudential measure and is applicable from 1 January 2018 (Notes and 46). As at 31 December 2017, the Group was not in compliance with all liquidity regulatory requirements with respect to its operations in Cyprus, however, these ratios were abolished on 1 January
63 3. Going concern (continued) The significant reduction of Group loans that are impaired or past due for more than 90 days (90+ DPD), which have decreased by 17% during 2017 and totalled 6,905 million at 31 December 2017 and the increase of provisions coverage to 61% compared to 54% at 31 December 2016 (Note 4.2.2). The Cyprus government rating has been repeatedly upgraded following the consistent outperformance in public finances and the progress achieved in the banking sector. Most recently in March 2018, S&P Global Ratings affirmed its long-term sovereign rating at BB+, only one notch below investment grade, and maintained its outlook to positive. Ιn October 2017, Fitch Ratings upgraded its Long-Term Issuer Default ratings to BB from BB- with positive outlook. In July 2017, Moody s Investors Service upgraded the longterm issuer rating of the Cyprus sovereign to Ba3 from B1 to reflect Cyprus economic recovery and maintained its outlook to positive. Moody s Investors Service reiterated its credit rating and positive outlook on the Cyprus sovereign in a February 2018 update. BOC PCL regained access to the debt capital markets in January 2017 with the issuance of a 250 million unsecured subordinated Tier 2 Capital Note. 4. Operating environment 4.1 Cyprus Economic recovery in Cyprus accelerated in 2017 and the medium term outlook is favourable driven by an improving labour market, broadening investments and increasing resilience. Cyprus continues to face challenges primarily in relation to public and private indebtedness and NPEs, but while more remains to be done, considerable progress has been achieved. Real GDP in Cyprus increased by 3.9% in 2017 according to the Cyprus Statistical Service, compared with a 3.4% increase the previous year. In the labour market, the unemployment rate dropped to 11% on average in the year from 13% the year before according to the Cyprus Statistical Service. Average consumer inflation was marginally positive at 0.5% after four years of deflation. In the public sector the budget surplus increased significantly and the trend in the public debt to GDP ratio appears to be reversing downwards. In the banking sector funding conditions continued to improve against a backdrop of favourable developments regarding NPEs. The growth momentum is expected to be maintained in the medium term. Real GDP is expected to grow by 3.6% in 2018 and by 2.9% in 2019, slowing towards 2.5% by 2022 according to the International Monetary Fund (IMF) (Cyprus country report, December 2017). Growth will be supported by private consumption and investment expenditures and by an improving and robust labour market. On the supply side, growth is expected to be driven by favourable developments in the tourism sector and robust performance in business services. Tourism remains robust and continues to benefit from geopolitical uncertainties in competing destinations. Tourist arrivals in 2017 reached 3.7 million persons, an all-time high, and revenues reached an estimated 2.6 billion or c.13.7% of GDP. The budget surplus increased to 1.9% of GDP in 2017 according to estimates by the IMF (Cyprus country report, December 2017), from 0.5% the previous year. The budget is expected to generate sizeable surpluses in the medium term (IMF, Cyprus country report, December 2017). The debt to GDP ratio is estimated at 97.5% in 2017 according to the Cyprus Statistical Service, and it is expected to decline to 75% by 2022 also according to the IMF (Cyprus country report, December 2017). Debt remains affordable with interest charges at 2.6% of GDP in compared with 3.3% of GDP in 2013 (IMF, Cyprus country report, December 2017). The government took advantage of favourable conditions in debt markets to issue a new 850 million 7-year bond in June 2017 yielding 2.8% to pre-finance borrowing needs through to end-2018, and to smooth its repayment schedule beyond In the banking sector there have been significant improvements in funding conditions and asset quality. Total deposits increased marginally by 0.8% in the year, with resident deposits increasing by 3.3%. Loan deleveraging continued in the year with total loans outstanding dropping by 7.1% and loans to residents dropping by 4.8% (according to CBC data). Cyprus consistent fiscal outperformance and favourable outlook indicate a more rapid reversal in the public debt ratio and the ratio of NPEs, than previously expected. The outlook over the medium term is generally positive according to the IMF and the European Commission, while the economy continues to face challenges. Upside factors relate to a longer period of low oil prices, further improvement of economic fundamentals in the euro area and stronger investment spending as property prices are stabilising and as projects in tourism, energy and public works are being implemented. Downside risks to this outlook are associated with the still high levels of NPEs and public debt ratio, and with a possible deterioration of the external environment. 61
64 4. Operating environment (continued) 4.1 Cyprus (continued) The Cyprus government rating has been repeatedly upgraded following the consistent outperformance in public finances and the progress achieved in the banking sector. Most recently in March 2018, S&P Global Ratings affirmed its long-term sovereign rating at BB+, only one notch below investment grade, and maintained its outlook to positive. Ιn October 2017, Fitch Ratings upgraded its Long-Term Issuer Default ratings to BB from BB- with positive outlook. In July 2017, Moody s Investors Service upgraded the long-term issuer rating of the Cyprus sovereign to Ba3 from B1 to reflect Cyprus economic recovery and maintained its outlook to positive. Moody s Investors Service reiterated its credit rating and positive outlook on the Cyprus sovereign in a February 2018 update. 4.2 The Group Regulatory capital ratios The CET1 ratio of the Group at 31 December 2017 stands at 12.7% and the total capital at 14.2% on a transitional basis. The minimum Pillar I total capital ratio requirement is 8.0% and may be met, in addition to the 4.5% CET1 requirement, with up to 1.5% of Additional Tier 1 capital and with up to 2.0% of Tier 2 capital. The Group is also subject to additional capital requirements for risks which are not covered by the Pillar I capital requirements (Pillar II add-ons). The Group s minimum phased-in CET1 capital ratio requirement for 2017 was 9.50%, comprised of a 4.50% Pillar I requirement, a 3.75% Pillar II requirement and the Capital Conservation Buffer (CCB) of 1.25% applicable for Following the Supervisory Review and Evaluation Process (SREP) performed by the ECB in 2017 and based on the confirmation received in December 2017, the Pillar II requirement applicable from 1 January 2018, has been reduced to 3.00% from 3.75%. As a result, the Group s minimum phased-in CET1 capital ratio has been reduced to 9.375% from 9.50%, comprising of a 4.50% Pillar I requirement, a 3.00% Pillar II requirement and the CCB of 1.875% applicable as from 1 January The ECB has also provided revised lower non-public guidance for an additional Pillar II CET1 buffer. The overall Total Capital Ratio Requirement for 2017 was 13.00%, comprising of a Pillar I requirement of 8.00% (of which up to 1.50% can be in the form of Additional Tier 1 capital and up to 2.00% in the form of Tier 2 capital), a Pillar II requirement of 3.75% (in the form of CET1), and the CCB of 1.25% applicable for Following the 2017 SREP, the overall Total Capital Ratio Requirement has been reduced to % from 13.00%, comprising of 8.00% Pillar I requirement, a 3.00% Pillar II requirement and the CCB of 1.875% applicable as from 1 January The minimum CET1 requirement including Pillar II, applicable for the year 2016 was determined by the ECB at 11.75% in November 2015 and included CCB on a fully loaded basis. The above minimum ratios apply for both, BOC PCL and the Group. In January 2017 BOC PCL issued a 250 million unsecured and subordinated Tier 2 Capital Note under BOC PCL s EMTN Programme. The note was priced at par, with a coupon of 9.25% (Note 33). In December 2017, Bank of Cyprus UK Ltd, a 100% subsidiary of BOC PCL issued a 30 million unsecured and subordinated Tier 2 Capital Loan priced at par with a coupon of 8.00% (Note 33). The capital position of the Group and BOC PCL at 31 December 2017 exceeds both their Pillar I and their Pillar II add-on capital requirements. However, the Pillar II add-on capital requirements are a point-in-time assessment and therefore are subject to change over time. 62
65 4. Operating environment (continued) 4.2 The Group (continued) Asset quality The Group s loans that are impaired or past due for more than 90 days (90+ DPD) have decreased by 17% during 2017 and totalled 6,905 million at 31 December 2017, representing 37% of gross loans before fair value adjustment on initial recognition (Note 44). The provisioning coverage ratio improved to 61% at 31 December 2017 compared to 54% at 31 December The Group NPEs, as defined by EBA, totalled 8,804 million at 31 December 2017 and accounted for 47% of gross loans before fair value adjustment on initial recognition. The provisioning coverage ratio of NPEs totalled 48% at 31 December 2017 compared to 41% at 31 December The Group addresses the asset quality challenge through the operation of the Restructuring and Recoveries Division which is actively seeking to find innovative solutions to manage distressed exposures. The Group has been successful in engineering restructuring solutions across the spectrum of its loan portfolio. 90+ DPD have decreased by 47% since their peak of 13,003 million at 31 December NPEs have decreased by 42% since their peak of 15,175 million at 31 March Liquidity Group customer deposits totalled 17,850 million at 31 December 2017 compared to 16,510 million at 31 December Customer deposits in Cyprus reached 15,983 million at 31 December 2017 and 15,043 million at 31 December Customer deposits accounted for 76% of total assets as at 31 December 2017 (compared to 74% at 31 December 2016 and a low of 48% at 31 March 2014). After repayment of the ELA in January 2017, the Group is focusing on measures to improve its liquidity position and continue to exceed the minimum requirement with respect to the LCR, which was increased to 100% from 1 January 2018 onwards. As at 31 December 2017 the LCR stood at 190% for the Group (compared to 49% at 31 December 2016) and was in compliance with the minimum regulatory requirement of 80% applicable for The Net Stable Funding Ratio (NSFR) was not introduced on 1 January 2018 as per expectations. As at 31 December 2017 the Group s NSFR, on the basis of the Basel ΙΙΙ standards, was 111% (compared to 95% at 31 December 2016). As at 31 December 2017, BOC PCL was not in compliance with all the local regulatory liquidity requirements set by the CBC with respect to its operations in Cyprus. On 1 January 2018, the local regulatory liquidity requirements were abolished, in accordance with the CRR and in December 2017 the CBC introduced a macroprudential measure in the form of a liquidity add-on that was imposed on top of the LCR with effect on 1 January The objective of the measure is to ensure that there will be a gradual release of the excess liquidity arising from the lower liquidity requirements under the LCR compared to the ones under the local regulatory liquidity requirements previously in place. The LCR add-on applies stricter outflow and inflow rates than those defined in the Commission Delegated Regulation (EU) 2015/61. The measure will be implemented in two stages. The first stage requires stricter outflow and inflow rates which are applicable from 1 January 2018 until 30 June The second stage requires more relaxed outflow and inflow rates compared to the initial ones and are applicable from 1 July 2018 until 31 December Specifically there will be a reduction of 50% of the LCR add-on rates on 1 July The additional liquidity requirement is expected to be implemented up to 31 December The CBC may propose to modify or extend the period of application of this macro-prudential measure depending on the results of the follow-up of the banks actions on how the excess liquidity is utilised. BOC PCL is currently in compliance with the LCR including the LCR add-on. ELA was fully repaid on 5 January ELA is available to solvent Euro area credit institutions and although BOC PCL has received no specific assurance, management expects that BOC PCL will continue to have access to the central bank liquidity facilities, in line with applicable rules if it were to face a stress event that gave rise to temporary liquidity problems. If a stress event were to occur in the future, BOC PCL would seek to utilise ELA funding, assuming it has sufficient available eligible collateral at the time. 63
66 4. Operating environment (continued) 4.2 The Group (continued) Pending litigation, claims and regulatory matters The management has considered the potential impact of pending litigation and claims, investigations and regulatory matters against the Group. The Group has obtained legal advice in respect of these claims. Despite the novelty of many of the claims such as the bail-in of depositors and the absorption of losses by the holders of equity and debt instruments of BOC PCL and the uncertainties inherent in a unique situation, based on the information available at present and on the basis of the law as it currently stands, management considers that the said claims as well as other pending litigation, claims and regulatory matters are unlikely to have a material adverse impact on the financial position and capital adequacy of the Group. Additional information on pending litigation, claims and regulatory matters is provided in Note Significant judgements, estimates and assumptions The preparation of the Consolidated Financial Statements requires the Company s Board of Directors and management to make judgements, estimates and assumptions that can have a material impact on the amounts recognised in the Consolidated Financial Statements and the accompanying disclosures, as well as the disclosures of contingent liabilities. Uncertainty about these assumptions and estimates could result in outcomes that require a material adjustment to the carrying amount of assets or liabilities affected in future periods. The key assumptions concerning the future and other key sources of estimation of uncertainty at the reporting date, that have a significant risk of causing a material adjustment to the carrying amounts of assets and liabilities are described below. The Group based its assumptions and estimates on parameters available when the Consolidated Financial Statements were prepared. Existing circumstances and assumptions about future developments may, however, change due to market changes or circumstances beyond the control of the Group. Such changes are reflected in the assumptions when they occur. 5.1 Provision for impairment of loans and advances to customers The Group reviews its loans and advances to customers to assess whether a provision for impairment should be recorded in the consolidated income statement. In particular, management is required to estimate the amount and timing of future cash flows in order to determine the amount of provision required and the calculation of the impairment allowance involves the use of judgement. Such estimates are based on assumptions about a number of factors and therefore actual impairment losses may differ. The carrying amount of the loan is reduced through the use of a provision account and the amount of the loss is recognised in the consolidated income statement. Loans together with the associated provisions are written off when there is no realistic prospect of future recovery. Partial write-offs, including non-contractual write-offs, may also occur when it is considered that there is no realistic prospect for the recovery of the contractual cash flows. In addition, write-offs may reflect restructuring activity with customers and are part of the terms of the agreement and subject to satisfactory performance. The Group may change certain estimates from period to period, however it is impracticable to estimate the effect of such individual estimates due to interdependencies between estimates and as the profile of the population of loans changes from period to period. A very important factor for the estimation of provisions is the timing and net recoverable amount from repossession or realisation of collaterals which mainly comprise real estate assets. Assumptions have been made about the future changes in property values, as well as the timing for the realisation of the collateral, taxes and expenses on the repossession and subsequent sale of the collateral as well as any other applicable haircuts. Indexation has been used to estimate updated market values of properties, while assumptions were made on the basis of a macroeconomic scenario for future changes in property values. During 2017, the Group, following a reconsideration of its strategy to more actively explore other innovative strategic solutions to further accelerate balance sheet de-risking, has modified certain of its provisioning assumptions and estimates. 64
67 5. Significant judgements, estimates and assumptions (continued) 5.1 Provision for impairment of loans and advances to customers (continued) At 31 December 2017 the weighted average haircut (including liquidity haircut and selling expenses) used in the collective provisions calculation is c.34% (2016: average of 10% of the current market value of the property for those collaterals for which the increase in their value is capped to zero and 10% of the projected market value of the property for those collaterals for which their value is expected to drop). The timing of recovery from real estate collaterals used in the collective provision calculation has been estimated to be on average 6 years (2016: average of 3 years except for customers in Debt Recovery, average of 6 years). For the calculation of specific provisions, the timing of recovery of collaterals as well as the haircuts used were based on the specific facts and circumstances of each case. In accordance with the Loan Impairment and Provisioning Procedures Directives of 2014 and 2015 of the CBC, the cumulative average future change in property values during the year has been capped to zero. The above assumptions are also influenced by the ongoing regulatory dialogue BOC PCL maintains with its lead regulator, the ECB, and other regulatory guidance and interpretations issued by various regulatory and industry bodies such as the ECB and EBA, which provide guidance and expectations as to relevant definitions and the treatment/classification of certain parameters/assumptions used in the estimation of provisions. Any changes in these assumptions or difference between assumptions made and actual results could result in significant changes in the amount of required provisions for impairment of loans and advances. For individually significant assets, impairment allowances are calculated on an individual basis and all relevant considerations that have a bearing on the expected future cash flows are taken into account (e.g the business prospects for the customer, the realisable value of collateral, the Group s position relative to other claimants, the reliability of customer information and the likely cost and duration of the work-out process). The level of the impairment allowance is the difference between the value of the discounted expected future cash flows (discounted at the loan s original effective interest rate) and its carrying amount. Subjective judgements are made in the calculation of future cash flows. Furthermore, judgements change with time as new information becomes available or as work-out strategies evolve, resulting in frequent revisions to the impairment allowance as individual decisions are taken. Changes in these estimates would result in a change in the allowances and have a direct impact on the impairment charge. In addition to provisions for impairment on an individual basis, the Group also makes collective impairment provisions. The Group adopts a formulaic approach for collective provisions, which includes assigning probabilities of default and loss given default for portfolios of loans. This methodology is subject to estimation uncertainty, partly because it is not practicable to identify losses on an individual loan basis because of the large number of loans in each portfolio. In addition, the use of historical information for probabilities of default and loss rates is supplemented with significant management judgement to assess whether current economic and credit conditions are such that the actual level of incurred losses is likely to be greater or less than that suggested by historical experience. Impairment assessment also includes off-balance sheet credit exposures represented by guarantees given and by irrevocable commitments to disburse funds. Off-balance sheet credit exposures of the individually assessed assets require assumptions on the probability, timing and amount of cash outflows; otherwise the provision is calculated on a collective basis, taking into account the probability of loss for the portfolio in which the customer is included for on-balance sheet exposures impairment assessment. The Group may change certain estimates from period to period, however it is impracticable to estimate the effect of such individual estimates due to interdependencies between estimates and as the profile of the population of off-balance sheet exposure changes from period to period. In normal circumstances, historical experience provides the most objective and relevant information from which to assess inherent loss within each portfolio. In certain circumstances, historical loss experience provides less relevant information about the incurred loss in a given portfolio at the reporting date, for example, where there have been changes in economic, regulatory or behavioural conditions such that the most recent trends in the portfolio risk factors are not fully reflected. In these circumstances, such risk factors are taken into account when calculating the appropriate levels of impairment allowances, by adjusting the provision for impairment derived solely from historical loss experience. 65
68 5. Significant judgements, estimates and assumptions (continued) 5.1 Provision for impairment of loans and advances to customers (continued) The total amount of the Group s provision for impairment of loans and advances is inherently uncertain because it is highly sensitive to changes in economic and credit conditions across a number of geographical areas. Loans subject to collective impairment assessment whose terms have been renegotiated are no longer considered past due and are treated as up to date loans for measurement purposes. Loans subject to collective impairment assessment whose terms have been renegotiated are taken into account in determining the inputs for collective impairment calculation. Loans subject to individual impairment assessment, whose terms have been renegotiated, are subject to ongoing review to determine whether they remain impaired. The carrying amounts of loans that have been classified as renegotiated retain this classification in accordance with the rules of the relevant EBA technical standard. Economic and credit conditions within geographical areas are influenced by many factors with a high degree of interdependency so that there is no one single factor to which the Group s loan impairment provisions as a whole are particularly sensitive. Different factors are applied in each country to reflect the local economic conditions, laws and regulations and the assumptions underlying this judgement are highly subjective. The methodology and the assumptions used in calculating impairment losses are reviewed regularly. It is possible that the actual results could be different from the assumptions made, resulting in a material adjustment to the carrying amount of loans and advances. Further details on impairment allowances and related credit information are set out in Note Fair value of investments and derivatives The best evidence of fair value is a quoted price in an actively traded market. If the market for a financial instrument is not active, a valuation technique is used. The majority of valuation techniques employed by the Group use only observable market data and so the reliability of the fair value measurement is relatively high. However, certain financial instruments are valued on the basis of valuation techniques that feature one or more significant inputs that are not observable. Valuation techniques that rely on non-observable inputs require a higher level of management judgement to calculate a fair value than those based wholly on observable inputs. Valuation techniques used to calculate fair values include comparisons with similar financial instruments for which market observable prices exist, discounted cash flow analysis and other valuation techniques commonly used by market participants. Valuation techniques incorporate assumptions that other market participants would use in their valuations, including assumptions about interest rate yield curves, exchange rates, volatilities and default rates. When valuing instruments by reference to comparable instruments, management takes into account the maturity, structure and rating of the instrument with which the position held is being compared. The Group only uses models with unobservable inputs for the valuation of certain unquoted equity investments. In these cases, estimates are made to reflect uncertainties in fair values resulting from a lack of market data inputs, for example, as a result of illiquidity in the market. Inputs into valuations based on unobservable data are inherently uncertain because there is little or no current market data available from which to determine the level at which an arm s length transaction would occur under normal business conditions. Unobservable inputs are determined based on the best information available. Further details on the fair value of assets and liabilities are disclosed in Note Impairment of available-for-sale investments Available-for-sale investments in equity securities are impaired when there has been a significant or prolonged decline in their fair value below cost. The determination of what is significant or prolonged requires judgement by management. Management has assessed that a loss of 25% or more is considered significant, except in the cases of investment companies where higher limits are set. Prolonged has been assessed by management to be a period of 12 months or more. The factors which are evaluated include the expected volatility in share prices. In addition, impairment may be appropriate when there is evidence that significant adverse changes have taken place in the technological, market, economic or legal environment in which the investee operates. 66
69 5. Significant judgements, estimates and assumptions (continued) 5.3 Impairment of available-for-sale investments (continued) Available-for-sale investments in debt securities are impaired when there is objective evidence of impairment as a result of one or more events that occurred after the initial recognition of the investment and the event (or events) has an impact on the estimated future cash flows of the investment. Such impairment review takes into account a number of factors such as the financial condition of the issuer, any breach of contract, the probability that the issuer will enter bankruptcy or other financial reorganisation, which involves a high degree of judgement, as well as changes in the fair value of individual instruments such as when their fair value at the reporting date falls below 90% of the instruments amortised cost. Further details on impairment of available-for-sale investments are presented in Notes 16 and Retirement benefits The cost of defined benefit pension plans is determined using actuarial valuations. The actuarial valuations involve making assumptions about discount rates, the expected rate of return on plan assets, future salary increases, mortality rates as well as future pension increases where necessary. The Group s management sets these assumptions based on market expectations at the reporting date using its best estimates for each parameter covering the period over which the obligations are to be settled. In determining the appropriate discount rate, management considers the yield curve of high quality corporate bonds. In determining other assumptions, a certain degree of judgement is required. Future salary increases are based on expected future inflation rates for the specific country plus a margin to reflect the best possible estimate relating to parameters such as productivity, workforce maturity and promotions. The expected return on plan assets is based on the composition of each fund s plan assets, estimating a different rate of return for each asset class. Estimates of future inflation rates on salaries and expected rates of return of plan assets represent management s best estimates for these variables. These estimates are derived after consultation with the Group s advisors, and involve a degree of judgement. Due to the long-term nature of these plans, such estimates are inherently uncertain. Further details on retirement benefits are disclosed in Note General insurance business The Group is engaged in the provision of general insurance services. Risks under these policies usually cover a period of 12 months. The liabilities for outstanding claims arising from insurance contracts issued by the Group are calculated based on case estimates by loss adjusters and facts known at the reporting date. With time, these estimates are reconsidered and any adjustments are recognised in the financial statements of the period in which they arise. The principal assumptions underlying the estimates for each claim are based on past experience and market trends, and take into consideration claim handling costs. Other external factors that may affect the estimate of claims, such as recent court rulings and the introduction of new legislation are also taken into consideration. Provision is also made for claims incurred but not reported (IBNR) by the reporting date. Past experience as to the number and amount of claims reported after the reporting date is taken into consideration in estimating the IBNR provision. Insurance contract liabilities are sensitive to changes in the above key assumptions. The sensitivity of certain assumptions, such as the introduction of new legislation and the rulings of certain court cases, are very difficult to quantify. Furthermore, the delays that arise between the occurrence of a claim and its subsequent notification and eventual settlement increase the uncertainty existing at the reporting date. Further information on general insurance business is disclosed in Note
70 5. Significant judgements, estimates and assumptions (continued) 5.6 Life insurance business The Group is engaged in the provision of life insurance services. Whole life insurance plans (life plans) relate to plans associated with assets where the amount payable in the case of death is the greater of the sum insured and the value of investment units. Simple insurance or temporary term plans (term plans) relate to fixed term duration plans for protection against death. In case of death within the coverage period, the insured sum will be paid. Endowment insurance (investment plans/mortgage plans/horizon plans) refer to specific duration plans linked to investments, to create capital through systematic investment in association with death insurance coverage whereby the higher of the sum insured and the value of investment units is payable on death within the contract term. Further information on life insurance business is disclosed in Note Value of in-force business The value of the in-force business asset represents the present value of future profits expected to arise from the portfolio of in-force life insurance. The valuation of this asset requires assumptions to be made about future economic and operating conditions which are inherently uncertain and changes could significantly affect the value attributed to these assets. The methodology used and the key assumptions that have been made in determining the carrying value of the in-force business asset at 31 December 2017, are set out in Note Insurance liabilities The calculation of liabilities and the choice of assumptions regarding insurance contracts require the management of the Group to make significant estimates. The assumptions underlying the estimates for each claim are based on past experience, internal factors and conditions, as well as external factors which reflect current market prices and other published information. The assumptions and judgements are determined at the date of valuation of liabilities and are assessed systematically so that the reliability and realistic position can be ensured. Estimates for insurance contracts are made in two stages. Initially, at the start of the contract, the Group determines the assumptions regarding future deaths, voluntary terminations, investment returns and administration expenses. Subsequently, at each reporting date, an actuarial valuation is performed which assesses whether liabilities are adequate according to the most recent estimates. The assumptions with the greatest influence on the valuation of insurance liabilities are presented below: Mortality and morbidity rates Assumptions are based on standard national tables of mortality and morbidity, according to the type of contract. In addition, a study is performed based on the actual experience (actual deaths) of the insurance company for comparison purposes and if sufficient evidence exists which is statistically reliable, the results are incorporated in these tables. An increase in mortality rates will lead to a larger number of claims (or claims could occur sooner than anticipated), which will increase the expenditure and reduce profits for shareholders. Investment return and discount rate The weighted average rate of return is derived based on assets that are assumed to back liabilities, consistent with the long-term investment strategy of the Group. These estimates are based on current market returns as well as expectations about future economic and financial developments. An increase in investment returns would lead to an increase in profits for shareholders. Management expenses Assumptions are made for management fees and contract maintenance as well as for general expenses, and are based on the actual costs of the Group. An assumption is also made for the rate of increase in expenses in relation to the annual inflation rate. An increase in the level of expenses would reduce profits for shareholders. 68
71 5. Significant judgements, estimates and assumptions (continued) 5.6 Life insurance business (continued) Insurance liabilities (continued) Lapses Each year an analysis of contract termination rates is performed, using actual data from the insurance company incorporation until the immediate preceding year. Rates vary according to the type and duration of the plan. According to the insurance legislation of Cyprus, no assumption is made for policy termination rates in the actuarial valuation. Further details on insurance liabilities are disclosed in Note Tax The Group operates and is therefore subject to tax in various countries. Estimates are required in determining the provision for taxes at the reporting date. The Group recognises income tax liabilities for transactions and assessments whose tax treatment is uncertain. Where the final tax is different from the amounts initially recognised in the consolidated income statement, such differences will impact the income tax expense, the tax liabilities and deferred tax assets or liabilities of the period in which the final tax is agreed with the relevant tax authorities. Deferred tax assets are recognised by the Group in respect of tax losses to the extent that it is probable that future taxable profits will be available against which the losses can be utilised. Judgement is required to determine the amount of deferred tax assets that can be recognised, based upon the likely timing and level of future taxable profits, together with future tax-planning strategies. These variables have been established on the basis of significant management judgement and are subject to uncertainty. It is possible that the actual future events could be different from the assumptions made, resulting in a material adjustment to the carrying amount of deferred tax assets. The assumptions with greater influence on deferred tax are disclosed in Note Exercise of significant influence The Group determines whether it exercises significant influence on companies in which it has shareholdings of less than 20% if other factors exist that demonstrate significant influence. In performing this assessment it considers its representation in the Board of Directors which gives rise to voting rights of more than 20% and participation in policy-making processes, including participation in decisions about dividends and other distributions. 5.9 Fair value of properties held for own use and investment properties The Group s accounting policy for property held for own use, as well as for investment property requires that it is measured at fair value. In the case of property held for own use, valuations are carried out periodically so that the carrying value is not materially different from the fair value, whereas in the case of investment properties, the fair value is established at each reporting date. Valuations are carried out by qualified valuers by applying valuation models recommended by the Royal Institution of Chartered Surveyors and the International Valuation Standards Council. In arriving at their estimates of the fair values of properties, the valuers used their market knowledge and professional judgement and did not rely solely on historical transactional comparables, taking into consideration that there is a greater degree of uncertainty than that which exists in a more active market. Depending on the nature of the underlying asset and available market information, the determination of the fair value of property may require the use of estimates such as future cash flows from assets and discount rates applicable to those assets. All these estimates are based on local market conditions existing at the reporting date. Further information on inputs used is disclosed in Note
72 5. Significant judgements, estimates and assumptions (continued) 5.10 Stock of property estimation of net realisable value Stock of property is measured at the lower of cost and net realisable value. The net realisable value is determined through valuation techniques, requiring significant judgement, which take into account all available reference points such as, expert valuation reports, current market conditions, the holding period of the asset applying an appropriate illiquidity discount and any other relevant parameters. Selling expenses are always considered and deducted from the realisable value. Depending on the value of the underlying asset and available market information, the determination of costs to sell may require professional judgement which involves a large degree of uncertainly due to the relatively low level of market activity. More details on the stock of property are presented in Note Provisions The accounting policy for provisions is described in Note Judgement is involved in determining whether a present obligation exists and in estimating the probability, timing and amount of any outflows. Provisions for pending litigations, claims and regulatory matters usually require a higher degree of judgement than other types of provisions. It is expected that the Group will continue to have a material exposure to litigation and regulatory proceedings and investigations relating to legacy issues in the medium term. The matters for which the Group determines that the probability of a future loss is more than remote will change from time to time, as will the matters as to which a reliable estimate can be made and the estimated possible loss for such matters. Actual results may prove to be significantly higher or lower than the estimate of possible loss in those matters, where an estimate was made. In addition, loss may be incurred in matters with respect to which the Group believed the probability of loss was remote. For a detailed description of the nature of uncertainties and assumptions and the effect on the amount and timing of pending litigation, claims and regulatory matters refer to Note Segmental analysis The Group is organised into operating segments based on the geographic location of each unit. The main geographical locations that the Group operates in, are Cyprus and the United Kingdom. In addition, the Cyprus segment is further organised into operating segments based on the line of business. The remaining Group s activities in Greece, Romania and Russia are separate operating segments for which information is provided to management but, due to their size, have been grouped for disclosure purposes into one segment, namely Other countries. The Group s activities in Cyprus, the United Kingdom and other countries include mainly the provision of banking, financial and insurance services, as well as the management of properties either held as stock or as investment property. Management monitors the operating results of each business segment separately for the purposes of performance assessment and resource allocation. Segment performance is evaluated based on profit after tax and non-controlling interests. Inter-segment transactions and balances are eliminated on consolidation and are made on an arm s length basis. Operating segment disclosures are provided as presented to the Group Executive Committee. The loans and advances to customers, the customer deposits and the related income and expense are generally included in the segment where the business is originated, instead of the segment where the transaction is recorded. Loans and advances to customers which are originated in countries where the Group does not have operating entities are included in the segment where they are managed. 70
73 6. Segmental analysis (continued) 2017 Cyprus United Kingdom Other countries Total Net interest income/(expense) 547,070 39,219 (3,549) 582,740 Net fee and commission income 172,486 6,857 1, ,398 Net foreign exchange gains/(losses) 45, (880) 45,409 Net gains/(losses) on financial instrument transactions and disposal/dissolution of subsidiaries 3,020 (44) (12) 2,964 Insurance income net of claims and commissions 48,760-1,641 50,401 Net losses from revaluation and disposal of investment properties Net gains/(losses) on disposal of stock of property (2,487) - (1,574) (4,061) 31,512 - (1,065) 30,447 Other income 17, ,689 19,052 Staff costs (excluding voluntary exit plan and other termination benefits) (Note 14) Staff costs voluntary exit plan and other termination benefits (Note 14) 863,645 46,400 (2,695) 907,350 (203,121) (22,893) (1,654) (227,668) (544) - - (544) Special levy on deposits on credit institutions (22,846) - - (22,846) Other operating expenses (excluding advisory and other restructuring costs) (Note 15) Other operating expenses - advisory and other restructuring costs (Note 15) Gain on derecognition of loans and advances to customers and changes in expected cash flows (Provisions)/reversal of provisions for impairment of loans and advances to customers and other customer credit losses (Impairment)/reversal of impairment of other financial instruments (199,075) (58,836) (11,268) (269,179) (28,267) - (533) (28,800) 409,792 (35,329) (16,150) 358, , ,443 (934,668) 3,222 (21,480) (952,926) (11,956) - 5,497 (6,459) Impairment of non-financial instruments (22,267) - (36,705) (58,972) Share of profit from associates and joint ventures 8, ,957 Loss before tax (376,729) (32,077) (68,838) (477,644) Income tax (72,516) (1,108) (3,057) (76,681) Loss after tax (449,245) (33,185) (71,895) (554,325) Non-controlling interests-loss 2, ,473 Loss after tax attributable to the owners of the Company (446,772) (33,185) (71,895) (551,852) 71
74 6. Segmental analysis (continued) 2016 Cyprus United Kingdom Other countries Total Net interest income 643,259 31,307 11, ,182 Net fee and commission income 159,181 6,083 1, ,658 Net foreign exchange gains 28, ,069 43,471 Net gains on financial instrument transactions and disposal/dissolution of subsidiaries 63, ,373 Insurance income net of claims and commissions 43, ,432 Net gains/(losses) from revaluation and disposal of investment properties Net gains/(losses) on disposal of stock of property 5,315 - (341) 4,974 2,050 - (689) 1,361 Other income 12, ,371 14,905 Staff costs (excluding voluntary exit plan and other termination benefits) (Note 14) Staff costs voluntary exit plan and other termination benefits (Note 14) 957,265 37,888 30,203 1,025,356 (207,045) (15,339) (2,041) (224,425) (62,521) (226) - (62,747) Special levy on deposits on credit institutions (19,968) - - (19,968) Other operating expenses (excluding advisory and other restructuring costs) (Note 15) Other operating expenses - advisory and other restructuring costs (Note 15) Gain on derecognition of loans and advances to customers and changes in expected cash flows (Provisions)/reversal of provisions for impairment of loans and advances to customers and other customer credit losses (Impairment)/reversal of impairment of other financial instruments (130,106) (33,791) (7,548) (171,445) (48,579) (516) (2,447) (51,542) 489,046 (11,984) 18, ,229 63, ,315 (379,984) 3,281 (56,906) (433,609) (12,316) - 1,023 (11,293) Impairment of non-financial instruments (23,087) - (13,133) (36,220) Share of profit from associates and joint ventures 8, ,194 Profit/(loss) before tax 145,111 (8,646) (50,849) 85,616 Income tax (18,230) (1,126) 971 (18,385) Profit/(loss) after tax 126,881 (9,772) (49,878) 67,231 Non-controlling interests-profit (3,575) - - (3,575) Profit/(loss) after tax attributable to the owners of BOC PCL 123,306 (9,772) (49,878) 63,656 72
75 6. Segmental analysis (continued) Analysis of total revenue Total revenue includes net interest income, net fee and commission income, net foreign exchange gains, net gains on financial instrument transactions and disposal/dissolution of subsidiaries, insurance income net of claims and commissions, net (losses)/gains from revaluation and disposal of investment properties, net gains on disposal of stock of property and other income Cyprus United Kingdom Other countries Total Total revenue from third parties 854,203 47,550 5, ,350 Inter-segment revenue/(expense) 9,442 (1,150) (8,292) - Total revenue 863,645 46,400 (2,695) 907, Total revenue from third parties 941,929 39,877 43,550 1,025,356 Inter-segment revenue/(expense) 15,336 (1,989) (13,347) - Total revenue 957,265 37,888 30,203 1,025,356 The revenue for Cyprus operating segment is further analysed in analysis by business line in this note. The revenue for other countries segment mainly relates to banking and financial services for both 2017 and Analysis of assets 2017 Cyprus United Kingdom Other countries Total Assets 21,712,481 2,153, ,847 24,266,000 Inter-segment assets (667,400) Total assets 23,598,600 Non-current assets 1,613,297 19, ,418 1,735, Assets 20,851,999 1,658, ,645 23,264,981 Inter-segment assets (1,093,046) Total assets 22,171,935 Non-current assets 1,348,867 13, ,009 1,509,186 Non-current assets for this purpose consist of property and equipment, intangible assets, stock of property and non-financial other assets with expected maturity of over one year. 73
76 6. Segmental analysis (continued) Analysis of liabilities 2017 Cyprus United Kingdom Other countries Total Liabilities 18,935,166 2,060, ,183 21,651,833 Inter-segment liabilities (669,941) Total liabilities 20,981, Liabilities 17,577,993 1,595, ,457 20,162,255 Inter-segment liabilities (1,096,425) Total liabilities 19,065,830 Segmental analysis of customer deposits and loans and advances to customers is presented in Notes 31 and 44, respectively. Analysis by business line In addition to monitoring operations by geographical location, management also monitors the operating results of each business line for the Cyprus segment of the Group, and such information is presented to the Group Executive Committee. Income and expenses directly associated with each business line are included in determining the line s performance. Transfer pricing methodologies are applied between the business lines to present their results on an arm s length basis. Total other operating income includes net foreign exchange gains, net gains on financial instrument transactions and disposal/dissolution of subsidiaries, insurance income net of claims and commissions, net (losses)/gains from revaluation and disposal of investment properties, net gains on disposal of stock of property and other income. Total other operating income, staff costs and other operating expenses incurred directly by the business lines are allocated to the business lines as incurred. Indirect other operating income and indirect other operating expenses are allocated to the head office function. Management monitors the profit/(loss) before tax of each business line. Additionally, for the purposes of the Cyprus analysis by business line, notional tax at the 12.5% Cyprus tax rate is charged/credited on profit or loss before tax of each business line and therefore any taxable and non-taxable items are excluded from this notional charge/credit. The Corporate, Small and medium-sized enterprises and Retail business lines are managing loans and advances to customers as detailed in Credit risk concentration of loans and advances to customers (Note 44). Restructuring and recoveries is the specialised unit which was set up to tackle the Group s loan portfolio quality and manages exposures to borrowers in distress situation through innovative solutions. International banking services specialises in the offering of banking services to the international corporate and non-resident individuals, particularly international business companies whose ownership and business activities lie outside Cyprus. Wealth management oversees the provision of institutional wealth private banking, global markets, brokerage, asset management, investment banking and depository services. Real Estate Management Unit manages properties acquired through debt-for-property swaps and properties acquired through the acquisition of certain operations of Laiki Bank in 2013, and executes exit strategies in order to monetise these assets. Insurance business line is involved in both life and general insurance business. The business line Other includes head office functions such as treasury, finance, risk management, compliance, legal, corporate affairs and human resources. Head office functions provide services to the operating segments. 74
77 Segmental analysis (continued) Analysis by business line (continued) Corporate Small and mediumsized enterprises Retail Restructuring and recoveries International banking services Wealth management REMU Insurance Other Net interest income/(expense) 100,471 50, , ,780 66,174 9,728 (17,944) 428 (6,651) 547,070 Net fee and commission income/(expense) 13,740 9,875 49,589 13,085 66,746 2,526 - (4,929) 21, ,486 Total other operating income , ,412 3,334 33,369 49,235 44, ,089 Total Cyprus 114,924 60, , , ,332 15,588 15,425 44,734 59, ,645 Staff costs and other operating expenses (11,643) (11,089) (111,604) (34,371) (25,351) (4,321) (7,695) (17,866) (201,102) (425,042) Restructuring costs voluntary exit plan and other termination benefits (206) (338) (544) Restructuring costs other operating expenses (16,903) - (2) (6,294) - (5,068) (28,267) Gain on derecognition of loans and advances to customers and changes in expected cash flows (Provisions)/reversal of provisions for impairment of loans and advances to customers and other customer credit losses 103,281 49, ,848 92, ,981 11,265 1,436 26,662 (147,222) 409,792 15,825 4,428 13, , , ,413 (20,940) (13,512) (48,032) (841,480) (10,666) (486) (934,668) Impairment of other financial instruments (11,956) (11,956) Impairment of non-financial instruments (21,588) (62) (617) (22,267) Share of profit from associates and joint ventures ,957 8,957 Profit/(loss) before tax 98,166 40, ,139 (612,261) 105,250 10,818 (20,152) 26,600 (147,795) (376,729) Income tax (12,271) (5,063) (15,267) 76,533 (13,156) (1,352) 2,519 (1,400) (103,059) (72,516) Profit/(loss) after tax 85,895 35, ,872 (535,728) 92,094 9,466 (17,633) 25,200 (250,854) (449,245) Non-controlling interests-loss ,473 2,473 Profit/(loss) after tax attributable to the owners of the Company 85,895 35, ,872 (535,728) 92,094 9,466 (17,633) 25,200 (248,381) (446,772) 75
78 Segmental analysis (continued) Analysis by business line (continued) Corporate Small and mediumsized enterprises Retail Restructuring and recoveries International banking services Wealth management REMU Insurance Other Net interest income/(expense) 81,408 61, , ,743 62,292 10,861 (12,757) 417 (9,175) 643,259 Net fee and commission income/(expense) 9,959 8,825 45,832 12,105 65,072 2,032 - (4,366) 19, ,181 Total other operating income , ,403 4,146 4,124 44,470 88, ,825 Total Cyprus 91,926 70, , , ,767 17,039 (8,633) 40,521 98, ,265 Staff costs and other operating expenses (11,475) (11,490) (117,175) (32,959) (23,365) (4,409) (9,253) (14,461) (132,532) (357,119) Restructuring costs voluntary exit plan and other termination benefits (968) (1,139) (22,930) (8,237) (4,468) (224) (97) (3,269) (21,189) (62,521) Restructuring costs other operating expenses (18) (6) (253) (14,473) (65) (8) (4,548) - (29,208) (48,579) Gain on derecognition of loans and advances to customers and changes in expected cash flows Reversal of provisions/(provisions) for impairment of loans and advances to customers and other customer credit losses 79,465 58, , , ,869 12,398 (22,531) 22,791 (84,004) 489,046 3,049 4,030 11,710 41,423 1, ,258 30,083 (14,690) 7,370 (393,740) (8,006) (1,965) (379,984) Impairment of other financial instruments (12,316) (12,316) Impairment of non-financial instruments (19,542) - (3,545) (23,087) Share of profit from associates and joint ventures ,194 8,194 Profit/(loss) before tax 112,597 47, ,114 (193,632) 100,816 11,292 (42,073) 22,791 (90,473) 145,111 Income tax (14,075) (5,960) (22,014) 24,204 (12,602) (1,412) 5,259 (2,992) 11,362 (18,230) Profit/(loss) after tax 98,522 41, ,100 (169,428) 88,214 9,880 (36,814) 19,799 (79,111) 126,881 Non-controlling interests-profit (3,575) (3,575) Profit/(loss) after tax attributable to the owners of BOC PCL 98,522 41, ,100 (169,428) 88,214 9,880 (36,814) 19,799 (82,686) 123,306 In addition loans and advances to customers and deposits of the above business lines are reported to the Group Executive Committee. Such an analysis is disclosed in Notes 44 and 31 respectively. 76
79 7. Interest income Loans and advances to customers 744, ,906 Loans and advances to banks and central banks 11,742 9,072 Debt securities available-for-sale 19,883 10,905 Investments classified as loans and receivables 2,706 11, , ,092 Trading investments Derivative financial instruments 31,798 4,557 Other investments at fair value through profit or loss , ,298 Interest income from loans and advances to customers includes interest on the recoverable amount of impaired loans and advances as defined in Note 44 amounting to 137,565 thousand (2016: 201,604 thousand). 8. Interest expense Customer deposits 140, ,973 Funding from central banks and deposits by banks 3,979 39,588 Subordinated loan stock 22,258 - Repurchase agreements 10,207 6,476 Negative interest on loans and advances to banks and central banks 7,132 3, , ,753 Derivative financial instruments 44,014 16, , , Fee and commission income and expense Fee and commission income Credit-related fees and commissions 72,484 80,755 Other banking commissions 96,710 75,300 Mutual funds and asset management fees 2,777 2,524 Brokerage commissions Other commissions 17,655 17, , ,865 Mutual funds and asset management fees include income of 2,777 thousand (2016: 2,342 thousand) relating to fiduciary and other similar activities. 77
80 9. Fee and commission income and expense (continued) Fee and commission expense Banking commissions 9,860 9,825 Mutual funds and asset management fees Brokerage commissions ,179 10, Net foreign exchange gains Net foreign exchange gains comprise the conversion of monetary assets in foreign currency at the reporting date, realised exchange gains/(losses) from transactions in foreign currency settled during the year and the revaluation of foreign exchange derivatives. 11. Net gains on financial instrument transactions and disposal/dissolution of subsidiaries Trading portfolio: equity securities 229 (273) - debt securities derivative financial instruments Other investments at fair value through profit or loss: - debt securities (57) (400) - equity securities Net gains on disposal of available-for-sale investments: - equity securities 1,520 58,368 - debt securities 2, Net gains on disposal/repayment of loans and receivables: - debt securities - 8,419 Realised (losses)/gains on disposal of loans (12) 64 Revaluation of financial instruments designated as fair value hedges: - hedging instruments 13,219 3,889 - hedged items (12,990) (3,910) Loss on disposal/dissolution of subsidiaries (2,187) (4,101) 2,964 63,373 The loss on disposal/dissolution of subsidiaries for 2017, primarily relates to loss on disposal of Hotel New Montana SRL. In the comparative period the loss on disposal/dissolution of subsidiaries primarily related to the closure of the operations of Bank of Cyprus (Channel Islands) Ltd. 78
81 11. Net gains on financial instrument transactions and disposal/dissolution of subsidiaries (continued) In the comparative period, the gains on disposal of available-for-sale equity securities, primarily relate to the gain on sale of shares held in Visa Europe Limited following the approved purchase of Visa Europe Limited by Visa Inc and the gains on disposal of debt securities classified as loans and receivables, related to the participation of BOC PCL in the Cyprus Government buyback process of Cyprus government bonds. 12. Insurance income net of claims and commissions Life insurance business General insurance business Income Claims and commissions Insurance income net of claims and commissions Income Claims and commissions Insurance income net of claims and commissions ,259 (74,110) 28, ,261 (80,257) 24,004 44,789 (22,537) 22,252 39,341 (18,913) 20, ,048 (96,647) 50, ,602 (99,170) 44,432 Life insurance General insurance Life insurance General insurance Income Gross premiums 86,277 65,701 83,951 60,215 Reinsurance premiums (14,842) (29,246) (14,671) (27,544) Net premiums 71,435 36,455 69,280 32,671 Change in the provision for unearned premiums - (1,187) - (1,589) Total net earned premiums 71,435 35,268 69,280 31,082 Investment income and other income 22, ,324 8 Commissions from reinsurers and other income 5,924 9,511 4,977 8,251 Change in value of in-force business before tax (Note 26) 99,516 44,789 99,581 39,341 2,743-4, ,259 44, ,261 39,341 79
82 12. Insurance income net of claims and commissions (continued) Life insurance General insurance Life insurance General insurance Claims and commissions Gross payments to policyholders (54,515) (27,017) (59,168) (25,864) Reinsurers share of payments to policyholders 7,837 13,643 8,858 12,004 Gross change in insurance contract liabilities (16,812) (3,177) (19,346) 931 Reinsurers share of gross change in insurance contract liabilities Commissions paid to agents and other direct selling costs (771) (1,476) (2,017) (1,845) (9,849) (4,509) (8,584) (4,143) Changes in equalisation reserve - (1) - 4 (74,110) (22,537) (80,257) (18,913) In addition to the above, the following income and expense items related to the insurance operations have been recognised in the consolidated income statement: Net (expense)/income from non-linked insurance business assets Net (losses)/gains on financial instrument transactions and other non-linked insurance business income Life insurance General insurance Life insurance General insurance (66) 79 (78) 342 (192) (31) Staff costs (5,162) (4,127) (4,560) (4,170) Staff costs restructuring costs (206) - (1,874) (1,395) Other operating expenses (6,021) (2,683) (4,186) (2,049) 13. Other income Profit on disposal of disposal group held for sale (Note ) - 2,545 Dividend income Loss on sale and write-off of property and equipment and intangible assets (208) (67) Rental income from investment properties 2,219 1,626 Rental income from stock of property 7,981 1,460 Profit from hotel and golf activities 3,581 2,051 Other income 4,796 6,947 19,052 14,905 80
83 14. Staff costs Salaries 184, ,175 Employer s contributions to state social insurance 24,913 27,154 Retirement benefit plan costs 17,822 16,096 Restructuring costs voluntary exit plans and other termination benefits 227, , , , ,172 In February and June 2016 the Group proceeded with voluntary exit plans for its employees in Cyprus, the cost of which is included in staff costs and amounted to 62,521 thousand. In total, 429 employees accepted the voluntary exit plan and left the Group during the year Additionally, restructuring costs in 2016 include staff termination benefits amounting to 226 thousand related to the closure of the operations of Bank of Cyprus (Channel Islands) Ltd. During 2017 a small number of employees left the Group under the same terms of the 2016 voluntary exit plan. The cost of this exit amounts to 544 thousand. The number of persons employed by the Group as at 31 December 2017 was 4,355 (2016: 4,284). The following table shows the average number of employees (full-time equivalents) based on their geographical location: Cyprus 4,034 4,125 United Kingdom Other countries ,314 4,389 The following table shows the business line analysis of average employees in Cyprus for 2017 and 2016 and the Group s other geographical locations as follows: Corporate Small and medium-sized enterprises Retail 1,407 1,475 Restructuring and recoveries International banking services Wealth management REMU Insurance Other (primarily head office functions (Note 6)) 1,331 1,323 Total Cyprus 4,034 4,125 UK Other countries ,314 4,389 81
84 14. Staff costs (continued) Retirement benefit plan costs In addition to the employer s contributions to state social insurance, the Group operates plans for the provision of additional retirement benefits as described below: Defined benefit plans 1, Defined contribution plans 15,925 15,690 17,822 16,096 Cyprus The main retirement plan for the Group s permanent employees in Cyprus (84% of total Group employees) is a defined contribution plan. This plan provides for employer contributions of 9% (2016: 9%) and employee contributions of 3%-10% of the employees gross salaries. This plan is managed by a Committee appointed by the members. A small number of employees who do not participate in the main retirement plan, are members of a pension scheme that is closed to new entrants and may receive part or all of their retirement benefit entitlement by way of a pension for life. This plan is managed by an Administrative Committee composed of representatives of both the members and the employer. A small number of employees of Group subsidiaries in Cyprus are also members of defined benefit plans. These plans are funded with assets backing the obligations held in separate legal vehicles. Greece After the disposal of the Greek operations in 2013, a small number of employees of the Group s Greek subsidiaries and the Greek branch of the Company continue to be members of the defined benefit plans. United Kingdom The Group s employees in the United Kingdom (6% of total Group employees) are covered by a defined contribution plan for all current employees which provides for employee contributions of 0%-7.5% on the employees gross salaries and employer contributions of 7.5% plus matching contributions by the employer of up to 7.5% depending on the employee contributions. In addition, a defined benefit plan (which was closed in December 2008 to future accrual of benefits) remains for active members. Other countries The Group does not operate any retirement benefit plans in Romania and Russia. Analysis of the results of the actuarial valuations for the defined benefit plans Amounts recognised in the consolidated balance sheet Liabilities (Note 34) 10,037 22,776 Assets (Note 28) - (668) 10,037 22,108 One of the plans has a funded status surplus of 13,814 thousand (2016: 13,999 thousand) that is not recognised as an asset on the basis that the Group has no unconditional right to future economic benefits either via a refund or a reduction in future contributions. The amounts recognised in the consolidated balance sheet and the movements in the net defined benefit obligation over the years are presented below: 82
85 14. Staff costs (continued) Retirement benefit plan costs (continued) Analysis of the results of the actuarial valuations for the defined benefit plans (continued) Present value of obligation Fair value of plan assets Net amount before impact of asset ceiling Impact of minimum funding requirement/ asset ceiling Net defined benefit liability January ,955 (94,846) 8,109 13,999 22,108 Current service cost Losses on curtailment and settlement 1,150-1,150-1,150 Net interest expense/(income) 2,458 (2,119) Total amount recognised in the consolidated income statement 4,016 (2,119) 1,897-1,897 Remeasurements: - Return on plan assets, excluding amounts included in net interest expense - (5,209) (5,209) - (5,209) - Actuarial loss from changes in financial assumptions Demographic assumptions (2,041) - (2,041) - (2,041) - Experience adjustments (3,950) - (3,950) - (3,950) - Change in asset ceiling (185) (185) Total amount recognised in the consolidated OCI (5,425) (5,209) (10,634) (185) (10,819) Exchange differences (2,551) 1,849 (702) - (702) Contributions: - Employer - (2,447) (2,447) - (2,447) - Plan participants 176 (176) Benefits paid from the plans (16,271) 16, December ,900 (86,677) (3,777) 13,814 10,037 83
86 14. Staff costs (continued) Retirement benefit plan costs (continued) Analysis of the results of the actuarial valuations for the defined benefit plans (continued) Present value of obligation Fair value of plan assets Net amount before impact of asset ceiling Impact of minimum funding requirement/ asset ceiling Net defined benefit liability January ,115 (97,795) (3,680) 15,065 11,385 Current service cost Gains on curtailment and settlement (80) - (80) - (80) Net interest expense/(income) 2,927 (2,910) Total amount recognised in the consolidated income statement 3,316 (2,910) Remeasurements: - Return on plan assets, excluding amounts included in net interest expense - (6,357) (6,357) - (6,357) - Actuarial loss from changes in financial assumptions 21,979-21,979-21,979 - Experience adjustments (301) - (301) - (301) - Change in asset ceiling (1,066) (1,066) Total amount recognised in the consolidated OCI 21,678 (6,357) 15,321 (1,066) 14,255 Exchange differences (9,699) 8,028 (1,671) - (1,671) Contributions: - Employer - (2,195) (2,195) - (2,195) - Plan participants 177 (177) Benefits paid from the plans (6,560) 6, Benefits paid directly by the employer (72) - (72) - (72) 31 December ,955 (94,846) 8,109 13,999 22,108 84
87 14. Staff costs (continued) Retirement benefit plan costs (continued) Analysis of the results of the actuarial valuations for the defined benefit plans (continued) The actual return on plan assets for year 2017 was a gain of 7,328 thousand (2016: gain of 9,267 thousand). The assets of funded plans are generally held in separately administered entities, either as specific assets or as a proportion of a general fund, or as insurance contracts and are governed by local regulations and practice in each country. Pension plan assets are invested in different asset classes in order to maintain a balance between risk and return. Investments are well diversified to limit the financial effect of the failure of any individual investment. Through its defined benefit plans, the Group is exposed to a number of risks as outlined below: Interest rate risk Changes in bond yields Inflation risk Asset volatility The Group is exposed to interest rate risk due to the mismatch of the duration of assets and liabilities. A decrease in corporate bond yields will increase the liabilities, although this will be partially offset by an increase in the value of bond holdings. The Group faces inflation risk, since the liabilities are either directly (through increases in pensions) or indirectly (through wage increases) exposed to inflation risks. Investments to ensure inflation-linked returns (i.e. real returns through investments such as equities, index-linked bonds and assets whose return increase with increasing inflation) could be used for better match with the expected increases in liabilities. The liabilities are calculated using a discount rate set with reference to corporate bond yields; if assets underperform this yield, a deficit will be created. The major categories of plan assets as a percentage of total plan assets are as follows: Equity securities 48% 46% Debt securities 42% 44% Loans and advances to banks 10% 10% 100% 100% The assets held by the funded plans include equity securities issued by the Company, the fair value of which is as at 31 December ,137 thousand (2016: equity securities issued by BOC PCL of fair value 2,433 thousand). The Group expects to make additional contributions to defined benefit plans of 3,055 thousand during At the end of the reporting period, the average duration of the defined benefit obligation was 19.3 years. 85
88 14. Staff costs (continued) Retirement benefit plan costs (continued) Principal actuarial assumptions used in the actuarial valuations The present value of the defined benefit obligations of the retirement plans is estimated annually using the Projected Unit Credit Method of actuarial valuation, carried out by independent actuaries. The principal actuarial assumptions used for the valuations of the retirement plans of the Group during 2017 and 2016 are set out below: 2017 Cyprus Greece UK Discount rate 1.58%-1.68% 1.30%-1.90% 2.55% Inflation rate 1.75% 1.75% 3.20% Future salary increases 2.25% 2.00% n/a Rate of pension increase 2.00% n/a 3.00% Life expectancy for pensioners at age years M 29.6 years F Life expectancy for pensioners at age 65 n/a n/a n/a n/a 23.0 years M 24.5 years F 2016 Discount rate 1.56%-1.83% 1.50%-2.00% 2.70% Inflation rate 1.75% 1.75% 3.30% Future salary increases 2.00% 2.00% n/a Rate of pension increase 2.00% n/a 3.15% Life expectancy for pensioners at age years M 29.6 years F Life expectancy for pensioners at age 65 n/a n/a n/a n/a 23.9 years M 25.4 years F The discount rate used in the actuarial valuations reflects the rate at which liabilities could effectively be settled and is set by reference to market yields at the reporting date in high quality corporate bonds of suitable maturity and currency. For the Group s plans in the Eurozone (Cyprus and Greece) which comprise 17% of the defined benefit obligations, the Group adopted a full yield curve approach using AA- rated corporate bond data from the iboxx Euro Corporates AA10+ index. For the Group s plan in the UK which comprises 83% of the defined benefit obligations, the Group adopted a full yield curve approach using the discount rate that has been set based on the yields on AA- rated corporate bonds with duration consistent with the scheme s liabilities. Under this approach, each future liability payment is discounted by a different discount rate that reflects its exact timing. To develop the assumptions relating to the expected rates of return on plan assets, the Group, in consultation with its actuaries, uses forward-looking assumptions for each asset class reflecting market conditions and future expectations at the reporting date. Adjustments are made annually to the expected rate of return assumption based on revised expectations of future investment performance of asset classes, changes to local legislation that may affect investment strategy, as well as changes to the target strategic asset allocation. A quantitative sensitivity analysis for significant assumptions as at 31 December 2017 and 2016 is presented below. 86
89 14. Staff costs (continued) Retirement benefit plan costs (continued) Principal actuarial assumptions used in the actuarial valuations (continued) Variable Change +0.5% Change -0.5% Change +0.5% Change -0.5% Discount rate -11.4% 12.3% -10.0% 10.9% Inflation growth rate 9.6% -8.9% 8.7% -8.0% Salary growth rate 1.1% -1.0% 0.8% -0.7% Pension growth rate 0.1% -0.1% 0.8% -0.7% Plus 1 year Minus 1 year Plus 1 year Minus 1 year Life expectancy -1.5% 1.9% -1.3% 1.7% The above sensitivity analysis (with the exception of the inflation sensitivity) is based on a change in one assumption while holding all other assumptions constant. In practice this is unlikely to occur and some changes of the assumptions may be correlated. The inflation sensitivity above includes changes to any inflation-linked benefit increases. When calculating the sensitivity of the defined benefit obligation to significant assumptions, the same method has been applied as when calculating the pension liability recognised on the consolidated balance sheet. The methods and types of assumptions used in preparing the sensitivity analysis did not change compared to previous years. 15. Other operating expenses Repairs and maintenance of property and equipment and stock of property ,850 21,705 Other property-related costs 17,590 14,728 Operating lease rentals for property and equipment 10,408 10,512 Consultancy and other professional services fees 19,912 13,972 Insurance 8,203 10,697 Advertising and marketing 18,518 17,502 Depreciation of property and equipment (Note 25) 11,930 11,558 Amortisation of intangible assets (Note 26) 9,404 7,263 Communication expenses 8,739 8,118 Provisions for pending litigation, claims and regulatory matters (Note 34) 97,537 17,840 Printing and stationery 2,964 3,485 Local cash transfer expenses 3,056 2,848 Contribution to depositor protection scheme Other operating expenses 36,823 30, , ,445 Advisory and other restructuring costs 28,800 51, , ,987 87
90 15. Other operating expenses (continued) Advisory and other restructuring costs comprise mainly: (a) fees of external advisors in relation to: (i) customer loan restructuring activities which are not part of the effective interest rate, (ii) the listing on the London Stock Exchange, (iii) disposal of operations and non-core assets and (b) litigation provisions related to the operations of Laiki Bank acquired in The special tax levy on credit institutions in Cyprus (the Special Levy) is imposed on the level of deposits as at the end of the previous quarter, at the rate of % per quarter. Following an amendment of the Imposition of Special Credit Institution Tax Law in 2017, the Single Resolution Fund contribution which is charged annually by the Single Resolution Board, is offset by the Special Levy up to the level of the total annual Special Levy charge. Consultancy and other professional services fees and advisory and other restructuring costs include fees (including taxes) to the independent auditors of the Group, for audit and other professional services provided both in Cyprus and overseas, as follows: Audit of the financial statements of the Group and its subsidiaries 2,570 2,615 Other audit-related services Tax services Services related to the listing on the London Stock Exchange 114 4,879 Other services 499 1,032 4,052 9, Provisions for impairment of financial and non-financial instruments Provisions net of reversals of provisions for impairment of loans and advances to customers and other customer credit losses Loans and advances to customers (Note 44) 937, ,761 Financial guarantees and commitments (Note 34) 14,987 (6,152) 952, ,609 Impairment/(reversal of impairment) of other financial instruments Available-for-sale equity securities Available-for-sale mutual funds - 56 Loans and advances to banks 7,775 13,820 Other receivables (1,379) (3,869) Deposits by banks ,459 11,293 88
91 16. Provisions for impairment of financial and non-financial instruments (continued) Impairment of non-financial instruments Property held for own use (Note 25) 8,470 - Stock of property (Note 27) 50,502 36,220 58,972 36, Income tax Current tax: - Cyprus 3,174 4,776 - overseas 1,827 1,986 Cyprus special defence contribution Deferred tax 67,158 6,657 Prior years tax adjustments 2,917 2,668 Other tax charges 1,430 2,086 76,681 18,385 The Group s share of income tax charge from associates for 2017 amounts to 1,129 thousand (2016: 1,244 thousand). The increase in the deferred tax charge is primarily due to the reduction of the level of deferred tax asset by 62 million following increase in provision for impairment of loans and advances to customers and evaluation of the recoverability assessment of the deferred tax asset balance. The reconciliation between the income tax expense and the (loss)/profit before tax as estimated using the current income tax rates is set out below: (Loss)/profit before tax (477,644) 85,616 Income tax at the normal tax rates in Cyprus (59,529) 10,916 Income tax effect of: - expenses not deductible for income tax purposes 22,054 14,255 - income not subject to income tax (10,825) (21,566) - differences between overseas income tax rates and Cyprus income tax rates 10,213 6,428 - reversal of previously recognised deferred tax asset 66,858 3,598 - losses on which deferred tax was not recognised 43,563-72,334 13,631 Prior years tax adjustments 2,917 2,668 Other tax charges 1,430 2,086 76,681 18,385 89
92 17. Income tax (continued) Income tax in Cyprus is calculated at the rate of 12.5% on taxable income (2016: 12.5%). For life insurance business there is a minimum income tax charge of 1.5% on gross premiums. Special defence contribution is payable on rental income at a rate of 3% (2016: 3%) and on interest income from activities outside the ordinary course of business at a rate of 30% (2016: 30%). The Group s profits from overseas operations are taxed at the rates prevailing in the respective countries, which for 2017 were: Greece 29% (2016: 29%), Romania 16% (2016: 16%), Russia 20% (2016: 20%), UK 20% until 31 March 2017 and 19% thereafter (2016: 20%). The Group is subject to income taxes in the various jurisdictions it operates and the calculation of the Group s income tax charge and provisions for income tax necessarily involves a degree of estimation and judgement. There are transactions and calculations for which the ultimate income tax treatment is uncertain and cannot be determined until resolution has been reached with the relevant tax authority. The Group has a number of open income tax returns with various income tax authorities and liabilities relating to these open and judgemental matters, which are based on estimates of whether additional income taxes will be due. In case the final income tax outcome of these matters is different from the amounts that were initially recorded, such differences will impact the current and deferred income tax assets and liabilities in the period in which such determination is made. The accumulated income tax losses are presented in the table below: 2017 Total income tax losses Income tax losses for which a deferred tax asset was recognised Income tax losses for which no deferred tax asset was recognised Expiring within 5 years 2,761,640-2,761,640 Expiring by the end of ,378,801 3,067,936 4,310,865 10,140,441 3,067,936 7,072, Expiring within 5 years 4,675, ,800 4,408,599 Expiring between 6 and 10 years 16,306-16,306 Expiring by the end of ,378,801 3,336,000 4,042,801 12,070,506 3,602,800 8,467,706 The majority of the deferred tax asset relates to the Laiki Bank income tax losses transferred to BOC PCL as a result of the acquisition of certain operations on 29 March The income tax losses were transferred under The Resolution of Credit and Other Institutions Law which states that any accumulated tax losses of the transferring credit institution at the time of the transfer, are transferred to the acquiring credit institution and may be used by it for a period of up to 15 years from the end of the year during which the transfer took place. In the case of the BOC PCL s acquisition of certain operations of Laiki Bank, these tax losses can be utilised up to The income tax losses transferred are still subject to review and agreement with the income tax authorities in Cyprus. The deferred tax asset recognised on these specific losses can be set off against the future profits of BOC PCL by 2028 at an income tax rate of 12.5%. Recognition of deferred tax assets on unutilised income tax losses is supported by management s business forecasts, taking into account available information and making various assumptions on future growth rates of customer loans, deposits, funding evolution, loan impairment and pricing, and considering the recoverability of the deferred tax assets within their expiry period. 90
93 17. Income tax (continued) Τhe Group performed its assessment for the recoverability of its deferred tax asset as at 31 December 2017 taking into account the Group s actual performance, the key objectives of the Group s strategy as well as the macroeconomic environment in Cyprus, and the detailed financial projections up to the end of 2020 which had been also used to roll out assumptions thereafter until year The key assumptions, amongst others, include the following: New loan originations and repayments Loan and deposit interest income/expense evolution Funding structure and associated cost Diversified income streams Level of operating expenses Level of NPEs (new defaults, curing, cost of risk) The financial projections have taken into account the key objectives of the Group s strategy which are set out below: Materially reduce the level of delinquent loans Further improve the funding structure Focus on the core Cyprus market and the UK operations Achieve a lean operating model Maintain an appropriate capital position by internally generating capital Deliver value to shareholders and other stakeholders Based on the above, management has concluded that the deferred tax asset of 383,498 thousand for the Group as at 31 December 2017 is recoverable. The income tax losses relate to the same jurisdiction to which the deferred tax asset relates. Deferred tax The net deferred tax assets arise from: Difference between capital allowances and depreciation (7,938) (7,794) Property revaluation (17,545) (17,038) Investment revaluation and stock of property (3,807) (3,807) Unutilised income tax losses carried forward 383, ,350 Value of in-force life insurance business (15,093) (14,750) Other temporary differences (1,724) (1,895) Net deferred tax assets 337, ,066 91
94 17. Income tax (continued) Deferred tax (continued) Deferred tax assets 383, ,441 Deferred tax liabilities (46,113) (45,375) Net deferred tax assets 337, ,066 The table below sets out the geographical analysis of the deferred tax assets: Cyprus 383, ,356 United Kingdom - 85 Deferred tax assets 383, ,441 Deferred tax liabilities (46,113) (45,375) Net deferred tax assets 337, ,066 The movement of the net deferred tax assets is set out below: January 405, ,724 Deferred tax recognised in the consolidated income statement (67,158) (6,657) Acquisition of subsidiary (Note ) - (3,807) Deferred tax recognised in the consolidated statement of comprehensive income (522) 219 Foreign exchange adjustments (1) (413) 31 December 337, ,066 The Group offsets income tax assets and liabilities if and only if, it has a legally enforceable right to set off current income tax assets and current income tax liabilities. 92
95 17. Income tax (continued) Deferred tax (continued) The analysis of the net deferred tax expense recognised in the consolidated income statement is set out below: Difference between capital allowances and depreciation Investment revaluation - (90) Reversal of previously recognised deferred tax assets 66,858 3,598 Value of in-force life insurance business Other temporary differences (193) 2,463 67,158 6,657 The analysis of the net deferred tax recognised in the consolidated statement of comprehensive income is set out below: Timing differences on property revaluation (expense)/income (522) Earnings per share Basic and diluted (losses)/earnings per share attributable to the owners of the Company/BOC PCL (Loss)/profit for the year attributable to the owners of the Company/BOC PCL ( thousand) Weighted average number of shares in issue during the year, excluding treasury shares (thousand) (551,852) 63, , ,106 Basic and diluted (losses)/earnings per share ( cent) (123.7) 14.3 The comparative figure for weighted average number of shares has been adjusted to reflect the introduction of the Company as the new holding company of the Group (Note 2.1). 93
96 19. Cash, balances with central banks and loans and advances to banks Cash 143, ,594 Balances with central banks 3,250,029 1,373,802 Cash and balances with central banks 3,393,934 1,506,396 Loans and advances to banks 1,192,633 1,087,837 Balances with central banks include obligatory deposits for liquidity purposes as at 31 December 2017 which amount to 153,733 thousand (2016: 142,697 thousand). The credit rating analysis of balances with central banks and loans and advances to banks by independent credit rating agencies is set out in Note 44. Loans and advances to banks earn interest based on the interbank rate of the relevant term and currency. 20. Investments Investments Investments at fair value through profit or loss 51,467 43,016 Investments available-for-sale 639, ,789 Investments classified as loans and receivables 48,658 68, , ,879 The amounts pledged as collateral under repurchase agreements with banks are shown below: Investments pledged as collateral Investments available-for-sale 290, ,765 All investments pledged as collateral under repurchase agreements can be sold or repledged by the counterparty. The maximum exposure to credit risk for debt securities is disclosed in Note 44 and the debt securities price risk sensitivity analysis is disclosed in Note
97 20. Investments (continued) Investments at fair value through profit or loss Trading investments Other investments at fair value through profit or loss Total Debt securities , ,902 Equity securities 2,644 2,601 4,541 4,030 7,185 6,631 Mutual funds 8,795 9,396 34,951 16,087 43,746 25,483 11,975 12,473 39,492 30,543 51,467 43,016 Debt securities Cyprus government , ,902 Listed on the Cyprus Stock Exchange Listed on other stock exchanges ,426-10, , ,902 Equity securities Listed on the Cyprus Stock Exchange Listed on other stock exchanges 1,965 2,159 3,945 3,102 5,910 5, Unlisted ,644 2,601 4,541 4,030 7,185 6,631 Mutual funds Listed on other stock exchanges 8,795 8, ,795 8,800 Unlisted ,951 16,087 34,951 16,683 8,795 9,396 34,951 16,087 43,746 25,483 The debt securities classified as other investments at fair value through profit or loss were originally classified as such, to eliminate an accounting mismatch with derivatives used to economically hedge these instruments. The unlisted mutual funds classified as other investments at fair value through profit or loss relate to investments whose underlying assets are listed on stock exchanges and are therefore presented in Level 1 hierarchy in Note
98 20. Investments (continued) Investments available-for-sale Debt securities 901, ,592 Equity securities (including preference shares) 27,176 21,683 Mutual funds , ,554 Debt securities Cyprus government 451, ,520 French government 281, ,324 Other governments 22,462 41,887 Banks and other corporations 146,222 32, , ,592 Listed on the Cyprus Stock Exchange 451, ,520 Listed on other stock exchanges 450, ,072 Unlisted , ,592 Geographic dispersion by country of issuer Cyprus 451, ,520 France 281, ,324 Other European Union countries 75,573 22,980 European Financial Stability Facility and European Investment Fund 11,443 11,823 Supranational organisations 9,058 9,365 Other countries 72,110 30, , ,592 Equity securities Listed on the Cyprus Stock Exchange 5,750 4,883 Listed on other stock exchanges Unlisted 20,880 16,370 27,176 21,683 At 31 December 2017 and 2016 there were no available-for-sale investments in debt securities which have been determined to be individually impaired. Available-for-sale mutual funds are mainly unlisted and issued in other countries. 96
99 20. Investments (continued) Investments classified as loans and receivables Debt securities 48,658 68,074 Cyprus government 48,658 68,074 Listed on the Cyprus Stock Exchange 48,658 68,074 Geographic dispersion by country of issuer Cyprus 48,658 68,074 At 31 December 2017 the total loans and receivables have been determined to be individually impaired (2016: 49,185 thousand). Reclassification of investments Reclassification of available-for-sale investments to loans and receivables On 1 October 2008 and 30 June 2011 the Group reclassified certain available-for-sale debt securities to investments classified as loans and receivables, in view of the fact that there was no active market for these debt securities and the Group had the intention and ability to hold these securities in the foreseeable future. 97
100 20. Investments (continued) Reclassification of investments (continued) The tables below present the debt securities reclassified by the Group, by date of reclassification. Reclassification of available-for-sale investments to: Reclassification date Carrying and fair value on reclassification date 31 December 2017 Carrying value Fair value 31 December 2016 Carrying value Fair value Additional profit in the consolidated income statement had the debt securities not been reclassified Year 2017 Additional gain in other comprehensive income had the debt securities not been reclassified Effective interest rate on reclassification date - loans and receivables 1 October ,800 48,658 55,104 49,185 50,329-6, %-4.7% 98
101 20. Investments (continued) Reclassification of investments (continued) Reclassification of available-for-sale investments to: Reclassification date Carrying and fair value on reclassification date 31 December 2016 Carrying value Fair value 31 December 2015 Carrying value Fair value Additional profit in the consolidated income statement had the debt securities not been reclassified Year 2016 Additional gain in other comprehensive income had the debt securities not been reclassified Effective interest rate on reclassification date - loans and receivables 1 October ,800 49,185 50,329 48,021 50,232-1, %-4.7% 99
102 21. Derivative financial instruments The contract amount and fair value of the derivative financial instruments is set out below: Trading derivatives Forward exchange rate contracts Contract amount Fair value Contract Fair value Assets Liabilities amount Assets Liabilities , , Currency swaps 1,419,915 1,103 14,082 1,774,916 15,875 8,215 Interest rate swaps 69, , ,901 Currency options , Derivatives qualifying for hedge accounting Fair value hedges - interest rate swaps Net investments forward exchange rate contracts 1,522,592 1,436 15,471 2,057,596 17,234 10,903 1,171,424 16,315 35, , ,463 61, ,605 3, ,232,436 16,591 35, ,898 3,601 37,722 Total 2,755,028 18,027 50,892 2,654,494 20,835 48,625 The use of derivatives is an integral part of the Group s activities. Derivatives are used to manage the Group s own exposure to fluctuations in interest rates, exchange rates and equity price indices. Derivatives are also sold to customers as risk management products. Forward exchange rate contracts are irrevocable agreements to buy or sell a specified quantity of foreign currency on a specified future date at an agreed rate. Currency swaps include simple currency swaps and cross-currency swaps. Simple currency swaps involve the exchange of two currencies at the current market rate and the commitment to re-exchange them at a specified rate upon maturity of the swap. Cross-currency swaps are interest rate swaps in which the cash flows are in different currencies. Interest rate swaps are contractual agreements between two parties to exchange fixed rate and floating rate interest, by means of periodic payments, based upon a notional principal amount and the interest rates defined in the contract. Currency options are contracts that grant the holder the right, but not the obligation, to buy or sell currency at a specified exchange rate during a specified period of time. 100
103 21. Derivative financial instruments (continued) Interest rate, currency and equity options provide the buyer with the right but not the obligation, to either purchase or sell the underlying values at a specified price or level on or before a specified date. Interest rate caps/floors protect the holder from fluctuations of interest rates above or below a specified interest rate for a specified period of time. The credit exposure of derivative financial instruments represents the cost to replace these contracts at the reporting date. The exposure arising from these transactions is managed as part of the Group s credit risk management process for credit facilities granted to customers and financial institutions. The contract amount of certain types of derivative financial instruments provides a basis for comparison with other instruments recognised on the consolidated balance sheet, but does not necessarily indicate the amounts of future cash flows involved or the current fair value of the instruments and, consequently, does not indicate the Group s exposure to credit or market risk. The fair value of the derivatives can be either positive (asset) or negative (liability) as a result of fluctuations in market interest rates, foreign exchange rates or equity price indices, in accordance with the terms of the relevant contract. The aggregate net fair value of derivatives may fluctuate significantly over time. Hedge accounting The Group applies fair value hedge accounting using derivatives when the required criteria for hedge accounting are met. The Group also uses derivatives for economic hedging (hedging the changes in interest rates, exchange rates or other risks) which do not meet the criteria for hedge accounting. As a result, these derivatives are accounted for as trading derivatives and the gains or losses arising from revaluation are recognised in the consolidated income statement. Changes in the fair value of derivatives designated as fair value hedges and the fair value of the item in relation to the risk being hedged are recognised in the consolidated income statement. Fair value hedges The Group uses interest rate swaps to hedge the interest rate risk arising as a result of the possible adverse movement in the fair value of fixed rate available-for-sale debt securities and fixed rate customer loans and deposits. Hedges of net investments The Group s consolidated balance sheet is affected by foreign exchange differences between the Euro and all non-euro functional currencies of overseas subsidiaries and branches and other foreign operations. The Group hedges its structural currency risk when it considers that the cost of such hedging is within an acceptable range (in relation to the underlying risk). This hedging is effected by financing with borrowings in the same currency as the functional currency of the overseas subsidiaries and branches, as well as overseas associates and joint ventures and forward exchange rate contracts. As at 31 December 2017, deposits and forward exchange rate contracts amounting to 142,273 thousand and 61,012 thousand respectively (2016: 100,756 thousand and 178,605 thousand respectively) have been designated as hedging instruments and have given rise to a loss of 1,166 thousand (2016: gain of 53,408 thousand) which was recognised in the Foreign currency translation reserve in the consolidated statement of comprehensive income, against the profit or loss from the retranslation of the net assets of the overseas subsidiaries and branches. 101
104 22. Fair value measurement The following table presents the carrying value and fair value of the Group s financial assets and liabilities. Carrying value Fair value Carrying value Fair value Financial assets Cash and balances with central banks 3,393,934 3,393,934 1,506,396 1,506,396 Loans and advances to banks 1,192,633 1,191,617 1,087,837 1,092,964 Investments at fair value through profit or loss 51,467 51,467 43,016 43,016 Investments available-for-sale 929, , , ,554 Investments classified as loans and receivables 48,658 55,104 68,074 69,451 Derivative financial assets 18,027 18,027 20,835 20,835 Loans and advances to customers 14,602,454 15,385,385 15,649,401 16,791,164 Life insurance business assets attributable to policyholders 504, , , ,633 Other assets 107, , , ,811 Financial liabilities Funding from central banks and deposits by banks 20,849,193 21,637,554 19,555,557 20,703,824 1,425,308 1,425,308 1,284,800 1,284,800 Repurchase agreements 257, , , ,752 Derivative financial liabilities 50,892 50,892 48,625 48,625 Customer deposits 17,849,919 17,875,239 16,509,741 16,492,715 Subordinated loan stock 302, , Other liabilities 176, , , ,422 20,062,375 20,144,819 18,268,955 18,287,314 The fair value of financial assets and liabilities in the above table is as at the reporting date and does not represent any expectations about their future value. The Group uses the following hierarchy for determining and disclosing fair value: Level 1: investments valued using quoted prices in active markets. Level 2: investments valued using models for which all inputs that have a significant effect on fair value are market observable. Level 3: investments valued using models for which inputs that have a significant effect on fair value are not based on observable market data. For assets and liabilities that are recognised in the Consolidated Financial Statements at fair value, the Group determines whether transfers have occurred between levels in the hierarchy by re-assessing categorisation at the end of each reporting period. 102
105 22. Fair value measurement (continued) The following is a description of the determination of fair value for financial instruments and non-financial assets which are recorded at fair value on a recurring and on a non-recurring basis and for financial instruments and non-financial assets which are not measured at fair value but for which fair value is disclosed, using valuation techniques. These incorporate the Group s estimate of assumptions that a market participant would make when valuing the instruments. Derivative financial instruments Derivative financial instruments valued using a valuation technique with market observable inputs are mainly interest rate swaps, currency swaps, currency rate options, forward foreign exchange rate contracts, equity options and interest rate collars. The most frequently applied valuation techniques include forward pricing and swap models, using present value calculations. The models incorporate various inputs including the credit quality of counterparties, foreign exchange spot and forward rates and interest rate curves. Credit Valuation Adjustments (CVA) and Debit Valuation Adjustments (DVA) The CVA and DVA are incorporated into derivative valuations to reflect the impact on fair value of counterparty risk and BOC PCL s own credit quality respectively. The Group calculates the CVA by applying the PD of the counterparty, conditional on the non-default of the Group, to the Group s expected positive exposure to the counterparty and multiplying the result by the loss expected in the event of default. Conversely, the Group calculates the DVA by applying its own PD, conditional on the non-default of the counterparty, to the expected positive exposure of the counterparty to Group and multiplying the result by the loss expected in the event of default. Both calculations are performed over the life of the potential exposure. The expected exposure of derivatives is calculated as per the CRR and takes into account the netting agreements where they exist. A standard LGD assumption in line with industry norms is adopted. Alternative LGD assumptions may be adopted when both the nature of the exposure and the available data support this. The Group does not hold any significant derivative instruments which are valued using a valuation technique with significant non-market observable inputs. Investments available-for-sale and other investments at fair value through profit or loss Available-for-sale investments and other investments at fair value through profit or loss which are valued using a valuation technique or pricing models, primarily consist of unquoted equity securities and debt securities. These assets are valued using valuation models which sometimes only incorporate market observable data and at other times use both observable and non-observable data. The rest of the investments are valued using quoted prices in active markets. Loans and advances to customers The fair value of loans and advances to customers is based on the present value of expected future cash flows. Future cash flows have been based on the future expected loss rate per loan portfolio, taking into account expectations for the credit quality of the borrowers. The discount rate includes components that capture the risk free rate per currency, funding cost, servicing cost and the cost of capital, considering the risk weight of each loan. Customer deposits The fair value of customer deposits is determined by calculating the present value of future cash flows. The discount rate takes into account current market rates and the credit profile of BOC PCL. The fair value of deposits repayable on demand and deposits protected by the Deposit Protection Guarantee Scheme are approximated by their carrying values. Repurchase agreements Repurchase agreements are collateralised bank takings. Given that the collateral provided by the Group is greater than the amount borrowed, the fair value calculation of these repurchase agreements only takes into account the time value of money. 103
106 22. Fair value measurement (continued) Loans and advances to banks Loans and advances to banks with maturity over one year are discounted using an appropriate risk free rate plus the credit spread of each counterparty. For short-term lending, the fair value is approximated by the carrying value. Deposits by banks Since almost all deposits by banks are very short-term, the fair value is an approximation of the carrying value. Subordinated loan stock The current issue of BOC PCL is liquid with quoted prices in an active market. The fair value of the capital loan stock issued by Bank of Cyprus UK Ltd is determined using market observable models (Level 2). Investment properties The fair value of investment properties is determined using valuations performed by external, accredited, independent valuers and internal accredited valuers. Further information on the techniques applied is disclosed in the remainder of this note. Property and equipment The freehold land and buildings consist of offices and other commercial properties. The fair value of the properties is determined using valuations performed by external, accredited, independent valuers and internal accredited valuers. Further information on the techniques applied is disclosed in the remainder of this note. Model inputs for valuation Observable inputs to the models for the valuation of unquoted equity and debt securities include, where applicable, current and expected market interest rates, market expected default rates, market implied country and counterparty credit risk and market liquidity discounts. 104
107 22. Fair value measurement (continued) Model inputs for valuation (continued) The following table presents the fair value measurement hierarchy of the Group s assets and liabilities recorded at fair value or for which fair value is disclosed, by level of the fair value hierarchy: 2017 Assets measured at fair value Investment properties Level 1 Level 2 Level 3 Total Residential Offices and other commercial properties - - 2,752 2,752 Manufacturing and industrial properties Hotels - - 2,124 2,124 Land (fields and plots) ,955 13,955 Investment properties held for sale ,646 19,646 Offices and other commercial properties - - 6,500 6,500 Freehold property Offices and other commercial properties - 16, , ,891 Trading derivatives Forward exchange rate contracts Currency swaps - 1,103-1,103 Interest rate swaps Currency options Derivatives qualifying for hedge accounting - 1,436-1,436 Fair value hedges-interest rate swaps - 16,315-16,315 Net investments-forward exchange rate contracts Investments at fair value through profit or loss - 16,591-16,591 Trading investments 11, ,975 Other investments at fair value through profit or loss 38, ,492 50, ,467 Investments available-for-sale 907, , , ,601 34, ,326 1,280,828 Other financial assets not measured at fair value Loans and advances to banks - 1,191,617-1,191,617 Loans and receivables-investments - 55,104-55,104 Loans and advances to customers ,385,385 15,385,385-1,246,721 15,385,385 16,632,106 For available-for-sale equity securities categorised as Level 3, for one investment with a carrying amount of 11,228 thousand, a change in the conversion factor by 10% would result in a change in the value of the equity securities by 1,123 thousand. For additional disclosures on sensitivity analysis of equity securities refer to Note
108 22. Fair value measurement (continued) Model inputs for valuation (continued) 2017 Liabilities measured at fair value Trading derivatives Level 1 Level 2 Level 3 Total Forward exchange rate contracts Currency swaps - 14,082-14,082 Interest rate swaps Currency options Derivatives qualifying for hedge accounting - 15,471-15,471 Fair value hedges-interest rate swaps - 35,420 35,420 Net investments-forward exchange rate contracts Other financial liabilities not measured at fair value ,421-35,421-50,892-50,892 Deposits by banks - 495, ,308 Repurchase agreements - 281, ,951 Customer deposits ,875,239 17,875,239 Subordinated loan stock 300,980 33, , , ,062 17,875,239 18,987,
109 22. Fair value measurement (continued) Model inputs for valuation (continued) 2016 Assets measured at fair value Investment properties Level 1 Level 2 Level 3 Total Offices and other commercial properties ,548 20,548 Manufacturing and industrial - - 2,791 2,791 Land (fields and plots) ,720 14,720 Investment properties held for sale ,059 38,059 Offices and other commercial properties ,071 3,417 Hotels - - 7,994 7,994 Freehold property ,065 11,411 Offices and other commercial properties - 10, , ,555 Trading derivatives Forward exchange rate contracts Currency swaps - 15,875-15,875 Interest rate swaps Currency options Derivatives qualifying for hedge accounting - 17,234-17,234 Fair value hedges-interest rate swaps Net investments-forward exchange rate contracts - 3,514-3,514 Investments at fair value through profit or loss - 3,601-3,601 Trading investments 11, ,473 Other investments at fair value through profit or loss 19,189 11, ,543 30,976 11, ,016 Investments available-for-sale 545, , , ,874 42, , ,430 Other financial assets not measured at fair value Loans and advances to banks - 1,092,964-1,092,964 Loans and receivables-investments - 69,451-69,451 Loans and advances to customers ,791,164 16,791,164-1,162,415 16,791,164 17,953,579 For available-for-sale equity securities categorised as Level 3, for one investment with a carrying amount of 8,740 thousand, a change in the conversion factor by 10% would result in a change in the value of the equity securities by 874 thousand. For additional disclosures on sensitivity analysis of equity securities refer to Note
110 22. Fair value measurement (continued) Model inputs for valuation (continued) 2016 Liabilities measured at fair value Trading derivatives Level 1 Level 2 Level 3 Total Forward exchange rate contracts Currency swaps - 8,215-8,215 Interest rate swaps - 1,901-1,901 Currency options Derivatives qualifying for hedge accounting - 10,903-10,903 Fair value hedges-interest rate swaps - 37,463-37,463 Net investments-forward exchange rate contracts Other financial liabilities not measured at fair value ,722-37,722-48,625-48,625 Deposits by banks - 434, ,786 Repurchase agreements - 292, ,752 Customer deposits ,492,715 16,492, ,538 16,492,715 17,220,253 The cash and balances with central banks and the funding from central banks are financial instruments whose carrying value is a reasonable approximation of fair value, because they are mostly short-term in nature or are repriced to current market rates frequently. Other assets and other liabilities are of a financial nature and their carrying value is a close approximation of fair value. Disclosures for life insurance business assets attributable to policyholders by level are disclosed in Note 24. During the years 2017 and 2016 there were no significant transfers between Level 1 and Level
111 22. Fair value measurement (continued) Movements in Level 3 financial instruments measured at fair value Transfers from Level 3 to Level 2 occur when the market for some securities becomes more liquid, which eliminates the need for the previously required significant unobservable valuation inputs. Following a transfer to Level 2 the instruments are valued using valuation models incorporating observable market inputs. Transfers into Level 3 reflect changes in market conditions as a result of which instruments become less liquid. Therefore, the Group requires significant unobservable inputs to calculate their fair value. The movement in Level 3 assets which are measured at fair value is presented below: Investment properties Investment properties held for sale Own use properties Financial instruments Investment properties Investment properties held for sale Own use properties Own use properties held for sale Financial instruments January 38,059 11, ,215 17,479 34,628 15, ,945 25,400 55,253 Additions 4,273-1, ,114-2, ,867 Acquisition of subsidiary (Note ) , Disposals (12,248) (10,864) - (689) (612) (3,480) - (25,410) (51,937) Transfers from investment properties to own use properties Transfers from/(to) stock of property (Note 27) Transfers (to)/from non-current assets held for sale Net gains from fair value changes recognised in the consolidated statement of other comprehensive income (395) (1,371) - - (6,500) 6, ,740 5, Depreciation charge for the year - - (2,652) (2,404) - - Impairment charge for the year (Note 16) - - (8,470) Revaluation (losses)/gains (3,309) ,482 (442) Foreign exchange adjustments (234) (201) (78) (631) 447 (31) (14) - (189) 31 December 19,646 6, ,559 22,621 38,059 11, ,215-17,
112 22. Fair value measurement (continued) Valuation policy and sensitivity analysis Investment properties, investment properties held for sale and own use properties The valuation technique mainly applied by the Group is the market comparable approach, adjusted for market and property specific conditions. In certain cases, the Group also utilises the income capitalisation approach. The key inputs used for the valuations of the investment properties, investment properties held for sale and own use properties are presented in the tables below. 110
113 22. Fair value measurement (continued) Valuation policy and sensitivity analysis (continued) Analysis of investment properties and investment properties held for sale Type and country 2017 Estimated rental value per m 2 per annum Rent growth per annum Estimated building cost per m 2 Yield Estimated fair value per m 2 Estimated land value per m 2 Land Building area Residential 000 m 2 m 2 Years Age of building Russia 338 n/a n/a 225-2,326 n/a 51-2, , Offices and other commercial properties Cyprus 8, n/a n/a 4%-6% 1,339-7,059 1,053 1, , Russia 422 n/a n/a n/a ,588-2, ,644 8 Manufacturing and industrial 9,252 Russia 477 n/a n/a n/a ,220-29, , Hotels Russia 2,124 n/a n/a 361 n/a 361 n/a n/a 5, Land (fields and plots) Cyprus 13,955 n/a n/a 1,000-1,200 n/a n/a 279-1,028 2,316-21,053 n/a n/a Total 26,
114 22. Fair value measurement (continued) Valuation policy and sensitivity analysis (continued) Analysis of own use properties Type and country 2017 Offices and other commercial properties Estimated rental value per m 2 per annum Rent growth per annum Estimated building cost per m 2 Yield Estimated fair value per m 2 Estimated land value per m 2 Land Building area Age of building 000 m 2 m 2 Years Cyprus 236, n/a 821-1,895 5%-6% 19-6, , , , Romania 3,291 n/a n/a n/a 9% n/a n/a 660 2, UK 16, %-6% n/a 5%-7% 3,260-16,959 n/a 173-1, ,689 Total 255,891 Refurnished in
115 22. Fair value measurement (continued) Valuation policy and sensitivity analysis (continued) Analysis of investment properties and investment properties held for sale Type and country 2016 Offices and other commercial properties Estimated rental value per m 2 per annum Rent growth per annum Estimated building cost per m 2 Yield Estimated fair value per m 2 Estimated land value per m 2 Land Building area Age of building 000 m 2 m 2 Years Cyprus 23, n/a 821-1,130 4%-6% 1,060-7, ,053 1,591-30, , UK n/a n/a n/a n/a n/a n/a Russia 353 n/a n/a n/a n/a 133 n/a 2,773 1, Manufacturing and industrial 23,965 Russia 2,791 n/a n/a n/a n/a , Hotels Romania 7,994 n/a n/a n/a 9% n/a n/a 10,337 16, Land (fields and plots) Cyprus 14,720 n/a n/a 900 n/a n/a ,627-21,053 n/a n/a Total 49,
116 22. Fair value measurement (continued) Valuation policy and sensitivity analysis (continued) Analysis of own use properties Type and country 2016 Offices and other commercial properties Estimated rental value per m 2 per annum Rent growth per annum Estimated building cost per m 2 Yield Estimated fair value per m 2 Estimated land value per m 2 Land Building area Age of building 000 m 2 m 2 Years Cyprus 242, n/a 588-2,102 5%-6% 566-8, , , , Romania 3,423 n/a n/a n/a 9% n/a n/a 660 2,284 9 UK 10, %-6% n/a 5%-7% 2,460-12,715 n/a 173-1, ,689 Total 256,555 Re-furnished in
117 22. Fair value measurement (continued) Valuation policy and sensitivity analysis (continued) Sensitivity analysis Most of the Group s property valuations have been classified as Level 3. Significant increases/decreases in estimated values per square meter for properties valued with the comparable approach or significant increases/decreases in estimated rental values or yields for properties valued with the income capitalisation approach would result in a significantly higher/lower fair value of the properties. 23. Loans and advances to customers Gross loans and advances to customers 18,086,230 19,201,642 Provisions for impairment of loans and advances to customers (Note 44) (3,483,776) (3,552,241) 14,602,454 15,649,401 Loans and advances to customers pledged as collateral are disclosed in Note 46. Additional analysis and information regarding credit risk and analysis of the provisions for impairment of loans and advances to customers are set out in Note Life insurance business assets attributable to policyholders Equity securities 1,171 8,298 Debt securities 60,847 56,389 Mutual funds 402, ,096 Mortgages and other loans 1,139 1,489 Bank deposits 39,451 52, , ,633 Property 13,830 13, , ,533 Financial assets of life insurance business attributable to policyholders are classified as investments at fair value through profit or loss. In addition to the above assets, the life insurance subsidiary of the Group holds shares of the Company, as part of the assets attributable to policyholders with a carrying value as at 31 December 2017 of 350 thousand (2016: 404 thousand). Such shares are presented in the Consolidated Financial Statements as treasury shares (Note 35). 115
118 24. Life insurance business assets attributable to policyholders (continued) The analysis of the financial assets of life insurance business attributable to policyholders measured at fair value by level, is presented below: 2017 Level 1 Level 2 Level 3 Total Equity securities 1, ,171 Debt securities 34,282 26,565-60,847 Mutual funds 401, ,240 Mortgages and other loans 1, , ,976 26, , Equity securities 7,090-1,208 8,298 Debt securities 31,886 24,503-56,389 Mutual funds 367, ,096 Mortgages and other loans 1, , ,561 24,503 1, ,272 Bank deposits are financial instruments whose carrying amount is a reasonable approximation of fair value, because they are short-term in nature or are repriced to current market rates frequently. The movement of financial assets classified as Level 3 is presented below: January 1,208 1,436 Unrealised losses recognised in the consolidated income statement (352) (228) 31 December 856 1,208 During years 2017 and 2016 there were no significant transfers between Level 1 and Level
119 25. Property and equipment 2017 Property Equipment Total Net book value at 1 January 258,552 22, ,893 Additions 1,843 8,456 10,299 Revaluation 9,319-9,319 Transfers from stock of property (Note 27) Transfers from investment property (Note 22) Disposals and write-offs (35) (242) (277) Depreciation charge for the year (3,983) (7,947) (11,930) Impairment charge for the year (8,470) - (8,470) Foreign exchange adjustments (390) (154) (544) Net book value at 31 December 257,360 22, ,814 1 January 2017 Cost or valuation 298, , ,581 Accumulated depreciation (40,191) (130,497) (170,688) Net book value 258,552 22, , December 2017 Cost or valuation 293, , ,927 Accumulated depreciation (36,304) (126,809) (163,113) Net book value 257,360 22, ,
120 25. Property and equipment (continued) 2016 Property Equipment Total Net book value at 1 January 242,941 21, ,333 Acquisition of subsidiary (Note ) 19, ,308 Additions 2,572 9,524 12,096 Transfers to stock of property (Note 27) (1,371) - (1,371) Transfers from intangible assets (Note 26) Disposals and write-offs (80) (184) (264) Disposal of subsidiary (Note ) - (952) (952) Depreciation charge for the year (3,692) (7,866) (11,558) Foreign exchange adjustments (1,770) (385) (2,155) Net book value at 31 December 258,552 22, ,893 1 January 2016 Cost or valuation 278, , ,887 Accumulated depreciation (35,344) (126,210) (161,554) Net book value 242,941 21, , December 2016 Cost or valuation 298, , ,581 Accumulated depreciation (40,191) (130,497) (170,688) Net book value 258,552 22, ,893 The net book value of the Group s property comprises: Freehold property 255, ,555 Improvements on leasehold property 1,469 1, , ,552 Freehold property includes land amounting to 92,471 thousand (2016: 92,818 thousand) for which no depreciation is charged. 118
121 25. Property and equipment (continued) The Group s policy is to revalue its properties periodically (between 3 to 5 years) but more frequent revaluations may be performed where there are significant and volatile movements in values. The Group performed revaluations as at 31 December As a result, a net gain on revaluation of 9,319 thousand (2016: nil) was recognised in the consolidated statement of comprehensive income and an impairment loss of 8,470 thousand (2016: nil) was recognised in the consolidated income statement for the year ended 31 December The valuations at year end were carried out by independent qualified valuers, on the basis of market value using observable prices and/or recent market transactions depending on the location of the property. Details on valuation techniques and inputs are presented in Note 22. As at 31 December 2017 and 2016 there are charges against freehold property of the Group with carrying value 20,850 thousand (2016: 21,134 thousand). The net book value of freehold property, on a cost less accumulated depreciation basis, as at 31 December 2017 would have amounted to 194,446 thousand (2016: 190,241 thousand). 26. Intangible assets 2017 Computer software In-force life insurance business Total Net book value at 1 January 28, , ,963 Additions 25,723-25,723 Increase in value of in-force life insurance business (Note 12) - 2,743 2,743 Disposals and write-offs (22) - (22) Amortisation charge for the year (9,404) - (9,404) Foreign exchange adjustments (51) - (51) Net book value at 31 December 45, , ,952 1 January 2017 Cost 144, , ,902 Accumulated amortisation and impairment (115,939) - (115,939) Net book value 28, , , December 2017 Cost 169, , ,359 Accumulated amortisation and impairment (124,407) - (124,407) Net book value 45, , ,
122 26. Intangible assets (continued) 2016 Computer software In-force life insurance business Total Net book value at 1 January 20, , ,788 Additions 16,363-16,363 Transfers to equipment (Note 25) (456) - (456) Increase in value of in-force life insurance business (Note 12) - 4,680 4,680 Disposals and write-offs (13) - (13) Amortisation charge for the year (7,263) - (7,263) Foreign exchange adjustments (136) - (136) Net book value at 31 December 28, , ,963 1 January 2016 Cost 130, , ,475 Accumulated amortisation and impairment (109,687) - (109,687) Net book value 20, , , December 2016 Cost 144, , ,902 Accumulated amortisation and impairment (115,939) - (115,939) Net book value 28, , ,963 Valuation of in-force life insurance business The actuarial assumptions made to determine the value of in-force life insurance business relate to future mortality, redemptions, level of administration and selling expenses and investment returns. The main assumptions used in determining the value of the in-force business are: Discount rate (after tax) 10.0% 10.0% Return on investments 5.0% 5.0% Expense inflation 4.0% 4.0% 120
123 27. Stock of property The carrying value of stock is determined as the lower of cost and net realisable value. Impairment is recognised if the net realisable value is below cost. During 2017 an impairment loss of 50,502 thousand (2016: 36,220 thousand) was recognised in Impairment of non-financial instruments in the consolidated income statement. At 31 December 2017, stock of 418,559 thousand (2016: 608,985 thousand) is carried at net realisable value which is the fair value less costs to sell. The stock of property includes residential properties, offices and other commercial properties, manufacturing and industrial properties, hotels, land (fields and plots) and properties under construction. There is no stock of property pledged as collateral for central bank funding facilities under Eurosystem monetary policy operations and ELA (2016: 22,055 thousand). The carrying value of the stock of property is analysed in the tables below: Net book value at 1 January 1,427, ,858 Acquisition of subsidiaries (Note 51.3) - 75,632 Additions 523,061 1,010,059 Disposals (257,662) (139,316) Transfers (to)/from own use properties (Note 25) (129) 1,371 Impairment (Note 16) (50,502) (36,220) Foreign exchange adjustments (618) (112) Net book value at 31 December 1,641,422 1,427,272 Additions during 2017 include cost of construction of 3,404 thousand (2016: nil). Analysis by type and country Cyprus Greece Romania Total Residential properties 146,214 29, ,460 Offices and other commercial properties 288,282 38,882 9, ,302 Manufacturing and industrial properties 112,890 33, ,815 Hotels 77, ,313 Land (fields and plots) 836,543 6,402 4, ,540 Properties under construction 56, ,992 Total 1,518, ,261 14,420 1,641,
124 27. Stock of property (continued) Analysis by type and country Cyprus Greece Romania Total Residential properties 90,308 36,810 9, ,759 Offices and other commercial properties 256,152 55,676 12, ,168 Manufacturing and industrial properties 81,572 53, ,818 Hotels 74, ,122 Land (fields and plots) 739,058 5,732 9, ,614 Properties under construction Total 1,242, ,497 32,316 1,427, Prepayments, accrued income and other assets Receivables relating to disposal of operations 36,282 57,056 Reinsurers share of insurance contract liabilities (Note 32) 48,000 49,973 Taxes refundable 25,647 33,582 Debtors 24,121 24,571 Prepaid expenses 1,391 1,765 Retirement benefit plan assets (Note 14) Other assets 93, , , ,911 As at 31 December 2017 and 2016, the receivables relating to disposal of operations related to the disposal of the Ukrainian operations during In 2017 the settlement terms of the deferred consideration, the related interest rate and the collaterals were amended. The deferred consideration is due to be paid to the Group under a repayment programme which has been extended from June 2019 to December The receivable is fully secured. During 2017, a reversal of impairment of 1,379 thousand was recognised in relation to other assets (2016: reversal of impairment loss of 3,869 thousand) (Note 16). 29. Non-current assets held for sale Non-current assets held for sale: investment properties 6,500 11,
125 29. Non-current assets held for sale (continued) Investment properties The investment properties classified as held for sale are properties which management is committed to sell and has proceeded with an active programme to complete this plan. The disposals are expected to take place within 12 months from the date of classification. Investment properties classified as held for sale are measured at fair value. The results of the fair value changes are presented within Net (losses)/gains from revaluation and disposal of investment properties in the consolidated income statement and are within the Cyprus operating segment for investment properties in Cyprus and in the Other countries operating segment for Greek, UK and Romanian investment properties. An analysis of investment properties held for sale by country and key valuation inputs are disclosed in Note Funding from central banks Funding from central banks comprises funding from the ECB under Eurosystem monetary policy operations and ELA from the CBC, as set out in the table below: Emergency Liquidity Assistance (ELA) - 200,014 Main Refinancing Operations (MRO) 100,000 - Longer-Term Refinancing Operations (LTRO) - 50,000 Targeted Longer-Term Refinancing Operations (TLTRO) 830, , , ,014 In December 2016, BOC PCL borrowed an amount of 600 million through the new series of TLTRO (TLTRO II) announced by the ECB in March 2016 and an amount of 50 million through the LTRO. In March 2017, the 50 million borrowed through the LTRO matured and 40 million was re-borrowed, which matured in June 2017 and was re-borrowed through a new LTRO. This was repaid in September In March 2017, BOC PCL raised an additional 230 million funding from ECB, through TLTRO II. In April 2017, an additional 40 million was borrowed through the MRO of which 10 million was repaid in May 2017 and the remaining 30 million was repaid in August In December 2017 an amount of 100 million was borrowed through the MRO. As at 31 December 2017, ECB funding was at 930 million of which 100 million was from the weekly MRO and 830 million was from the 4-year TLTRO II. The interest rate applied to TLTRO II will be fixed for each operation at the rate applied in the MRO prevailing at the time of allotment and is subject to a lower rate for counterparties whose eligible net lending in the prespecified period exceeds their benchmark. This lower rate will be linked to the interest rate on the deposit facility prevailing at the time of the allotment of each operation. ELA funding was repaid in full by BOC PCL on 5 January Details on encumbered assets related to the above funding facilities are disclosed in Note
126 31. Customer deposits By type of deposit Demand 6,313,244 6,182,096 Savings 1,536,576 1,061,786 Time or notice 10,000,099 9,265,859 17,849,919 16,509,741 By geographical area Cyprus 15,982,905 15,043,362 United Kingdom 1,867,014 1,464,651 Romania - 1,728 17,849,919 16,509,741 By currency Euro 13,829,991 12,397,828 US Dollar 1,743,513 2,201,980 British Pound 2,110,265 1,690,118 Russian Rouble 49,788 92,472 Romanian Lei 42 1,669 Swiss Franc 14,943 18,087 Other currencies 101, ,587 17,849,919 16,509,741 By customer sector Cyprus United Kingdom Romania Total Corporate 1,529,521 29,742-1,559,263 SMEs 665, , ,476 Retail 8,670,625 1,635,736-10,306,361 Restructuring Corporate 145, ,084 SMEs 40, ,743 Recoveries 6, ,615 International banking services 4,163, ,163,384 Wealth management 760, ,993 15,982,905 1,867,014-17,849, Corporate 1,184,681 53,457 1,446 1,239,584 SMEs 566, , ,516 Retail 7,778,136 1,207, ,985,268 Restructuring Corporate 192, ,442 SMEs 27, ,685 Recoveries 11, ,176 International banking services 4,494, ,494,755 Wealth management 788, ,315 15,043,362 1,464,651 1,728 16,509,741 Deposits by geographical area are based on the originator country of the deposit. 124
127 32. Insurance liabilities Gross Reinsurers share Net Gross Reinsurers share Life insurance Life insurance contract liabilities General insurance Provision for unearned premiums Other liabilities 546,887 (27,608) 519, ,075 (28,379) 501,696 24,151 (8,879) 15,272 22,690 (8,605) 14,085 Claims outstanding 34,076 (11,513) 22,563 31,009 (12,989) 18,020 Net Unexpired risks reserve Equalisation reserve General insurance contract liabilities 58,561 (20,392) 38,169 53,922 (21,594) 32, ,448 (48,000) 557, ,997 (49,973) 534,024 Reinsurance balances receivable are included in Prepayments, accrued income and other assets (Note 28). Life insurance contract liabilities The movement of life insurance contract liabilities and reinsurance assets during the year is analysed as follows: Gross Reinsurers share Net Gross Reinsurers share January 530,075 (28,379) 501, ,729 (30,396) 480,333 New business 9,367 (1,173) 8,194 8,389 (1,150) 7,239 Change in existing business 7,445 1,944 9,389 10,957 3,167 14, December 546,887 (27,608) 519, ,075 (28,379) 501,696 Net General insurance contract liabilities The movement in general insurance contract liabilities and reinsurance assets for the year is analysed as follows: Gross Reinsurers share Net Gross Reinsurers share Liabilities for unearned premiums 1 January 22,690 (8,605) 14,085 24,029 (11,533) 12,496 Premium income 65,701 (29,246) 36,455 60,215 (27,544) 32,671 Earned premiums (64,240) 28,972 (35,268) (61,554) 30,472 (31,082) 31 December 24,151 (8,879) 15,272 22,690 (8,605) 14,085 Net 125
128 32. Insurance liabilities (continued) General insurance contract liabilities (continued) The provisions for unearned insurance and reinsurance premiums represent the portion of premiums that relate to risks that have not yet expired at the reporting date. Gross Reinsurers share Net Gross Reinsurers share Claims outstanding January 31,009 (12,989) 18,020 32,083 (14,834) 17,249 Amount paid for claims settled in the (27,017) 13,643 (13,374) (25,864) 12,004 (13,860) period Increase in liabilities arising from claims 30,084 (12,167) 17,917 24,790 (10,159) 14, December 34,076 (11,513) 22,563 31,009 (12,989) 18,020 Reported claims 32,202 (10,704) 21,498 29,188 (12,178) 17,010 Incurred but not reported 1,874 (809) 1,065 1,821 (811) 1, Subordinated loan stock 34,076 (11,513) 22,563 31,009 (12,989) 18,020 Net Subordinated Tier 2 Capital Note Subordinated Tier 2 Capital Loan Contractual interest rate % up to 19 January % up to 21 December ,485-33, ,288 - BOC PCL maintains a Euro Medium Term Note (ΕΜΤΝ) Programme with an aggregate nominal amount up to 4,000 million. In January 2017, BOC PCL issued a 250 million unsecured and subordinated Tier 2 Capital Note (Note) under BOC PCL s EMTN Programme. The Note was priced at par with a coupon of 9.25% per annum payable annually up to 19 January 2022 and then a rate at the then prevailing 5-year swap rate plus a margin of 9.176% per annum up to 19 January 2027, payable annually. The Note matures on 19 January BOC PCL has the option to redeem the Note early on 19 January 2022, subject to applicable regulatory consents. The Note is listed on the Luxembourg Stock Exchange s Euro Multilateral Trading Facility (MTF) market. In December 2017, Bank of Cyprus UK Ltd, a 100% subsidiary of BOC PCL issued a 30 million unsecured and subordinated Tier 2 Capital Loan (Loan), priced at par. The Loan has a coupon of 8.00% up to 21 December 2022 and then a rate at the then prevailing 5-year swap rate plus a margin of 6.99% per annum, up to 21 December 2027, payable semi-annually, in June and December. The Loan matures on 21 December Bank of Cyprus UK Ltd has the option to redeem the Loan early on 21 December 2022, subject to meeting the notice conditions. 126
129 34. Accruals, deferred income and other liabilities Income tax payable and related provisions 25,467 25,599 Special defence contribution payable 5,891 5,719 Retirement benefit plans liabilities (Note 14) 10,037 22,776 Provisions for pending litigation, claims and regulatory matters (Note 39) 133,318 48,882 Provisions for financial guarantees and commitments (Notes 16 and 39) 51,987 38,196 Liabilities for investment-linked contracts under administration 7,873 5,458 Accrued expenses and other provisions 60,078 58,761 Deferred income 9,439 7,379 Items in the course of settlement 72,241 49,522 Other liabilities 68,271 73, , ,925 Provisions for pending litigation, claims and regulatory matters The movement for the year in the provisions for pending litigation, claims and regulatory matters is as follows: January 48,882 34,749 Increase of provisions (Note 15) 98,757 30,890 Utilisation of provisions (12,640) (7,931) Release of provisions (Note 15) (1,220) (7,924) Foreign exchange adjustments (461) (902) 31 December 133,318 48,882 The provisions for pending litigation, claims and regulatory matters are analysed as follows: Pending litigation or claims 62,646 25,234 Regulatory matters 70,672 23, December 133,318 48,882 The increase of provisions for regulatory matters during the six months ended 31 December 2017 mainly relates to increase in provision recognised on UK regulatory matters as detailed in Note The increase of provisions for pending litigation and claims during the six months ended 31 December 2017 mainly relates to increase in provision recognised on investigations and litigations relating to securities issued by BOC PCL as detailed in Note The increase of provisions during the year 2016 of 22,966 thousand includes an amount of 5,126 thousand which is classified in advisory and other restructuring costs in other operating expenses (Note 15). The provisions for pending litigation, claims and regulatory matters do not include insurance claims arising in the ordinary course of business of the Group s insurance subsidiaries as these are included in Insurance liabilities (Note 32). Further details on the pending litigations, claims and regulatory matters are disclosed in Note
130 35. Share capital Authorised Number of shares (thousand) Company BOC PCL Number of shares (thousand) Ordinary shares of 0.10 each 10,000,000 1,000,000 47,677,593 4,767,759 Issued 1 January 8,922, ,294 8,922, ,294 Cancellation of shares due to reorganisation (8,922,945) (892,294) - - Issue of shares 446,200 44, December 446,200 44,620 8,922, , Authorised and issued share capital 2017 The Extraordinary General Meeting (EGM) of the shareholders of BOC PCL held on 13 December 2016 approved a scheme of arrangement between the Company, BOC PCL and its shareholders. The scheme of arrangement introduced the Company as the new holding company of the Group. Additionally the EGM authorised the directors of BOC PCL to take all actions necessary or appropriate to carry the scheme of arrangement into effect. The scheme of arrangement was sanctioned by the District Court of Nicosia on 21 December Following the submission of the Court Order to the Registrar of Companies and the registration, by the latter, of the reduction of capital, the scheme of arrangement became effective on 18 January As a result on the same date, the authorised share capital of BOC PCL which amounted to 4,767,759, divided into 47,677,592,720 ordinary shares with a nominal value of 0.10 each was reduced to 3,875,464, divided into 38,754,648, ordinary shares with a nominal value of 0.10 each and its issued share capital which amounted to 892,294, divided into 8,922,944,533 ordinary shares with a nominal value of 0.10 each was reduced to nil by cancelling all the shares comprising the issued share capital of BOC PCL (the Existing Shares) resulting in the creation of a capital reduction reserve in the accounts of BOC PCL, equal to the aggregate nominal value of the Existing Shares so cancelled, and which shall be retained as a non-distributable capital reserve in accordance with the provisions of subsection (e) of section 64 of the Cyprus Companies Law, Cap. 113 (the Reduction of Capital). Following the reduction of the share capital of BOC PCL, the authorised share capital was increased to 4,767,759,272 divided into 47,677,592,720 ordinary shares with a nominal value of 0.10 each through the creation of 8,922,944,533 ordinary shares with a nominal value of 0.10 each, each of which have the same rights and rank pari passu with the existing ordinary shares of BOC PCL. Also, the reserve arising in the books of account of BOC PCL as a result of the cancellation of the Existing Shares was applied in paying up in full at par 8,922,944,533 new ordinary shares with a nominal value of 0.10 each in the capital of BOC PCL, which were issued and allotted, credited as fully paid, to the Company or its nominee(s) in accordance with the scheme of arrangement. As mentioned above, all of the shares comprising the issued share capital of BOC PCL were cancelled and BOC PCL issued and allotted 8,922,944,533 new ordinary shares of nominal value 0.10 each, credited as fully paid to the Company; and the Company issued and allotted new shares (New Shares) and procured the issue of Depositary Interests representing New Shares, in accordance with the terms of the scheme of arrangement. Each one New Share or one Depositary Interest represents one New Share for each individual holding of 20 Existing Shares. As a result, the Company issued 446,199,933 ordinary shares with a nominal value of 0.10 each There were no changes to the issued share capital during the year All issued ordinary shares carry the same rights. 128
131 35. Share capital (continued) Share premium reserve 2017 As a result of the implementation of the scheme of arrangement, the share premium reserve was created amounting to the difference between the nominal value of the shares issued pursuant to the terms of the scheme of arrangement and the net asset value of BOC PCL The share premium reserve was maintained pursuant to the provisions of section 55 of the Cyprus Companies Law, Cap. 113 and was not available for distribution to equity holders in the form of a dividend. The share premium as at 31 December 2016 was created in 2014 and 2015 by the issuance of 4,167,234 thousand shares of a nominal value of 0.10 each of a subscription price of 0.24 each, and was reduced by the relevant transaction costs of 30,794 thousand. Reorganisation of the Group Following the reorganisation of the Group on 18 January 2017 the Company became the sole shareholder of BOC PCL and consequently the new parent of the Group. This transaction did not result in any change of economic substance and hence did not have any effect on the total equity of the Group. The Group financial results reflect the difference of 558,420 thousand in the amounts of share capital, share premium and capital reduction reserves as an adjustment in equity. As these Consolidated Financial Statements are a continuation of the consolidated financial statements of the BOC group for the year ended 31 December 2016, the components of equity for the year then ended reflect the capital structure of BOC PCL and following the reorganisation these components of equity reflect the capital structure of the Company. Capital reduction reserve 2016 The capital reduction reserve was maintained pursuant to the provisions of section 55 of the Cyprus Companies Law, Cap. 113 and was not available for distribution to equity holders in the form of a dividend. The capital reduction reserve was created upon the reduction of the nominal value of ordinary shares from 1.00 each to 0.10 each in The reduction in capital amounted to 4,280,140 thousand, of which an amount of 2,327,654 thousand was applied against accumulated losses and an amount of 1,952,486 thousand was credited to the capital reduction reserve. Treasury shares of the Company Shares of the Company held by entities controlled by the Group are deducted from equity on the purchase, sale, issue or cancellation of such shares. No gain or loss is recognised in the consolidated income statement. During 2016 all treasury shares other than those held by the life insurance subsidiary of the Group were disposed of. Following the restructuring of the Group and the introduction of the Company as the new holding company of the Group, the shares held by the life insurance subsidiary were cancelled and New Shares of the Company were issued. The life insurance subsidiary of the Group, as at 31 December 2017, held a total of 142 thousand ordinary shares of the Company of a nominal value of 0.10 each (2016: 2,889 thousand ordinary shares of BOC PCL of a nominal value of 0.10 each), as part of its financial assets which are invested for the benefit of insurance policyholders. The cost of acquisition of these shares was 21,463 thousand (2016: 25,333 thousand). 129
132 35. Share capital (continued) Treasury shares of the Company (continued) The movement in treasury shares for the years ended 31 December 2017 and 2016 are as follows: Company BOC PCL Number of shares (thousand) Number of shares (thousand) 1 January 2,889 5,136 Disposals of treasury shares (45) (5,136) Cancellation of shares due to reorganisation (Note 2.1) (2,844) - Change of parent company to Bank of Cyprus Holdings Public Limited Company and issue of new shares (Note 2.1) Change in presentation of life insurance subsidiary s treasury shares - 2, December 142 2,889 The treasury shares represent 0.03% of the total issued share capital of the Company (2016: 0.03% of the issued share capital of BOC PCL). The Company did not provide financial assistance permitted by section 82 of the Companies Act 2014 for the purchase of its shares. Share-based payments - share options Following the incorporation of the Company and its introduction as the new holding company of the Group in January 2017, the Long Term Incentive Plan (as approved on 24 November 2015 by the Annual General Meeting of BOC PCL) was replaced by the Share Option Plan which operates at the level of the Company. The Share Option Plan is identical to the Long Term Incentive Plan except that the number of shares in the Company to be issued pursuant to an exercise of options under the Share Option Plan should not exceed 8,922,945 ordinary shares of a nominal value of 0.10 each and the exercise price was set at 5.00 per share. The term of the options was also extended to between 4-10 years after the grant date. No share options were granted since the date of replacement of the Long Term Incentive Plan by the Share Option Plan at the level of the Company. 36. Dividends The Company and BOC PCL are currently under a regulatory dividend distribution prohibition and therefore no dividends were declared or paid during years 2017 and Accumulated losses For the purpose of dividend distribution, retained earnings determined at the Company level, are the only distributable reserve. Companies, tax resident in Cyprus, which do not distribute at least 70% of their profits after tax as defined by the Special Defence Contribution Law during the two years after the end of the year of assessment to which the profits refer, will be deemed to have distributed this amount as dividend. Special defence contribution at 17% is payable on such deemed dividend distribution to the extent that the shareholders of the Company (individuals who are domiciled in Cyprus and companies) at the end of the period of two years from the end of the year of assessment to which the profits refer, are directly or indirectly Cyprus tax residents. Deemed distribution does not apply in respect of profits that are directly or indirectly attributable to shareholders that are non-cyprus tax residents and individual shareholders who are not domiciled in Cyprus. The amount of this deemed dividend distribution is reduced by any actual dividend paid out of the profits of the relevant year. 130
133 37. Accumulated losses (continued) This special defence contribution is paid by the company on account of the shareholders. During 2017 and 2016 no deemed dividend distribution was paid by the Company and by BOC PCL. 38. Fiduciary transactions The Group offers fund management and custody services that result in holding or investing financial assets on behalf of its customers. The Group is not liable to its customers for any default by other banks or organisations. The assets under management and custody are not included in the consolidated balance sheet of the Group unless they are placed with the Group. Total assets under management and custody at 31 December 2017 amounted to 1,120,817 thousand (2016: 1,054,210 thousand). 39. Contingent liabilities and commitments As part of the services provided to its customers, the Group enters into various irrevocable commitments and contingent liabilities. These consist of financial guarantees, letters of credit and other undrawn commitments to lend. Even though these obligations may not be recognised on the consolidated balance sheet, they do contain credit risk and are therefore part of the overall credit risk exposure of the Group (Note 44) Capital commitments Capital commitments for the acquisition of property, equipment and intangible assets as at 31 December 2017 amount to 38,306 thousand (2016: 14,830 thousand) Pending litigation, claims and regulatory matters The Group in the ordinary course of business is subject to enquiries and examinations, requests for information, audits, investigations and legal and other proceedings by regulators, governmental and other public bodies, actual and threatened, relating to the suitability and adequacy of advice given to clients or the absence of advice, lending and pricing practices, selling and disclosure requirements, record keeping, filings and a variety of other matters. In addition, as a result of the deterioration of the Cypriot economy and banking sector in 2012 and the subsequent restructuring of BOC PCL in 2013 as a result of the Bail-in Decrees, BOC PCL is subject to a large number of proceedings and investigations that either precede, or result from the events that occurred during the period of the Bail-in Decrees. Most ongoing investigations and proceedings of significance relate to matters arising during the period prior to the issue of the Bail-in Decrees. Apart from what is described below, the Group considers that none of these matters is material, either individually or in aggregate. The Group has not disclosed an estimate of the potential financial effect on its contingent liabilities arising from these matters where it is not practicable to do so because it is too early or the outcome is too uncertain or, in cases where it is practicable, where disclosure could prejudice conduct of the matters. Provisions have been recognised for those cases where the Group is able to estimate probable losses. Where an individual provision is material, the fact that a provision has been made is stated. Any provision recognised does not constitute an admission of wrongdoing or legal liability. While the outcome of these matters is inherently uncertain, management believes that, based on the information available to it, appropriate provisions have been made in respect of legal proceedings and regulatory matters as at 31 December 2017 and hence it is not believed that such matters, when concluded, will have a material impact upon the financial position of the Group. Further information is disclosed in Note Pending litigation and claims Investigations and litigation relating to securities issued by BOC PCL A number of institutional and retail customers have filed various separate actions against BOC PCL alleging that BOC PCL is guilty of misselling in relation to securities issued by BOC PCL between 2007 and Remedies sought include the return of the money investors paid for these securities. Claims are currently pending before the courts in Cyprus and in Greece, as well as the decisions and fines imposed upon BOC PCL in related matters by Cyprus Securities and Exchange Commission (CySEC) and/or Hellenic Capital Market Commission (HCMC). The bonds and capital securities in respect of which claims have been brought are the following: 2007 Capital Securities, 2008 Convertible Bonds, 2009 Convertible Capital Securities (CCS) and 2011 Convertible Enhanced Capital Securities (CECS). 131
134 39. Contingent liabilities and commitments (continued) 39.2 Pending litigation, claims and regulatory matters (continued) Pending litigation and claims (continued) Investigations and litigation relating to securities issued by BOC PCL (continued) BOC PCL is defending these claims, particularly with respect to institutional investors and retail purchasers who received investment advice from independent investment advisors. In the case of retail investors, if it can be documented that the relevant BOC PCL officers 'persuaded' them to proceed with the purchase and/or purported to offer 'investment advice', BOC PCL may face significant difficulties. To date, a number of cases have been tried in Greece. BOC PCL has appealed against any such cases which were not ruled in its favour. The resolution of the claims brought in the courts of Greece is expected to take a number of years. Also a small number of cases are being heard in Cyprus. No judgement has yet been issued. Provision has been made based on management's best estimate of probable outflows and based on advice of legal counsel. Bail-in related litigation Depositors A number of the BOC PCL's depositors, who allege that they were adversely affected by the bail-in, filed claims against BOC PCL and other parties (such as the CBC and the Ministry of Finance of Cyprus) on the grounds that, inter alia, the Resolution Law of 2013 and the Bail-in Decrees were in conflict with the Constitution of the Republic of Cyprus and the European Convention on Human Rights. They are seeking damages for their alleged losses resulting from the bail-in of their deposits. BOC PCL is defending these actions. Shareholders Numerous claims were filed by shareholders in 2013 (some of whom were shareholders of BOC PCL) against the Government and the CBC before the Supreme Court in relation to the dilution of their shareholding as a result of the recapitalisation pursuant to the Resolution Law and the Bail-in Decrees issued thereunder. These proceedings sought the cancellation and setting aside of the Bail-in Decrees as unconstitutional and/or unlawful and/or irregular. BOC PCL appeared in these proceedings as an interested party to support the position that the cases should be adjudicated upon in the context of private law. The Supreme Court ruled in these cases in October 2014 that the proceedings fall within private and public law and thus fall within the jurisdiction of the District Courts. As at the present date, both the Resolution Law and the Bail-in Decrees have not been annulled by a court of law and thus remain legally valid and in effect. A number of actions for damages have been filed and are still being filed with the District Courts of Cyprus. Claims based on set-off Certain claims have been filed by customers against BOC PCL alleging that the implementation of the bail-in under the Bail-in Decrees was not carried out correctly in relation to them and, in particular, that their rights of set-off were not properly respected. BOC PCL intends to contest such claims. Laiki Bank depositors and shareholders BOC PCL has been joined as a defendant with regards to certain claims which have been brought against Laiki Bank by its depositors, shareholders and holders of debt securities. These claims have been brought on grounds similar to the claims brought by BOC PCL s bailed-in depositors and shareholders as described above. BOC PCL, inter alia, maintains the position that it should not be a party to these proceedings. Implementation of Decrees Occasionally, other claims are brought against BOC PCL in respect of the implementation of the Decrees issued following the adoption of the Resolution Law (as regards the way and methodology whereby such Decrees have been implemented). Legal position of the Group All above claims are being vigorously disputed by the Group, in close consultation with the appropriate state and governmental authorities. The position of the Group is that the Resolution Law and the Decrees take precedence over all other laws. As matters now stand, both the Resolution Law and the Decrees issued thereunder are constitutional and lawful, in that they were properly enacted and have not so far been annulled by any court. 132
135 39. Contingent liabilities and commitments (continued) 39.2 Pending litigation, claims and regulatory matters (continued) Pending litigation and claims (continued) Provident fund case In December 2015, the Bank of Cyprus Employees Provident Fund (the Provident Fund) filed an action against BOC PCL claiming 70 million allegedly owed as part of BOC PCL's contribution by virtue of an agreement with the union dated 31 December Based on facts currently known, it is not practicable at this time for BOC PCL to predict the resolution of this matter, including the timing or any possible impact on BOC PCL, however at this stage the Group does not expect a material impact on its financial position. Employment litigation Former senior officers of BOC PCL have instituted a total of three claims for unfair dismissal and for Provident Fund entitlements against BOC PCL and Trustees of the Provident Fund. As at the present date one case had been dismissed as filed out of time, but the plaintiff has subsequently filed a civil action in the District Court on the same grounds as the previous case which was filed in the Labour Disputes Court. The Group does not consider that these cases will have a material impact upon its financial position. Swiss Francs loans litigation in Cyprus and UK A number of actions have been instituted against BOC PCL by borrowers who obtained loans in foreign currencies (mainly Swiss Francs). The central allegation in these cases is that BOC PCL misled these borrowers and/or misrepresented matters, in violation of applicable law. BOC PCL intends to contest such proceedings. The Group does not expect that these actions will have a material impact upon its financial position. UK property lending claims BOC PCL is the defendant in certain proceedings alleging that BOC PCL is legally responsible for allegedly, inter alia, advancing and misselling loans for the purchase by UK nationals of property in Cyprus. The proceedings in the United Kingdom are currently stayed in order for the parties to have time to negotiate possible settlements. General criminal investigations and proceedings The Attorney General and the Cypriot Police (the Police) are conducting various investigations and inquiries following and relating to the financial crisis which culminated in March BOC PCL is cooperating fully with the Attorney General and the Police and is providing all information requested of it. Based on the currently available information, the Group is of the view that any further investigations or claims resulting from these investigations will not have a material impact on its financial position. The Attorney General had filed a criminal case against BOC PCL and five former members of the Board of Directors for alleged market manipulation offences referring to the non-publication in a timely manner of the increased capital shortfall of BOC PCL in On 14 December 2017, the Court found BOC PCL and its former Chief Executive Officer guilty only in relation to the one charge regarding market manipulation and acquitted all accused of all remaining charges. On 5 January 2018 the Court imposed a fine of 120,000 on BOC PCL and a prison sentence of two and a half years on Mr. Andreas Eliades. BOC PCL has filed an appeal against both the decision and the fine imposed on it. The Attorney General had also filed a separate criminal case against BOC PCL and six former members of the Board of Directors of BOC PCL for alleged market manipulation offences referring to the non-disclosure of the purchase of the Greek Government Bonds during a specified period. On 18 December 2017, the Criminal Court dismissed the proceedings against the accused following a ruling by the Supreme Court (first instance jurisdiction) which rendered the charges void ab initio. The Attorney General has filed an appeal against the first instance ruling of the Supreme Court. In January 2017 the Attorney General has filed a criminal case against a number of current and former officers of BOC PCL relating to the reclassification of Greek Government Bonds in April No charges were instituted against BOC PCL in this case. The hearing of this case has not yet commenced. 133
136 39. Contingent liabilities and commitments (continued) 39.2 Pending litigation, claims and regulatory matters (continued) Provisions for regulatory matters The Hellenic Capital Market Commission (HCMC) Investigation The HCMC is currently in the process of investigating matters concerning the Group's investment in Greek Government Bonds from 2009 to 2011, including, inter-alia, related non-disclosure of material information in BOC PCL's CCS and CECS and rights issue prospectus (tracking the investigation carried out by CySEC in 2013), Greek government bonds' reclassification, ELA disclosures and allegations by some Greek Government Bond investors regarding BOC PCL's non-compliance with Markets in Financial Instruments Directive (MiFID) in respect of investors' direct investments in Greek Government Bonds. A specific estimate of the outcome of the investigations or of the amount of possible fines cannot be given at this stage, though it is not expected that any resulting liability or damages will have a material impact on the financial position of the Group. The Cyprus Securities and Exchange Commission (CySEC) Investigations The only pending CySEC investigation against BOC PCL concerns possible price manipulation attributable to BOC PCL for the period from 1 November 2009 to 30 June 2010 post the investment in Banca Transylvania. This is now pending for decision by the CySEC s Board. It is not expected that any resulting liability or fine will have a material impact on the financial position of the Group. Additionally, in late 2014 CySEC completed an investigation into the value of goodwill in CB Uniastrum Bank LLC disclosed in the interim financial statements of the Group in In October 2016, CySEC issued a decision, concluding that BOC PCL was in breach of certain laws regarding disclosure in accordance, inter alia, with the Market Manipulation (Market Abuse) Law of 2005 and has imposed an administrative fine upon BOC PCL of 25 thousand. CySEC also imposed higher fines upon certain former members of the Board of Directors and former management of BOC PCL. BOC PCL filed a recourse before the Administrative Court against the decisions of CySEC and the fine imposed upon BOC PCL. In March 2017, CySEC filed a legal action against BOC PCL, claiming the amount of 25 thousand imposed as a fine. In 2015, CySEC carried out an investigation into the reclassification of Greek Government Bonds in April 2010, which was also completed in 2016 with no findings being communicated to BOC PCL. On 1 December 2017 CySEC imposed a series of fines totaling 595 thousand upon BOC PCL and ten of its former directors for failing to adequately provide for doubtful debts in The fine imposed upon BOC PCL amounts to 15 thousand and BOC PCL has filed a recourse against the decision and fine before the Administrative Court. Commission for the Protection of Competition Investigation In April 2014, following an investigation which began in 2010, the Cypriot Commission for the Protection of Competition (the CPC) issued a statement of objections, alleging violations of Cypriot and EU competition law relating to the activities and/or omissions in respect of card payment transactions by, among others, BOC PCL and JCC Payment Systems Ltd (JCC), a card-processing business currently 75% owned by BOC PCL. There was also an allegation concerning BOC PCL's arrangements with American Express, namely that such exclusive arrangements violated Cypriot and EU competition law. On both matters, the CPC has concluded that BOC PCL (in common with other banks and JCC) has breached the relevant provisions of the applicable law for the protection of competition. In May 2017 the CPC imposed a fine of 18 million upon BOC PCL and BOC PCL filed a recourse against the decision and the fine. The payment of the fine has been stayed pending the final outcome of the recourse. 134
137 39. Contingent liabilities and commitments (continued) 39.2 Pending litigation, claims and regulatory matters (continued) Provisions for regulatory matters (continued) UK regulatory matters During 2016 and 2017 the BOC group recognised losses of 57,540 thousand on a conduct principle issue. The provision outstanding as at 31 December 2017 is 46,962 thousand (2016: 17,368 thousand). The level of the provision represents the best estimate of all probable outflows arising from customer redress based on information available to management. Management continues to reassess the adequacy of the provision, as well as the assumptions underlying the calculations based upon experience and other relevant factors prevailing at the time Other contingent liabilities The Group, as part of its disposal process of certain of its operations, has provided various representations, warranties and indemnities to the buyers. These relate to, among other things, the ownership of the loans, the validity of the liens, tax exposures and other matters agreed with the buyers. As a result, the Group may be obliged to compensate the buyers in the event of a valid claim by the buyers with respect to the above representations, warranties and indemnities. A provision has been made, based on management s best estimate of probable outflows, where it was assessed that such an outflow is probable. 135
138 40. Net cash flow from operating activities (Loss)/profit before tax (477,644) 85,616 Adjustments for: Provisions for impairment of loans and advances to customers and other customer credit losses and gain on derecognition and changes in expected cash flows 779, ,294 Depreciation of property and equipment 11,930 11,558 Amortisation of intangible assets 9,404 7,263 Impairment of property held for own use 8,470 - Impairment of other financial instruments 6,459 11,293 Profit upon disposal of disposal groups held for sale and discontinued operations - (2,545) Amortisation of discounts/premiums, catch-up adjustment on debt securities and interest on debt securities (22,669) (22,764) Loss on sale and write-offs of property and equipment and intangible assets Net losses/(gains) on disposal of investment properties and investment properties held for sale 752 (3,934) Net losses/(gains) from revaluation of investment properties and investment properties held for sale 3,309 (1,040) Dividend income (683) (343) Net gains on disposal of available-for-sale investments in equity securities (1,520) (58,368) Net gains on disposal of available-for-sale investments and investments classified as loans and receivables in debt securities (2,104) (8,441) Share of profit from associates and joint ventures (8,957) (8,194) Loss from revaluation of debt securities designated as fair value hedges 14,150 16,466 Loss on disposal/dissolution of subsidiaries 2,187 4,101 Net gains on disposal of stock of property (30,447) (1,361) Impairment of stock of property 50,502 36,220 Interest on funding from central banks 28 29,656 Interest on subordinated loan stock 22,258 - Change in value of in-force life insurance business (2,743) (4,680) Change in: 362, ,864 Loans and advances to banks 60,130 53,890 Deposits by banks 60, ,096 Obligatory balances with central banks (11,036) (19,890) Customer deposits 1,340,178 2,329,060 Value of in-force life insurance policies and liabilities 2,306 (7,058) Loans and advances to customers (227,629) 57,958 Other assets 28,424 20,039 Accrued income and prepaid expenses 374 (354) Other liabilities 91,673 52,698 Accrued expenses and deferred income 3,377 (1,530) Derivative financial instruments 5,075 (12,586) Investments at fair value through profit or loss (8,451) 7,769 Repurchase agreements (45) (110,784) Proceeds on disposals of stock of property 280, ,677 1,987,636 3,163,849 Tax received/(paid) 5,630 (1,224) Net cash flow from operating activities 1,993,266 3,162,
139 40. Net cash flow from operating activities (continued) Non-cash transactions 2017 Acquisition of Nicosia Mall Holdings (NMH) Limited During the year ended 31 December 2017 the Group acquired a 51% interest in the share capital of Nicosia Mall Holdings (NMH) Limited as part of the restructuring of its debt. The acquisition did not include any cash consideration. Further information is disclosed in Note Closure of the operations of Bank of Cyprus branch in Romania In accordance with the Group s strategy to exit from overseas non-core operations, the operations of the branch in Romania are expected to be terminated, subject to the completion of deregistration formalities with respective authorities during Most of the remaining assets and liabilities of the branch in Romania with third parties have been transferred to others entities of the Group. Repossession of collaterals During the year ended 31 December 2017, the Group acquired stock of property by taking possession of collaterals held as security for loans and advances to customers of 519,657 thousand (2016: 1,010,059 thousand) (Note 27) Acquisition of S.Z. Eliades Leisure Ltd During the year ended 31 December 2016 the Group acquired a 70% interest in the share capital of S.Z. Eliades Leisure Ltd in exchange for the settlement of the majority of the borrowing due from S.Z. Eliades Leisure Ltd to the Company, as part of the restructuring of its debt. The acquisition did not include any cash consideration. Further information is disclosed in Note Sale of shares held in Visa Europe Limited During the year ended 31 December 2016 the Group sold its shares held in Visa Europe Limited following the purchase of Visa Europe Limited by Visa Inc. The transaction in addition to the cash paid, involved the granting of preferred stock in Visa Inc. with a carrying value of approximately 8 million and a deferred cash component of a carrying value of approximately 4 million. Closure of the operations of Bank of Cyprus (Channel Islands) Ltd As part of the Group s strategy of focusing on its core businesses and markets, the Group decided the closure of the operations of Bank of Cyprus (Channel Islands) Ltd and the relocation of its business to other Group locations mainly Cyprus and the UK. Net cash flow from operating activities interest and dividends Interest paid (194,666) (200,266) Interest received 782,476 1,018,010 Dividends received , ,
140 40. Net cash flow from operating activities (continued) Changes in liabilities arising from financing activities Funding from central banks Subordinated loan stock Total January , ,014 Cash flows 79, , ,969 Foreign exchange adjustments - (680) (680) Other non-cash movements - 21,985 21, December , ,288 1,232, Cash and cash equivalents Cash and cash equivalents comprise: Cash and non-obligatory balances with central banks 3,240,201 1,363,699 Loans and advances to banks with original maturity less than three months 1,040, ,329 4,280,231 2,231,028 Analysis of cash and balances with central banks and loans and advances to banks Cash and non-obligatory balances with central banks 3,240,201 1,363,699 Obligatory balances with central banks 153, ,697 Total cash and balances with central banks (Note 19) 3,393,934 1,506,396 Loans and advances to banks with original maturity less than three months 1,040, ,329 Other restricted loans and advances to banks 117, ,398 Other loans and advances to banks 35,330 84,110 Total loans and advances to banks (Note 19) 1,192,633 1,087,837 Restricted loans and advances to banks include collaterals under derivative transactions of 59,997 thousand (2016: 55,017 thousand) which are not immediately available for use by the Group, but are released once the transactions are terminated. 138
141 42. Operating leases The Group as lessee The total future minimum lease payments under non-cancellable operating leases at 31 December 2017 and 2016 are presented below: Within one year 1,850 1,452 Between one and five years 2,663 3,296 After five years ,575 5,030 The above mainly relate to property leases for the Group s branches and offices. 139
142 43. Analysis of assets and liabilities by expected maturity Less than one year Over one year Total Less than one year Over one year Assets Cash and balances with central banks 3,241, ,538 3,393,934 1,364, ,447 1,506,396 Loans and advances to banks 1,094,918 97,715 1,192, , ,677 1,087,837 Derivative financial assets 1,495 16,532 18,027 20, ,835 Investments 39, ,372 1,029,422 76, , ,644 Loans and advances to customers Life insurance business assets attributable to policyholders Prepayments, accrued income and other assets Total 3,642,968 10,959,486 14,602,454 5,546,601 10,102,800 15,649,401 20, , ,678 19, , ,533 98, , , , , ,911 Stock of property 441,800 1,199,622 1,641, , ,168 1,427,272 Property, equipment and intangible assets , , , ,856 Investment properties - 19,646 19,646-38,059 38,059 Investments in associates and joint ventures - 118, , , ,339 Deferred tax assets 26, , ,498 2, , ,441 Non-current assets held for sale Liabilities 6,500-6,500 11,411-11,411 8,612,653 14,985,947 23,598,600 8,563,699 13,608,236 22,171,935 Deposits by banks 360, , , ,778 80, ,786 Funding from central banks 100, , , , , ,014 Repurchase agreements - 257, , , ,367 Derivative financial liabilities 15,205 35,687 50,892 9,434 39,191 48,625 Customer deposits 4,786,907 13,063,012 17,849,919 5,367,559 11,142,182 16,509,741 Insurance liabilities 89, , ,448 86, , ,997 Accruals, deferred income and other liabilities 283, , , ,332 62, ,925 Subordinated loan stock - 302, , Deferred tax liabilities - 46,113 46, ,358 45,375 5,635,832 15,346,060 20,981,892 6,341,136 12,724,694 19,065,830 The main assumptions used in determining the expected maturity of assets and liabilities are set out below. The investments are classified in the relevant time band based on expectations as to their realisation. In most cases this is the maturity date, unless there is an indication that the maturity will be prolonged or there is an intention to sell, roll or replace the security with a similar one. The latter would be the case where there is secured borrowing, requiring the pledging of bonds and these bonds mature before the maturity of the secured borrowing. The maturity of bonds is then extended to cover the period of the secured borrowing. 140
143 43. Analysis of assets and liabilities by expected maturity (continued) Trading investments are classified in the less than one year time band. Performing loans and advances to customers in Cyprus are classified based on the contractual repayment schedule. Overdraft accounts are classified in the over one year time band. The impaired loans as defined in Note 44, net of specific and collective provisions, and the loans which are past due for more than 90 days, are classified in the over one year time band except from expected receipts which are included within time bands, according to historic amounts of receipts in the last months. Stock of property is classified in the relevant time band based on expectations as to its realisation. The ELA funding which forms part of the funding from central banks has been included in the less than one year time band as at 31 December 2016, since it was expected to be repaid within one year. Funding under ELA has a contractual maturity of less than one year. A percentage of customer deposits in Cyprus maturing within one year is transferred in the over one year time band, based on the observed behavioural analysis. In the United Kingdom deposits are classified on the basis of contractual maturities. The expected maturity of all prepayments, accrued income and other assets and accruals, deferred income and other liabilities is the same as their contractual maturity. If they don t have a contractual maturity, the expected maturity is based on the timing the asset is expected to be realised and the liability is expected to be settled. 44. Risk management Credit risk In the ordinary course of its business the Group is exposed to credit risk which is monitored through various control mechanisms across all Group entities in order to prevent undue risk concentrations and to price credit facilities and products on a risk-adjusted basis. Credit risk is the risk that arises from the possible failure of one or more customers to meet their obligations towards the Group. The Credit Risk Management Department sets the Group s credit disbursement policies and monitors compliance with credit risk policy applicable to each business line and the quality of the Group s loans and advances portfolio through the timely assessment of problematic customers. The credit exposures from related accounts are aggregated and monitored on a consolidated basis. Credit Risk Management Department, safeguards the effective management of credit risk at all stages of the credit cycle, monitors the quality of decisions and processes and ensures that the credit sanctioning function is being properly managed. The credit policies are combined with the methods used for the assessment of the customers creditworthiness (credit rating and credit scoring systems). The loan portfolio is analysed on the basis of assessments about the customers creditworthiness, their economic sector of activity and the country in which they operate. The credit risk exposure of the Group is diversified both geographically and across the various sectors of the economy. The Credit Risk Management Department determines the prohibited/high risk/dangerous sectors of the economy and sets out stricter policy rules for these sectors, according to their level of riskiness. The Group s significant judgements, estimates and assumptions regarding the determination of the level of provisions for impairment are described in Note 5.1. The Market Risk department assesses the credit risk relating to investments in liquid assets (mainly loans and advances to banks and debt securities) and submits its recommendations for limits to be set for banks and countries to the ALCO for approval. 141
144 44. Risk management Credit risk (continued) Maximum exposure to credit risk and collateral and other credit enhancements The Group s maximum exposure to credit risk is analysed by geographic area as follows: On-balance sheet Cyprus 17,974,887 17,067,617 Greece 46,754 57,314 Russia 27,819 40,974 United Kingdom 2,056,334 1,602,229 Romania 64, ,093 20,169,946 18,933,227 Off-balance sheet Cyprus 2,934,269 2,738,382 Greece 72, ,596 United Kingdom 31,471 16,327 Romania ,039,340 2,867,702 Total on and off-balance sheet Cyprus 20,909,156 19,805,999 Greece 119, ,910 Russia 27,819 40,974 United Kingdom 2,087,805 1,618,556 Romania 65, ,490 23,209,286 21,800,
145 44. Risk management Credit risk (continued) Maximum exposure to credit risk and collateral and other credit enhancements (continued) The Group offers guarantee facilities to its customers under which the Group may be required to make payments on their behalf and enters into commitments to extend credit lines to secure their liquidity needs. Letters of credit and guarantee (including standby letters of credit) commit the Group to make payments on behalf of customers in the event of a specific act, generally related to the import or export of goods. Such commitments expose the Group to risks similar to those of loans and advances and are therefore monitored by the same policies and control processes. Loans and advances to customers The Credit Risk Management Department determines the amount and type of collateral and other credit enhancements required for the granting of new loans to customers. The main types of collateral obtained by the Group are mortgages on real estate, cash collateral/blocked deposits, bank guarantees, government guarantees, pledges of equity securities and debt instruments of public companies, fixed and floating charges over corporate assets, assignment of life insurance policies, assignment of rights on certain contracts and personal and corporate guarantees. The Group s management regularly monitors the changes in the market value of the collateral and, where necessary, requests the pledging of additional collateral in accordance with the relevant agreement. Other financial instruments Collateral held as security for financial assets other than loans and advances is determined by the nature of the financial instrument. Debt securities and other eligible bills are generally unsecured with the exception of asset-backed securities and similar instruments, which are secured by pools of financial assets. In addition, some debt securities are government-guaranteed. The Group has chosen the ISDA Master Agreement for documenting its derivatives activity. It provides the contractual framework within which dealing activity across a full range of over-the-counter (OTC) products is conducted and contractually binds both parties to apply close-out netting across all outstanding transactions covered by an agreement, if either party defaults. In most cases the parties execute a Credit Support Annex (CSA) in conjunction with the ISDA Master Agreement. Under a CSA, the collateral is passed between the parties in order to mitigate the market contingent counterparty risk inherent in their open positions. Settlement risk arises in any situation where a payment in cash or securities is made in the expectation of a corresponding receipt in securities or cash. The Group sets daily settlement limits for each counterparty. Settlement risk is mitigated when transactions are effected via established payment systems or on a delivery upon payment basis. The table below presents the maximum exposure to credit risk, the tangible and measurable collateral and credit enhancements held and the net exposure to credit risk, that is the exposure after taking into account the impairment loss and tangible and measurable collateral and credit enhancements held. Personal guarantees are an additional form of collateral, but are not included in the information below since it is impracticable to estimate their fair value. The fair value of the collateral presented in the tables below is capped to the carrying value of the loans and advances to customers. 143
146 Risk management Credit risk (continued) Maximum exposure to credit risk and collateral and other credit enhancements (continued) Maximum exposure to credit risk Cash Securities Fair value of collateral and credit enhancements held by the Group Letters of credit/ guarantee Property Other Surplus collateral Net collateral Net exposure to credit risk Balances with central banks (Note 19) 3,250, ,250,029 Loans and advances to banks (Note 19) 1,192, ,192,633 Trading investments - debt securities (Note 20) Debt securities classified as availablefor-sale and loans and receivables (Note 20) Derivative financial instruments (Note 21) Loans and advances to customers (Note 23) , ,392 18, ,027 14,602, , , ,848 21,803, ,362 (10,369,288) 13,054,500 1,547,954 Debtors (Note 28) 24, ,121 Reinsurers share of insurance contract liabilities (Note 28) 48, ,000 Other assets 83, , (1,516) 36,282 47,472 On-balance sheet total 20,169, , , ,646 21,803, ,362 (10,370,804) 13,090,782 7,079,164 Contingent liabilities Acceptances and endorsements 8, , (4,056) 6,653 1,714 Guarantees 768,165 85, , ,756 11, , ,705 Commitments Documentary credits 29,630 1, , ,372 20,258 Undrawn formal stand-by facilities, credit lines and other commitments to lend 2,233,178 38,132 5,563 1, ,309 36,266 (19,699) 464,114 1,769,064 Off-balance sheet total 3,039, ,183 6,034 5, ,432 48,236 (23,755) 734,599 2,304,741 Total credit risk exposure 23,209, , , ,115 22,376, ,598 (10,394,559) 13,825,381 9,383,
147 Risk management Credit risk (continued) Maximum exposure to credit risk and collateral and other credit enhancements (continued) Maximum exposure to credit risk Cash Securities Fair value of collateral and credit enhancements held by the Group Letters of credit/ guarantee 145 Property Other Surplus collateral Net collateral Net exposure to credit risk Balances with central banks (Note 19) 1,373, ,373,802 Loans and advances to banks (Note 19) 1,087, ,087,837 Trading investments - debt securities (Note 20) Debt securities at fair value through profit or loss (Note 20) Debt securities classified as availablefor-sale and loans and receivables (Note 20) Derivative financial instruments (Note 21) Loans and advances to customers (Note 23) , , , ,666 20, ,835 15,649, , , ,202 22,250, ,500 (9,949,923) 13,789,006 1,860,395 Debtors (Note 28) 24, ,571 Reinsurers share of insurance contract liabilities (Note 28) 49, ,973 Other assets 107, , (967) 58,689 48,551 On-balance sheet total 18,933, , , ,858 22,250, ,500 (9,950,890) 13,847,695 5,085,532 Contingent liabilities Acceptances and endorsements 7, , (4,090) 5,822 1,784 Guarantees 797,269 69,720 1,326 5, ,880 6,222 (210) 247, ,802 Commitments Documentary credits 27,636 10, , ,363 8,273 Undrawn formal stand-by facilities, credit lines and other commitments to lend 2,035,191 31,449 1,050 2, ,280 16,158 (19,705) 360,453 1,674,738 Off-balance sheet total 2,867, ,381 2,391 7, ,796 22,690 (24,005) 633,105 2,234,597 Total credit risk exposure 21,800, , , ,710 22,762, ,190 (9,974,895) 14,480,800 7,320,129
148 44. Risk management Credit risk (continued) Credit risk concentration of loans and advances to customers There are restrictions on loan concentrations which are imposed by the Banking Law in Cyprus, the relevant CBC Directives and CRR. According to these restrictions, banks are prohibited from lending more than 25% of the capital base to a single customer group. The Group s risk appetite statement imposes stricter concentration limits and the Group is taking actions to run down those exposures which are in excess of the internal limits over time. In addition to the above, the Group s overseas subsidiaries must comply with guidelines for large exposures as set by the regulatory authorities of the countries in which they operate. BOC PCL categorises its loans using the following customer sectors: Retail all personal customers and small businesses with facilities from BOC PCL of up to 260 thousand, excluding professional property loans; SME any company or group of companies (including personal and housing loans to the directors or shareholders of a company) with facilities with BOC PCL in the range of 260 thousand to 6 million and a maximum annual credit turnover of 10 million; and Corporate any company or group of companies (including personal and housing loans to the directors or shareholders of a company) with available credit lines with BOC PCL in excess of an aggregate principal amount of 6 million or having a minimum annual credit turnover of 10 million. In addition, Bank of Cyprus UK Ltd defines corporate loans as loans over 1 million. SME loans are loans less than 1 million and retail loans relate to individuals. Fair value adjustment on initial recognition The fair value adjustment on initial recognition relates to the loans and advances to customers acquired as part of the acquisition of certain operations of Laiki Bank in 2013 and originated credit impaired loans. In accordance with the provisions of IFRS 3, this adjustment has decreased the gross balance of loans and advances to customers. However, for IFRS 7 disclosure purposes as well as for credit risk monitoring, the aforementioned adjustment is not presented within the gross balances of loans and advances. 146
149 44. Risk management Credit risk (continued) Credit risk concentration of loans and advances to customers (continued) Geographical and industry concentrations of Group loans and advances to customers are presented below: 2017 Cyprus Greece United Kingdom Romania Russia Total Fair value adjustment on initial recognition Gross loans after fair value adjustment on initial recognition By economic activity Trade 1,969,360-13,859 8,925 49,322 2,041,466 (71,636) 1,969,830 Manufacturing 630,101-6,468 7,416 20, ,552 (19,968) 644,584 Hotels and catering 1,283, ,808 6,208-1,393,528 (47,257) 1,346,271 Construction 2,310,057-3,398 12,236 11,764 2,337,455 (144,899) 2,192,556 Real estate 1,760,498 15,003 1,339,680 80, ,196,112 (89,647) 3,106,465 Private individuals 6,677, , ,775,963 (195,686) 6,580,277 Professional and other services 1,181,920-54,616 9,223 62,325 1,308,084 (61,954) 1,246,130 Other sectors 1,000, ,231 35,552-1,037,555 (37,438) 1,000,117 By customer sector 16,813,552 15,555 1,621, , ,979 18,754,715 (668,485) 18,086,230 Corporate 7,100,987 15,341 1,295, , ,701 8,699,433 (333,740) 8,365,693 SMEs 3,254, ,509 6,801 10,278 3,510,330 (121,514) 3,388,816 Retail - housing 4,097,800-72, ,170,656 (88,799) 4,081,857 - consumer, credit cards and other 2,049, , ,063,608 (116,752) 1,946,856 International banking services 256, ,554 (3,005) 253,549 Wealth management 54, ,134 (4,675) 49,459 16,813,552 15,555 1,621, , ,979 18,754,715 (668,485) 18,086,
150 44. Risk management Credit risk (continued) Credit risk concentration of loans and advances to customers (continued) 2017 Cyprus Greece United Kingdom Romania Russia Total Fair value adjustment on initial recognition Gross loans after fair value adjustment on initial recognition By business line Corporate 3,321,730 15,341 1,293,304 96, ,701 4,860,574 (83,251) 4,777,323 SMEs 1,219, ,509 6,801 10,278 1,474,938 (14,566) 1,460,372 Retail - housing 3,007,487-72, ,080,343 (30,274) 3,050,069 - consumer, credit cards and other 1,085, , ,099,419 (14,348) 1,085,071 Restructuring - major corporate 1,292, ,860-1,326,467 (55,850) 1,270,617 - corporate 777, ,460 (15,303) 762,157 - SMEs 1,085, ,085,221 (37,096) 1,048,125 - retail housing 437, ,892 (6,319) 431,573 - retail other 226, ,623 (8,037) 218,586 Recoveries - corporate 1,709,190-2,406 23,336-1,734,932 (179,336) 1,555,596 - SMEs 950, ,171 (69,852) 880,319 - retail housing 652, ,421 (52,206) 600,215 - retail other 737, ,566 (94,367) 643,199 International banking services 256, ,554 (3,005) 253,549 Wealth management 54, ,134 (4,675) 49,459 16,813,552 15,555 1,621, , ,979 18,754,715 (668,485) 18,086,230 Restructuring major corporate business line includes customers with exposures over thousand, whereas restructuring corporate business line includes customers with exposures between thousand and thousand. 148
151 44. Risk management Credit risk (continued) Credit risk concentration of loans and advances to customers (continued) 2016 Cyprus Greece United Kingdom Romania Russia Total Fair value adjustment on initial recognition Gross loans after fair value adjustment on initial recognition By economic activity Trade 2,044,324-13,964 11,141 55,100 2,124,529 (87,576) 2,036,953 Manufacturing 658,811-7,133 7,735 25, ,075 (25,734) 673,341 Hotels and catering 1,302, ,773 3,263-1,418,579 (62,665) 1,355,914 Construction 2,874,331-3,181 75,918 12,793 2,966,223 (210,436) 2,755,787 Real estate 2,022,559 19,599 1,056, ,825 6,934 3,306,841 (114,140) 3,192,701 Private individuals 6,980, ,557 3,093-7,029,247 (227,057) 6,802,190 Professional and other services 1,332,250-54,865 12,458 97,148 1,496,721 (80,501) 1,416,220 Other sectors 1,054, ,361 32,927-1,088,880 (120,344) 968,536 By customer sector 18,269,456 20,150 1,295, , ,371 20,130,095 (928,453) 19,201,642 Corporate 7,517,473 19,936 1,040, , ,293 9,092,083 (481,340) 8,610,743 SMEs 4,100, ,337 12,641 11,144 4,346,420 (202,240) 4,144,180 Retail - housing 4,202,358-13, ,215,772 (100,509) 4,115,263 - consumer, credit cards and other 2,064, , ,934 2,091,295 (135,350) 1,955,945 International banking services 321, ,571 (3,619) 317,952 Wealth management 62, ,954 (5,395) 57,559 18,269,456 20,150 1,295, , ,371 20,130,095 (928,453) 19,201,
152 44. Risk management Credit risk (continued) Credit risk concentration of loans and advances to customers (continued) 2016 Cyprus Greece United Kingdom Romania Russia Total Fair value adjustment on initial recognition Gross loans after fair value adjustment on initial recognition By business line Corporate 2,557,653 19,936 1,036, , ,592 4,016,715 (71,064) 3,945,651 SMEs 1,377, ,337 12,442 11,144 1,623,760 (29,071) 1,594,689 Retail - housing 3,531,293-13, ,544,707 (40,640) 3,504,067 - consumer, credit cards and other 1,317, , ,335,444 (26,435) 1,309,009 Restructuring - major corporate 2,080, ,947-2,114,533 (156,190) 1,958,343 - corporate 1,014, ,014,853 (22,795) 992,058 - SMEs 1,219, ,219,572 (50,393) 1,169,179 Recoveries - corporate 1,864,381-4,610 63,290 13,701 1,945,982 (231,291) 1,714,691 - SMEs 1,502, ,503,088 (122,776) 1,380,312 - retail housing 671, ,065 (59,869) 611,196 - retail other 747,368-1,549-6, ,851 (108,915) 646,936 International banking services 321, ,571 (3,619) 317,952 Wealth management 62, ,954 (5,395) 57,559 18,269,456 20,150 1,295, , ,371 20,130,095 (928,453) 19,201,642 The loans and advances to customers in Cyprus include lending exposures to Greek entities granted by the Company in Cyprus in its normal course of business with a carrying value of 69,616 thousand (2016: 82,154 thousand) and lending exposures in Cyprus with collaterals in Greece with a carrying value of 98,660 thousand (2016: 106,968 thousand). Additionally as at 31 December 2017, the loans and advances to customers in Cyprus include lending exposures to Serbian entities or with collaterals in Serbia with a carrying value of 15,000 thousand (2016: 9,700 thousand). 150
153 44. Risk management Credit risk (continued) Currency concentration of loans and advances to customers 2017 Cyprus Greece United Kingdom Romania Russia Total Fair value adjustment on initial recognition Gross loans after fair value adjustment on initial recognition Euro 16,000,016 15,555 16, ,518 16,053 16,207,192 (649,671) 15,557,521 US Dollar 228, , ,634 (525) 271,109 British Pound 74,707-1,599, ,674,643 (423) 1,674,220 Russian Rouble ,376 85,605 (1) 85,604 Romanian Lei Swiss Franc 451,883-2, ,011 (14,525) 439,486 Other currencies 58,057-2, ,663 (3,340) 57,323 16,813,552 15,555 1,621, , ,979 18,754,715 (668,485) 18,086, Euro 17,563,760 20, ,931 16,079 17,946,149 (882,038) 17,064,111 US Dollar 149, , ,182 (10,281) 212,901 British Pound 38,907-1,276, ,315,653 (538) 1,315,115 Russian Rouble , ,938 (1) 107,937 Romanian Lei ,341-1,341-1,341 Swiss Franc 471,167-7, ,737 (31,170) 447,567 Other currencies 46,284-10, ,095 (4,425) 52,670 18,269,456 20,150 1,295, , ,371 20,130,095 (928,453) 19,201,
154 44. Risk management Credit risk (continued) Credit quality of loans and advances to customers The following table presents the credit quality of the Group s loans and advances to customers: Neither past due nor impaired Past due but not impaired Gross loans before fair value adjustment on initial recognition Fair value adjustment on initial recognition Gross loans after fair value adjustment on initial recognition Gross loans before fair value adjustment on initial recognition Fair value adjustment on initial recognition Gross loans after fair value adjustment on initial recognition ,149,969 (140,405) 11,009,564 10,990,773 (166,185) 10,824,588 2,084,694 (29,554) 2,055,140 2,238,127 (38,743) 2,199,384 Impaired 5,520,052 (498,526) 5,021,526 6,901,195 (723,525) 6,177,670 18,754,715 (668,485) 18,086,230 20,130,095 (928,453) 19,201,642 Past due loans are those with delayed payments or in excess of authorised credit limits. Impaired loans are those for which a provision for impairment has been recognised on an individual basis or for which incurred losses exist at their initial recognition or customers in Debt Recovery. During the year ended 31 December 2017 the total gross amount of non-contractual write-offs recorded by the Group amounted to 466,248 thousand (2016: 517,694 thousand). The remaining gross loan balance of these customers as at 31 December 2017 was 326,636 thousand (2016: 305,591 thousand), of which 23,090 thousand (2016: 19,651 thousand) were past due for more than 90 days but not impaired and 230,832 thousand (2016: 130,964 thousand) were impaired. Loans and advances to customers that are neither past due nor impaired The credit quality of loans and advances to customers that were neither past due nor impaired is monitored by the Group using internal systems. The table below presents the credit risk quality of loans and advances to customers that were neither past due nor impaired Grade 1 Grade 2 Grade 3 Total Cyprus 7,031,123 1,384,121 1,158,512 9,573,756 United Kingdom 1,503,234 48,975 22,812 1,575,021 Romania ,192 8,535,335 1,433,096 1,181,538 11,149, Cyprus 6,127,350 1,751,332 1,802,957 9,681,639 Greece United Kingdom 1,187,130 53,838 10,011 1,250,979 Romania 56, ,898 Russia ,371,337 1,805,518 1,813,918 10,990,
155 44. Risk management Credit risk (continued) Credit quality of loans and advances to customers (continued) Loans and advances to customers that are neither past due nor impaired (continued) Loans and advances to customers that were neither past due nor in excess of their limit during the last twelve months, are classified as Grade 1. Loans and advances to customers that were past due or in excess of their limit for up to 30 consecutive days during the first half of the year or for up to 15 consecutive days during the second half of the year, are classified as Grade 2. Loans and advances to customers that were past due or in excess of their limit for more than 30 consecutive days during the first half of the year or for more than 15 consecutive days during the second half of the year, are classified as Grade 3. Loans and advances to customers that are past due but not impaired Past due analysis: up to 30 days 438, , to 90 days 261, , to 180 days 124, , to 365 days 252, ,714 - over one year 1,008,185 1,138,183 2,084,694 2,238,127 The fair value of the collateral that the Group holds (to the extent that it mitigates credit risk) in respect of loans and advances to customers that are past due but not impaired as at 31 December 2017 is 1,688,623 thousand (2016: 1,762,528 thousand). The fair value of the collateral is capped to the gross carrying value of the loans and advances to customers. Impaired loans and advances to customers Gross loans and advances Fair value of collateral Gross loans and advances Fair value of collateral Cyprus 5,213,278 3,297,980 6,384,503 3,953,086 Greece 15,555 7,041 19,936 17,962 Russia 143,979 34, ,144 87,381 United Kingdom 6,447 19,932 12,041 7,213 Romania 140,793 20, ,571 54,436 5,520,052 3,380,185 6,901,195 4,120,
156 44. Risk management Credit risk (continued) Credit quality of loans and advances to customers (continued) Impaired loans and advances to customers (continued) The fair value of the collateral presented above has been computed based on the extent that the collateral mitigates credit risk and has been capped to the gross carrying value of the loans and advances to customers Impaired: no arrears 401, ,855 - up to 30 days 141,329 62, to 90 days 20,880 29, to 180 days 26,340 49, to 365 days 73,073 51,438 - over one year 4,856,497 6,237,010 5,520,052 6,901,195 Provision for impairment of loans and advances to customers The movement in provisions for impairment of loans and advances is as follows: 2017 Cyprus United Kingdom Other countries Total January 3,170,161 10, ,298 3,552,241 Transfer between geographical areas 23 (23) - - Transfer upon acquisition of property through a restructuring activity (12,792) - - (12,792) Foreign exchange and other adjustments 77,234 (183) (7,059) 69,992 Applied in writing off impaired loans and advances (831,708) (117) (138,684) (970,509) Interest accrued on impaired loans and advances (97,951) (2) (1,406) (99,359) Collection of loans and advances previously written off 5, ,264 Charge for the year (Note 16) 925,161 (3,222) 16, , December 3,236,103 7, ,151 3,483,776 Individual impairment 2,367,205 4, ,739 2,599,695 Collective impairment 868,898 2,771 12, ,
157 44. Risk management Credit risk (continued) Provision for impairment of loans and advances to customers (continued) 2016 Cyprus United Kingdom Other countries Total January 3,731,750 39, ,289 4,193,433 Dissolution of subsidiaries - (6,154) - (6,154) Acquisition of subsidiary (8,577) - - (8,577) Foreign exchange and other adjustments 113,109 (2,232) 16, ,602 Applied in writing off impaired loans and advances (923,723) (16,945) (114,597) (1,055,265) Interest accrued on impaired loans and advances (138,603) - (1,909) (140,512) Collection of loans and advances previously written off 1, ,953 Charge for the year (Note 16) 394,333 (3,281) 48, , December 3,170,161 10, ,298 3,552,241 Individual impairment 2,779,379 7, ,623 3,157,790 Collective impairment 390,782 2, ,451 The above table does not include the fair value adjustments on initial recognition of loans acquired from Laiki Bank and provisions for impairment on financial guarantees and commitments which are part of Accruals, deferred income and other liabilities (Note 34). Assumptions have been made about the future changes in property values, as well as the timing for the realisation of the collateral, taxes and expenses on the repossession and subsequent sale of the collateral as well as any other applicable haircuts. Indexation has been used to estimate updated market values of properties, while assumptions were made on the basis of a macroeconomic scenario for future changes in property values. During 2017, the Group, following a reconsideration of its strategy, to more actively explore other innovative strategic solutions to further accelerate balance sheet de-risking, has modified certain of its provisioning assumptions and estimates. At 31 December 2017 the weighted average haircut (including liquidity haircut and selling expenses) used in the collective provisions calculation is c.34% (2016: average of 10% of the current market value of the property for those collaterals for which the increase in their value is capped to zero and 10% of the projected market value of the property for those collaterals for which their value is expected to drop). The timing of recovery from real estate collaterals used in the collective provision calculation has been estimated to be on average 6 years (2016: average of 3 years except for customers in Debt Recovery, average of 6 years). For the calculation of specific provisions, the timing of recovery of collaterals as well as the haircuts used were based on the specific facts and circumstances of each case. In accordance with the Loan Impairment and Provisioning Procedures Directives of 2014 and 2015 of the CBC, the cumulative average future change in property values during the year has been capped to zero. The above assumptions are also influenced by the ongoing regulatory dialogue BOC PCL maintains with its lead regulator, the ECB, and other regulatory guidance and interpretations issued by various regulatory and industry bodies such as the ECB and EBA, which provide guidance and expectations as to relevant definitions and the treatment/classification of certain parameters/assumptions used in the estimation of provisions. 155
158 44. Risk management Credit risk (continued) Provision for impairment of loans and advances to customers (continued) Any changes in these assumptions or difference between assumptions made and actual results could result in significant changes in the amount of required provisions for impairment of loans and advances. Sensitivity analysis The Group has performed sensitivity analysis on certain of the loan impairment assumptions relating to the loan portfolio in Cyprus with reference date 31 December The impact on the provisions for impairment of loans and advances is presented below: Increase/(decrease) on provisions for impairment of loans and advances Change in provisions assumptions: 000 Increase the timing of recovery from collaterals by 1 year for all customers 120,700 Decrease the timing of recovery from collaterals by 1 year for all customers (121,875) Increase haircuts by 5% on all customers 179,447 Decrease haircuts by 5% on all customers (169,291) Increase the average expected recovery period by 1 year and decrease of haircuts by 5% on all customers Decrease the average expected recovery period by 1 year and increase haircuts by 5% on all customers (47,199) 59,748 Collateral and other credit enhancements obtained The carrying value of assets obtained during 2017 and 2016 by taking possession of collateral held as security, was as follows: Residential property 77,932 85,171 Commercial and other property 444,536 1,000, ,468 1,085,704 The total carrying value of the assets obtained over the years by taking possession of collateral held as security for customer loans and advances and held by the Group as at 31 December 2017 amounted to 1,611,091 thousand (2016: 1,395,127 thousand including an amount of 3,072 thousand relating to commercial and other property which were classified as held for sale). The disposals of repossessed assets during 2017 amounted to 247,030 thousand (2016: 129,002 thousand). 156
159 44. Risk management Credit risk (continued) Forbearance Forbearance measures occur in situations in which the borrower is considered to be unable to meet the terms and conditions of the contract due to financial difficulties. Taking into consideration these difficulties, the Group decides to modify the terms and conditions of the contract to provide the borrower the ability to service the debt or refinance the contract, either partially or fully. The practice of extending forbearance measures constitutes a grant of a concession whether temporarily or permanently to that borrower. A concession may involve restructuring the contractual terms of a debt or payment in some form other than cash, such as an arrangement whereby the borrower transfers collateral pledged to the Group. As such, it constitutes an objective indicator that requires assessing whether impairment is needed. Modifications of loans and advances that do not affect payment arrangements, such as restructuring of collateral or security arrangements are not regarded as sufficient to indicate impairment as by themselves they do not necessarily indicate credit distress affecting payment ability. Rescheduled loans and advances are those facilities for which the Group has modified the repayment programme (provision of a grace period, suspension of the obligation to repay one or more instalments, reduction in the instalment amount and/or elimination of overdue instalments relating to capital or interest) and current accounts/overdrafts for which the credit limit has been increased with the sole purpose of covering an excess. For an account to qualify for rescheduling it must meet certain criteria including that the client s business must be considered to be viable. The extent to which the Group reschedules accounts that are eligible under its existing policies may vary depending on its view of the prevailing economic conditions and other factors which may change from year to year. In addition, exceptions to policies and practices may be made in specific situations in response to legal or regulatory agreements or orders. Forbearance activities may include measures that restructure the borrower's business (operational restructuring) and/or measures that restructure the borrower s financing (financial restructuring). Restructuring options may be of a short or long-term nature or combination thereof. The Group has developed and deployed restructuring solutions, which are suitable for the borrower and acceptable for the Group. Short-term restructuring solutions are defined as restructured repayment solutions of duration of less than two years. In the case of loans for the construction of commercial property and project finance, a short-term solution may not exceed one year. Short-term restructuring solutions can include the following: Interest only: during a defined short-term period, only interest is paid on credit facilities and no principal repayment is made. Reduced payments: decrease of the amount of repayment instalments over a defined short-term period in order to accommodate the borrower s new cash flow position. Arrears and/or interest capitalisation: the capitalisation of arrears and/or of accrued interest arrears to the principal; that is forbearance of the arrears and addition of any unpaid interest to the outstanding principal balance for repayment under a rescheduled program. Grace period: an agreement allowing the borrower a defined delay in fulfilling the repayment obligations usually with regard to the principal. 157
160 44. Risk management Credit risk (continued) Forbearance (continued) Long-term restructuring solutions can include the following: Interest rate reduction: permanent or temporary reduction of interest rate (fixed or variable) into a fair and sustainable rate. Extension of maturity: extension of the maturity of the loan which allows a reduction in instalment amounts by spreading the repayments over a longer period. Discounted Sale (Sale by agreement/assisted sale): when BOC PCL and the borrower agree to voluntarily dispose of the secured asset(s) to partially or fully repay the debt. Rescheduling of payments: the existing contractual repayment schedule is adjusted to a new sustainable repayment program based on a realistic, current and forecasted, assessment of the cash flow generation of the borrower. Conversion of currency: the aim should be to align the currency of the debt to the currency of the cash flows. Alteration of contract conditions/covenants: when BOC PCL discharges the borrower of covenants or conditions included in a loan agreement. New loan facilities: new loan facilities may be granted during a restructuring agreement, which may entail the pledge of additional security and in the case of inter-creditor arrangements the introduction of covenants in order to compensate for the additional risk incurred by the Group in providing a new financing to a distressed borrower. Debt consolidation: the combination of multiple exposures into a single loan or limited number of loans. Debt/asset swaps: agreement between the Group and the borrower to voluntarily dispose of the secured asset to partially or fully repay the debt. The asset may be acquired by the Group and any residual debt may be restructured within an appropriate repayment schedule in line with the borrower s reassessed repayment ability. Partial or total debt forgiveness: this corresponds to BOC PCL forfeiting the right to legally recover part or the whole of the amount of debt outstanding by the borrower. The Group applies the debt forgiveness solution only as a last resort and in remote cases having taken into consideration the ability of the borrower to repay the remaining debt in the agreed timeframe and the moral hazard. Debt forgiveness (write-off) and restructuring: this corresponds to BOC PCL forfeiting the right to legally recover part of the amount of debt outstanding by the borrower. Rollover: consists of modifying the maturity date, providing for the same interest for the extended period of time granted for repayment. Split and freeze: the customer s debt is split into sustainable and unsustainable parts. The sustainable part is restructured and continues to operate. The unsustainable part is frozen for the restructured duration of the sustainable part. At the maturity of the restructuring, the frozen part is either forgiven pro-rata (based on the actual repayment of the sustainable part) or restructured. Debt/equity swaps: partial set-off of the debt and obtaining of an equivalent amount of equity by the Group, with the remaining debt right-sized to the cash flows of the borrower to allow repayment to the Group from repayment on the re-sized debt and from the eventual sale of the equity stake in the business. This solution is used only in exceptional cases and only where all other efforts for restructuring are exhausted and after ensuring compliance with the banking law. In addition, the following solutions can be used: a) Additional security: when additional liens on unencumbered assets are obtained as additional security from the borrower in order to compensate for the higher risk exposure and as part of the restructuring process. b) Capture surplus cash: aims at securing cash flows, which may currently not be unencumbered and/or not pledged by BOC PCL. Surplus cash may be obtained, for example, from higher cash flows from operations, as well as from disposal of collaterals, or unencumbered assets. Rescheduled loans and advances to customers The below tables present the Group s rescheduled loans and advances to customers by industry sector, geography and credit quality classification, as well as impairment provisions and tangible collateral held for rescheduled loans. 158
161 44. Risk management Credit risk (continued) Rescheduled loans and advances to customers (continued) 2017 Cyprus Greece Russia United Kingdom Romania Total January 7,401, ,893 90,323 78,881 7,655,304 New loans and advances rescheduled in the year 402, , ,034 Assets no longer classified as rescheduled (including repayments) (1,326,918) - (7,998) (79,147) (52,034) (1,466,097) Applied in writing off rescheduled loans and advances (461,468) - - (2) (13,076) (474,546) Interest accrued on rescheduled loans and advances 278, , ,256 Foreign exchange adjustments (21,917) - (5,300) (1,393) (327) (28,937) 31 December 6,272, ,595 9,886 18,249 6,372, January 8,391,624 24, , , ,185 8,790,282 New loans and advances rescheduled in the year 900, , ,736 Assets no longer classified as rescheduled (including repayments) (1,504,769) (97) (77,308) (68,305) (42,843) (1,693,322) Applied in writing off rescheduled loans and advances (715,713) (24,871) - (255) (189) (741,028) Interest accrued on rescheduled loans and advances 326, , ,649 Foreign exchange adjustments 3,852-22,825 (12,686) (4) 13, December 7,401, ,893 90,323 78,881 7,655,304 The classification as rescheduled loans is discontinued when all EBA criteria for the discontinuation of the classification as forborne exposure are met. These are set out in the ECB Guidance to Banks on Non-Performing Loans. 159
162 44. Risk management Credit risk (continued) Rescheduled loans and advances to customers (continued) Credit quality 2017 Cyprus Greece Russia United Kingdom Romania Total Neither past due nor impaired 3,158, , ,164,356 Past due but not impaired 1,218, ,354-1,220,514 Impaired 1,895, ,595 2,149 18,170 1,987, ,272, ,595 9,886 18,249 6,372,014 Neither past due nor impaired 4,021, , ,107,730 Past due but not impaired 1,212, , ,215,582 Impaired 2,167, ,222 2,092 78,571 2,331,992 7,401, ,893 90,323 78,881 7,655,
163 44. Risk management Credit risk (continued) Rescheduled loans and advances to customers (continued) Fair value of collateral 2017 Cyprus Russia United Kingdom Romania Total Neither past due nor impaired 2,818,937-5, ,824,375 Past due but not impaired 1,020,063-2,353-1,022,416 Impaired 1,437,734 14,500 1,131 9,948 1,463,313 5,276,734 14,500 8,829 10,041 5,310, Neither past due nor impaired 3,772,578-85, ,858,319 Past due but not impaired 1,021, , ,024,704 Impaired 1,828,036 47,740 1,974 22,060 1,899,810 6,621,961 48,411 90,139 22,322 6,782,833 The fair value of collateral presented above has been computed based on the extent that the collateral mitigates credit risk. 161
164 44. Risk management Credit risk (continued) Rescheduled loans and advances to customers (continued) Credit risk concentration 2017 Cyprus Greece Russia United Kingdom Romania Total By economic activity Trade 607,700-31, ,095 Manufacturing 201,377-12, ,857 Hotels and catering 429, , ,762 Construction 1,222,591-8,212-11,933 1,242,736 Real estate 862, ,837 5, ,746 Private individuals 2,221, ,593-2,223,058 Professional and other services 359,970-18, ,607 Other sectors 367, ,153 6,272, ,595 9,886 18,249 6,372,014 By customer sector Corporate 2,923, ,925 3,867 18,249 3,012,078 SMEs 1,310,652-4,670 4,549-1,319,871 Retail - housing 1,430, ,430,760 - consumer, credit cards and other 552, , ,378 International banking services 53, ,103 Wealth management 1, ,824 6,272, ,595 9,886 18,249 6,372,
165 44. Risk management Credit risk (continued) Rescheduled loans and advances to customers (continued) Credit risk concentration (continued) 2017 Cyprus Greece Russia United Kingdom Romania Total By business line Corporate 795, ,925 3,867 14, ,481 SMEs 344,957-4,670 4, ,176 Retail - housing 958, ,415 - consumer, credit cards and other 290, , ,778 Restructuring - major corporate 934, ,175 - corporate 624, ,602 - SMEs 739, ,537 - retail housing 301, ,111 - retail other 122, ,749 Recoveries - corporate 569, , ,820 - SMEs 226, ,158 - retail housing 171, ,234 - retail other 139, ,851 International banking services 53, ,103 Wealth management 1, ,824 6,272, ,595 9,886 18,249 6,372,
166 44. Risk management Credit risk (continued) Rescheduled loans and advances to customers (continued) Credit risk concentration (continued) 2016 Cyprus Greece Russia United Kingdom Romania Total By economic activity Trade 668,305-35, , ,419 Manufacturing 214,248-16,347-1, ,858 Hotels and catering 619, ,139 3, ,647 Construction 1,539,773-8, ,175 1,574,058 Real estate 1,047, ,426 47,192 1,163,898 Private individuals 2,515, ,516,213 Professional and other services 446,946-23,383 7, ,654 Other sectors 350, ,557 7,401, ,893 90,323 78,881 7,655,304 By customer sector Corporate 3,418, ,488 74,987 77,556 3,649,599 SMEs 1,675,528-5,405 14,501 1,265 1,696,699 Retail - housing 1,661, ,661,487 - consumer, credit cards and other 567, ,321 International banking services 74, ,704 Wealth management 4, ,494 7,401, ,893 90,323 78,881 7,655,
167 44. Risk management Credit risk (continued) Rescheduled loans and advances to customers (continued) Credit risk concentration (continued) 2016 Cyprus Greece Russia United Kingdom Romania Total By business line Corporate 711, ,488 74,987 77, ,075 SMEs 464,163-5,405 14,501 1, ,334 Retail - housing 1,494, ,494,123 - consumer, credit cards and other 449, ,002 Restructuring - major corporate 1,371, ,371,613 - corporate 790, ,600 - SMEs 815, ,597 Recoveries - corporate 544, ,311 - SMEs 395, ,768 - retail housing 167, ,364 - retail other 118, ,319 International banking services 74, ,704 Wealth management 4, ,494 7,401, ,893 90,323 78,881 7,655,
168 44. Risk management Credit risk (continued) Rescheduled loans and advances to customers (continued) Provisions for impairment 2017 Cyprus Greece Russia United Kingdom Romania Total Individual impairment 797, ,094 1,054 10, ,539 Collective impairment 594, ,317 1,392, ,094 1,296 10,078 1,459, Individual impairment 899, ,297 1,855 59,791 1,026,458 Collective impairment 200, ,795 1,099, ,656 2,220 59,793 1,227,
169 44. Risk management Credit risk (continued) Credit quality of Group assets exposed to credit risk other than loans and advances to customers - analysis by rating agency designation Balances with central banks and loans and advances to banks Balances with central banks and loans and advances to banks are analysed by Moody s Investors Service rating as follows: Aaa Aa3 745, ,002 A1 A3 560, ,693 Baa1 Baa3 132,610 41,860 Ba1 Ba3 2,870,600 37,067 B1 B ,137,717 Caa - C 18,399 14,410 Unrated 58, ,805 Other receivables from banks 56,603 41,085 4,442,662 2,461,639 Band Ba1-Ba3 above includes an amount of 152,538 thousand which mainly relates to obligatory deposits for liquidity purposes with the CBC. As at 31 December 2017, bank balances with carrying value of 33,004 thousand are impaired (2016: 78,725 thousand), with cumulative impairment loss of 24,998 thousand (2016: 55,655 thousand). 167
170 44. Risk management Credit risk (continued) Credit quality of Group assets exposed to credit risk other than loans and advances to customers - analysis by rating agency designation (continued) Debt securities Investments in debt securities are analysed by Moody s Investors Service rating, their issuer and classification, as follows: Aaa Aa3 437, ,565 Baa1 Baa3 12,306 12,507 Ba1 Ba3 500,265 - B1 B3 Caa C - 257,495-1 Unrated Issued by: 950, ,568 - Cyprus government 500, ,496 - other governments 304, ,211 - banks and other corporations 146,222 32,861 Classified as: 950, ,568 - trading investments investments at fair value through profit or loss - 10,426 - available-for-sale investments 901, ,592 - investments classified as loans and receivables 48,658 68, , ,
171 45. Risk management Market risk Market risk is the risk of loss from adverse changes in market prices - namely from changes in interest rates, exchange rates and security prices. The Market Risk department is responsible for monitoring the risk resulting from such changes with the objective to minimise the impact on earnings and capital. The department also monitors liquidity risk and credit risk with counterparties and countries. It is also responsible for monitoring compliance with the various market risk policies and procedures. Interest rate risk Interest rate risk is the risk that the fair value of future cash flows of a financial instrument will fluctuate because of changes in market interest rates. It arises as a result of timing differences on the repricing of assets, liabilities and off balance sheet items. Interest rate risk is measured using interest rate sensitivity gap analysis where the difference between assets and liabilities repricing in each time band is calculated separately for each currency. Interest rate risk is managed through a Year 1 Interest Rate Effect (IRE) limit on the maximum reduction of net interest income under the various interest rate shock scenarios. Limits are set as a percentage of the Group capital and as a percentage of the net interest income (when positive) and are allocated to the various banking units of the Group. In the case of Cyprus, there are different limits for Euro and foreign currencies. Sensitivity analysis The table below sets out the impact on the Group s net interest income, over a one-year period, from reasonably possible parallel changes in the interest rates of the main currencies: Parallel change in interest rates ((increase)/decrease in net interest income) % for Russian Rouble +0.6% for Euro, US Dollar and British Pound +0.4% for Swiss Franc +0.2% for Japanese Yen +0.6% for all other currencies -1.7% for Russian Rouble -0.6% for Euro, US Dollar and British Pound -0.3% for Swiss Franc -0.2% for Japanese Yen -0.6% for all other currencies % for Russian Rouble +1% for US Dollar +0.5% for all other currencies -4% for Russian Rouble -0.5% for all other currencies Euro US Dollar British Pound Other currencies Total , , ,795 (28,459) (1,428) (2,749) (1,333) (33,969) 17,269 15,950 5,081 (43) 38,257 (21,479) (8,089) (3,057) (438) (33,063) 169
172 45. Risk management Market risk (continued) Interest rate risk (continued) Sensitivity analysis (continued) In addition to the above fluctuations in net interest income, interest rate changes can result in fluctuations in the fair value of investments at fair value through profit or loss (including investments held for trading) and in the fair value of derivative financial instruments. The equity of the Group is also affected by changes in market interest rates. The impact on the Group s equity arises from changes in the fair value of fixed rate debt securities classified as available-for-sale (unless impaired). The sensitivity analysis is based on the assumption of a parallel shift of the yield curve. The table below sets out the impact on the Group s profit/loss before tax and equity as a result of reasonably possible changes in the interest rates of the major currencies. Impact on profit/loss before tax Impact on equity Change in interest rates % for Swiss Franc +0.2% for Japanese Yen +0.6% for all other currencies -0.3% for Swiss Franc -0.2% for Japanese Yen -0.6% for all other currencies % for Russian Rouble +1% for US Dollar +0.5% for all other currencies -4% for Russian Rouble -0.5% for all other currencies Currency risk 364 (3,155) (364) 3,155 1,347 (1,764) (1,347) 1,734 Currency risk is the risk that the fair value of future cash flows of a financial instrument will fluctuate because of changes in foreign exchange rates. In order to manage currency risk, the ALCO has approved open position limits for the total foreign exchange position limits. The foreign exchange position limits are lower than those prescribed by the CBC. These limits are managed by Treasury and monitored daily by market risk officers in all the banking units of the Group, who report the overnight foreign currency position of each unit to Market Risk daily. The Group does not maintain a currency trading book. The table below sets out the Group s currency risk resulting from the financial instruments that it holds. The analysis assumes reasonably possible changes in the exchange rates of major currencies against the Euro, based mainly on historical price fluctuations. The impact on profit/loss after tax includes the change in net interest income that arises from the change of currency rate. The impact on equity arises from the hedging instruments that are used to hedge part of the net assets of the subsidiaries whose functional currency is not the Euro. The net assets of foreign operations are also revalued and affect equity, but their impact is not taken into account in the above sensitivity analysis as the above relates only to financial instruments which have a direct impact either on profit/loss after tax or on equity. 170
173 45. Risk management Market risk (continued) Currency risk (continued) 2017 Change in foreign exchange rate Impact on profit/loss after tax Impact on equity % US Dollar +10 1,110 - Russian Rouble +25 2,714 22,323 Romanian Lei +10 (419) (407) Swiss Franc +20 3,803 - British Pound (34,079) Japanese Yen Other currencies +10 (18) - US Dollar -10 (908) - Russian Rouble -25 (1,628) (13,394) Romanian Lei Swiss Franc -20 (2,535) - British Pound -20 (578) 22,719 Japanese Yen -10 (160) - Other currencies US Dollar +10 1,935 - Russian Rouble +25 2,645 18,828 Romanian Lei +10-4,459 Swiss Franc +20 6,629 - British Pound +20 1,017 (19,358) Japanese Yen Other currencies US Dollar -10 (1,584) - Russian Rouble -25 (1,587) (11,297) Romanian Lei (3,648) Swiss Franc -20 (4,419) - British Pound -20 (678) 12,905 Japanese Yen -10 (251) - Other currencies -10 (142) - 171
174 45. Risk management Market risk (continued) Price risk Equity securities price risk The risk of loss from changes in the price of equity securities arises when there is an unfavourable change in the prices of equity securities held by the Group as investments. Investments in equities are outside the Group s risk appetite. The Group monitors the current portfolio mostly acquired by the Group as part of the acquisition of certain operations of Laiki Bank, with the objective to gradually liquidate all positions for which there is a market. Equity securities may also be acquired in the context of delinquent loan workouts and are disposed of by the Group as soon as practicable. Changes in the prices of equity securities that are classified as investments at fair value through profit or loss, affect the results of the Group, whereas changes in the value of equity securities classified as available-for-sale affect the equity of the Group (if not impaired). The table below shows the impact on the profit/loss before tax and on equity of the Group from a change in the price of the equity securities held, as a result of reasonably possible changes in the relevant stock exchange indices Change in index Impact on profit/loss before tax Impact on equity % Cyprus stock exchange +25 1,477 1,288 Athens exchange Other stock exchanges and non listed +20 1,144 4,206 Cyprus stock exchange -25 (1,483) (1,282) Athens exchange -25 (5) (93) Other stock exchanges and non listed -20 (1,390) (3,960) 2016 Cyprus stock exchange +25 1,313 1,049 Athens exchange Other stock exchanges and non listed ,122 Cyprus stock exchange -25 (1,567) (795) Athens exchange -35 (30) (67) Other stock exchanges and non listed -20 (858) (2,122) Debt securities price risk Debt securities price risk is the risk of loss as a result of adverse changes in the prices of debt securities held by the Group. Debt security prices change as the credit risk of the issuer changes and/or as the interest rate changes for fixed rate securities. The Group invests a significant part of its liquid assets in debt securities issued mostly by governments. The average Moody s Investors Service rating of the debt securities portfolio of the Group as at 31 December 2017 was Baa1 (2016: Baa1). The average rating excluding the Cyprus Government bonds for 31 December 2017 was Aa1 (2016: Aa2). Changes in the prices of debt securities classified as investments at fair value through profit or loss, affect the profit or loss of the Group, whereas changes in the value of debt securities classified as available-for-sale affect the equity of the Group (if not impaired). 172
175 45. Risk management Market risk (continued) Price risk (continued) Debt securities price risk (continued) The table below indicates how the profit/loss before tax and equity of the Group will be affected from reasonably possible changes in the price of the debt securities held, based on observations of changes in credit risk over the past years. Impact on profit/loss before tax Impact on equity Change in market prices % for A3 and above rated bonds 1,385 13, % for below A3 rated bonds ,667-3% for A3 and above rated bonds (1,385) (13,038) -10% for below A3 rated bonds (607) (45,667) % 2,861 34, % (2,861) (34,776) 46. Risk management Liquidity risk and funding Liquidity risk is the risk that the Group is unable to fully or promptly meet current and future payment obligations as and when they fall due. This risk includes the possibility that the Group may have to raise funding at high cost or sell assets at a discount to fully and promptly satisfy its obligations. It reflects the potential mismatch between incoming and outgoing payments, taking into account unexpected delays in repayment or unexpectedly high payment outflows. Liquidity risk involves both the risk of unexpected increases in the cost of funding of the portfolio of assets and the risk of being unable to liquidate a position in a timely manner on reasonable terms. In order to limit this risk, management aims to achieve diversified funding sources in addition to the Group s core deposit base, and has adopted a policy of managing assets with liquidity in mind and monitoring cash flows and liquidity on a daily basis. The Group has developed internal control processes and contingency plans for managing liquidity risk. Management and structure The Board of Directors sets the Group s Liquidity Risk Appetite being the level of risk at which the Group should operate. The Board of Directors, through its Risk Committee, approves the Liquidity Policy Statement and reviews almost at every meeting the liquidity position of the Group. Information on inflows/outflows is also provided. The ALCO is responsible for setting the policies for the effective management and monitoring of liquidity across the Group. Bank of Cyprus UK Ltd ALCO is responsible for monitoring the liquidity position of the unit and ensuring compliance with the approved policies and regulatory requirements. 173
176 46. Risk management Liquidity risk and funding (continued) Management and structure (continued) Group Treasury is responsible for liquidity management at Group level and for overseeing the operations of Bank of Cyprus UK Ltd, to ensure compliance with internal and regulatory liquidity policies and provide direction as to the actions to be taken regarding liquidity needs. Every unit is responsible for managing its liquidity and targets to finance its own needs. Group Treasury assesses on a continuous basis, and informs ALCO at regular time intervals, the adequacy of the liquid assets and takes the necessary actions to enhance the Group s liquidity position. Liquidity is also monitored daily by Market Risk, which is an independent department responsible to monitor compliance at the level of individual units, as well as at Group level, with both internal policies and limits, and with the limits set by the regulatory authorities in the countries where the Group operates. Market Risk reports to ALCO the regulatory liquidity position of the various units of the Group, at least monthly. It also provides the results of various stress tests to ALCO at least quarterly. Liquidity is monitored and managed on an ongoing basis through: (i) Risk appetite: established Group Risk Appetite together with the appropriate limits for the management of all risks including liquidity risk. (ii) Liquidity policy: sets the responsibilities for managing liquidity risk as well as the framework, limits and stress test assumptions. (iii) Liquidity limits: a number of internal and regulatory limits are monitored on a daily, monthly and quarterly basis. Where applicable, a traffic light system (RAG) has been introduced for the ratios, in order to raise flags when the ratios deteriorate. (iv) Early warning indicators: monitoring of a range of indicators for early signs of liquidity risk in the market or specific to the Group. These are designed to immediately identify the emergence of increased liquidity risk to maximise the time available to execute appropriate mitigating actions. (v) Liquidity Contingency Plan: maintenance of a Liquidity Contingency Plan (LCP) which is designed to provide a framework where a liquidity stress could be effectively managed. The LCP provides a communication plan and includes management actions to respond to liquidity stresses. (vi) Recovery Plan: the Group has developed a Recovery Plan (RP). The key objectives of the RP are to set the key Recovery and Early Warning indicators, so as to monitor these consistently and to set in advance a range or recovery options to enable the Group to be adequately prepared to respond to stressed conditions and restore the Group s position. Monitoring process Daily The daily monitoring of cash flows and highly liquid assets is important to safeguard and ensure the uninterrupted operations of the Group s activities. Market Risk prepares a report for submission to the CBC and ECB/Single Supervisory Mechanism (SSM), indicating the opening and closing liquidity position, net customer movements and other movements analysed by the main currencies. In addition, Group Treasury monitors daily and intraday the customer inflows and outflows in the main currencies used by the Group. Since May 2016, Market Risk also prepares daily stress testing for bank-specific, market wide and combined scenarios. The requirement is to have sufficient liquidity buffer to enable BOC PCL to survive a two-week stress period, and adequate capacity to raise funding under a three month period, under all scenarios. The liquidity buffer is made up of: Banknotes, CBC balances (excluding the Minimum Reserve Requirements (MRR)), nostro current accounts, money market placements up to the stress horizon, available ECB credit line and market value net of haircut of eligible unencumbered/available bonds. Most of these are High Quality Liquid Assets (HQLA) as per the LCR definitions and/or ECB Eligible bonds and excludes domestic issues of Cyprus Government Bonds. The designing of the stress tests followed best practice guidance and was based on the liquidity risk drivers which are recognised internationally by both the Prudential Regulation Authority (PRA) and EBA SREP. The stress tests assumptions are included in the Group Liquidity Policy which is reviewed on an annual basis and approved by the Board. However, whenever it is considered appropriate to amend the assumptions during the year, approval is requested by ALCO and the Board Risk Committee. The main items shocked in the different scenarios are: deposit outflows, wholesale funding, loan repayments, off-balance sheet commitments, marketable securities and cash collateral for derivatives and repos. 174
177 46. Risk management Liquidity risk and funding (continued) Monitoring process (continued) Weekly Market Risk prepares a weekly report of Euro and foreign currency liquidity mismatch, which also discloses the level of liquidity ratios which is submitted to the CBC. Monthly Market Risk prepares reports monitoring compliance with internal and regulatory liquidity ratios, for all banking units and for the Group and submits them to the ALCO, the Executive Committee and the Board Risk Committee. It also calculates the expected flows under a stress scenario and compares them with the projected available liquidity buffer in order to calculate the survival days. The fixed deposit renewal rates and deposits by tenor are also presented to the ALCO. Market Risk reports the LCR and Additional Liquidity Monitoring Metrics (ALMM) to the CBC/ECB monthly. Group Treasury prepares a liquidity report which is submitted to the ALCO on a monthly basis. The report indicates the liquidity position of BOC PCL and the Group, data on monthly customer flows, as well as other important developments related to liquidity. Quarterly The results of the stress testing scenarios prepared daily are reported to ALCO and the Board Risk Committee quarterly. Moreover, Market Risk reports the NSFR, Leverage Ratio to the CBC/ECB quarterly and various other liquidity reports, included in the short-term exercise of the SSM per the SREP guidelines. Annually The Group prepares on an annual basis its report on ILAAP. As part of the Group s procedures for monitoring and managing liquidity risk, there is a Group LCP for handling liquidity difficulties. The LCP details the steps to be taken in the event that liquidity problems arise, which escalate to a special meeting of the extended ALCO. The LCP sets out the members of this Committee and a series of the possible actions that can be taken. This LCP, as well as the Group s Liquidity Policy, is reviewed by ALCO at least annually, during the ILAAP review. The ALCO submits the updated Liquidity Policy with its recommendations to the Board through the Board Risk Committee for approval. The approved Liquidity Policy is notified to the SSM. Liquidity ratios The Group LCR presented in the table below, is calculated based on the Delegated Regulation (EU) 2015/61. It is designed to establish a minimum level of high-quality liquid assets sufficient to meet an acute stress lasting for 30 calendar days. During 2017 the minimum requirement was 80% and increased to 100% on 1 January The Group LCR is calculated monthly by Market Risk and sent to CBC/ECB 15 days after the month end. Following ELA repayment in January 2017, BOC PCL has been concentrating its efforts in increasing liquid assets and thus improving its LCR. The Group s LCR ratio was as follows: % % End of reporting period Average monthly ratio Highest monthly ratio Lowest monthly ratio
178 46. Risk management Liquidity risk and funding (continued) Liquidity ratios (continued) As at 31 December 2017, the Group is in compliance with its regulatory liquidity requirement with respect to the LCR. As at 31 December 2017, BOC PCL was not in compliance with all of the local regulatory liquidity requirements (which were abolished on 1 January 2018 as per Article 412(5) of EU Regulation No 575/2013) with respect to its operations in Cyprus. More specifically, BOC PCL was in compliance with the CBC EUR stock ratio and the CBC EUR 0-30 days mismatch ratio, but was not in compliance with the rest of the local regulatory liquidity requirements. In December 2017, the CBC introduced a macroprudential measure in the form of a liquidity add-on that was imposed on top of the LCR and which became effective on 1 January The objective of the measure is to ensure that there will be a gradual release of the excess liquidity arising from the lower liquidity requirements under the LCR compared to the ones under the local regulatory liquidity requirements previously in place. The add-on applies stricter outflow and inflow rates on some of the parameters used in the calculation of the LCR than the ones defined in the Commission Delegated Regulation (EU) 2015/61 as well as additional liquidity requirements in the form of outflow rates on other items that are not subject to any outflow rates as per the Regulation. The measure will be implemented in two stages. The first stage requires stricter outflow and inflow rates which are applicable from 1 January 2018 until 30 June The second stage requires more relaxed outflow and inflow rates compared to the initial ones, and are applicable from 1 July 2018 until 31 December Specifically, there will be a reduction of 50% of the LCR add-on rates on 1 July The additional liquidity requirement is expected to be implemented up to 31 December The CBC may propose to modify or extend the period of application of this macroprudential measure depending on the results of the follow-up of the banks actions on how the excess liquidity is utilised. As at 31 December 2017, the Group and BOC PCL were in compliance with the LCR add-on implemented on 1 January As at 31 December 2017 and 2016 Bank of Cyprus UK Ltd was in compliance with its regulatory liquidity requirements. Main sources of funding During the year 2017, the Group s main sources of funding were its deposit base and central bank funding, through the Eurosystem monetary policy operations. ELA was fully repaid on 5 January 2017 (31 December 2016: 200 million). The liquidity received from central banks is subject to the relevant regulations and requires qualifying assets as collateral. The funding via Eurosystem monetary policy operations ranges from short term to long term. As at 31 December 2017, ECB funding was at 930 million of which 100 million was from the weekly MRO and 830 million was from the 4-year TLTRO II. In January 2017, BOC PCL issued a 250 million unsecured and subordinated Tier 2 Capital Note under BOC PCL s EMTN Programme. Further information is disclosed in Note 33. Funding to subsidiaries The funding provided by BOC PCL to its subsidiaries for liquidity purposes is repayable as per the terms of the respective agreements. BOC PCL s subsidiary Bank of Cyprus UK Ltd cannot place funds with the Group in excess of maximum limits set by the local regulator. Any new funding to subsidiaries requires approval from the ECB and the CBC. The subsidiaries may proceed with dividend distributions in the form of cash to BOC PCL, provided that they are not in breach of their regulatory capital and liquidity requirements. Certain subsidiaries have a recommendation from their regulator to avoid any dividend distribution at this point in time. 176
179 46. Risk management Liquidity risk and funding (continued) Collateral requirements The carrying values of the Group s encumbered assets as at 31 December 2017 and 2016 are summarised below: Cash and other liquid assets 120, ,975 Investments 317, ,813 Loans and advances 3,137,586 2,853,511 Property - 93,574 3,575,278 3,446,873 Cash is mainly used to cover collateral required for (i) derivatives and repurchase transactions and (ii) trade finance transactions and guarantees issued. It is also used as part of the supplementary assets for the covered bond. Investments are mainly used as collateral for repurchase transactions with commercial banks as well as supplementary assets for the covered bond. Loans and advances indicated as encumbered as at 31 December 2017 and 2016 are mainly used as collateral for funding from the Central Banks (ECB, CBC and Bank of England), the covered bond and government deposits. As at 31 December 2017 no loans and advances to customers or property were pledged as collateral for ELA (2016: 787 million). Loans and advances to customers include mortgage loans of a nominal amount 1,001 million (2016: 1,002 million) in Cyprus, pledged as collateral for the covered bond issued by BOC PCL in 2011 under the Covered Bond Programme. Furthermore housing loans of a nominal amount 1,273 million (2016: 765 million) in Cyprus are pledged as collateral for the funding from the ECB (Note 30). At 31 December 2017, loans of a nominal amount of 715 million in Cyprus are pledged as collateral for deposits of the Republic of Cyprus (2016: nil). At 31 December 2017 BOC PCL s subsidiary Bank of Cyprus UK Ltd has pledged 161 million (2016: 244 million) of loans and advances to customers with the Funding for Lending Scheme (FLS) of the Bank of England. As at 31 December 2017 the subsidiary had drawn down Treasury bills of 82 million (2016: 29 million) under the FLS. These Treasury bills are not recorded on the consolidated balance sheet as ownership remains with the Bank of England. BOC PCL maintains a Covered Bond Programme set up under the Cyprus Covered Bonds legislation and the Covered Bonds Directive of the CBC. Under the Covered Bond Programme, BOC PCL has in issue covered bonds of 650 million secured by residential mortgages originated in Cyprus. The covered bonds have a maturity date of 12 December 2018, bear interest of 3 months Euribor plus 3.25% on a quarterly basis and are traded on the Luxemburg Bourse. The covered bonds have a Conditional Pass-Through structure. All the bonds are held by BOC PCL. The credit rating of the covered bonds was upgraded to an investment grade rating and the covered bond has become eligible collateral for the Eurosystem credit operations. As from 2 October 2015, it has been placed as collateral for accessing funding from the ECB. The credit ratings of the Republic of Cyprus by the main credit rating agencies continue to be below investment grade. As a result, the ECB does not include Cyprus Government Bonds in its asset purchase programme, or as eligible collateral for Eurosystem monetary operations. 177
180 46. Risk management Liquidity risk and funding (continued) Analysis of financial assets and liabilities based on remaining contractual maturity The analysis of the Group s financial assets and liabilities based on the remaining contractual maturity at 31 December is based on undiscounted cash flows, analysed in time bands according to the number of days remaining from 31 December to the contractual maturity date. Financial assets The analysis of financial assets does not include any interest receivable cash flows. Financial assets have a much longer duration than financial liabilities and non-discounted interest receivable cash flows are higher than non-discounted interest payable cash flows (based on remaining contractual maturity). As a result, nondiscounted cash inflows from interest receivable would have greatly exceeded non-discounted cash outflows on interest payable, thus artificially improving liquidity. Current accounts, overdrafts and amounts in arrears are included within the first maturity time band which reflects their contractual maturity. All other loans and advances to customers are analysed according to their contractual repayment schedule. Loans and advances to banks are analysed in the time bands according to the number of days remaining from 31 December, until their contractual maturity date. Amounts placed as collateral (primarily for derivatives and loans) are assigned to different time bands based on either their maturity (in the case of loans), or proportionally according to the maturities of derivatives (where the collateral had no fixed maturity). Financial assets with no contractual maturity (such as equity securities) are included in the over five years time band, unless classified as at fair value through profit or loss, in which case they are included in the up to one month time band. The investments are classified in the relevant time band according to their contractual maturity. Financial liabilities All financial liabilities for the repayment of which notice is required, are included in the relevant time bands as if notice had been given on 31 December, despite the fact that the Group expects that the majority of its customers will not demand repayment of such liabilities on the earliest possible date. Fixed deposits are classified in time bands based on their contractual maturity. Although customers may demand repayment of time deposits (subject to penalties depending on the type of the deposit account), the Group has the discretion not to accept such early termination of deposits. Subordinated loan stock is classified in the relevant time band according to the remaining contractual maturity, ignoring the call date. The amounts presented in the table below are not equal to the amounts presented on the balance sheet, since the table below presents all cash flows (including interest to maturity) on an undiscounted basis. Derivative financial instruments Derivative financial instruments were classified according to whether the settlement of cash flows occurs on a net or gross basis. For net settled derivatives, after offset of receivable and payable amounts, the fair value of the derivatives is included in financial assets or in financial liabilities in the time band corresponding to the remaining maturity of the derivative. Gross settled derivatives or net settled derivatives that are hedging instruments in cash flow hedges are presented in a separate table and the corresponding cash flows are classified accordingly in the time bands which relate to the number of days until their receipt or payment. Commitments and contingent liabilities The limits of loans and advances are commitments to provide credit to customers. The limits are granted for predetermined periods and can be cancelled by the Group after giving relevant notice to the customers. Usually the customers do not fully utilise the limits granted to them. 178
181 46. Risk management Liquidity risk and funding (continued) Analysis of financial assets and liabilities based on remaining contractual maturity (continued) 2017 Financial assets Cash and balances with central banks Loans and advances to banks Investments at fair value through profit or loss Loans and advances to customers Fair value of net settled derivative assets Non-trading investments On demand and up to one month Between one and three months Between three months and one year Between one and five years Over five years Total ,321,403 29,667 34,371 8,493-3,393,934 1,053,565 4,775 3, ,476 20,244 1,192,633 46,389 4, ,467 4,273, , ,799 3,933,785 5,272,672 14,602,454 1, , ,027 20,464-10, , , ,955 Other assets 26,618 13,420 7,821 53,864 6, ,875 Total financial assets 8,743, , ,055 4,732,353 5,637,414 20,344,345 Financial liabilities Deposits by banks 196, ,361 26, , ,731 Funding from central banks Repurchase agreements 100, , , ,524 10, ,432 Customer deposits 9,595,209 3,173,297 4,530, ,855 5,320 17,946,469 Subordinated loan stock Fair value of net settled derivative liabilities 23, , , ,553 14, ,789 11,898 50,970 Other liabilities 87,689 16,666 29,929 4,820 2, ,514 Total undiscounted financial liabilities 10,016,273 3,331,316 4,587,114 1,894, ,215 20,363,
182 46. Risk management Liquidity risk and funding (continued) Analysis of financial assets and liabilities based on remaining contractual maturity (continued) 2016 Financial assets Cash and balances with central banks Loans and advances to banks Investments at fair value through profit or loss Loans and advances to customers Fair value of net settled derivative assets Non-trading investments On demand and up to one month Between one and three months Between three months and one year Between one and five years Over five years Total ,446,851 26,372 29,157 4,016-1,506, ,306 13,630 14, ,674 15,567 1,087,837 27,971 8,740 1,686 4, ,016 6,064, , ,253 3,627,733 5,011,980 15,649,401 17,829 2, ,835 7,941 6,453 42, , , ,628 Other assets 28,761 8,955 19,477 67,944 6, ,811 Total financial assets 8,464, , ,300 4,211,883 5,273,796 19,069,924 Financial liabilities Deposits by banks 309,922 6,312 32,731 6,704 83, ,481 Funding from central banks Repurchase agreements 200,014 50, , , ,838 9, ,026 Customer deposits 8,750,919 3,113,258 3,396,832 1,343,667 4,193 16,608,869 Fair value of net settled derivative liabilities 7,955 1, ,687 7,504 48,209 Other liabilities 95,719 16,430 31,974 4,591 2, ,010 Total undiscounted financial liabilities 9,364,529 3,187,010 3,461,590 2,272, ,993 18,392,
183 46. Risk management Liquidity risk and funding (continued) Analysis of financial assets and liabilities based on remaining contractual maturity (continued) 2017 Gross settled derivatives Financial assets Contractual amounts receivable Contractual amounts payable On demand and up to one month Between one and three months Between three months and one year Between one and five years Over five years Total ,689 6,552 1, ,207 (402,221) (6,465) (1,956) - - (410,642) 1, ,565 Financial liabilities Contractual amounts receivable Contractual amounts payable 919, ,629 1, ,102,456 (933,009) (182,582) (1,107) - - (1,116,698) (13,288) (953) (1) - - (14,242) Contingent liabilities and commitments Contingent liabilities Acceptances and endorsements 2,849 4,155 1, ,367 Guarantees 132, , , ,153 91, ,165 Commitments Documentary credits 3,382 5,447 17, ,365 29,630 Undrawn formal standby facilities, credit lines and other commitments to lend 2,215,856 17, ,233,178 2,354, , , ,658 93,370 3,039,
184 46. Risk management Liquidity risk and funding (continued) Analysis of financial assets and liabilities based on remaining contractual maturity (continued) 2016 Gross settled derivatives Financial assets Contractual amounts receivable Contractual amounts payable On demand and up to one month Between one and three months Between three months and one year Between one and five years Over five years Total , ,669 1, ,386 (652,202) (161,871) (1,497) - - (815,570) 16,984 2, ,816 Financial liabilities Contractual amounts receivable Contractual amounts payable 1,060, ,662 1, ,251,158 (1,070,866) (190,401) (1,526) - - (1,262,793) (9,868) (1,739) (28) - - (11,635) Contingent liabilities and commitments Contingent liabilities Acceptances and endorsements 3,983 2,483 1, ,606 Guarantees 160, , , ,890 87, ,269 Commitments Documentary credits 4,649 6,824 14, ,686 27,636 Undrawn formal standby facilities, credit lines and other commitments to lend 2,020,254 14, ,035,191 2,189, , , ,177 89,486 2,867,
185 47. Risk management Insurance risk Insurance risk is the risk that an insured event under an insurance contract occurs and the uncertainty of the amount and the timing of the resulting claim. By the very nature of an insurance contract, this risk is random and therefore unpredictable. For a portfolio of insurance contracts where the theory of probability is applied to pricing and provisioning, the principal risk that the Group faces is that the actual claims and benefit payments will exceed the carrying amount of insurance liabilities. This could occur because the frequency or severity of claims and benefits are greater than estimated. Insurance events are random and the actual volume and cost of claims and benefits will vary from year to year compared to the estimate established using statistical or actuarial techniques. The above risk exposure is mitigated by the Group through the diversification across a large portfolio of insurance contracts. The variability of risks is also reduced by careful selection and implementation of underwriting strategy guidelines, as well as the use of reinsurance arrangements. Although the Group has reinsurance arrangements, it is not relieved of its direct obligations to policyholders and is thus exposed to credit risk with respect to ceded insurance, to the extent that any reinsurer is unable to meet the obligations assumed under such reinsurance arrangements. For that reason, the creditworthiness of reinsurers is evaluated by considering their solvency and credit rating. Life insurance contracts The main factors that could affect the overall frequency of claims are epidemics, major lifestyle changes and natural disasters. The underwriting strategy and risk assessment is designed to ensure that risks are well diversified in terms of type of risk and level of insured benefits. This is largely achieved through the use of medical screening in order to ensure that pricing takes account of the current medical conditions and family medical history and through the regular review of actual claims and product pricing. The Group has the right to decline policy applications, it can impose additional charges and it has the right to reject the payment of fraudulent claims. The most significant risks relating to accident and health insurance contracts result from lifestyle changes and from climate and environmental changes. The risks are mitigated by the careful use of strategic selection and risk-taking at the underwriting stage and by thorough investigation for possible fraudulent claims. The Group uses an analysis based on its embedded value which provides a comprehensive framework for the evaluation and management of risks faced, the understanding of earnings volatility and operational planning. The table below shows the sensitivity of the embedded value to assumption changes that substantially affect the results Change in embedded value Change in interest rates +0.25% Change in expenses +10% (2,014) (2,482) Change in lapsation rates +10% (1,069) (690) Change in mortality rates +10% (6,272) (6,519) The variables above are not linear. In each sensitivity calculation for changes in key economic variables, all other assumptions remain unchanged except when they are directly affected by the revised economic conditions. Changes to key non economic variables do not incorporate management actions that could be taken to mitigate effects, nor do they take account of consequential changes in policyholder behaviour. In each sensitivity calculation all other assumptions are therefore unchanged. Some of the sensitivity scenarios shown in respect of changes to both economic and non economic variables may have a consequential effect on the valuation basis when a product is valued on an active basis which is updated to reflect current economic conditions. 183
186 47. Risk management Insurance risk (continued) Life insurance contracts (continued) While the magnitude of these sensitivities will, to a large extent, reflect the size of closing embedded value, each variable will have a different impact on different components of the embedded value. In addition, other factors such as the intrinsic cost and time value of options and guarantees, the proportion of investments between equities and bonds and the type of business written, including for example, the extent of with profit business versus non profit business and to the extent to which the latter is invested in matching assets, will also have a significant impact on sensitivities. General insurance contracts General insurance business is concentrated in Cyprus and the main claims during 2017 and 2016 related to fire and natural forces and other damage to property, motor vehicle liability and general liability. Risks under these policies are usually covered for a period of 12 months, with the exception of the goods in transit class that covers shorter periods and the contractors all risks class that covers longer periods. The liabilities for outstanding claims arising from insurance contracts issued by the Group are calculated based on experts estimates and facts known at the balance sheet date. With time, these estimates are reconsidered and any adjustments are recognised in the financial statements of the period in which they arise. The principal assumptions underlying the estimates for each claim are based on past experience and market trends and take into consideration claims handling costs, inflation and claim numbers for each accident year. Also external factors that may affect the estimate of claims, such as recent court rulings and the introduction of new legislation are taken into consideration. The insurance contract liabilities are sensitive to changes in the above key assumptions. The sensitivity of certain assumptions, such as the introduction of new legislation and the rulings of court cases, is very difficult to be quantified. Furthermore, the delays that arise between the occurrence of a claim and its subsequent notification and eventual settlement increase the uncertainty over the cost of claims at the reporting date. The risk of a general insurance contract occurs from the uncertainty of the amount and time of presentation of the claim. Therefore the level of risk is determined by the frequency of such claims, the severity and the evolution of claims from one period to the next. The main risks for the general insurance business arise from major catastrophic events like natural disasters. These risks vary depending on location, type and nature. The variability of risks is mitigated by the diversification of risk of loss to a large portfolio of insurance contracts, as a more diversified portfolio is less likely to be affected by changes in any subset of the portfolio. The Group s exposure to insurance risks from general insurance contracts is also mitigated by the following measures: adherence to strict underwriting policies, strict review of all claims occurring, immediate review and processing of claims to minimise the possibility of negative developments in the future, and use of effective reinsurance arrangements in order to minimise the impact of risks, especially for catastrophic events. 48. Capital management The primary objective of the Group s capital management is to ensure compliance with the relevant regulatory capital requirements and to maintain strong credit ratings and healthy capital adequacy ratios in order to support its business and maximise shareholders value. The Group follows the EU Regulations, primarily the CRR and CRD IV and any other decisions or circulars issued by the regulators, ECB and CBC with respect to the capital adequacy calculations. The Group and BOC PCL have complied with the minimum capital requirements (Pillar I and Pillar II). The overseas banking subsidiary, Bank of Cyprus UK Ltd, complies with the minimum regulatory capital requirements, including those set by the local regulator in the UK. The insurance subsidiaries of the Group comply with the requirements of the Superintendent of Insurance including the minimum solvency ratios. The regulated investment firms of the Group comply with the regulatory capital requirements of the CySEC laws and regulations. The Pillar 3 Disclosures Report (unaudited) of the Group required with respect to the requirements of the Capital Requirement Regulation (EU) No 575/2013 is published on the Group s website (Investor Relations). 184
187 49. Related party transactions Related parties of the Group include associates and joint ventures, key management personnel, Board of Directors and their connected persons. (a) Transactions with subsidiary The Company is the holding company of the Group. The Company enters into transactions with its subsidiary in the normal course of business. Balances and transactions between the Company and its subsidiaries are disclosed in Note 14 of the Company s financial statements. Transactions with the subsidiaries have been eliminated on consolidation. (b) Associates and joint ventures The Group provides to and receives from its associates and joint ventures certain banking and financial services. These are not material to the Group and all the transactions are made on normal business terms as for comparable transactions with customers of a similar standing. Additional information is disclosed in Note 52 of these Consolidated Financial Statements. (c) Compensation of the Board of Directors and key management personnel The following disclosures are made in accordance with the provisions of IAS 24 Related Party Disclosures and sections 305 and 306 of the Companies Act 2014, in respect of the compensation of the Board of Directors and key management personnel. Fees and emoluments of members of the Board of Directors and other key management personnel Director emoluments Executives Salaries and other short term benefits 2,300 1,848 Employer s contributions Retirement benefit plan costs Non-executives 2,593 2,126 Fees Total directors emoluments 3,475 2,987 Other key management personnel emoluments Salaries and other short term benefits 3,150 3,144 Termination benefits Employer s contributions Retirement benefit plan costs Total other key management personnel emoluments 3,541 3,889 Total 7,016 6,876 Fees and benefits are included for the period that they serve as members of the Board of Directors. The retirement benefit plan costs relate to contributions paid for defined contribution plan. The termination benefits relate to compensation paid during 2016 to members of the Executive Committee who left the Group under the voluntary exit plan. 185
188 49. Related party transactions (continued) (c) Compensation of the Board of Directors and key management personnel (continued) Fees and emoluments of members of the Board of Directors and other key management personnel (continued) Executive Directors The salaries and other short term benefits of the Executive Directors are analysed as follows: John Patrick Hourican (Chief Executive Officer) 2,104 1,652 Christodoulos Patsalides (Deputy Chief Executive Officer and Chief Operating Officer) ,300 1,848 The retirement benefit plan costs for 2017 amounting to 202 thousand (2016: 168 thousand) relate to: Mr John Patrick Hourican 184 thousand (2016: 150 thousand) and Dr Christodoulos Patsalides 18 thousand (2016: 18 thousand). Non-executive Directors Josef Ackermann Wilbur L. Ross Jr Arne Berggren Maksim Goldman Michalis Spanos Ioannis Zographakis Marios Kalochoritis Michael Heger Lyn Grobler 72 - Anat Bar-Gera The fees of the non-executive Directors include fees as members of the Board of Directors of the Company and its subsidiaries, as well as of committees of the Board of Directors. Other key management personnel The other key management personnel emoluments include the remuneration of the members of the Executive Committee since the date of their appointment to the Committee and other members of the management team who report directly to the Chief Executive Officer or to the Deputy Chief Executive Officer and Chief Operating Officer. 186
189 49. Related party transactions (continued) (d) Transactions with Directors and key management personnel The table below shows the deposits and other credit balances held by the directors and their connected persons, who were in office during the year: Deposits as at 31 December: members of the Board of Directors and other key management personnel 2,737 2,981 - connected persons 3,088 3,559 5,825 6,540 Interest expense on deposits for the year The above table does not include year-end balances for members of the Board of Directors and their connected persons who resigned during the year. Interest expense is disclosed for the period during which they were members of the Board of Directors or served as key management personnel. Loans to Directors The following information is presented in accordance with the Companies Act For the purposes of the Companies Acts disclosures, Directors means the current Board of Directors of the Company and any past directors who were members of the Board of Directors of the Company during the relevant period. All transactions with members of the Board of Directors and their connected persons are made on normal business terms as for comparable transactions, including interest rates, with customers of a similar credit standing. A number of loans and advances have been extended to other key management personnel on the same terms as those applicable to the rest of the Group s employees and their connected persons on the same terms as those of customers. Connected persons include spouses, minor children and companies in which directors/other key management personnel, hold directly or indirectly, at least 20% of the voting shares in a general meeting, or act as executive director or exercise control of the entities in any way. Additional to members of the Board of Directors, related parties include entities providing key management personnel services to the Group. Directors: There were 12 Directors in office during the year (2016: 10 Directors), 4 of whom availed of credit facilities (2016: 4 Directors). The balances outstanding are disclosed below. Key management personnel: There were 13 key management personnel in office during the year (2016: 18 key management personnel), 11 of whom availed of credit facilities (2016: 16 key management personnel). Ten of the key management personnel who availed of credit facilities had balances outstanding at 31 December 2017 (2016:10 key management personnel). Where no amount is shown in the tables below, this indicates a credit balance, a balance of nil, or a balance of less than 500. The value of arrangements at the beginning and end of the current and preceding financial years as stated below in accordance with section 307 of the Companies Act 2014, expressed as a percentage of the net assets of the Group at the beginning and end of the current and preceding financial years is less than 1%. Details of transactions with key management personnel, and their connected persons where indicated, for the years ended 31 December 2017 and 2016 are as follows: 187
190 49. Related party transactions (continued) (d) Transactions with Directors and key management personnel (continued) Loans to Directors (continued) Current Directors Balance as at 1 January Amounts advanced during the year Amounts repaid during the year Balance as at 31 December Aggregate maximum amount outstanding during the year Unused credit facilities Christodoulos Patsalides Loans Overdrafts/credit cards 46 n/a n/a Loans Overdrafts/credit cards 55 n/a n/a Michael Spanos 2017 Overdrafts/credit cards - n/a n/a Overdrafts/credit cards 1 n/a n/a Ioannis Zographakis 2017 Overdrafts/credit cards - n/a n/a Overdrafts/credit cards - n/a n/a John Patrick Hourican 2017 Overdrafts/credit cards - n/a n/a Overdrafts/credit cards - n/a n/a Former Directors Marios Kalochoritis 2016 Overdrafts/credit cards - n/a n/a The balances included in the table above include principal and interest. Also, amounts advanced and repaid are not shown for overdraft and credit card facilities as these are revolving in nature. The aggregate maximum amount outstanding includes credit card exposures at the maximum statement balance. No other Directors had any loan facilities or overdraft/credit card balances with the Group during the year ended 31 December 2017 (2016: nil). No impairment charges or provisions have been recognised during the year ended 31 December 2017 and 2016 in respect of the above loans and facilities. All interest that has fallen due on these loans or facilities has been paid. Former Directors who resigned/retired during the year 2017 or 2016 had no other credit facilities with the Group. 188
191 49. Related party transactions (continued) (d) Transactions with Directors and key management personnel (continued) Loans to Directors (continued) Connected persons of the Board of Directors The aggregate of loans to connected persons of Directors in office at 31 December 2017, as defined in section 220 of the Companies Act 2014, are as follows (aggregate of 1 person; 2016: 1 person): Balance as at 1 January Amounts advanced during the year Amounts repaid during the year Balance as at 31 December Aggregate maximum amount outstanding during the year Persons connected to Michael Spanos Overdrafts/credit cards 5 n/a n/a Persons connected to Michael Spanos Overdrafts/credit cards 9 n/a n/a 5 16 The balances included in the table above include principal and interest. Also, amounts advanced and repaid are not shown for overdraft and credit card facilities as these are revolving in nature. The aggregate maximum amount outstanding includes credit card exposures at the maximum statement balance. No impairment charges or provisions have been recognised during the year ended 31 December 2017 and 2016 in respect of the above loans and facilities. All interest that has fallen due on these loans or facilities has been paid. 189
192 49. Related party transactions (continued) (d) Transactions with Directors and key management personnel (continued) Loans to Directors (continued) Key management personnel in office during the year (and their connected persons) Balance as at 1 January Amounts advanced during the year Amounts repaid during the year Balance as at 31 December Aggregate maximum amount outstanding during the year Loans 2, ,549 2,692 Overdrafts/credit cards 389 n/a n/a ,954 2,884 3,183 Loans 3, ,565 3,809 Overdrafts/credit cards 523 n/a n/a ,871 2,954 4,640 The aggregate number of key management personnel during 2017 is 13 (2016: 18). The balances included in the table above are aggregated and include principal and interest. Also, amounts advanced and repaid are not shown for overdraft and credit card facilities as these are revolving in nature. The aggregate maximum amount outstanding includes credit card exposures at the maximum statement balance. No impairment charges or provisions have been recognised during the year ended 31 December 2017 and 2016 in respect of the above loans and facilities. All interest that has fallen due on these loans or facilities has been paid. 190
193 49. Related party transactions (continued) (d) Transactions with Directors and key management personnel (continued) Aggregate amounts outstanding at year end and additional transactions Number of persons Loans and advances as at 31 December: - Board of Directors Key management personnel ,473 2,502 Connected persons ,150 3,269 Interest income for the year Insurance premium income for the year Accruals and other liabilities as at 31 December: - balances with entity providing key management personnel services Staff costs, consultancy and restructuring expenses 6,217 3,101 17,627 11,992 The above table does not include year-end balances for members of the Board of Directors and their connected persons who resigned during the year. Interest income is disclosed for the period during which they were members of the Board of Directors or served as key management personnel. In addition to loans and advances, there were contingent liabilities and commitments in respect of members of the Board of Directors and their connected persons, mainly in the form of documentary credits, guarantees and commitments to lend, amounting to 76 thousand (2016: 61 thousand). There were also contingent liabilities and commitments to other key management personnel and their connected persons amounting to 431 thousand (2016: 385 thousand). The total unsecured amount of the loans and advances and contingent liabilities and commitments to members of the Board of Directors, key management personnel and their connected persons (using forced-sale values for tangible collaterals and assigning no value to other types of collaterals) at 31 December 2017 amounted to 663 thousand (2016: 635 thousand). At 31 December 2017 the Group has a deposit of 5,419 thousand (2016: 4,614 thousand) with Piraeus Bank SA, in which Mr Arne Berggren is a non-executive Director. The Group has also provided certain indemnities to Piraeus Bank SA as part of the disposal of Kyprou Leasing SA in At 31 December 2016 the Group had an investment in Invesco Euro Short Term Bond Fund, in which Mr Wilbur L. Ross Jr. was an executive Director. The fair value of the investment at 31 December 2016 amounted to 4,047 thousand. Mr Ross resigned from the Board of Directors of the Company on 1 March During the year ended 31 December 2017 premiums of 32 thousand and claims of 17 thousand were paid between the members of the Board of Directors of the Company and their connected persons and the insurance subsidiaries of the Group and commissions amounting to 10 thousand were received by the Group for the provision of investment services. Additionally, during the year ended 31 December 2017, BOC PCL has signed an agreement to rent property owned by connected persons to the director Mr Michalis Spanos covering the period from 1 June 2017 to 31 May The monthly rental expense amounts to 4 thousand commencing from June
194 49. Related party transactions (continued) (d) Transactions with Directors and key management personnel (continued) Aggregate amounts outstanding at year end and additional transactions (continued) There were no other transactions during the years ended 31 December 2017 and 2016 with connected persons of the current members of the Board of Directors or with any members who resigned during the two years. 192
195 50. Group companies The main subsidiary companies and branches included in the Consolidated Financial Statements of the Group, their registered office, their activities, and the percentage held by the Company (directly or indirectly) as at 31 December 2017 are: Company Bank of Cyprus Holdings Public Limited Company Bank of Cyprus Public Company Ltd The Cyprus Investment and Securities Corporation Ltd (CISCO) General Insurance of Cyprus Ltd EuroLife Ltd Kermia Ltd Kermia Properties & Investments Ltd Cytrustees Investment Public Company Ltd LCP Holdings and Investments Public Ltd JCC Payment Systems Ltd CLR Investment Fund Public Ltd Registered office 10 Earlsfort Terrace, Dublin 2, D02 T380, Ireland 51 Stassinos Street, Ayia Paraskevi, Strovolos, CY-2002, Nicosia Cyprus 154 Limassol Avenue, CY-2025, Strovolos, Nicosia, Cyprus 2-4 Themistokli Dervis Street, CY-1066, Nicosia, Cyprus 4 Evrou Street, CY-2003, Strovolos, Nicosia, Cyprus 51 Stassinos Street, Ayia Paraskevi, Strovolos, CY-2002, Nicosia Cyprus 154 Limassol Avenue, CY-2025 Strovolos, Nicosia, Cyprus 26 Vyronos Street, CY-1096 Nicosia, Cyprus 1 Stadiou Street, Nisou, CY-2571 Cyprus 26 Vyronos Street, CY-1096 Nicosia, Cyprus Activities Holding company Percentage holding (%) N/A Commercial bank 100 Investment banking, asset management and brokerage 100 General insurance 100 Life insurance 100 Property trading and development Property trading and development Closed-end investment company Holding company 67 Card processing transaction services 75 Investment company 20 Auction Yard Ltd 51 Stassinos Street, Auction company 100 BOC Secretarial Company Ltd Ayia Paraskevi, Strovolos, Secretarial services 100 S.Z. Eliades Leisure Ltd CY-2002, Nicosia Land development and Cyprus operation of a golf resort Alexandras Administration of guarantees Bank of Cyprus Public Company Ltd (branch Avenue, and holding of real estate of BOC PCL) Athens, Greece properties N/A Bank of Cyprus UK Ltd Bank of Cyprus Financial Services Ltd (formerly BOC Financial Services Ltd) BOC Asset Management Romania S.A. (formerly Cyprus Leasing S.A.) MC Investment Assets Management LLC Kyprou Finance (NL) B.V. Fortuna Astrum Ltd Charlotte Street, London, W1T 1RD, United Kingdom Calea Dorobonti 187B, Sector 1, Bucharest, Romania 19-1 Zvezdnyi building, Moscow, Russia Strawinskylaan 3127, 1077 ZX Amsterdam, Netherlands Internacionalniti Brigada 69, 11104, Grad Beograd, Serbia Commercial bank 100 Financial advisory services 100 Collection of the existing portfolio of receivables, including third party collections Problem asset management company Financing services 100 Problem asset management company
196 50. Group companies (continued) In addition to the above companies, at 31 December 2017 BOC PCL had 100% shareholding in the companies listed below whose activity is the ownership and management of immovable property: Cyprus: Timeland Properties Ltd, Cobhan Properties Ltd, Bramwell Properties Ltd, Birkdale Properties Ltd, Newington Properties Ltd, Innerwick Properties Ltd, Ramendi Properties Ltd, Ligisimo Properties Ltd, Polkima Properties Ltd, Nalmosa Properties Ltd, Smooland Properties Ltd, Emovera Properties Ltd, Estaga Properties Ltd, Skellom Properties Ltd, Blodar Properties Ltd, Spaceglowing Properties Ltd, Threefield Properties Ltd, Ecunaland Properties Ltd, Tebane Properties Ltd, Cranmer Properties Ltd, Vieman Ltd, Les Coraux Estates Ltd, Natakon Company Ltd, Oceania Ltd, Dominion Industries Ltd, Ledra Estate Ltd, EuroLife Properties Ltd, Laiki Lefkothea Center Ltd, Labancor Ltd, Steparco Ltd, Joberco Ltd, Zecomex Ltd, Domita Estates Ltd, Memdes Estates Ltd, Pamaco Platres Complex Ltd, Vameron Properties Ltd, Thryan Properties Ltd, Otoba Properties Ltd, Edoric Properties Ltd, Canosa Properties Ltd, Kernland Properties Ltd, Kimrar Properties Ltd, Jobelis Properties Ltd, Melsolia Properties Ltd, Lozzaria Properties Ltd, Koralmon Properties Ltd, Petrassimo Properties Ltd, Kedonian Properties Ltd, Lasteno Properties Ltd, Armozio Properties Ltd, Spacous Properties Ltd, Calinora Properties Ltd, Marcozaco Properties Ltd, Soluto Properties Ltd, Solomaco Properties Ltd, Linaland Properties Ltd, Andaz Properties Ltd, Unital Properties Ltd, Neraland Properties Ltd, Wingstreet Properties Ltd, Nolory Properties Ltd, Lynoco Properties Ltd, Fitrus Properties Ltd, Lisbo Properties Ltd, Mantinec Properties Ltd, Syniga Properties Ltd, Colar Properties Ltd, Irisa Properties Ltd, Bracando Properties Ltd, Provezaco Properties Ltd, Hillbay Properties Ltd, Jungax Properties Ltd, Ofraco Properties Ltd, Forenaco Properties Ltd, Hovita Properties Ltd, Badrul Properties Ltd, Belaland Properties Ltd, Citlali Properties Ltd, Astromeria Properties Ltd, Orzo Properties Ltd, Basiga Properties Ltd, Regetona Properties Ltd, Arcandello Properties Ltd, Camela Properties Ltd, Subworld Properties Ltd, Jongeling Properties Ltd, Introserve Properties Ltd, Alomco Properties Ltd, Cereas Properties Ltd, Fareland Properties Ltd, Sindelaco Properties Ltd, Barosca Properties Ltd, Fogland Properties Ltd, Tebasco Properties Ltd, Dolapo Properties Ltd, Homirova Properties Ltd, Valecross Properties Ltd, Altco Properties Ltd, Forsban Properties Ltd, Marisaco Properties Ltd, Olivero Properties Ltd, Jaselo Properties Ltd, Elosa Properties Ltd, Garveno Properties Ltd, Flona Properties Ltd, Toreva Properties Ltd, Resoma Properties Ltd, Mostero Properties Ltd, Helal Properties Ltd, Yossi Properties Ltd, Gozala Properties Ltd, Pendalo Properties Ltd, Frontyard Properties Ltd, Bascot Properties Ltd, Bonsova Properties Ltd, Nasebia Properties Ltd, Vanemar Properties Ltd, Garmozy Properties Ltd, Palmco Properties Ltd, Thermano Properties Ltd, Indene Properties Ltd, Ingane Properties Ltd, Venicous Properties Ltd, Lasmane Properties Ltd, Lorman Properties Ltd, Consoly Properties Ltd, Eracor Properties Ltd, Alomnia Properties Ltd, Rulemon Properties Ltd, Thelemic Properties Ltd, Maledico Properties Ltd, Dentorio Properties Ltd, Valioco Properties Ltd, Bascone Properties Ltd, Artozaco Properties Ltd, Elizano Properties Ltd, Letimo Properties Ltd (previously K. Athienitis Kalamon Ltd), Allodica Properties Ltd, Balasec Properties Ltd, Bendolio Properties Ltd, Carnota Properties Ltd, Desogus Properties Ltd, Diafor Properties Ltd, Kartama Properties Ltd, Nelipo Properties Ltd, Paradexia Properties Ltd, Paramina Properties Ltd, Prosilia Properties Ltd, Nouralia Properties Ltd, Resocot Properties Ltd, Soblano Properties Ltd, Talamon Properties Ltd, Weinar Properties Ltd, Zemialand Properties Ltd, Asianco Properties Ltd, Barway Properties Ltd, Cimonia Properties Ltd, Coeval Properties Ltd, Comenal Properties Ltd, Demoro Properties Ltd, Elosis Properties Ltd, Fastflow Properties Ltd, Finacap Properties Ltd, Finevo Properties Ltd, Ganina Properties Ltd, Nicosia Mall Property (NMP) Ltd (previously Gileco Properties Ltd), Intelamon Properties Ltd, Jomento Properties Ltd, Kenelyne Properties Ltd, Lancast Properties Ltd, Mazima Properties Ltd, Nesia Properties Ltd, Nigora Properties Ltd, Nivoco Properties Ltd, Pariza Properties Ltd, Primaco Properties Ltd, Riveland Properties Ltd, Rosalica Properties Ltd, Secretsky Properties Ltd, Senadaco Properties Ltd, Tasabo Properties Ltd, Unoplan Properties Ltd, Venetolio Properties Ltd and Zandexo Properties Ltd. The registered office of the above companies is at 51 Stassinos Street, Ayia Paraskevi, Strovolos, CY-2002, Nicosia, Cyprus, with the exception of EuroLife Properties Ltd whose registered office is at 4 Evrou Street, Strovolos, CY-2003 Nicosia, Cyprus and Ledra Estate Ltd which is at 2-4 Themistoklis Dervis Street, CY-1066 Nicosia, Cyprus. 194
197 50. Group companies (continued) Romania: Otherland Properties Dorobanti SRL, Battersee Real Estate SRL, Trecoda Real Estate SRL, Green Hills Properties SRL, Bocaland Properties SRL, Romaland Properties SRL, Imoreth Properties SRL, Inroda Properties SRL, Tantora Properties SRL, Zunimar Properties SRL, Allioma Properties SRL and Nikaba Properties SRL. The registered office of the companies is at Bucharest, George Cosbuc Street, 4 th Floor, 5 th District, Romania. Further, at 31 December 2017 BOC PCL had 100% shareholding in Obafemi Holdings Ltd, Stamoland Properties Ltd and Gosman Properties Ltd, 51% shareholding in Nicosia Mall Management (NMM) Limited (previously Devoco Properties Limited), Nicosia Mall Finance (NMF) Limited (previously Harimo Properties Limited) and Nicosia Mall Holdings (NMH) Limited (previously NCMH Nicosia City Mall Holdings Limited) whose main activities are the holding of shares and other investments and the provision of services. The registered office of the companies is at 51 Stassinos Street, Ayia Paraskevi, Strovolos, CY-2002, Nicosia, Cyprus. At 31 December 2017 BOC PCL had 100% shareholding in the companies listed below which are reserved to accept property: Cyprus: Belvesi Properties Ltd, Tavoni Properties Ltd, Amary Properties Ltd, Hamura Properties Ltd, Meriaco Properties Ltd, Flymoon Properties Ltd, Holstone Properties Ltd, Alepar Properties Ltd, Calandomo Properties Ltd, Cramonco Properties Ltd, Bigwaive Properties Ltd, Monata Properties Ltd, Valecast Properties Ltd, Legamon Properties Ltd, Teresan Properties Ltd, Aktilo Properties Ltd, Alezia Properties Ltd, Aparno Properties Ltd, Arleta Properties Ltd, Asendo Properties Ltd, Azemo Properties Ltd, Domilas Properties Ltd, Dorfilo Properties Ltd, Enelo Properties Ltd, Gylito Properties Ltd, Kuvena Properties Ltd, Lamezoco Properties Ltd, Mikosa Properties Ltd, Noleta Properties Ltd, Nuca Properties Ltd, Odolo Properties Ltd, Orleania Properties Ltd, Prodino Properties Ltd, Racotino Properties Ltd, Ravenica Properties Ltd, Rondemio Properties Ltd, Rouena Properties Ltd, Rylico Properties Ltd, Sailoma Properties Ltd, Stormino Properties Ltd, Tolmeco Properties Ltd, Vatino Properties Ltd, Virero Properties Ltd, Volparo Properties Ltd, Wiceco Properties Ltd and Zedoma Properties Ltd. The registered office of the companies is at 51 Stassinos Street, Ayia Paraskevi, Strovolos, CY-2002, Nicosia Cyprus. Romania: Selilar Properties SRL. Its registered office is at Bucharest, George Cosbuc Street, 4 th Floor, 5 th District, Romania. In addition, BOC PCL holds 100% of the following intermediate holding companies: Cyprus: Otherland Properties Ltd, Pittsburg Properties Ltd, Battersee Properties Ltd, Trecoda Properties Ltd, Bonayia Properties Ltd, Bocaland Properties Ltd, Buchuland Properties Ltd, Commonland Properties Ltd, Romaland Properties Ltd, BC Romanoland Properties Ltd, Blindingqueen Properties Ltd, Fledgego Properties Ltd, Janoland Properties Ltd, Loneland Properties Ltd, Unknownplan Properties Ltd, Frozenport Properties Ltd, Imoreth Properties Ltd, Inroda Properties Ltd, Melgred Properties Ltd, Tantora Properties Ltd, Zunimar Properties Ltd, Selilar Properties Ltd, Mirodi Properties Ltd, Nallora Properties Ltd, Nikaba Properties Ltd, Allioma Properties Ltd, Landanafield Properties Ltd and Hydrobius Properties Ltd. The registered office of the companies is at 51 Stassinos Street, Ayia Paraskevi, Strovolos, CY-2002, Nicosia Cyprus. BOC PCL also holds 100% of the following companies which are inactive: Cyprus: Laiki Bank (Nominees) Ltd, Fairford Properties Ltd, Thames Properties Ltd, Paneuropean Ltd, Philiki Ltd, Cyprialife Ltd, Imperial Life Assurance Ltd, Philiki Management Services Ltd, Nelcon Transport Co. Ltd, Ilera Properties Ltd, Weinco Properties Ltd, Calomland Properties Ltd, Lameland Properties Ltd, BOC Asset Management Ltd, Renalandia Properties Ltd, Sylvesta Properties Ltd, Crolandia Properties Ltd, Iperi Properties Ltd, Finerose Properties Ltd and Fantasio Properties Ltd. The registered office of the companies is at 51 Stassinos Street, Ayia Paraskevi, Strovolos, CY-2002, Nicosia Cyprus, except from BOC Asset Management Ltd whose registered office is at 154 Limassol Avenue, Strovolos, CY-2025, Nicosia, Cyprus. Greece: Kyprou Zois (branch of EuroLife Ltd), Kyprou Asfalistiki (branch of General Insurance of Cyprus Ltd), Kyprou Commercial SA and Kyprou Properties SA whose registered office is at 192 Alexandras Avenue, 11521, Athens, Greece. 195
198 50. Group companies (continued) Romania: Frozenport Properties SRL, Loneland Properties SRL and Melgred Properties SRL. The registered office of the companies is at Bucharest, George Cosbuc Street, 4 th floor, 5 th District, Romania with the exception of Frozenport Properties SRL whose registered office is at Voluntari City, 200A Piperi Building, 1 st Floor, Judet Ilfov, Romania. All Group companies are accounted for as subsidiaries using the full consolidation method. All companies listed above have share capital consisting of ordinary shares. Control over CLR Investment Fund Public Ltd (CLR) and its subsidiaries without substantial shareholding The Group considers that it exercises control over CLR and its subsidiaries (Europrofit Capital Investors Public Limited, Axxel Ventures Limited and CLR Private Equity Limited) through control of the members of the Board of Directors and is exposed to variable returns through its holding. Dissolution and disposal of subsidiaries As at 31 December 2017, the following subsidiaries were in the process of dissolution or in the process of being struck off: Samarinda Navigation Co Ltd, BOC Ventures Ltd, Salecom Ltd, Diners Club (Cyprus) Ltd, Leasing Finance LLC, Corner LLC, Omiks Finance LLC, Unknownplan Properties SRL, Bank of Cyprus (Channel Islands) Ltd, Buchuland Properties SRL, Janoland Properties SRL, Mirodi Properties SRL, Nallora Properties SRL, Pittsburg Properties SRL and Blindingqueen Properties SRL. In accordance with the Group s strategy to exit from overseas non-core operations, the operations of the branch in Romania are expected to be terminated, subject to the completion of deregistration formalities with respective authorities. Most of the remaining assets and liabilities of the branch in Romania with third parties have been transferred to other entities of the Group. Longtail Properties Ltd, Kyprou Securities SA and Tefkros Investments Ltd were dissolved during the year ended 31 December Moonland Properties Ltd, Lepidoland Properties Ltd, Danoma Properties Ltd, Metin Properties Ltd, Jemina Properties Ltd, Flitous Properties Ltd, Belzeco Properties Ltd, Landeed Properties Ltd, Nabela Properties Ltd, Singleserve Properties Ltd, Consento Properties Ltd, Molla Properties Ltd, Lezanco Properties Ltd, Balisimo Properties Ltd, Tezia Properties Ltd, Fireford Properties Ltd, Conemia Properties Ltd, Endar Properties Ltd, Valiro Properties Ltd, Nimoland Properties Ltd, Pekiro Properties Ltd, Nerofarm Properties Ltd, Orasmo Properties Ltd, Unduma Properties Ltd, Silen Properties Ltd, Cavadino Properties Ltd, Avolo Properties Ltd, Vidalaco Properties Ltd, Warmbaths Properties Ltd, Bothwick Properties Ltd, Caruzoco Properties Ltd, Threerich Properties Ltd, Hotel New Montana SRL, Commonland Properties SRL and Fledgego Properties SRL were disposed of during the year ended 31 December 2017 as part of the Group s strategy to dispose of repossessed properties. 51. Acquisitions and disposals 51.1 Acquisitions during Acquisition of Nicosia Mall Holdings (NMH) Limited In the context of the loan restructuring activities, the Group acquired on 28 September 2017 a 51% interest in the share capital of Nicosia Mall Holdings (NMH) Limited. Nicosia Mall Holdings (NMH) Limited is involved in the construction of the Nicosia Mall. The consideration for the acquisition of 51% share in Nicosia Mall Holdings (NMH) Limited amounts to 7,500 thousand which was used to reduce part of the outstanding facilities and therefore the acquisition did not include any cash consideration. The transaction was considered as an acquisition of an asset and was not treated as a business combination since the Group obtained control of an input without any process, therefore no goodwill or gain on bargain was recognised. BOC PCL has control over Nicosia Mall Holdings (NMH) Limited. The non-controlling interest is measured at the proportionate share of the identifiable net assets acquired. 196
199 51. Acquisitions and disposals (continued) 51.1 Acquisitions during 2017 (continued) Acquisition of Nicosia Mall Holdings (NMH) Limited (continued) The fair value of assets and liabilities of Nicosia Mall Holdings (NMH) Limited at the date of acquisition are presented below: Assets 000 Loans and advances to banks 4,011 Stock of property 52,758 Liabilities 56,769 Deposits by banks 56,769 Net identifiable assets acquired - No cash and cash equivalents were acquired Disposals during 2017 There were no material disposals during the year ended 31 December Acquisitions during Acquisition of S.Z. Eliades Leisure Ltd In the context of its loan restructuring activities, the Group acquired on 15 June 2016 a 70% interest in the share capital of S.Z. Eliades Leisure Ltd in exchange for the settlement of borrowings due from it of a total gross amount of 52,335 thousand. S.Z. Eliades Leisure Ltd operates in land development and the operation of a golf resort in Cyprus. The fair value of the consideration for the acquisition of the 70% share in S.Z. Eliades Leisure Ltd amounts to 43,758 thousand. The acquisition did not include any cash consideration. The Group considers that it controls S.Z. Eliades Leisure Ltd. The non-controlling interest is measured at the proportionate share of the identifiable net assets acquired. The fair value of assets and liabilities of S.Z. Eliades Leisure Ltd at the date of acquisition are presented below: Assets 000 Property and equipment 20,308 Stock of property 48,632 Prepayments, accrued income and other assets 580 Liabilities 69,520 Deferred tax liability 3,807 Accruals, deferred income and other liabilities 3,202 7,009 Net identifiable assets acquired 62,511 Less non-controlling interest (18,753) Net assets acquired 43,758 No cash and cash equivalents were acquired. 197
200 51. Acquisitions and disposals (continued) 51.3 Acquisitions during 2016 (continued) Acquisition of K. Athienitis Kalamon Ltd In the context of the loan restructuring activities of the parent company of K. Athienitis Kalamon Ltd, the Group acquired on 23 December 2016 a 100% interest in the share capital of K. Athienitis Kalamon Ltd. K. Athienitis Kalamon Ltd operates in the development and rental of immovable property. The fair value of the consideration for the acquisition of the 100% share in K. Athienitis Kalamon Ltd amounts to 4,204 thousand, which is also the cash consideration paid for the acquisition of the company. Part of the consideration paid was used to reduce the outstanding loan facilities of the parent company of K. Athienitis Kalamon Ltd. The Group considers that it controls K. Athienitis Kalamon Ltd. The fair value of assets and liabilities of K. Athienitis Kalamon Ltd at the date of acquisition are presented below: Assets 000 Stock of property 27,000 Prepayments, accrued income and other assets 2 Liabilities 27,002 Deposits by banks 22,198 Accruals, deferred income and other liabilities ,798 Net identifiable assets acquired 4,204 No cash and cash equivalents were acquired Disposal during Disposal of Kermia Hotels Ltd and adjacent land In June 2016, the Group completed the sale of 100% of its subsidiary Kermia Hotels Ltd and adjacent land which was classified as a disposal group held for sale. The carrying value of assets and liabilities disposed of as at the date of their disposal are presented below: Assets 000 Property and equipment 27,130 Prepayments, accrued income and other assets 678 Cash and cash equivalent 1,132 Liabilities 28,940 Deferred tax liability 3,677 Accruals, deferred income and other liabilities 1,308 4,985 Total net assets sold 23,955 The cash consideration received amounts to 26,500 thousand and the disposal resulted in a gain of 2,545 thousand (Note 13). 198
201 52. Investments in associates and joint ventures Carrying value of the investments in associates and joint ventures Percentage holdings (%) CNP Cyprus Insurance Holdings Ltd , ,172 Interfund Investments Plc ,343 2,167 Aris Capital Management LLC Rosequeens Properties Limited Rosequeens Properties SRL Tsiros (Agios Tychon) Ltd M.S. (Skyra) Vassas Ltd D.J. Karapatakis & Sons Limited Rodhagate Entertainment Ltd Fairways Automotive Holdings Ltd , ,339 Share of pre-tax profit/(loss) from associates and joint ventures CNP Cyprus Insurance Holdings Ltd 8,781 8,228 Interfund Investments Plc 176 (34) 8,957 8,194 Investments in associates CNP Cyprus Insurance Holdings Ltd As part of the acquisition of certain operations of Laiki Bank in 2013, 49.9% of CNP Cyprus Insurance Holdings Ltd, the parent company of a group of insurance companies in Cyprus and Greece, was acquired by the Group. The main financial highlights of the associate are as follows: Total assets 707, ,005 Total liabilities (475,794) (481,234) Net assets, including value of in-force business 232, ,
202 52. Investments in associates and joint ventures (continued) Investments in associates (continued) CNP Cyprus Insurance Holdings Ltd (continued) CNP Cyprus Insurance Holdings Ltd holds deposits with companies within the Group amounting to 19,547 thousand. The transactions between CNP Cyprus Insurance Holdings Ltd and the Group are presented in the table below: Dividend income 774 6,621 Interest expense paid by the Group Other expenses paid by the Group Interfund Investments Plc The Group has a 23.1% interest in Interfund Investments Plc, which is a closed-end investment company in Cyprus, listed on the CSE. The market value of the investment is 1,804 thousand (2016: 1,399 thousand). During the years 2017 and 2016 there were no material transactions between the Group and the associate. Rosequeens Properties Limited and Rosequeens Properties SRL The Group effectively owns 33.3% of the share capital of Rosequeens Properties SRL which is incorporated in Romania and owns a shopping mall in Romania. The shareholding was acquired after BOC PCL took part in a public auction for the settlement of customer loan balances amounting to approximately 21 million. The Group s share of net assets of the associate at 31 December 2017 and 2016 had nil accounting value as the net assets of the associate had a negative balance. Aris Capital Management LLC The Group s holding in Aris Capital Management LLC of 30.0% was transferred to the Group following the acquisition of certain operations of Laiki Bank. During previous years, the Group has recognised an impairment loss of 2,078 thousand. During the years 2017 and 2016, there were no material balances or transactions between the Group and the associate. M.S. (Skyra) Vassas Ltd During the year ended 31 December 2016, in the context of its loan restructuring activities, the Group acquired a 15.0% interest in the share capital of M.S. (Skyra) Vassas Ltd. M.S. (Skyra) Vassas Ltd is the parent company of a group of companies (Skyra Vassas group) with operations in the production, processing and distribution of aggregates (crushed stone and sand) and provision of other construction materials, and services based on core products such as ready-mix concrete, asphalt and packing of aggregates. The Group considers that it exercises significant influence over the Skyra Vassas group as the Group has the power to have representation to the Board of Directors and to vote for matters relating to the relevant activities of the business. The investment is considered to be fully impaired and its value is restricted to zero. 200
203 52. Investments in associates and joint ventures (continued) Investments in associates (continued) D.J. Karapatakis & Sons Limited and Rodhagate Entertainment Ltd During the year ended 31 December 2016, in the context of its loan restructuring activities, the Group acquired a 7.5% interest in the share capital of D.J. Karapatakis & Sons Limited and Rodhagate Entertainment Ltd, operating in leisure, tourism, film and entertainment industries in Cyprus. The Group considers that it exercises significant influence over the two companies as the Group has the power to have representation to the Board of Directors and to vote for matters relating to the relevant activities of the business. The investments are considered to be fully impaired and their value is restricted to zero. Fairways Automotive Holdings Ltd During the year ended 31 December 2016, in the context of its loan restructuring activities, the Group acquired a 45.0% interest in the share capital of Fairways Automotive Holdings Ltd. Fairways Automotive Holdings Ltd is the parent company of Fairways Ltd operating in the import and trading of motor vehicles and spare parts. The Group considers that it exercises significant influence over the company. The investment is considered to be fully impaired and its value is restricted to zero. Investment in joint venture Tsiros (Agios Tychon) Ltd The Group holds a 50.0% shareholding in Tsiros (Agios Tychon) Ltd. The shareholder agreement with the other shareholder of Tsiros (Agios Tychon) Ltd stipulates a number of matters which require consent by both shareholders, therefore the Group considers that it jointly controls the company. The carrying value of Tsiros (Ayios Tychon) Ltd is restricted to zero. The percentage holdings are in ordinary shares or membership interests. 201
204 53. Country by country reporting Article 89 of CRD IV requires banks to disclose on a consolidated basis the following information for all countries where the Group operates. The table below provides information on the following items of the Group for year 2017: Country Total operating income/ (expense) Average number of employees (Loss)/profit before tax Accounting tax expense on (loss)/profit Corporation tax paid/ (refunded) Public subsidies received Cyprus 854,714 4,034 (434,162) 5,196 2,376 - Russia (4,796) 1,593 1,593 - United Kingdom 48, ,162 1,058 1,022 - Romania 1, (11,169) Greece 2,478 6 (31,542) 1,330 (10,924) - Netherlands (8) - (137) Total 907,350 4,314 (477,644) 9,523 (5,630) - The activities of Group companies by geographical area are disclosed in Note 50. Total operating income/(expense): comprises net interest income, net fee and commission income, net foreign exchange gains, net gains on financial instrument transactions and disposal/dissolution of subsidiaries, insurance income net of claims and commissions, net (losses)/gains from revaluation and disposal of investment properties, net gains on disposal of stock of property and other income. Number of employees: the number of employees has been calculated as the average number of employees, on a quarterly basis, who were employed by the Group during the year ended 31 December (Loss)/profit before tax: (Loss)/profit before tax represents (losses)/profits after the deduction of inter-segment revenues/(expenses). Accounting tax expense on (loss)/profit: includes corporation tax and Cyprus special defence contribution. Deferred tax charge for the year is excluded from the above. Corporation tax paid/(refunded): includes actual payments made during 2017 for corporation tax (including insurance premium taxes) and Cyprus special defence contribution. 202
205 INDEPENDENT AUDITORS REPORT TO THE MEMBERS OF BANK OF CYPRUS HOLDINGS PUBLIC LIMITED COMPANY Opinion We have audited the financial statements of Bank of Cyprus Holdings Public Limited Company ( the Company or the Parent Company ) and its subsidiaries (all together, the Group ) for the year ended 31 December 2017, which comprise the Consolidated Income Statement, Consolidated and Parent Company Statement of Comprehensive Income, Consolidated and Parent Company Balance Sheet, Consolidated and Parent Company Statement of Changes in Equity, Consolidated and Parent Company Statement of Cash Flows and notes to the financial statements, including the Summary of significant accounting policies set out in Note 2. The financial reporting framework that has been applied in their preparation is Irish Law and International Financial Reporting Standards ( IFRS ) as adopted by the European Union and, as regards the Company financial statements, as applied in accordance with the provisions of the Companies Act In our opinion: the Group financial statements give a true and fair view of the assets, liabilities and financial position of the Group as at 31 December 2017 and of its loss for the year then ended; the Company financial statements give a true and fair view of the assets, liabilities and financial position of the Company as at 31 December 2017 and of its loss for the year then ended; the Group financial statements have been properly prepared in accordance with IFRS as adopted by the European Union; the Company financial statements have been properly prepared in accordance with IFRS as adopted by the European Union as applied in accordance with the provisions of the Companies Act 2014; and the Group financial statements and Company financial statements have been properly prepared in accordance with the requirements of the Companies Act 2014 and, as regards the Group financial statements, Article 4 of the IAS Regulation. Basis for opinion We conducted our audit in accordance with International Standards on Auditing (Ireland) ( ISAs (Ireland) ) and applicable law. Our responsibilities under those standards are further described in the Auditor's Responsibilities for the Audit of the Financial Statements section of our report. We are independent of the Group and Company in accordance with ethical requirements that are relevant to our audit of financial statements in Ireland, including the Ethical Standard as applied to public interest entities issued by the Irish Auditing and Accounting Supervisory Authority (IAASA), and we have fulfilled our other ethical responsibilities in accordance with these requirements. We believe that the audit evidence we have obtained is sufficient and appropriate to provide a basis for our opinion. Overview of our audit approach Key audit matters Impairment provision on loans and advances to customers including IFRS 9 transition Legal and conduct provisions Going concern Recoverability of deferred tax assets Valuation of stock of property Materiality Group materiality of 22m which represents 1% of Common Equity Tier 1 Key audit matters Key audit matters are those matters that, in our professional judgment, were of most significance in our audit of the financial statements of the current period and include the most significant assessed risks of material misstatement (whether or not due to fraud) that we identified, including those which had the greatest effect on: the overall audit strategy, the allocation of resources in the audit; and directing the efforts of the engagement team. These matters were addressed in the context of our audit of the financial statements as a whole, and in forming our opinion thereon, and we do not provide a separate opinion on these matters. 203
206 INDEPENDENT AUDITORS REPORT TO THE MEMBERS OF BANK OF CYPRUS HOLDINGS PUBLIC LIMITED COMPANY Key audit matter How our audit addressed the key audit matter Impairment provision on loans and advances to customers including IFRS 9 transition As at 31 December 2017, gross loans and advances amounted to 18,086m (2016: 19,201m) and the related impairment provision amounted to 3,484m (2016: 3,552m). The basis of the impairment provision policy is presented in the accounting policies and further analysed in Note 5.1 to the consolidated financial statements. Impairment provisions are calculated on a collective basis for portfolios of loans of similar credit risk characteristics and on an individual basis for loans that meet the internal definition of significant. Management exercises significant judgment, using subjective assumptions, when determining both the timing and the amounts of the impairment provision for loans and advances. As loans and advances comprise a large portion of the Group s assets, and due to the significance of judgment used in estimating both the individual and collective provisions, this is considered to be a key audit matter. We have focused on the following judgments and estimates which could give rise to material misstatement or are potentially subject to management bias: The completeness and timing of recognition of loss events. The measurement of individually assessed provisions, which is dependent on the valuation of collateral, the timing of cash flows and realisations. The measurement of modelled provisions, which is dependent upon key assumptions relating to probability of default and recovery rates. Refer to the accounting policies; and Note 44 of the consolidated financial statements. The Group is required under IAS 8 to disclose the impact of IFRS 9 adoption for accounting periods beginning on or after 1 January We consider this transition and disclosure to be a key audit matter because new models have been developed to calculate IFRS 9 impairment losses (see note of the consolidated financial statements) and Impairment provisions recognised in respect of retail and commercial lending are determined by management using discounted cash flow assessments and modelling techniques that utilise customer data, historical loan performance, expected future performance and a variety of market assumptions. We focused on the assumptions underlying the calculation of modelled provisions and the discounted cash flow assessments. In obtaining sufficient audit evidence we: Reviewed design and operating effectiveness of key controls around the end-to-end process from classification and performance monitoring and calculation of impairment provisions to the final stages of approval governance and model validation, with consideration given to susceptibility of controls to management override. Reviewed impairment methodology to establish model parameters and performed data integrity validation checks to ensure that the inputs employed by the Group s modelling tools in the calculation of provisions are correct. Involved our credit risk specialists within the engagement team to test the assumptions and calculations of modelled collective provisions. The underlying logic of data preparation, transformation and related formulas for computing collective provisions was assessed via a source code review of the related IT components involved. For non-performing loans, we tested a sample of loan reviews and assessed the measurement of the provisions, involving our valuation specialists to value the collateral. We examined other cash flow assumptions where the level of provision is not dependent on collateral values. We also assessed the timing of estimated cash flows. Evaluated and tested key assumptions adopted by management. In respect of the disclosure of the impact of IFRS 9, we obtained an understanding of and evaluated management s process for the calculation of the transition adjustment including governance over the determination of key judgments. These included probability weighted macroeconomic scenarios, staging criteria and forward looking information. We also performed the following procedures: Reviewed key technical papers prepared by management during the transition project as part of our assessment of the effectiveness of the implementation. Tested the key controls developed by management for the purpose of generating the transition adjustment for both Impairment and Classification & Measurement. 204
207 INDEPENDENT AUDITORS REPORT TO THE MEMBERS OF BANK OF CYPRUS HOLDINGS PUBLIC LIMITED COMPANY Key audit matter judgment is required in a number of significant areas, in particular around the calculation of Expected Credit Loss. How our audit addressed the key audit matter Assessed the output of management s Classification & Measurement workstream for consistency with our understanding of the Group s business models. With the assistance of our internal specialists, tested key IFRS 9 models developed by management where these were relevant to the calculation of the transition adjustment. We assessed the key assumptions and judgments made by management. Reviewed management s rationalisation of the overall calculated impact of IFRS 9 on the Balance Sheet position at 1 January We assessed the appropriateness and presentation of disclosures with relevant accounting standards and our planned audit procedures were completed without material exception. Legal and conduct provisions As at 31 December 2017, provision for litigation and conduct matters amounted to 133m (2016: 49m). The accounting policy for provisions is described in Note 2.31 and further analysed in Note 5.11 to the consolidated financial statements. The Group, in the ordinary course of business, is subject to various legal claims, investigations and other proceedings. It also operates in a heavily regulated environment and needs to remain constantly alert to ensure compliance with relevant rules and regulations. Management reviews all existing and potential legal and conduct provisions based on the assessment of the probability of economic outflow from the Group in conjunction with the internal compliance and legal departments. In relation to provision for pending litigation, audit focus was placed on the completeness of the exposures and the litigation provision identified by the Group and the probability of occurrence assigned to each case. In relation to the provision for conduct matters, audit focus was placed on the reliability and completeness of underlying customer data, assumptions incorporated within the provision valuations, and the completeness of the provisions recorded. In obtaining sufficient audit evidence we: Obtained detailed assessment from the Group s internal legal department of potential outcomes for each individual case in excess of 200k. We ensured that this assessment was endorsed by the Group s external legal advisors in Cyprus and Greece. Reviewed with the head of the internal legal department the list of existing and potential claims, the current progression of existing cases with a range of related outcome possibilities and the consequential exposure for the Group. The recognition and measurement of provisions in respect of litigation, regulatory actions and customer remediation require a high level of judgment. Due to the risk that the provision for impending litigations and pending regulatory matters may be incomplete or inappropriately provided for, and the difficulty in assessing and measuring the quantum from any resulting obligations, this is considered a key audit matter. Refer to the Accounting policies; and Notes 34 and 39 of the consolidated financial statements. Reviewed lists of legal cases from each location and tested that sufficient provision has been recorded in the Group s records where the exposure is assessed as probable. Reviewed the board of directors and other committee meeting minutes for evidence of any unidentified legal cases or developments in current cases which may impact the outcome. Reviewed regulatory correspondence for the duration of the audit period and further inquired with the compliance department about known existing circumstances or possible non-compliance with any regulatory requirements. Reviewed working files and results reports for the assessment of customer redress provisions, prepared by the Group s external advisors. We involved our internal specialists to 205
208 INDEPENDENT AUDITORS REPORT TO THE MEMBERS OF BANK OF CYPRUS HOLDINGS PUBLIC LIMITED COMPANY Key audit matter How our audit addressed the key audit matter assess the assumptions around response rates and consequential losses. Assessed the disclosures made against the relevant accounting standards. Our planned audit procedures were completed without material exception. Going Concern As disclosed in the Statement of Directors Responsibilities, Directors are required to prepare the financial statements on a going concern basis unless it is inappropriate to presume that the Company will continue in business. The Directors have determined that the going concern principle is appropriate and that the Group is taking all necessary measures to maintain its viability and the development of its business in the current economic environment. The Group was previously not in compliance with all liquidity regulatory requirements with respect to its operations in Cyprus. This is considered to be a key audit matter. Refer to the Directors Report and Note 3 of the consolidated financial statements. Our audit procedures included evaluating the Directors going concern assessment in order to assess whether there are events and conditions that exist that may cast significant doubt of the Group s ability to continue as a going concern. In obtaining sufficient audit evidence we: Read regulator correspondence for evidence of changes in the Group s capital and liquidity requirements. Evaluated the progress made in relation to the funding position and compliance with minimum liquidity requirements. Reviewed the Group s 3 year plan approved by the Board of Directors in December Involved our internal valuation specialists within the engagement team to review and test the inputs and assumptions embedded in forecasts, considering whether the overall forecasts are within a range of possible alternative outcomes and in line with our knowledge of the business, the operating environment in Cyprus and of the Group, the future strategy and the past performance. Assessed whether the Group s disclosures in relation to going concern adequately reflected the risks and uncertainties inherent to the going concern assessment. Our planned audit procedures were completed without material exception. Recoverability of Deferred Tax Assets The Group has recognised deferred tax assets of 383m (2016: 450m) in respect of tax losses available to be carried forward to future years. The basis of the recognition is presented in the accounting policies and further analysed in Note 5.7 to the consolidated financial statements. The recoverability and carrying amount of the deferred tax assets require management judgment and estimation in assessing the probability, timing and sufficiency of future taxable profits from which deductible temporary differences and unutilised tax losses can be offset, particularly when this forecasting extends beyond the normal planning cycle. This in turn is based on In the performance of our audit procedures, focus was placed on assessing the key judgment inputs and assumptions underlying the profit projections such as macro-economic assumptions, business growth rates, cost reduction and restructuring initiatives. In obtaining sufficient audit evidence we: Reviewed and tested the supporting calculations of the Group s initial 3 year plan which formed the basis of the extended projections until Involved our internal valuation specialists within the engagement team to review and test the inputs and assumptions embedded in forecasts, considering whether the overall forecasts are within a range of possible alternative outcomes and in line with our knowledge of the business, the 206
209 INDEPENDENT AUDITORS REPORT TO THE MEMBERS OF BANK OF CYPRUS HOLDINGS PUBLIC LIMITED COMPANY Key audit matter assumptions concerning future economic conditions, business performance and legislation governing the use of historical trading losses carried forward. In light of the inherent uncertainty and significant amount of judgment and estimation required by management, we have considered future forecasts supporting the recognition of deferred tax assets to be a key audit matter. Refer to the Accounting policies and Note 17 of the consolidated financial statements. How our audit addressed the key audit matter operating environment in Cyprus and of the Group, the future strategy and the past performance. Compared the actual results with management profit projections and obtained explanations about significant variances to assess the accuracy of the forecasting process. Assessed the disclosures made against the relevant accounting standards. Our planned audit procedures were completed without material exception. Valuation of stock of property The Group has acquired a significant number of properties as a result of restructuring agreements with customers. As at 31 December 2017, the stock of properties amounted to 1,641m (2016: 1,427m). The basis of the property valuation policy is presented in the accounting policies and further analysed in Note 5.10 to the consolidated financial statements. These properties are valued by the Group as stock of property in accordance with IAS 2. In light of the large volume of properties held and the uncertainty around market conditions when estimating the recoverable amount, we have considered the judgment based valuation inputs involved to be a key audit matter. Refer to the Accounting policies and Note 27 of the consolidated financial statements. In the performance of our audit procedures, focus was placed on assessing the key judgment inputs and assumptions underlying the valuation of the properties held in accordance to IAS2. In obtaining sufficient audit evidence we: Reviewed design and operating effectiveness of key controls around the end-to-end valuation process of stock of property. Obtained management s assessment of the net realisable value ( NRV ) and tested whether the lower of the cost and NRV is considered as the value of the inventory as at the reporting date, in accordance with IAS 2. Obtained the valuation reports received by the Group from independent external valuers for a sample of properties and tested that the fair value used in the calculation of the NRV was in accordance with these valuations. For a sample of external valuation reports reviewed, we assessed the methodology and assumptions by involving our internal valuation specialists. Compared disposal cost assumptions incorporated in the Group s calculation of the NRV to disposals that have occurred during the year. Performed substantive analytical review procedures, categorising the properties by type and district and comparing the change in the value of each type of property and each district over the year to the changes in Royal Institute of Chartered Surveyors ( RICS ) indices. Assessed the disclosures made against the relevant accounting standards. Our planned audit procedures were completed without material exception. Our application of materiality We apply the concept of materiality in planning and performing the audit, in evaluating the effect of identified misstatements on the audit and in forming our audit opinion. Materiality Materiality is the magnitude of an omission or misstatement that, individually or in the aggregate, could reasonably be expected to influence the economic decisions of the users of the financial statements. Materiality provides a basis for determining the nature and extent of our audit procedures. 207
210 INDEPENDENT AUDITORS REPORT TO THE MEMBERS OF BANK OF CYPRUS HOLDINGS PUBLIC LIMITED COMPANY We determined materiality for the Group to be 22m (2016: 27m), which is 1% (2016: 1%) of the Group s Common Equity Tier 1 ( CET1 ). We believe that this provides us with the most appropriate performance metric on which to base our materiality calculation as we consider it to be the most relevant performance measure to the stakeholders of the Group. The Company became the sole shareholder of Bank of Cyprus Public Company Ltd ( BOC PCL ) on 18 January 2017 and the Group is considered to be a continuation of the predecessor BOC group. Hence, the 2016 materiality comparatives displayed are those that were deployed for the audit of the predecessor BOC group. The basis for calculation remains consistent. Performance materiality Performance materiality is the threshold for application of materiality at the individual account or balance level. Performance materiality is set at an amount to reduce to an appropriately low level the probability that the aggregate of uncorrected and undetected misstatements exceeds materiality. On the basis of our risk assessments, together with our assessment of the overall control environment, our judgment was that performance materiality should be set at 50% (2016: 50%) of our materiality, namely 11m (2016: 14m). We have set performance materiality at this level having performed our risk assessment and due to this being our first year as auditors for the new Group. Reporting threshold The reporting threshold is set as the amount below which identified misstatements are considered as being clearly trivial. We agreed with the Audit Committee that we would report to them all uncorrected audit differences in excess of 1m (2016: 1m), which is set at 5% of planning materiality, as well as differences below that threshold that, in our view, warranted reporting on qualitative grounds. Our reporting threshold amount is designated at an amount below which misstatements would not be accumulated because we expect that the accumulation of such amounts clearly would not have a material effect on the financial statements. We evaluate any uncorrected misstatements against both the quantitative measures of materiality discussed above and in light of other relevant qualitative considerations in forming our opinion. An overview of the scope of our audit report Tailoring the scope Our assessment of audit risk, our evaluation of materiality and our allocation of performance materiality determine our audit scope for each entity within the Group. Taken together, this enables us to form an opinion on the consolidated financial statements. We take into account size, risk profile, the organisation of the group and effectiveness of group-wide controls, changes in the business environment and other factors such as recent internal audit results when assessing the level of work to be performed at each component entity. In establishing the overall approach to the Group audit, we determined the type of work that needed to be performed at each operating segment and business unit by us, as the Group engagement team, or by component EY auditors operating under our instructions ( component auditors ). Where the work was performed by component auditors, we determined the level of involvement we needed to have in their audit work to be able to conclude whether sufficient audit evidence had been obtained as a basis for our opinion on the consolidated financial statements as a whole. Having assessed the risk of material misstatement to the Group financial statements, we selected 1 full-scope and 3 specific-scope components covering locations in Cyprus, the United Kingdom and Greece, representing the principal business units of the Group. Together with additional procedures performed at the Group level, this gave us the evidence required for our opinion on the Group financial statements. Of the 4 components selected, we performed full scope audit procedures of the financial information of BOC PCL (the full scope component ) which was selected based on its size and risk characteristics. For the remaining 3 components ( specific scope components ), we performed audit procedures on specific accounts within that component that we considered had the potential for the greatest impact on the Group financial statements because 208
211 INDEPENDENT AUDITORS REPORT TO THE MEMBERS OF BANK OF CYPRUS HOLDINGS PUBLIC LIMITED COMPANY of the size of these accounts or their risk profile. These 3 components were EuroLife Ltd, Bank of Cyprus UK Ltd and the Greek branch of BOC PCL. We also instructed component auditors for 5 other locations to perform specified procedures over accounts and disclosures that were material to the Group audit. The reporting components where we instructed or performed audit procedures accounted for 96% (2016: 120%) of the Group s Loss before tax, 94% (2016: 92%) of the Group s Revenue and 99% (2016: 99%) of the Group s Total assets. The audit scope of these components may not have included testing of all significant accounts of the component but will have contributed to the coverage of significant testing for the Group. Of the remaining components, none are individually greater than 2% of the Group s equity. For these components, we performed other procedures to respond to any other potential risks of material misstatement to the Group financial statements. Conclusions relating to principal risks, going concern and viability statement We have nothing to report in respect of the following information in the annual report, in relation to which ISAs (Ireland) require us to report to you whether we have anything material to add or draw attention to: the disclosures in the annual report set out on notes 44 to 47 that describe the principal risks and explain how they are being managed or mitigated; the directors confirmation set out in the Viability statement on page 12 in the annual report that they have carried out a robust assessment of the principal risks facing the Group and the parent company, including those that would threaten its business model, future performance, solvency or liquidity; the directors statement set out on page 11 in the financial statements about whether the directors considered it appropriate to adopt the going concern basis of accounting in preparing the financial statements and the directors identification of any material uncertainties to the Group s and the parent Company s ability to continue to do so over a period of at least twelve months from the date of approval of the financial statements; whether the directors statement relating to going concern required under the Listing Rules in accordance with Listing Rule 9.8.6R (3) is materially inconsistent with our knowledge obtained in the audit; or the directors explanation in the annual report as to how they have assessed the prospects of the Group and the parent Company, over what period they have done so and why they consider that period to be appropriate, and their statement as to whether they have a reasonable expectation that the group and the parent company will be able to continue in operation and meet its liabilities as they fall due over the period of their assessment, including any related disclosures drawing attention to any necessary qualifications or assumptions. Other information The directors are responsible for the other information. The other information comprises the information included in the annual report other than the financial statements and our auditor s report thereon. Our opinion on the financial statements does not cover the other information and, except to the extent otherwise explicitly stated in our report, we do not express any form of assurance conclusion thereon. In connection with our audit of the financial statements, our responsibility is to read the other information and, in doing so, consider whether the other information is materially inconsistent with the financial statements or our knowledge obtained in the audit or otherwise appears to be materially misstated. If we identify such material inconsistencies or apparent material misstatements, we are required to determine whether there is a material misstatement in the financial statements or a material misstatement of the other information. If, based on the work we have performed, we conclude that there is a material misstatement of this other information, we are required to report that fact. We have nothing to report in this regard. 209
212 INDEPENDENT AUDITORS REPORT TO THE MEMBERS OF BANK OF CYPRUS HOLDINGS PUBLIC LIMITED COMPANY In this context, we also have nothing to report in regard to our responsibility to specifically address the following items in the other information and to report as uncorrected material misstatements of the other information where we conclude that those items meet the following conditions: Fair, balanced and understandable the statement given by the directors that they consider the annual report and financial statements taken as a whole is fair, balanced and understandable and provides the information necessary for shareholders to assess the group s and the parent company s performance, business model and strategy, is materially inconsistent with our knowledge obtained in the audit; or Audit committee reporting the report does not appropriately address matters communicated by us to the audit committee; or Directors statement of compliance with the UK Corporate Governance Code the parts of the directors statement required under the Listing Rules relating to the company s compliance with the UK Corporate Governance Code containing provisions specified for review by the auditor in accordance with Listing Rule R (2) do not properly disclose a departure from a relevant provision of the UK Corporate Governance Code. Opinions on other matters prescribed by the Companies Act 2014 Based solely on the work undertaken in the course of the audit, we report that: in our opinion, the information given in the directors report is consistent with the financial statements; and in our opinion, the directors report has been prepared in accordance with the Companies Act We have obtained all the information and explanations which we consider necessary for the purposes of our audit. In our opinion the accounting records of the Company were sufficient to permit the financial statements to be readily and properly audited and the Company financial statements are in agreement with the accounting records. Matters on which we are required to report by exception Based on the knowledge and understanding of the company and its environment obtained in the course of the audit, we have not identified material misstatements in the directors' report. The Companies Act 2014 requires us to report to you if, in our opinion, the disclosures of directors remuneration and transactions required by sections 305 to 312 of the Act are not made. We have nothing to report in this regard. Respective responsibilities Responsibilities of directors for the financial statements As explained more fully in the Statement of Directors Responsibilities set out on page 23, the directors are responsible for the preparation of the financial statements and for being satisfied that they give a true and fair view, and for such internal control as they determine is necessary to enable the preparation of financial statements that are free from material misstatement, whether due to fraud or error. In preparing the financial statements, the directors are responsible for assessing the parent Company s ability to continue as a going concern, disclosing, as applicable, matters related to going concern and using the going concern basis of accounting unless management either intends to liquidate the Company or to cease operations, or has no realistic alternative but to do so. Auditor s responsibilities for the audit of the financial statements Our objectives are to obtain reasonable assurance about whether the financial statements as a whole are free from material misstatement, whether due to fraud or error, and to issue an auditor's report that includes our opinion. Reasonable assurance is a high level of assurance, but is not a guarantee that an audit conducted in accordance with ISAs (Ireland) will always detect a material misstatement when it exists. Misstatements can arise from fraud or error and are considered material if, individually or in the aggregate, they could reasonably be expected to influence the economic decisions of users taken on the basis of these financial statements. 210
213 INDEPENDENT AUDITORS REPORT TO THE MEMBERS OF BANK OF CYPRUS HOLDINGS PUBLIC LIMITED COMPANY The objectives of our audit, in respect to fraud, are; to identify and assess the risks of material misstatement of the financial statements due to fraud; to obtain sufficient appropriate audit evidence regarding the assessed risks of material misstatement due to fraud, through designing and implementing appropriate responses; and to respond appropriately to fraud or suspected fraud identified during the audit. However, the primary responsibility for the prevention and detection of fraud rests with both those charged with governance of the entity and management. Our approach was as follows: We obtained an understanding of the legal and regulatory frameworks that are applicable to the Group and have a direct impact on the preparation of the financial statements. We assessed the susceptibility of the Group s financial statements to material misstatement, including how fraud might occur by holding discussions with senior management, including the Chief Executive Officer, Chief Financial Officer, Chief Risk Officer, Head of Internal Audit and Head of Legal. We also reviewed the Group s fraud-related policies and mandates of different governance forums assessing fraud. As part of our audit procedures, we were aware of the risk of fraud, especially in the areas of estimation and those we assessed as having the risk of management override. Based on this understanding we designed our audit procedures to identify non-compliance with such laws and regulations. Our procedures involved inquiring of key management, reviewing the key policies and reviewing the correspondence exchanged with the Regulators. A further description of our responsibilities for the audit of the financial statements is located on the IAASA's website at: _responsibilities_for_audit.pdf. This description forms part of our auditor's report. Other matters which we are required to address We were appointed by the board of Bank of Cyprus Holdings Public Limited Company on 14 July 2016 to audit the financial statements for the year ending 31 December 2016 and subsequent financial periods. The period of total uninterrupted engagement including previous renewals and reappointments of the firm is 2 years. The non-audit services prohibited by IAASA s Ethical Standard were not provided to the company and we remain independent of the company in conducting our audit. Our audit opinion is consistent with the additional report to the audit committee. The purpose of our audit work and to whom we owe our responsibilities Our report is made solely to the Company s members, as a body, in accordance with section 391 of the Companies Act Our audit work has been undertaken so that we might state to the Company s members those matters we are required to state to them in an auditor s report and for no other purpose. To the fullest extent permitted by law, we do not accept or assume responsibility to anyone other than the Company and the Company s members, as a body, for our audit work, for this report. Eoin MacManus for and on behalf of Ernst & Young Chartered Accountants and Statutory Audit Firm Office: Dublin Date: 26/03/
214 Financial Statements 212
215 BANK OF CYPRUS HOLDINGS PUBLIC LIMITED COMPANY Financial Statements - Contents for the year ended 31 December 2017 Contents Page Statement of Comprehensive Income 214 Balance Sheet 215 Statement of Changes in Equity 216 Statement of Cash Flows 217 Notes to the financial statements
216 BANK OF CYPRUS HOLDINGS PUBLIC LIMITED COMPANY Statement of Comprehensive Income for the year ended 31 December For the period from 11 July 2016 to 31 December 2016 Notes Other income 4 1,653 - Administrative and other operating expenses 5 (1,602) (20) Finance costs 51 (20) (24) - Impairment of investment in subsidiary 7 (545,358) - Loss before income tax (545,331) (20) Income tax Loss and total comprehensive loss for the year/period (545,331) (20) The notes on pages 218 to 225 form an integral part of these financial statements. 214
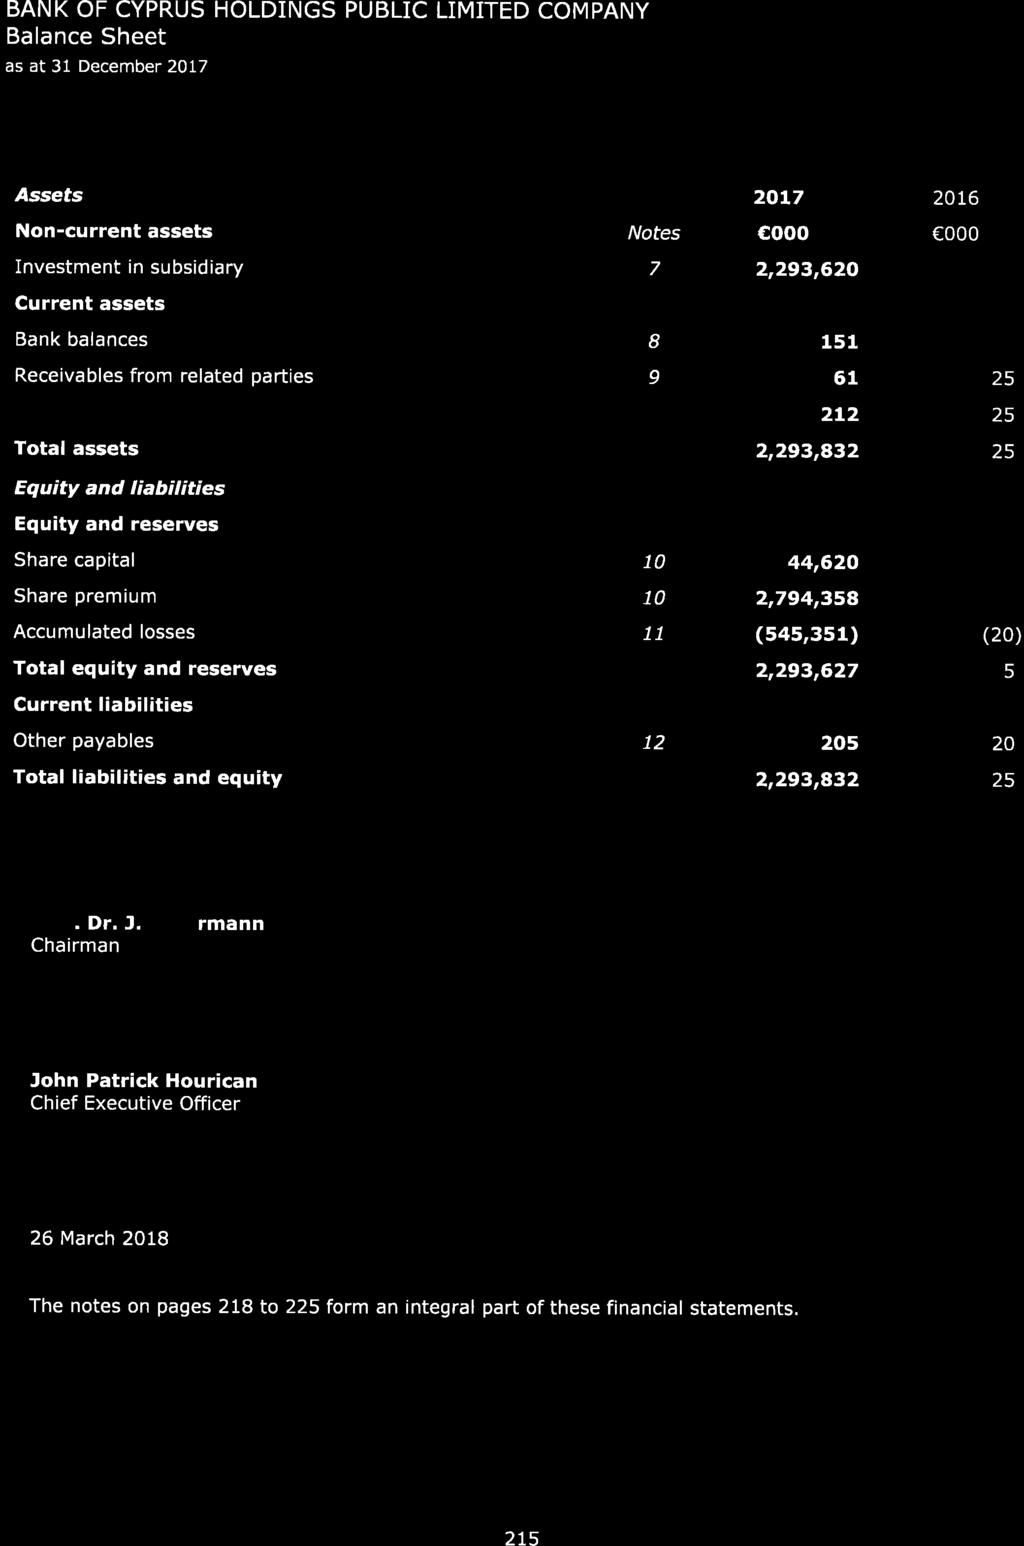
217
Announcement. Group Financial Results for the year ended 31 December Nicosia, 27 March 2018
 Announcement Group Financial Results for the year ended 31 December 2017 Nicosia, 27 March 2018 This announcement contains inside information for the purposes of Article 7 of the Market Abuse Regulation
Preliminary Group Financial Results for the year ended 31 December 2017
 Announcement Preliminary Group Financial Results for the year ended 31 December 2017 Nicosia, 27 February 2018 This announcement contains inside information for the purposes of Article 7 of the Market
Announcement. Group Financial Results for the quarter ended 31 March Nicosia, 29 May 2018
 Announcement Group Financial Results for the quarter ended 31 March 2018 Nicosia, 29 May 2018 This announcement contains inside information for the purposes of Article 7 of the Market Abuse Regulation
Announcement. Group Financial Results for the six months ended 30 June Nicosia, 29 August 2017
 Announcement Group Financial Results for the six months ended 30 June 2017 Nicosia, 29 August 2017 Key Highlights for the six months ended 30 June 2017 Good Progress on NPEs Nine consecutive quarters of
Group Financial Results for the nine months ended 30 September 2017
 Announcement Group Financial Results for the nine months ended 30 September 2017 Nicosia, 21 November 2017 This announcement contains inside information for the purposes of Article 7 of the Market Abuse
Announcement. Group Financial Results for the six months ended 30 June Nicosia, 28 August 2018
 Announcement Group Financial Results for the six months ended 30 June 2018 Nicosia, 28 August 2018 This announcement contains inside information for the purposes of Article 7 of the Market Abuse Regulation
Announcement. Group Financial Results for the year ended 31 December Nicosia, 28 March Key Highlights
 Announcement Group Financial Results for the year ended 31 December 2016 Nicosia, 28 March 2017 Key Highlights Significant milestones achieved in January 2017: ELA full repayment, successful issuance of
Preliminary Group Financial Results for the year ended 31 December 2015
 Announcement Preliminary Group Financial Results for the year ended 31 December 2015 Nicosia, 25 February 2016 Key Highlights Good progress in tackling delinquent loans; During FY2015, 90+ DPD were reduced
Group Financial Results for the nine months ended 30 September 2018
 Announcement Group Financial Results for the nine months ended 30 September 2018 Nicosia, 26 November 2018 This announcement contains inside information for the purposes of Article 7 of the Market Abuse
Preliminary Group Financial Results for the year ended 31 December 2016
 Announcement Preliminary Group Financial Results for the year ended 31 December 2016 Nicosia, 1 March 2017 Key Highlights Significant milestones achieved in January 2017: ELA full repayment, successful
Announcement. Audited Group Financial Results for the year ended 31 December Nicosia, 31 March 2016
 Announcement Audited Group Financial Results for the year ended 31 December 2015 Nicosia, 31 March 2016 Key Highlights Good progress in tackling delinquent loans; During FY2015, 90+ DPD were reduced by
Preliminary Group Financial Results for the year ended 31 December 2018
 Announcement Preliminary Group Financial Results for the year ended 31 December 2018 Nicosia, 4 March 2019 This announcement contains inside information for the purposes of Article 7 of the Market Abuse
Annual Financial Report 2015
 Annual Financial Report 2015 Annual Financial Report for the year ended 31 December 2015 Contents Page Board of Directors and Executives 1 Statement by the Members of the Board of Directors and the Company
Announcement. Group Financial Results for the six months ended 30 June Nicosia, 26 August Key Highlights
 Announcement Group Financial Results for the six months ended 30 June 2015 Nicosia, 26 August 2015 Key Highlights Improving funding structure; loans to deposits ratio (L/D) declined to 136% (138% at 31
Bank of Cyprus Group. Group Financial Results for the year ended 31 December March 2016
 Bank of Cyprus Group Group Financial Results for the year ended 31 December 2015 31 March 2016 Audited FY2015 financial results Highlights Improving Asset Quality 90+ DPD 1 down by 1,3 bn or 10% during
Bank of Cyprus Group. Group 1 Financial Results for the quarter ended 31 March May 2017
 Bank of Cyprus Group Group 1 Financial Results for the quarter ended 31 March 2017 The Group Financial Results have been neither audited nor reviewed by the Group s external auditors. They are presented
Bank of Cyprus Group. Preliminary Group Financial Results for the year ended 31 December February 2018
 Bank of Cyprus Group Preliminary Group Financial Results for the year ended 31 December 2017 The financial information included in this presentation is not audited by the Group s external auditors. This
Bank of Cyprus Group. Group 1 Financial Results for the nine months ended 30 September November 2017
 Bank of Cyprus Group Group 1 Financial Results for the nine months ended 30 September 2017 21 November 2017 Financial information included in this presentation is neither reviewed nor audited by the Group
COMMENTARY. GROUP RESULTS for the six-month period ended 30 June 2016
 COMMENTARY GROUP RESULTS for the six-month period ended 30 June 30 August TABLE OF CONTENTS Page 1. Fix and Build strategy is delivering results 3 2. Strategic targets and outlook 3-4 3. Results Overview
Group Results for the nine-month period ended 30 September 2016
 COMMENTARY Group Results for the nine-month period ended 28 November Building a stronger bank, by making further progress in our strategic priorities 9M financial performance summary Profit before provisions
Bank of Cyprus Group. Group 1 Financial Results for the six months ended 30 June August 2017
 Bank of Cyprus Group Group 1 Financial Results for the six months ended 30 June 2017 The financial information included in this presentation is neither reviewed nor audited by the Group s external auditors.
Bank of Cyprus Group. Group Financial Results for the quarter ended 31 March May 2018
 Bank of Cyprus Group Group Financial Results for the quarter ended 31 March 2018 The Group Financial Results have been neither audited nor reviewed by the Group s external auditors. This financial information
Bank of Cyprus Group. Preliminary Group 1 Financial Results for the year ended 31 December March 2017
 Bank of Cyprus Group Preliminary Group 1 Financial Results for the year ended 31 December 2016 1 March 2017 The Preliminary Group Financial Results have not been audited by the Group s external auditors
Bank of Cyprus Group. Preliminary Group Financial Results for the nine months ended 30 September November 2016
 Bank of Cyprus Group Preliminary Group Financial Results for the nine months ended 30 September 2016 15 November 2016 The Financial Statements for the nine months ended 30 September 2016 have been reviewed
Bank of Cyprus Group. Group Financial Results for the first quarter ended 31 March May 2016
 Bank of Cyprus Group Group Financial Results for the first quarter ended 31 March 2016 31 May 2016 * The Group Financial Results have been reviewed by the Group s external auditors 1Q2016 Financial Results
Bank of Cyprus Group. Group 1 Financial Results for the year ended 31 December March 2017
 Bank of Cyprus Group Group 1 Financial Results for the year ended 31 December 2016 The Group Financial Statements have been audited by the Group s external auditors 28 March 2017 (1) The Group Financial
Bank of Cyprus Group. Group Financial Results for the six months ended 30 June August Overview. Income Statement Review
 Bank of Cyprus Group Group Financial Results for the six months ended 30 June 2015 Overview Income Statement Review Balance Sheet Review KPIs Key Takeaways Additional Information 26 August 2015 1 1H2015
Bank of Cyprus Group. Preliminary Financial Results* for the year ended 31 December February 2014
 Bank of Cyprus Group Preliminary Financial Results* for the year ended 31 December 2013 Preliminary Financial Results FY2013 Highlights Income Statement Review Balance Sheet Review Restructuring Appendices
Bank of Ireland Presentation October As at 1 Oct 2014
 Bank of Ireland Presentation October 2014 As at 1 Oct 2014 1 Forward-Looking statement This document contains certain forward-looking statements within the meaning of Section 21E of the US Securities Exchange
Banking Sector Dynamics
 April 2015 Banking Sector Dynamics Issue 2 In this issue At a glance 1 Capital adequacy 2 Key banking sector indicators 3 Total assets 4 Total deposits and liabilities 6 Recent developments 8 Key events
Annual Financial Report 2014
 Annual Financial Report 2014 Annual Financial Report for the year ended 31 December 2014 Contents Page Board of Directors and Executives 1 Statement by the Members of the Board of Directors and the Company
Bank of Ireland presentation February 2015
 Bank of Ireland presentation February 2015 Forward-looking statement This document contains certain forward-looking statements within the meaning of Section 21E of the US Securities Exchange Act of 1934
Half-Yearly Financial Results 2018
 Half-Yearly Financial Results 2018 For the six months ended 30 June 2018 AIB Group plc Important information and forward looking statement This presentation should be considered with AIB s Annual Financial
Forward Looking Statements
 Forward Looking Statements This document contains certain forward-looking statements with respect to certain of the Permanent TSB Group Holdings plc s Group s (the Group ) intentions, beliefs, current
INTERIM REPORT FOR THE SIX MONTHS ENDED 30 JUNE Group Holdings plc. Group Holdings plc
 INTERIM REPORT FOR THE SIX MONTHS ENDED 30 JUNE 2018 Group Holdings plc Group Holdings plc Forward Looking Statements This document contains certain forward-looking statements with respect to certain of
Financial Information for the Period from 1 January 2014 to 30 September 2014
 Financial Information for the Period from 1 January to as stipulated by Decision 4/507/28.04.2009 of the Board of Directors of the Greek Capital Markets Commission The financial information presented below
Bank of Cyprus Holdings Public Limited Company Notice of Annual General Meeting
 THIS DOCUMENT IS IMPORTANT AND REQUIRES YOUR IMMEDIATE ATTENTION. If you are in doubt about the action you should take, you are recommended to immediately obtain your own personal financial advice from
Pillar 3 Report. For the year ended 31 December Allied Irish Banks, p.l.c
 Pillar 3 Report For the year ended 31 December 2016 Allied Irish Banks, p.l.c Important Information and Forward-Looking Statements Forward-looking statements This document contains certain forward-looking
Banking Sector. Dynamics. At a glance. Contents
 Issue 4, May 216 Banking Sector Dynamics Contents At a glance 1 Capital adequacy 2 Total assets 6 Total liabilities and deposits 8 Abbreviations 14 References 14 Definitions 14 At a glance Comfortably
Bank of Ireland Presentation November As at 3 Nov 2014
 Bank of Ireland Presentation November 2014 As at 3 Nov 2014 Forward-Looking statement This document contains certain forward-looking statements within the meaning of Section 21E of the US Securities Exchange
First Half 2017 Profit after Tax 1 at Euro 118 million
 First Half 2017 Profit after Tax 1 at Euro 118 million Main Highlights - Strong capital position with Common Equity Tier I ratio (CET 1) at 17.9%, up by 74bps q-o-q. Tangible Book Value at Euro 9 billion,
Bank of Cyprus Group. Financial Results for the nine months ended 30 September December Financial Results 9M2013 Highlights
 Bank of Cyprus Group Financial Results for the nine months ended 30 September 2013 Financial Results 9M2013 Highlights Income Statement Review Balance Sheet Review Restructuring Appendices 18 December
Bank of Ireland Presentation
 Bank of Ireland Presentation October 2013 (as at 1 Oct 2013) 1 Forward looking statement 2 Irish Economy Overview 3 Government finances ahead of target Public finances continue towards sustainability The
First Half 2018 Profit After Tax at Euro 12.3 million
 First Half 2018 Profit After Tax at Euro 12.3 million Main Highlights - Sector leading capital position with Common Equity Tier 1 ratio (CET 1) at 18.5%; Tangible Book Value at Euro 7.8 billion. - Continued
(formerly Irish Life & Permanent plc) 2012 Half Year Report
 2012 Half Year Report") (formerly Irish Life & Permanent plc) 2012 Half Year Report Six months ended 30 June 2012 Forward Looking Statements This document contains forward looking statements with respect to certain of the Group
(formerly Irish Life & Permanent plc) 2012 Half Year Report Six months ended 30 June 2012 Forward Looking Statements This document contains forward looking statements with respect to certain of the Group
Group Financial Results for the nine months ended 30 September November 2017
 Group Financial Results for the nine months ended 30 September 2017 29 November 2017 1 Highlights 9M17 Group financial results Asset quality NPEs 1) reduced for the 8 th consecutive quarter; NPEs ratio
First Quarter 2018 Profit after Tax at Euro 65.2 million
 First Quarter 2018 Profit after Tax at Euro 65.2 million Main Highlights - Strong capital position with Common Equity Tier 1 ratio (CET 1) at 18.3%; Tangible Book Value the highest among Greek banks at
Annual Financial Report 2013
 Annual Financial Report 2013 BANK OF CYPRUS GROUP Annual Financial Report for the year ended 31 December 2013 Contents Page Board of Directors and Executives 1 Statement by the Members of the Board of
12. LIQUIDITY RISK LIQUIDITY RISK MANAGEMENT AND ASSESSMENT MANAGEMENT MODEL
 12. LIQUIDITY RISK 12.1. LIQUIDITY RISK MANAGEMENT AND ASSESSMENT LIQUIDITY MANAGEMENT The BCP Group liquidity management is globally accompanied and the supervision is coordinated at a consolidated level
Annual Financial Report 2012 Annual Financial Report 2012: 1) Results Announcement 2) Results Presentation 3) Annual Financial Report 2012
 Results Announcement 2) Results Presentation 3) Annual Financial Report 2012") Annual Financial Report 2012 Annual Financial Report 2012: 1) Results Announcement 2) Results Presentation 3) Annual Financial Report 2012 0001/00004713/en Annual Financial Report BANK OF CYPRUS PUBLIC
Annual Financial Report 2012 Annual Financial Report 2012: 1) Results Announcement 2) Results Presentation 3) Annual Financial Report 2012 0001/00004713/en Annual Financial Report BANK OF CYPRUS PUBLIC
Bank of Cyprus Group. Bank of Cyprus Group 1. Bank of America Merrill Lynch Financial Conference. September 2017
 Bank of Cyprus Group 1 Bank of Cyprus Group Bank of America Merrill Lynch Financial Conference September 2017 The financial information included in this presentation is neither reviewed nor audited by
Group Financial Results for the six months ended 30 June 2014
 Bank of Cyprus Group Group Financial Results for the six months ended 30 June 2014 Share Capital Increase Income Statement Review Balance Sheet Review Loan Quality Key Performance Indicators Key Takeaways
Full Year 2017 Profit after Tax 1 at Euro 89.5 million
 Full Year 2017 Profit after Tax 1 at Euro 89.5 million Main Highlights - Strong capital position with Common Equity Tier 1 ratio (CET 1) at 18.3%; Tangible Book Value at Euro 9.2 billion, the highest among
Interim Report For the six months ended 30 June 2015
 Interim Report For the six months ended 30 June 2015 Interim Report for the six months ended 30 June 2015 Forward-Looking statement This document contains certain forward-looking statements within the
0114/ /en Half-Yearly Financial Report Alpha Bank Ltd ABCY
 0114/00020877/en Half-Yearly Financial Report Alpha Bank Ltd Financial Results of Alpha Bank Cyprus Ltd for the period from January 1 to June 30, 2017 Please find attached the announcement and financial
Group Financial Results for the year ended 31 December 2012
 Announcement Group Financial Results for the year ended 31 December 2012 Income statement highlights o Loss after tax 2.214 mn ( 1.359 mn for the year 2011) o Profit before impairments and restructuring
The Governor and Company of the Bank of Ireland Interim Report. For the six months ended 30 June 2018
 The Governor and Company of the Bank of Ireland Interim Report For the six months ended 30 June 2018 The Governor and Company of the Bank of Ireland Interim Report for the six months ended 30 June 2018
CAIXA ECONÓMICA MONTEPIO GERAL
 CAIXA ECONÓMICA MONTEPIO GERAL 2017 CONSOLIDATED RESULTS Lisbon, 8 February 2018 (Year-on-year changes, unless when stated otherwise) Unaudited financial information This document is a free translation
Group Audited Financial Results for the year ended 31 December March 2018
 Group Audited Financial Results for the year ended 31 December 2017 29 March 2018 1 Highlights FY17 Group audited financial results 2016-2017; period of significant strategic progress to strengthen the
Banking Sector. Dynamics. At a glance. Contents
 Issue 3, December 215 Banking Sector Dynamics Contents At a glance 1 Capital adequacy 2 Total assets 7 Total deposits and liabilities 9 Abbreviations 17 References 17 Definitions 17 At a glance As a result
DRAFT. Attica Bank. Q Financial Results. Together we are stronger.
 DRAFT Attica Bank Q3 2018 Financial Results Together we are stronger. www.atticabank.gr 1 Table of Contents MACROECONOMIC REVIEW HIGHLIGHTS FINANCIAL PERFORMANCE ASSET QUALITY FUNDING APPENDIX GLOSSARY
Half Year Results for the Six Months to 31 January 2019
 Close Brothers Group plc T +44 (0)20 7655 3100 10 Crown Place E enquiries@closebrothers.com London EC2A 4FT W www.closebrothers.com Registered in England No. 520241 Half Year Results for the Six Months
INTERIM FINANCIAL REPORT. For the 6 months ended 30 June plc
 INTERIM FINANCIAL REPORT For the 6 months ended 30 June 2015 plc Forward Looking Statements This document contains forward looking statements with respect to certain of the Group s plans and its current
Commenting on the performance, Bill Winters, Group Chief Executive, said:
 31 October 2018 Standard Chartered PLC - Interim Management Statement Standard Chartered PLC (the Group) today releases its Interim Management Statement for the period 30 September 2018. All figures are
Alpha Bank Group Pillar III Disclosures Report for September 30, 2018
 Alpha Bank Group Pillar III Disclosures Report for September 30, 2018 Contents 1 Introduction 3 1.1 General Information 3 1.2 Single Supervisory Mechanism (SSM) 3 1.3 2018 Stress test Results 4 2 Capital
Cyprus Economy Developments August 2018 Treasury and Correspondent Banking Department
 Cyprus Economy Developments August 2018 Treasury and Correspondent Banking Department Major recent developments in Cyprus Cyprus Macroeconomic Developments Cyprus Real GDP growth rate (seasonally adjusted)
Morgan Stanley International Limited Group
 Pillar 3 Regulatory Disclosure (UK) Morgan Stanley International Limited Group Pillar 3 Quarterly Disclosure Report as at 31 March 2018 Page 1 Pillar 3 Regulatory Disclosure (UK) Table of Contents 1: Morgan
2017 RESULTS. Presentation to analysts and investors 21 February 2018
 RESULTS Presentation to analysts and investors 21 February 2018 Full year results Introduction António Horta-Osório Group Chief Executive 1 a landmark year strong strategic and financial performance Group
Alpha Bank Group Pillar III Disclosures Report for March 31, 2018
 Alpha Bank Group Pillar III Disclosures Report for March 31, 2018 Contents 1 Introduction 3 1.1 General Information 3 1.2 Single Supervisory Mechanism (SSM) 3 1.3 2018 Stress test Results 4 2 Capital Management
Capital and Risk Management Pillar 3 Disclosures
 Capital and Risk Management Pillar 3 Disclosures For Year Ended 31 st December 2016 Contents 1. Introduction... 3 1.1 Background... 3 1.2 Scope... 3 1.3 Frequency of Disclosure... 4 2. Key Measures & Ratios...
Morgan Stanley International Limited Group
 Pillar 3 Regulatory Disclosure (UK) Morgan Stanley International Limited Group Pillar 3 Quarterly Disclosure Report as at 30 September 2018 Page 1 Pillar 3 Regulatory Disclosure (UK) Table of Contents
Interim Financial Report 2017
 Interim Financial Report 2017 ABN AMRO Bank N.V. II Notes to the reader Executive Board Report Introduction This is the Interim Financial Report for the year 2017 of ABN AMRO Bank N.V. (ABN AMRO Bank).
Bank of Cyprus Holdings Public Limited Company Annual Financial Report for the year ended 31 December 2017
 Announcement Bank of Cyprus Holdings Public Limited Company Annual Financial Report for the year ended 31 December 2017 Nicosia, 27 March 2018 This announcement contains inside information for the purposes
Cyprus: Economy Dynamics
 Cyprus: Economy Dynamics 2Q2014 September 2014 At a Glance Contents At a Glance 1 Macroeconomics Forecasts 2 The Cyprus Macroeconomic Adjustment Program (CMAP) 3 Major Challenges Persist 4 Public Finance
Unaudited Quarterly Financial Report September 30, 2017
 Unaudited Quarterly Financial Report September 30, 2017 Goldman Sachs International (unlimited company) Company Number: 02263951 UNAUDITED QUARTERLY FINANCIAL REPORT FOR THE QUARTER ENDED SEPTEMBER 30,
Preliminary Financial Results of Alpha Bank Cyprus Ltd for the year 2015 [ ]
![Preliminary Financial Results of Alpha Bank Cyprus Ltd for the year 2015 [ ]](/thumbs/90/102860682.jpg "Preliminary Financial Results of Alpha Bank Cyprus Ltd for the year 2015 [ ]") Preliminary Financial Results of Alpha Bank Cyprus Ltd for the year 2015 [29.2.2016] Main Highlights - Strong Capital Base with Common Equity Tier 1 ratio at 17.5% on 31.12.2015 - After tax losses of Euro44.7
Preliminary Financial Results of Alpha Bank Cyprus Ltd for the year 2015 [29.2.2016] Main Highlights - Strong Capital Base with Common Equity Tier 1 ratio at 17.5% on 31.12.2015 - After tax losses of Euro44.7
The Governor and Company of the Bank of Ireland Annual Report 2017
 The Governor and Company of the Bank of Ireland Annual Report 2017 The Governor and Company of the Bank of Ireland Annual Report for the year ended 31 December 2017 Forward-looking statement This document
Pre-close trading statement together with comment on National Asset Management Agency (NAMA) and Government Guarantee announcement
 and Government Guarantee announcement") Pre-close trading statement together with comment on National Asset Management Agency (NAMA) and Government Guarantee announcement 17 September 2009 Background Bank of Ireland is issuing the following
Pre-close trading statement together with comment on National Asset Management Agency (NAMA) and Government Guarantee announcement 17 September 2009 Background Bank of Ireland is issuing the following
PROSPECTUS DATE: 26 November 2014
 PROSPECTUS DATE: 26 November 2014 in compliance with the Provisions of the Commission Regulation (EC) No 809/2004 (as amended) of the European Union and the Public Offer and Prospectus Law of 2005 (as
Allied Irish Banks, p.l.c. Half-Yearly Financial Results For the 6 months ended 30 June 2014
 Allied Irish Banks, p.l.c. Half-Yearly Financial Results For the 6 months ended 30 June 2014 Important information and forward looking statement Capital Ratios In compliance with Article 26(2) of the CRR,
Pillar 3 Disclosures. For the year ended 31 December 2013
 Pillar 3 Disclosures For the year ended 31 December 2013 Forward-Looking Statement This document contains certain forward-looking statements within the meaning of Section 21E of the US Securities Exchange
Pillar 3 Report as of June 30, 2017
 Pillar 3 Report as of June 30, 2017 Content Introduction 3 Disclosures according to Pillar 3 of the Capital Framework 3 Basel 3 and CRR/CRD 4 3 ICAAP, ILAAP and SREP 4 Risk Quantification and Measurement
APRA BASEL III PILLAR 3 DISCLOSURES
 APRA BASEL III PILLAR 3 DISCLOSURES Quarter ended 31 August 2018 4 October 2018 This report has been prepared by Bank of Queensland Limited (Bank or BOQ) to meet its disclosure requirements under the Australian
Deutsche Bank. Pillar 3 Report as of March 31, 2018
 Pillar 3 Report as of March 31, 2018 Content 3 Regulatory Framework 3 Introduction 3 Basel 3 and CRR/ CRD 4 6 Capital requirements 6 Article 438 (c-f) CRR Overview of capital requirements 7 Credit risk
Preliminary Statement. for the year ended 31 December 2011
 Preliminary Statement for the year ended 31 December 2011 THIS PAGE HAS INTENTIONALLY BEEN LEFT BLANK Preliminary Statement for the year ended 31 December 2011 THIS PAGE HAS INTENTIONALLY BEEN LEFT BLANK
Sainsbury s Bank plc. Pillar 3 Disclosures for the year ended 31 December 2008
 Sainsbury s Bank plc Pillar 3 Disclosures for the year ended 2008 1 Overview 1.1 Background 1 1.2 Scope of Application 1 1.3 Frequency 1 1.4 Medium and Location for Publication 1 1.5 Verification 1 2 Risk
The figures presented do not constitute any form of commitment by BCP in regard to future earnings.
 Disclaimer The information in this presentation has been prepared under the scope of the International Financial Reporting Standards ( IFRS ) of BCP Group for the purposes of the preparation of the consolidated
Interim Financial Report. 30 June 2018
 Interim Financial Report 2018 1 Chief Executive Officer s Review I am pleased to report Leeds Building Society has delivered strong performance, financial strength and membership growth in the first half
Cyprus Economy Developments December 2018 Treasury and Correspondent Banking Department
 Cyprus Economy Developments December 2018 Treasury and Correspondent Banking Department Major recent developments in Cyprus Cyprus Macroeconomic Developments Cyprus Real GDP growth rate (seasonally adjusted)
APRA Basel III Pillar 3 Disclosures
 APRA Basel III Pillar 3 Disclosures Quarter ended 28 February 2018 17 April 2018 This report has been prepared by Bank of Queensland Limited (Bank or BOQ) to meet its disclosure requirements under the
KEY BUSINESS INDICATORS AND FINANCIAL INFORMATION
 02.2 KEY BUSINESS INDICATORS AND FINANCIAL INFORMATION AT YEAR-END 2017, BANKIA INCREASED ITS PROFIT AND MAINTAINED ITS DIVIDEND PER SHARE, AFTER THE MERGER WITH BMN. During 2017 Bankia strengthened its
Forward Looking Statements
 Forward Looking Statements This document contains forward looking statements with respect to certain of the Group s plans and its current goals and expectations relating to its future financial condition,
Chief Executive s Review. Delivering our Strategic Objectives
 2014 saw AIB successfully execute its three year plan to deliver a bank that is sustainably profitable, adequately capitalised and appropriately funded. We have a strong momentum in our business and are
Q2.2018: Recurring Pre-Provision Income at 224mn, +8% qoq, and 24mn Net Profit from Continuing Operations
 Q2.2018: Recurring Pre-Provision Income at 224mn, +8% qoq, and 24mn Net Profit from Continuing Operations Further Cleaning-up and Strengthening of the Group s Balance Sheet NPE deleverage process accelerated,
NOTE ON THE COMPREHENSIVE ASSESSMENT
 NOTE ON THE COMPREHENSIVE ASSESSMENT April 2014 1 INTRODUCTION Further progress in carrying out the comprehensive assessment of banks in the euro area has been made by the ECB, the European Banking Authority
Financial Statements Release 1 January 31 December 2017
 THE MORTGAGE SOCIETY OF FINLAND Financial Statements Release 1 January 31 December 2017 The Audited Financial Statements 2017 will be published on 1 March 2018 and The Annual Report during the week 12
3. CAPITAL ADEQUACY 3.1. REGULATORY FRAMEWORK 3.2. OWN FUNDS AND CAPITAL ADEQUACY ON 31 DECEMBER 2017 AND 2016
 3. CAPITAL ADEQUACY 3.1. REGULATORY FRAMEWORK On 26 June 2013, the European Parliament and the Council approved the Directive 2013/36/EU and the Regulation (EU) no. 575/2013 (Capital Requirements Directive
Deutsche Bank. The Group at a glance Six months ended Jun 30, 2015 Jun 30, Share price at period end Share price high 33.
 Interim Report as of June 30, 205 Deutsche Bank Deutsche Bank The Group at a glance Six months ended Jun 30, 205 Jun 30, 204 Share price at period end 26.95 25.70 Share price high 33.42 38.5 Share price
Íslandsbanki hf. CONSOLIDATED INTERIM FINANCIAL STATEMENTS 1H18. First half 2018 financial highlights. Second quarter 2018 financial highlights
 Íslandsbanki hf. CONSOLIDATED INTERIM FINANCIAL STATEMENTS 1H18 First half 2018 financial highlights Profit after tax was ISK 7.1bn (1H17: ISK 8.0bn) generating an 8.2% annualised return on equity (1H17:
Management Statement PIRAEUS BANK GROUP - H FINANCIAL RESULTS
 PIRAEUS BANK GROUP - H1.2017 FINANCIAL RESULTS Piraeus Bank recorded a profit of 7mn in Q2.2017 Accelerated Execution of Agenda 2020 Core Bank Yields 1.1% RoA in H1.2017, Group P&L at Break-even Management