VIG Top Player in Austria and CEE. Austrian Investor Day. London, 29 January 2015
|
|
|
- Emery White
- 6 years ago
- Views:
Transcription

1 VIG Top Player in Austria and CEE Austrian Investor Day London, 29 January 2015
2 Contents Development 9M 2014 Successful Strategy Long-term Potential Regional Split 9M 2014 Preliminary Premiums YE 2014 and Financials 9M 2014
3 CEE performing well A solid quarter within expectations SUMMARY Profit before taxes increased to 430.8mn up 36.4% PBT burdened by impairments done in 6M 2014 (HAA bonds and Verkehrsbüro) Strong profit growth of 9.5% in CEE to 244.4mn Net profit after minorities of 327.7mn, up by 50.7% EPS 1 increased by outstanding 65.5% to 3.26 Premiums on a like-for-like basis 2 up by 3.6% y-o-y Premium development of minus 0.2% to 7.0bn impacted by FX movements Net combined ratio down to 97.2% Reduction of 3.5pp y-o-y out of improved claims and cost ratio Total cost ratio of VIG decreased by 8.4% compared to 9M : EPS net of hybrid interest, annualised figures 2: Like-for-like excludes FX, Polish short-term endowment product (STEP), Italian business of Donau and first time consolidation of Skandia Poland and former AXA Hungary 3
4 Premiums impacted by FX movements CEE Remaining markets premiums excl. FX up by 8.9% FINANCIAL HIGHLIGHTS Gross written premiums ( mn; y-o-y chg.) -0.2% 7, Health Life 3,129 P&C 3,617 9M13 P&C Life Health Remarks 7, ,184 3,564 GWP regional split y-o-y chg. Austria 3,222 0% Czech Republic 1,281-3% Slovakia 549 0% Poland 809-4% Romania % Remaining markets 834 7% Central Functions 990-1% Consolidation % Group GWP 7,039 0% Premiums on a like-for-like basis 1 up by 3.6% y-o-y Excluding FX effects: Premiums grew 1.7% y-o-y excl. more than 130mn FX movements CEE premium growth of 1.1% despite reduction of Polish STEP GWP of Donau Italian business decreased from 136mn to 49mn (-64%) On Euro basis P&C business decreased by 1.5%, life business increased by 1.7% and health business down by 4.2% 1: Like-for-like excludes FX, Polish short-term endowment product (STEP), Italian business of Donau and first time consolidation of Skandia Poland and former AXA Hungary 4
5 Net profit after minorities up by more than 50% PBT improved out of strong P&C and health results FINANCIAL HIGHLIGHTS Profit before taxes ( mn; y-o-y change) PBT regional split % Austria 151 y-o-y chg. 11% Health Czech Republic Slovakia Poland Romania % 1% 0% n.a. Life Remaining markets Central Functions % n.a. P&C 52 Consolidation 0 n.a. 9M13 P&C Life Health Group PBT % Remarks Profit before taxes of 430.8mn includes impairments done in 6M2014 (HAA bond impairment and Austrian participation Verkehrsbüro), first-time interest expenses out of newly issued subordinated bond and FX movements PBT in CEE increased by 9.5% to 244.4mn accounting for ~57% of overall profits and further improving diversification Strong profit development in Remaining CEE markets - adjusted for FX plus 6.8% EPS 1 increased by excellent 65.5% to 3.26 supported by capital optimisation 1: EPS net of hybrid interest, annualised figures 5
6 Improved combined ratios in all regional segments Combined ratio decreased to good 97.2% FINANCIAL HIGHLIGHTS CoR development (net, %) CoR 9M y-o-y regional development (net, %) -3.5pp Claims ratio Cost ratio M13 Overall mid-term cost ratio development 1 (%) AT CZ SK PL RO Remaining Weather related claims ( mn) pp -2.4pp -0.5pp -0.4pp pp -33.1pp 9M CAGR -1.7% Gross claims -37% Net impact +4% M09 9M10 9M11 9M12 9M13 9M13 9M13 1: Cost ratio includes all business line segments (P&C, life and health) Rounding differences may occur when rounded amounts or percentages are added up. 6
7 Contents Development 9M 2014 Successful Strategy Long-term Potential Regional Split 9M 2014 Preliminary Premiums YE 2014 and Financials 9M 2014
8 Strategic cornerstones of VIG Unique and well-proven business model of VIG to continue STRATEGY Concentration on Austria and CEE Focus on insurance business Pursue local entrepreneurship Multibrand policy as distribution catalyst Strategic partnership with Erste Group Bank 8


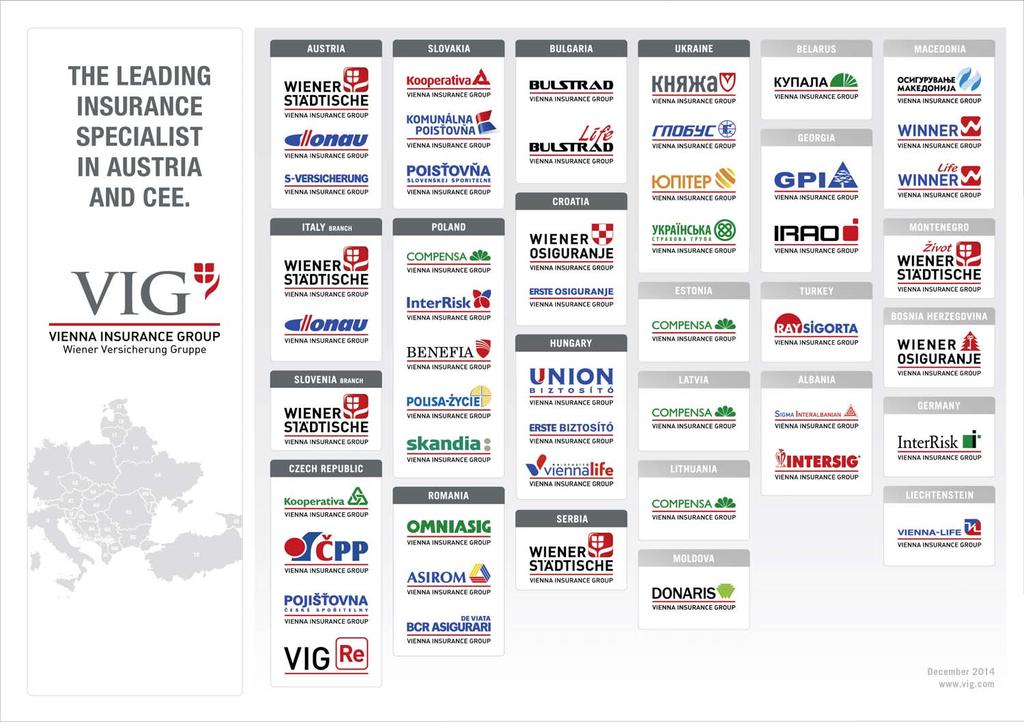
9 Dynamic Expansion into CEE out of Austria VIG with the most diversified network throughout the region STRATEGY Markets Client/talent base: 24mn people Today 25 Markets Client/talent base: 180mn people 9
10 Focus on insurance business Successful bancassurance in Austria and CEE STRATEGY Insurance business is core business of VIG Today around 50 insurance companies are part of VIG Business mix Health Customer mix SME Nearly all lines of retail and commercial business covered pension fund business being not core Focus on technical results (COR below 100%) Asset management is done with a very conservative profile to cover life and non-life reserves P&C 50% 4% 46% Life Corporate 5% 17% 78% Retail Cooperation between VIG and Erste Group VIG acquired insurance operations of Erste Group in 2008 At the same time the strategic mutual distribution agreement for 15 years plus renewal for 10 years started Today strong cooperation in 10 common markets Bank distribution is key in sale of life insurance 10
11 Local entrepreneurship as basis for success Clear commitment to local management STRATEGY Insurance business is local business Local management with best understanding of their markets and customer needs Members of the management board of VIG all have different country responsibilities and are members in the respective local Supervisory Board Close contact between local managers and the members of the board of VIG lean management structure Flexible reaction to changing market environment possible quick decision taking Local managers fully accountable for the performance of their companies Group steering Group guidelines of VIG to be strictly followed by all Group companies in terms of Asset management Reinsurance Reporting IT Security Calculation of Embedded Value and Solvency Best risk mitigation given by accountable managers selecting the right people is key 11


12 Unique market approach with long-term focus Multi-brand and multi-channel provide best access to customers STRATEGY Multi-brand Multi-channel Local brands with good customer recognition are retained Different brands target different client groups Multi-brand allows for internal benchmarking VIG pushes joint back-office activities and shared services within the markets <10% 11% - 20% 21% - 30% 31% - 40% > 41% Austria Tied agents Banks Brokers/Agents 1 2 Other Regular appraisal of brand efficiency otherwise merger of companies Czech Rep. Slovakia Romania Poland Hungary Croatia Others Multi-brand and multi-channel are paramount for VIG 1: Non-exclusive agents 2: Direct marketing, leasing, car dealers 12

13 Excellent market positions of VIG VIG the clear No 1 in its core markets STRATEGY Total market share AT 24.5% CZ 33.5% SK 33.6% PL 8.9% RO 18.2% BG 13.7% HR 8.1% RS 9.7% UA 4.2% HU 7.3% Source: local insurance authorities; data as of 3Q14 13
14 VIG strengthens its market position Very strong market share of 19% in its core markets STRATEGY 20% 17,9% 18,0% 19,4% 18,4% 19.0% VIG No.1 15% Italian competitor 10% Austrian competitor German competitor 5% Q 10' Q 11' Q 12' Q 13' Q 14' VIG almost twice as big as peers in its core markets Source: local market reports; market shares according to current composition of insurance groups (ex-post analysis); data as of 3Q14; 14
15 Adaptive growth policy (I) CEE growth potentials develop in a step function STRATEGY VIG Strategy: Elevate potential in changing market phases through adaptive growth policy Market growth Recovery stage Growth stage Time Accelerated growth - Accelerate growth in all business lines - Aggressive sales Differentiated growth - Consolidation of high margin business - Risk selection/revision of low margin business - Cost management 15
16 Adaptive growth policy (II) Elevate growth potentials correspondingly STRATEGY VIG Strategy: Elevate potential also during recovery phases through differentiated growth policies Market growth Recovery stage VIG Strategy Consolidation of high margin business Growth stage SME Push non-motor business Unit-linked life insurance Risk selection/revision of low margin business Time Selektive underwriting BG, RO Descending motor fleet PL Reduction STEP PL Accelerated growth Differentiated growth Cost management Reduction administrative costs 16
17 Contents Development 9M 2014 Successful Strategy Long-term Potential Regional Split 9M 2014 Preliminary Premiums YE 2014 and Financials 9M 2014
18 Insurance growth is a catching-up process Model of insurance demand development still valid POTENTIAL Insurance density in EUR AT AT CZ PL SK HU CZ PL HU SK RO 0 RO 1.000, , ,0 GDP per capita in EUR GDP growth and catch-up process are insurance drivers Source: Swiss Re Sigma, IMF 18
19 Striking under-penetration shows potential Annual premiums per capita (insurance density), in EUR POTENTIAL 2,713 9x Life 1,954 Non-life Ø EU-15 AT Ø CEE CZ SK PL HR HU BG RO SR UA Long-term growth potential in CEE still lies ahead Source: Local insurance authorities; IMF; Swiss Re Sigma ; CEE: weighted average of CEE core markets; Data as of year-end


20 CEE offers access to long-term growth potential Presence in more mature markets as well as in high growth countries POTENTIAL Core region Population ~ 34 mn Ø-premium per capita 794 EUR Ø-premium per capita in AT 1,954 EUR Contribution to GWP ~ 73% Growth region Population ~ 119 mn Ø-premium per capita 171 EUR Contribution to GWP ~ 19% Balkan region Population ~ 25 mn Ø-premium per capita 172 EUR Contribution to GWP ~ 2% Data as of YE

21 Fundamental indicators for motor business in CEE Number of registered cars in CEE shows motor under-penetration POTENTIAL Age of registered cars in VIG countries 1 Number of registered cars per 1000 inhabitants 2 2% 4% 4% 6% 7% 9% 18% 17% 23% 7% 8% 4% 7% 7% 11% 13% 18% 17% 19% 22% 20% 28% 26% 32% 14% 19% 31% 73% 72% 64% 60% 59% 50% 50% 42% 37% BH 2010 PL 2011 RS 2010 CZ 2011 TR 2010 RO 2011 HR 2011 HU 2010 AT 2012 < or = 2yrs 2 > or = 5yrs 5 > or = 10yrs > 10yrs Twofold opportunity: catch-up in motor penetration creates MTPL demand and exchange of old vehicles increases potential for Casco insurance Potential of additional 10mn vehicles to be insured when only motor penetration in CZ, SK, PL and RO reach current level of AT Extraordinary market positions and broad distribution network will help VIG to make best use of future market developments Source: 1: for Slovakia no data available, 2: wiiw.at, unece.org, 21


22 Macroeconomic upswing in VIG markets Promising macro data for the years to come POTENTIAL Improving macro data of regions where VIG operates in Positive Remains constant Negative PL RO GDP Inflation Unemployment GDP per capita Investments Savings rate Export Budget balance Government debt Account balance : Source: IMF: World economic outlook database, October
23 Contents Development 9M 2014 Successful Strategy Long-term Potential Regional Split 9M 2014 Preliminary Premiums YE 2014 and Financials 9M 2014
24 Austria - burdened by Italy and impairments in 2014 Premiums in P&C up 3.8% excl. Italian business of Donau REGIONAL SPLIT GWP for 9M 2014 ( mn) P&C GWP direct business split 1-0.2% P&C 3,229 1,524 3,222 1,490 MTPL 19% (23%) Health Life ,438 1,457 Remaining 67% (63%) 14% (13%) Casco 9M13 P&L: P&C business ( mn) P&L: Life business ( mn) Y-o-Y Y-o-Y Underwriting and financial result % Other non-technical result 2.6 n.a. Result (pre tax) 58.6 >100% Underwriting and financial result % Other non-technical result -2.1 n.a. Result (pre tax) % Claims ratio 73.4% -1.5pp Cost ratio 27.4% -0.9pp Combined ratio 100.8% -2.4pp 1: Figures in brackets referring to previous year Rounding differences may occur when rounded amounts or percentages are added up. 24
25 Czech Republic excellent combined ratio GWPs adjusted for negative FX effects up by 3.8% REGIONAL SPLIT GWP for 9M 2014 ( mn) P&C GWP direct business split 1-2.8% P&C 1,318 1, Remaining 48% (51%) 31% (29%) MTPL Life M13 21% (20%) Casco P&L: P&C business ( mn) P&L: Life business ( mn) Y-o-Y Y-o-Y Underwriting and financial result % Other non-technical result -7.6 >100%. Result (pre tax) % Underwriting and financial result % Other non-technical result 1.8 n.a. Result (pre tax) % Claims ratio 61.5% -6.1pp Cost ratio 27.3% 1.0pp Combined ratio 88.8% -5.1pp 1: Figures in brackets referring to previous year Rounding differences may occur when rounded amounts or percentages are added up. 25
26 Slovakia solid profit contribution Good profit development in P&C REGIONAL SPLIT GWP for 9M 2014 ( mn) P&C GWP direct business split % P&C Remaining 34% (32%) 40% (41%) MTPL Life % (27%) 9M13 Casco P&L: P&C business ( mn) P&L: Life business ( mn) Y-o-Y Y-o-Y Underwriting and financial result Other non-technical result 3.3 n.a. Result (pre tax) % Underwriting and financial result % Other non-technical result % Result (pre tax) % Claims ratio 53.5% -1.3pp Cost ratio 39.6% 0.8pp Combined ratio 93.1% -0.5pp 1: Figures in brackets referring to previous year Rounding differences may occur when rounded amounts or percentages are added up. 26
27 Poland pressure in motor ongoing Increase in non-motor business with a CAGR (9M12-14) of 8.2% REGIONAL SPLIT GWP for 9M 2014 ( mn) P&C GWP direct business split 1-3.7% P&C Remaining 43% (42%) 32% (33%) MTPL Life % (25%) 9M13 Casco P&L: P&C business ( mn) P&L: Life business ( mn) Y-o-Y Y-o-Y Underwriting and financial result % Other non-technical result -0.4 n.a. Result (pre tax) % Underwriting and financial result % Other non-technical result 1.1 n.a. Result (pre tax) % Claims ratio 56.2% -4.2pp Cost ratio 38.4% 3.8pp Combined ratio 94.6% 0.4pp 1: Figures in brackets referring to previous year Rounding differences may occur when rounded amounts or percentages are added up. 27
28 Romania positive signs on the MTPL market Regulator supports substantial changes for motor as of REGIONAL SPLIT GWP for 9M 2014 ( mn) P&C GWP direct business split % P&C Remaining 32% (36%) 38% (29%) MTPL Life % (35%) 9M13 Casco P&L: P&C business ( mn) P&L: Life business ( mn) Y-o-Y Y-o-Y Underwriting and financial result % Other non-technical result 0.0 n.a. Result (pre tax) % Underwriting and financial result 5.0 n.a. Other non-technical result 0.1 n.a. Result (pre tax) 5.1 n.a. Claims ratio 66.6% -34.6pp Cost ratio 42.7% 1.5pp Combined ratio 109.3% -33.1pp 1: Figures in brackets referring to previous year Rounding differences may occur when rounded amounts or percentages are added up. 28
29 Remaining markets premiums excl. FX up 12.7% Strong combined ratio of below 97% REGIONAL SPLIT GWP for 9M 2014 ( mn) P&C GWP direct business split % P&C Health Life Remaining MTPL 23% (21%) 58% (57%) 19% (22%) Casco 9M13 P&L: P&C business ( mn) P&L: Life business ( mn) Y-o-Y Y-o-Y Underwriting and financial result % Other non-technical result -1.1 n.a. Result (pre tax) % Underwriting and financial result % Other non-technical result -5.2 >100% Result (pre tax) % Claims ratio 58.9% 4.0pp Cost ratio 37.9% -4.7pp Combined ratio 96.8% -0.7pp 1: Figures in brackets referring to previous year Rounding differences may occur when rounded amounts or percentages are added up. 29
30 Contents Development 9M 2014 Successful Strategy Long-term Potential Regional Split 9M 2014 Preliminary Premiums YE 2014 and Financials 9M 2014
31 Preliminary YE 2014 premium developments Direct premiums (unconsolidated, unaudited) of EUR 9.4bn APPENDIX Premium development ( mn; y-o-y change) Premium split regional ( mn) Health Life P&C -0.1% 9, , ,207 4,267 4,782 4,721 y-o-y chg. Austria 4, % Czech Republic 1, % Slovakia % Poland 1, % Romania % Remaining markets 1, % Central Functions % 12M13 P&C Life Health 12M14 Group GWP 12M14 9, % Remarks Robust premium development despite negative FX impact Organic growth of 2.6% excluding special effects P&C premiums slightly down by 1.3% due to FX effects (EUR -105mn) and the reduction of the Italian business of Donau Versicherung (EUR -96mn) Life premium increase of 1.4% in spite of reduction of Polish short-term endowment business Remaining markets segment continues to grow substantially by 10.0% Rounding differences may occur when rounded amounts or percentages are added up. 31
32 Preliminary YE 2014 premiums per country Direct premiums (unconsolidated, unaudited) in EURmn APPENDIX mn GWP P&C GWP Life GWP Health GWP Total YE 2014 YE /- % YE 2014 YE /- % YE 2014 YE /- % YE 2014 YE /- % Austria 1, , , , , , Czech Rep. 1, , , , Slovakia Poland , , Romania Remaining , , Hungary Croatia Serbia Bulgaria Bosnia&Herz Ukraine Turkey Baltics Albania Georgia Montenegro Macedonia Liechtenstein Germany Belarus Central Functions Total 4, , , , , , Note: Albania is including Kosovo Rounding differences may occur when rounded amounts or percentages are added up. 32
33 9M 2014 Income statement IFRS ( mn) APPENDIX mn 9M M /-% Gross premiums written 7, , Net earned premiums 6, , Financial result Other income Total income 7, , Expenses for claims and insurance benefits -5, , Acquisition and administrative expenses -1, , Other expenses Total expenses -6, , Profit before taxes Taxes Net profit (Profit for the period) Non-controlling interests Net profit after non-controlling interests : Incl. result from shares in at equity consolidated companies 33
34 9M 2014 Balance sheet IFRS ( mn) APPENDIX mn /-% Intangible assets 2,366 2, Investments 30,162 29, Unit- and index-linked investments 7,694 6, Reinsurers share in underwriting provisions 1,109 1, Receivables 1,510 1, Tax receivables and advance payments out of income tax Deferred tax assets Other assets Cash and cash equivalents Total assets 44,265 41, Shareholders equity 5,452 5, thereof minorities Subordinated liabilities 1,022 1, Underwriting provisions 27,713 25, Unit- and index-linked technical provisions 7,309 6, Non-underwriting provisions Liabilities 1,659 2, Tax liabilites out of income tax Deferred tax liabilities Other liabilities Total liabilities and equity 44,265 41,
35 9M 2014 P&L Property & Casualty IFRS ( mn) APPENDIX mn 9M M /-% Gross premiums written 3, , Net earned premiums 2, , Financial result Other income Total income 3, , Expenses for claims and insurance benefits -1, , Acquisition and administrative expenses Other expenses Total expenses -2, , Profit before taxes >100 Rounding differences may occur when rounded amounts or percentages are added up. 35
36 9M 2014 P&L Life IFRS ( mn) APPENDIX mn 9M M /-% Gross premiums written 3, , Net earned premiums 3, , Financial result Other income Total income 3, , Expenses for claims and insurance benefits -3, , Acquisition and administrative expenses Other expenses Total expenses -3, , Profit before taxes Rounding differences may occur when rounded amounts or percentages are added up. 36
37 9M 2014 P&L Health IFRS ( mn) APPENDIX mn 9M M /-% Gross premiums written Net earned premiums Financial result >100 Other income >100 Total income Expenses for claims and insurance benefits Acquisition and administrative expenses Other expenses Total expenses Profit before taxes Rounding differences may occur when rounded amounts or percentages are added up. 37
38 9M 2014 Financial result decreased by 5.4% Impact of impairments of Hypo Alpe Adria bonds and Verkehrsbüro APPENDIX Income P&C Life Health Total in '000 9M M M M M M M M 2013 Current income 208, , , ,688 32,906 30, , ,390 Income from appreciations 19,880 14,158 12,639 23, ,193 37,894 Income from the disposal of investments 60,295 40, , , , , ,780 Other income 26,047 5,056 39,063 28, ,157 33,813 Total Income 314, , , ,938 34,582 31,407 1,155,092 1,183,877 Expenses P&C Life Health Total in '000 9M M M M M M M M 2013 Depreciation of investments 19,063 38,742 24,175 31,814 1,850 2,846 45,088 73,402 Impairment of investments 16,082 5,194 27,611 9, ,077 44,162 25,279 Exchange rate changes -5,250 4,076-12,331-1, ,024 2,336 Losses from the disposal of investments 13,594 12,354 22,794 16, ,240 36,739 32,925 Interest expenses 42,394 28,628 14,615 16, ,526 57,667 46,950 Other expenses 82,584 59,242 58,816 47,631 4,001 3, , ,867 Total Expenses 1 168, , , ,747 6,887 23, , ,759 Total Financial Result 146, , , ,191 27,695 7, , ,118 Note: Financial result incl. result from shares in at equity consolidated companies 38
39 9M 2014 Investment split Well diversified bond portfolio APPENDIX 9M 2014: Total 31.1bn Bond portfolio by rating 1 6.8% 3.5% 0.0% Other BBB A 6% 5% 12% 12% 38% 38% 10.2% AA 28% 30% 5.8% AAA 16% 15% 3.6% 12M 2013 Bond portfolio by issuer 9M % Corporates 13% 14% Financials 23% 21% Pfandbriefe/ Covered bonds 9% 9% Bonds Equities Real Estate Loans Affiliated Comp. Alternatives Deposits and Cash Government 2 55% 56% 12M M : Based on second best rating 2: Government, government guaranteed and gov.agencies Rounding differences may occur when rounded amounts or percentages are added up. 39
40 9M 2014 Strong equity and solvency position Shareholders equity increase driven by profit and unrealised gains APPENDIX Change in Group shareholders equity ( mn) +9% 5, ,452 Equity as of YE 2013 Profit for the period Currency changes AFS unrealised gains and losses Changes in consolidation Dividend payment IAS19 At equity Equity as of 9M 2014 Strong solvency 1 ratio of 295% Available capital 5,226 Required capital 700 1, ,774 Solvency 1 Ratio: 295% P&C Life Health Rounding differences may occur when rounded amounts or percentages are added up. 40
41 9M 2014 Key financials Overview APPENDIX Net profit after minorities ( mn) Combined ratio (net, %) M12 9M M12 9M13 EPS 1 ( ) ROE before taxes (%) M12 9M M12 9M13 1: EPS net of hybrid interest, annualised figures Rounding differences may occur when rounded amounts or percentages are added up. 41
42 9M 2014 Gross written premiums by region Flat premiums y-o-y impacted by FX effects APPENDIX mn GWP P&C GWP Life GWP Health GWP Total 9M M /-% 9M M /-% 9M M /-% 9M M /-% Austria 1, , % 1, , % % 3, , % Czech Rep % % , , % Slovakia % % % Poland % % % Romania % % % Remaining % % % % Austria: solid development; growth of 2.6% excl. Italian business of Donau Czech Republic: excluding FX effects: - premiums overall up 3.8% - strong growth in life by 9.7% - slight decrease of 1.6% in P&C Slovakia: stable development Poland: STEP is driver for decrease; life premiums up 7.5% excl. first time consolidation of Skandia and excl. Benefia Life Romania: strong decrease in life driven by sales stop of Employee Benefit Product Remaining markets: premium development impacted by currency effects; excl. FX overall premiums up by 12.7%; health business decrease in Georgia due to termination of a national health programme Rounding differences may occur when rounded amounts or percentages are added up. 42
43 9M 2014 P&L Split by regions (I) Regional markets overview, IFRS ( mn) APPENDIX mn Austria Czech Republic Slovakia 9M M /-% 9M M /-% 9M M /-% Gross premiums written 3, , , , Net earned premiums 2, , , , Financial result Other income > Total income 3, , , , Expenses for claims/benefits -2, , Acquisition and administrative expenses Other expenses Total expenses -3, , , , Profit before taxes Combined Ratio 100.8% 103.2% 88.8% 93.8% 93.1% 93.5% Rounding differences may occur when rounded amounts or percentages are added up. 43
44 9M 2014 P&L Split by regions (II) Regional markets overview, IFRS ( mn) APPENDIX mn Poland Romania Remaining 9M M /-% 9M M /-% 9M M /-% Gross premiums written Net earned premiums Financial result Other income Total income Expenses for claims/benefits Acquisition and administrative expenses Other expenses Total expenses Profit before taxes n.a Combined Ratio 94.6% 95.0% 109.3% 142.4% 96.8% 97.5% Rounding differences may occur when rounded amounts or percentages are added up. 44
45 9M 2014 P&L Split by regions (III) Regional markets overview, IFRS ( mn) APPENDIX mn Central Functions Consolidation TOTAL 9M M /-% 9M M /-% 9M M /-% Gross premiums written n.a. 7, , Net earned premiums n.a. 6, , Financial result n.a n.a Other income n.a Total income n.a. 7, , Expenses for claims/benefits n.a. -5, , Acquisition and administrative expenses n.a. -1, , Other expenses n.a Total expenses n.a. -6, , Profit before taxes n.a n.a Combined Ratio 97.2% 100.6% Rounding differences may occur when rounded amounts or percentages are added up. 45
46 9M 2014 Results by country (I) IFRS ( mn) APPENDIX mn GWP P&C GWP Life GWP Health GWP Total 9M M /-% 9M M /-% 9M M /-% 9M M /-% Austria 1, , % 1, , % % 3, , % Czech Rep % % , , % Slovakia % % % Poland % % % Romania % % % Remaining % % % % Hungary % % % Croatia % % % Serbia % % % Bulgaria % % % Bosnia&Herz % % % Uk raine % % % Turkey % % Georgia % % % Baltics % % Albania % % Macedonia % % % Liechtenstein % % Germany % % % Rounding differences may occur when rounded amounts or percentages are added up. 46
47 9M 2014 Results by country (II) IFRS ( mn) APPENDIX mn Profit before Taxes Net Combined Ratio 9M M /-% 9M M /-pp Austria % 100.8% 103.2% -2.4 Czech Rep % 88.8% 93.8% -5.1 Slovakia % 93.1% 93.5% -0.5 Poland % 94.6% 95.0% -0.4 Romania n.a % 142.4% Remaining % 96.8% 97.5% -0.7 Hungary % 107.0% 105.9% 1.1 Croatia % 99.8% 96.1% 3.7 Serbia % 90.7% 103.3% Bulgaria % 99.4% 99.6% -0.2 Bosnia&Herz >100% 172.8% 94.1% 78.7 Uk raine % 99.7% 103.9% -4.2 Turk ey % 100.6% 102.6% -2.0 Georgia % 72.7% 63.3% 9.4 Baltics % Albania % 90.0% 92.0% -2.0 Macedonia % 91.9% 89.7% 2.1 Liechtenstein % Germany % 83.1% 84.6% -1.5 Rounding differences may occur when rounded amounts or percentages are added up. 47
48 9M 2014 P&C Claims and cost ratio details APPENDIX Claims ratio 9M y-o-y regional development (net, %) Remarks for claims incurred 9M AT CZ SK PL RO Remaining Austria: claims ratio down 1.5pp driven by Donau Versicherung (in 9M 2013 reserve strengthening for Italian branch office business) Czech Republic: decrease of 6.1pp due to reduced natcat impact in 9M 2014 compared to last year Slovakia: claims ratio decreased to 53.5% Poland: decrease in claims due to shift to non-motor and disciplined motor underwriting Romania: claims ratio down to 66.6% as a result of taken restructuring measures last year Remaining markets: claims ratio up by 4.0pp due to local natcat events (especially in Bosnia) Cost ratio 9M y-o-y regional development (net, %) Remarks for acquisition and admin. expenses 9M Austria and Slovakia with rather stable cost ratios Czech Republic: cost ratio up 1.0pp Poland: cost ratio up 3.8pp due to higher commissions Romania: cost ratio only slightly increased to 42.7% - restructuring ongoing Remaining markets: cost ratio decreased to 37.9%, improving the COR for the remaining markets to 96.8% AT CZ SK PL RO Remaining Note: Change y-o-y is in percentage points Rounding differences may occur when rounded amounts or percentages are added up. 48
49 9M 2014 Life insurance premium split IFRS ( mn) APPENDIX Premiums written - direct business 9M M /- % Regular premiums 1,728 1, % Single premiums 1,444 1, % Total premiums written - direct business 3,172 3, % thereof: Policies with profit participation 1,368 1, % Policies without profit participation % unit linked life insurance 1,170 1, % index linked life insurance % 49
50 Q Income Statement IFRS ( mn) APPENDIX mn Q Q /-% Gross premiums written 2, , Net earned premiums 2, , Financial result Other income Total income 2, , Expenses for claims and insurance benefits -1, , Acquisition and administrative expenses Other expenses Total expenses -2, , Profit before taxes Taxes Net profit (Profit for the period) Minorities Net profit after non-controlling interests
51 9M 2014 Exchange rates APPENDIX 9M M 2013 Country Curr. Balance Sheet EUR P & L EUR Balance Sheet EUR P & L EUR Albania EUR/ALL Belarus EUR/BYR 13, , , , Bosnia EUR/BAM Bulgaria EUR/BGN Croatia EUR/HRK Czech Republic EUR/CZK Georgia EUR/GEL Hungary EUR/HUF Latvia EUR/LVL Liechtenstein EUR/CHF Lithuania EUR/LTL Macedonia EUR/MKD Moldova EUR/MDL Poland EUR/PLN Romania EUR/RON Serbia EUR/RSD Turkey EUR/TRY Ukraine EUR/UAH
52 Dividend of 1.30 per share for 2013 Stable dividend policy APPENDIX Dividend per share ( ) Dividend pay out ( mn) 8% Dividend policy Unchanged dividend policy with a pay-out ratio of minimum 30% of Group net profit Based on solid operating performance and strong capitalisation of VIG the management proposed an increase of the dividend per share to 1.30 (+ 0.10) Dividend yield of 3.6% 1 1: based on share price as of 30 Dec
53 VIG Share (I) APPENDIX Current analyst recommendation split Share price development 12M 2014 Sell Buy High EUR Low EUR Price as of 30 Dec. EUR Average daily volume EUR 3.0 mn Market cap. EUR 4.7 bn Development YTD % 2.4 Hold VIG compared to ATX and MSCI Europe Insurance Jan-14 Feb-14 Mar-14 Apr-14 May-14 Jun-14 Jul-14 Aug-14 Sep-14 Oct-14 Nov-14 Dec-14 VIG ATX MSCI Indexed 01 Jan-14 (Basis = 100) 53
54 VIG Share (II) APPENDIX General information Shareholder structure Number of common shares: 128mn ISIN: AT Listings: Vienna since 17 Oct Prague since 5 Feb Trading symbols: Vienna Stock Exchange: VIG Bloomberg: VIG AV / VIG CP Reuters: VIGR.VI / VIGR.PR Rating: Standard & Poor s: A+, stable outlook Major Indices: ATX, ATX Prime, PX, EURO STOXX Insurance, STOXX Europe 600 Insurance, MSCI Insurance Europe Wiener Städtische Wechselseitiger Versicherungsverein - Vermögensverwaltung Vienna Insurance Group ~70 % Free float split by region 1 Remaining Continental Europe ~26% ~9% ~21% UK & Ireland ~20% Austria ~24% Free Float ~30 % North America 1) Split of identified shares as of June
55 Contact details Investor Relations APPENDIX Financial calendar 2015 Investor Relations Team Date 27 Jan Event Publication: Preliminary unconsolidated premiums 2014 Vienna Insurance Group Schottenring 30, 1010 Vienna April 2015 Results and Embedded Value May 2015 Results for the first quarter May 2015 Annual General Meeting 03 June 2015 Ex-dividend-day 08 June 2015 Dividend payment day 25 Aug Results for the first half-year Nov Results for the first three quarters 2015 Nina Higatzberger (Head of IR) Tel. +43 (0) Claudia Hartl Tel. +43 (0) Emir Halilović Tel. +43 (0) Daniela Lemmel-Seedorf Tel. +43 (0)
56
57 Disclaimer IMPORTANT NOTICE These materials do not constitute or form part, or all, of any offer or invitation to sell or issue, or any solicitation of any offer to purchase or subscribe for, any securities in any jurisdiction in which such solicitation, offer or sale would be unlawful, nor shall part, or all, of these materials form the basis of, or be relied on in connection with, any contract or investment decision in relation to any securities. These materials contain forward-looking statements based on the currently held beliefs and assumptions of the management of VIENNA INSURANCE GROUP AG Wiener Versicherung Gruppe ( VIG ), which are expressed in good faith and, in their opinion, reasonable. These statements may be identified by words such as expectation or target and similar expressions, or by their context. Forward-looking statements involve known and unknown risks, uncertainties and other factors, which may cause the actual results, financial condition, performance, or achievements of VIG, or results of the insurance industry generally, to differ materially from the results, financial condition, performance or achievements express or implied by such forwardlooking statements. Given these risks, uncertainties and other factors, recipients of this document are cautioned not to place undue reliance on these forward-looking statements. VIG disclaims any obligation to update these forward-looking statements to reflect future events or developments.
3M 2014 Results Presentation
 3M 2014 Results Presentation Conference call for the results of the first quarter 2014 Vienna, 27 May 2014 Presenting team and topics Presenting team Martin Simhandl, CFO Peter Höfinger, Member of the
VIG Top Player in Austria and CEE. Austrian & CEE Investor Conference. New York, 24 November 2014
 VIG Top Player in Austria and CEE Austrian & CEE Investor Conference New York, 24 November 2014 Contents Development 9M 2014 Successful Strategy Long-term Potential Regional Split 9M 2014 Financials 9M
Vienna Insurance Group 3M 2017 Results Presentation
 Vienna Insurance Group 3M 2017 Results Presentation Vienna, 23 May 2017 3M 2017 Results conference call Presenting team and topics Presenting team: Martin Simhandl, CFO Roland Gröll, Member of the Managing
Vienna Insurance Group Investor Presentation
 Vienna Insurance Group Investor Presentation August 2016 Development 6M 2016 Successful strategy Long-term potential Segments Appendix Overview of the 6M 2016 results Business development in line with
Vienna Insurance Group Investor Presentation
 Vienna Insurance Group Investor Presentation Institutional Investor Conference Zurs, 12 April 2016 New CEO Elisabeth Stadler with expanded management team Elisabeth Stadler, CEO Judit Havasi Roland Gröll
VIG Top Player in Austria and CEE. Austrian Conference Baader Bank Wiener Börse. London, 5 June 2013
 VIG Top Player in Austria and CEE Austrian Conference Baader Bank Wiener Börse London, 5 June 2013 Contents Overview 3M 2013 Successful Strategy Long-term Potential Financials as of 3M 2013 2 Results 3M
9M 2018 RESULTS PRESENTATION. Vienna, 28 November 2018
 9M 2018 RESULTS PRESENTATION Vienna, 28 November 2018 9M 2018 RESULTS CONFERENCE CALL Presenting team and topics Attending Members of the Board Topics Liane Hirner, CFO Judit Havasi Peter Höfinger Financials
VIENNA INSURANCE GROUP
 Investor Presentation Results for the first quarter 2018 THE LEADING INSURANCE GROUP IN AUSTRIA & CEE Close to 200 years of experience Around 50 Group companies Represented in 25 markets More than 50%
Vienna Insurance Group Investor Presentation
 Vienna Insurance Group Investor Presentation Zürs, 29 March 2017 Agenda 2020 12M 2016 Preliminary results Please note: All information for the financial year 2016 is based on preliminary unaudited data.
Vienna Insurance Group Investor Presentation
 Vienna Insurance Group Investor Presentation Results for the first three quarters 2017 Vienna Insurance Group Present Close to Operates about A+ with stable outlook in 25 countries 200 years of experience
Vienna Insurance Group 6M 2017 Results Presentation
 Vienna Insurance Group 6M 2017 Results Presentation Vienna, 22 August 2017 6M 2017 Results conference call Presenting team and topics Presenting team: Elisabeth Stadler, CEO Martin Simhandl, CFO Judit
VIENNA INSURANCE GROUP
 Investor Presentation Full-year results 2017 THE LEADING INSURANCE GROUP IN AUSTRIA & CEE Close to 200 years of experience Around 50 Group companies Represented in 25 markets More than 55% of premiums
3M 2018 RESULTS PRESENTATION. Vienna, 23 May 2018
 3M 2018 RESULTS PRESENTATION Vienna, 23 May 2018 3M 2018 RESULTS CONFERENCE CALL Presenting team and topics Presenting team Topics Liane Hirner, incoming CFO Judit Havasi, Member of the Board Peter Höfinger,
2017 PRELIMINARY RESULTS PRESENTATION. Vienna, 22 March 2018
 2017 PRELIMINARY RESULTS PRESENTATION Vienna, 22 March 2018 2017 PRELIMINARY RESULTS CONFERENCE CALL Presenting team and topics Presenting team Topics Elisabeth Stadler, CEO Martin Simhandl, CFO Werner
6M 2018 RESULTS PRESENTATION. Vienna, 28 August 2018
 6M 2018 RESULTS PRESENTATION Vienna, 28 August 2018 6M 2018 RESULTS CONFERENCE CALL Presenting team and topics Attending Members of the Board Topics Elisabeth Stadler, CEO Liane Hirner, CFO Judit Havasi
VIG CEE success story. Roadshow Paris. 13 April 2012
 VIG CEE success story Roadshow Paris 13 April 2012 Contents VIG in 2011 VIG in 2011 CEE potential VIG s performance Summary 2 YE 2011 Performance Indicators VIG in 2011 PBT up by 10.1% to 559.0 mn Premiums
VIENNA INSURANCE GROUP
 German Corporate Conference Frankfurt, 23 January 2019 THE LEADING INSURANCE GROUP IN AUSTRIA & CEE Close to 200 years of experience Around 50 Group companies Represented in 25 markets More than 50% of
Vienna Insurance Group Focused on Growth in CEE and Austria. CA-IB Emerging Europe Conference, 19/20 March, 2007
 Vienna Insurance Group Focused on Growth in CEE and Austria CA-IB Emerging Europe Conference, 19/20 March, 2007 Vienna Insurance Group Focused on Growth in CEE and Austria 2 Leading Austrian insurance
Vienna Insurance Group Focused on Growth in CEE and Austria. Kitzbühel Conference January 25, 2007
 Vienna Insurance Group Focused on Growth in CEE and Austria Kitzbühel Conference January 25, 2007 Vienna Insurance Group Focused on Growth in CEE and Austria 2 Leading Austrian insurance group operating
VIENNA INSURANCE GROUP
 Investor Presentation Half-year results 2018 THE LEADING INSURANCE GROUP IN AUSTRIA & CEE Close to 200 years of experience Around 50 Group companies Represented in 25 markets More than 50% of premiums
Getting in shape for economic recovery in CEE. Roadshow Madrid & Paris June 2010
 Getting in shape for economic recovery in CEE Roadshow Madrid & Paris 9 10 June 2010 Contents V.I.G. a model expansion V.I.G. a model expansion Adopting to a changing environment Distribution is key in
STRONG RESULT INCREASE IN THE FIRST THREE QUARTERS OF 2014
 18 November 2014 STRONG RESULT INCREASE IN THE FIRST THREE QUARTERS OF 2014 Profit increases 36.4% to EUR 430.8 million Earnings per share grow by 65.5% to EUR 3.26 Premiums stable at around EUR 7.0 billion
Combined ratio improved; Consolidated profit increased to EUR 243.3m
 UNIQA Insurance Group AG FY18 Preliminary Results Combined ratio improved; Consolidated profit increased to EUR 243.3m 21 February 2019 Andreas Brandstetter, CEO Kurt Svoboda, CFO/CRO, CEO UNIQA Austria
Increased earnings before tax despite lower investment result driven by improved underwriting result
 UNIQA Insurance Group AG 9M17 Results Increased earnings before tax despite lower investment result driven by improved underwriting result 16 November 2017 Andreas Brandstetter, CEO Kurt Svoboda, CFO/CRO
PRESS CONFERENCE Development of Vienna Insurance Group in the first half year 2012
 PRESS CONFERENCE Development of Vienna Insurance Group in the first half year 2012 Vienna, 22 August 2012 Development 2001-2011 Double-digit growth in premium AND profit in the last 10 years Premium development
PROFIT BEFORE TAXES BURDENED BY IMPAIRMENT OF IT SYSTEMS
 No. 16/2015 23 November 2015 VIENNA INSURANCE GROUP 1 st TO 3 rd QUARTER 2015: ALL MARKETS PROVIDE POSITIVE OPERATING RESULTS PROFIT BEFORE TAXES BURDENED BY IMPAIRMENT OF IT SYSTEMS Premiums (excluding
Press Conference. VIENNA INSURANCE GROUP 2016 Preliminary Results. Based on preliminary unaudited data. Vienna, 23 March 2017
 Press Conference VIENNA INSURANCE GROUP 2016 Preliminary Results Based on preliminary unaudited data Vienna, 23 March 2017 Vienna Insurance Group A reliable partner in times of dynamic change HIGHLIGHTS
Group premiums increased by 7.1 percent to EUR 6.5 billion. Profit (before taxes) rose by 10.9 percent to EUR million
 rose by 10.9 percent to EUR million") 9 November 2010 Vienna Insurance Group in the 1 st to 3 rd quarter of 2010 Group premiums increased by 7.1 percent to EUR 6.5 billion Profit (before taxes) rose by 10.9 percent to EUR 377.7 million Continuing
9 November 2010 Vienna Insurance Group in the 1 st to 3 rd quarter of 2010 Group premiums increased by 7.1 percent to EUR 6.5 billion Profit (before taxes) rose by 10.9 percent to EUR 377.7 million Continuing
Press talk. Development Vienna Insurance Group FY Wien, 29. März 2012
 1 Press talk Development Vienna Insurance Group FY 2011 Wien, 29. März 2012 Development FY2011 Excellent development in difficult economic environment Best result in company history 8.9 bn. Euro premium
Vienna Insurance Group reports stable development in the first half of 2009: Group premiums significantly above EUR 4 billion
 20 August 2009 Vienna Insurance Group reports stable development in the first half of 2009: Group premiums significantly above EUR 4 billion Profit (before taxes) of about EUR 230 million Double-digit
Vienna Insurance Group in the first half-year of 2010: Group premiums increased by approx. 8 percent to EUR 4.6 billion
 19 August 2010 Vienna Insurance Group in the first half-year of 2010: Group premiums increased by approx. 8 percent to EUR 4.6 billion Despite significant storm damages, profit (before taxes) rose by 11
UNIQA Insurance Group AG FY17 Preliminary Results. FY17 results right on target
 UNIQA Insurance Group AG FY17 Preliminary Results FY17 results right on target 28 February 2018 Andreas Brandstetter, CEO Kurt Svoboda, CFO/CRO, CEO UNIQA Austria FY17 Highlights Group Strategy & Results
Vienna Insurance Group reaps successes of its CEE strategy Definite improvement in all preliminary figures for 2017
 22 March 2018 Vienna Insurance Group reaps successes of its CEE strategy Definite improvement in all preliminary figures for 2017 Premiums increased to around EUR 9.4 billion (+3.7 percent) Profit (before
2016 preliminary results for Vienna Insurance Group 1 Profit more than doubled
 23 March 2017 2016 preliminary results for Vienna Insurance Group 1 Profit more than doubled Premiums increased to around EUR 9.1 billion Profit (before taxes) more than doubled to around EUR 407 million
OUTSTANDING RATING OF A+ WITH STABLE OUTLOOK CONFIRMED
 No. 15/2014 26 August 2014 TOP PERFORMANCE IN FIRST HALF-YEAR OF 2014 OUTSTANDING RATING OF A+ WITH STABLE OUTLOOK CONFIRMED Profit increased by 41.4% to EUR 290.9 million Premiums stable at around EUR
The Vienna Insurance Group in the 1st quarter of 2007:
 14 May 2007 Please note: this is a translation; only the German version of this release is legally binding. The Vienna Insurance Group in the 1st quarter of 2007: Profit (before taxes) boosted by 38 percent
VIG A Top Player in the CEE region. Roadshow London, 17 September 2008
 VIG A Top Player in the CEE region Roadshow London, 17 September 2008 Contents A 2 A B C D E F VIG on a steady path of growth Growth potential in CEE Exploiting the potential recent acquisition VIG strategy
Vienna Insurance Group reaps successes of its CEE strategy Definite improvement in all preliminary figures for 2017
 No. 06/2018 22 March 2018 Vienna Insurance Group reaps successes of its CEE strategy Definite improvement in all preliminary figures for 2017 Premiums increased to around EUR 9.4 billion (+3.7 percent)
VIG A Top Insurance Player in CEE. UniCredit Annual Emerging Europe Conference Istanbul, 4-5 September 2008
 VIG A Top Insurance Player in CEE UniCredit Annual Emerging Europe Conference Istanbul, 4-5 September 2008 Contents A 2 A B C D E F Investment proposition Growth potential in CEE and Austria Exploiting
PRESS CONFERENCE. Development of Vienna Insurance Group in 1 st -3 rd Quarter Vienna, 27 November 2012
 PRESS CONFERENCE Development of Vienna Insurance Group in 1 st -3 rd Quarter 2012 Vienna, 27 November 2012 Market shares: VIG coremarket 1-6 2012 VIG strenghtens its market position in its core markets
Vienna Insurance Group in the first three quarters of 2017: Results improve again positive developments in all important key figures
 29 November 2017 Vienna Insurance Group in the first three quarters of 2017: Results improve again positive developments in all important key figures Premiums rise around 3 percent to EUR 7,153 million
Sustainable increase in earnings: Vienna Insurance Group in the first half-year of Group premiums up 3.1 percent at over EUR 4.
 No. 16/2011 18 August 2011 Sustainable increase in earnings: Vienna Insurance Group in the first half-year of 2011 Group premiums up 3.1 percent at over EUR 4.7 billion Continuing upward trend in life
Vienna Insurance Group is staying on course in the 1st quarter of 2011: Group premiums went up by 2.9 percent to more than EUR 2.
 No. 12/2011 17 May 2011 Vienna Insurance Group is staying on course in the 1st quarter of 2011: Group premiums went up by 2.9 percent to more than EUR 2.6 billion Increase in profit (before taxes) by 7.0
WHAT UNITES US? CONFIDENCE IN THE FUTURE
 WHAT UNITES US? CONFIDENCE IN THE FUTURE Press Conference Vienna Insurance Group Annual result 2013 Vienna, 10 th April 2014 With Moldova last country to be covered in CEE Acquisition of Donaris completed
Please note: this is a translation; only the German version of this news release is legally binding.
 May 22, 2006 Please note: this is a translation; only the German version of this news release is legally binding. Vienna Insurance Group (Wiener Städtische Group) during the first three months of 2006
Improved underwriting result mainly driven by continued reduction of operating expenses
 UNIQA Insurance Group AG 1H14 Improved underwriting result mainly driven by continued reduction of operating expenses 27 Aug 2014 Hannes Bogner, CFO Kurt Svoboda, CRO 1H14 Highlights Group Strategy & Results
VIG Becoming the No. 1 Insurer in CEE. Goldman Sachs Annual European Financials Conference London - June 11, 2008
 VIG Becoming the No. 1 Insurer in CEE Goldman Sachs nnual European Financials Conference London - June 11, 2008 Contents 2 B C D VIG on a steady path of growth Growth potential in CEE and ustria Exploiting
Vienna Insurance Group right on track in the first half of 2018 Clear improvement in all key figures
 Vienna Insurance Group right on track in the first half of 2018 Clear improvement in all key figures No. 24/2018 28 August 2018 Premiums rise by +3.6 percent to around EUR 5.2 billion Result (before taxes)
TWO THOUCEEND AND FIFTEEN
 TWO THOUCEEND AND FIFTEEN ANNUAL FINANCIAL REPORT 2015 VIENNA INSURANCE GROUP pursuant to 82 sec. 4 of the Austrian Stock Exchange Act Table of contents GROUP MANAGEMENT REPORT 003 Group management report
The Vienna Insurance Group in the 1st half of 2007:
 21 August 2007 Please note: this is a translation; only the German version of this release is legally binding. The Vienna Insurance Group in the 1st half of 2007: Clear expansion of market positions in
Geschäftsentwicklung 2010 Vienna Insurance Group
 Geschäftsentwicklung 2010 Vienna Insurance Group 20 th Annual General Meeting VIENNA INSURANCE GROUP AG Wiener Versicherung Gruppe Vienna, May 6 th 2011 Business development 2010 Vienna Insurance Group
Vienna Insurance Group in 2010 in accordance with IFRS: Group premiums raised by 7.2 percent to EUR 8.6 billion
 No. 08/2011 31 March 2011 Vienna Insurance Group in 2010 in accordance with IFRS: Group premiums raised by 7.2 percent to EUR 8.6 billion Profit (before taxes): clear increase by 15.1 percent to EUR 507.8
Vienna Insurance Group (Wiener Städtische Group) Preliminary IFRS Figures for :
 Preliminary IFRS Figures for :") 4 April 2006 Please note: this is a translation; only the German version of this news release is legally binding. The Embedded Value will be published on 4 May 2006 according to the financial calender.
4 April 2006 Please note: this is a translation; only the German version of this news release is legally binding. The Embedded Value will be published on 4 May 2006 according to the financial calender.
Please note: this is a translation; only the German version of this news release is legally binding.
 August 22, 2006 Please note: this is a translation; only the German version of this news release is legally binding. Vienna Insurance Group (Wiener Städtische Group) in the first half of 2006 (IFRS figures):
UNIQA Group Austria Highlights First Nine Months 2006
 UNIQA Group Austria Highlights First Nine Months 2006 Hannes Bogner, CFO Roadshow Geneva, Frankfurt December 5 & 6, 2006 p. 2 Shareholder Structure UNIQA Versicherungen AG Raiffeisen Banking Group 38,91%
Contents. Investment proposition. Growth potential in CEE and Austria. Business initiatives. Reinforced performance
 V.I.G. A Solid Ship in a Stormy Market Prague Roadshow 07 April 2009 Disclaimer 2 This information does not represent an offer or invitation to purchase securities of WIENER STÄDTISCHE Versicherung AG
PROTECTING WHAT MATTERS.
 PROTECTING WHAT MATTERS. June 2018 CORPORATE PRESENTATION OVERVIEW WELCOME TO! We are the leading insurance group in Austria, Central and Eastern Europe. Around 50 Group companies Represented in 25 markets
Macroeconomic overview SEE and Macedonia
 Macroeconomic overview SEE and Macedonia Zoltan Arokszallasi Chief Analyst, Macro & FX/FI Research Erste Group Bank Erste Investors Breakfast, 29 September, Skopje 02. Oktober SEE shows mixed performance
RECORD RESULT OF VIENNA INSURANCE GROUP IN Profit before taxes increased by 5.1 percent to EUR million
 No. 03/2013 3 April 2013 RECORD RESULT OF VIENNA INSURANCE GROUP IN 2012 Highest profit in the corporate history Profit before taxes increased by 5.1 percent to EUR 587.4 million Profit (after taxes and
BANKING IN CEE: adequate risk appetite crucial to win the upside
 BANKING IN CEE: adequate risk appetite crucial to win the upside UniCredit Group CEE Strategic Analysis Vienna, November 9, 2009 Executive Summary 1 World economic growth is recovering and this boosts
Vienna Insurance Group (Wiener Städtische Group) during the first nine months 2006 (IFRS figures):
 during the first nine months 2006 (IFRS figures):") 22 November 2006 Please note: this is a translation; only the German version of this news release is legally binding. Vienna Insurance Group (Wiener Städtische Group) during the first nine months 2006
22 November 2006 Please note: this is a translation; only the German version of this news release is legally binding. Vienna Insurance Group (Wiener Städtische Group) during the first nine months 2006
VIENNA INSURANCE GROUP IN THE FIRST HALF-YEAR OF 2013: Operating result increases sharply to EUR million (+9.5 percent)
") No. 11/2013 29 August 2013 VIENNA INSURANCE GROUP IN THE FIRST HALF-YEAR OF 2013: Operating result increases sharply to EUR 330.7 million (+9.5 percent) Profit before taxes amounts to EUR 205.7 million
No. 11/2013 29 August 2013 VIENNA INSURANCE GROUP IN THE FIRST HALF-YEAR OF 2013: Operating result increases sharply to EUR 330.7 million (+9.5 percent) Profit before taxes amounts to EUR 205.7 million
UNIQA Insurance Group AG 9M16 Results. On track to meet targets in November 2016 Andreas Brandstetter, CEO Kurt Svoboda, CFO/CRO
 UNIQA Insurance Group AG 9M16 Results On track to meet targets in 2016 24 November 2016 Andreas Brandstetter, CEO Kurt Svoboda, CFO/CRO 9M16 Highlights Group Strategy & Results Group Results Outlook Appendix:
TWO THOUCEEND AND FIFTEEN
 TWO THOUCEEND AND FIFTEEN Group Annual Report 2015 Vienna Insurance Group with supplement THE SAFE SIDE 2015 Get informed and be on If a VIG newspaper is not included, email us at info@vig.com and we will
Morgan Stanley Annual European Financials Conference
 Morgan Stanley Annual European Financials Conference March 2015, London Erste Group Transforming business models: digital, regulation and macro challenges Gernot Mittendorfer, CFO Erste Group Disclaimer
Erste Group Bank AG H results presentation 30 July 2010, Vienna
 Erste Group Bank AG H1 2010 results presentation, Vienna Andreas Treichl, Chief Executive Officer Manfred Wimmer, Chief Financial Officer Bernhard Spalt, Chief Risk Officer Erste Group business snapshot
Record profit from ordinary activities due to improved Combined Ratio and strong contribution from Health business
 UNIQA Insurance Group AG FY15 IFRS Preliminary Results Record profit from ordinary activities due to improved Combined Ratio and strong contribution from Health business 10 March 2016 Andreas Brandstetter,
Net profit raises to EUR 496.3m driven by strong operating profit and lower risk costs
 Erste Group Bank AG H1 2011 results presentation, Vienna Net profit raises to EUR 496.3m driven by strong operating profit and lower risk costs Andreas Treichl, Chief Executive Officer Franz Hochstrasser,
SEE macroeconomic outlook Recovery gains traction, fiscal discipline improving. Alen Kovac, Chief Economist EBC May 2016 Ljubljana
 SEE macroeconomic outlook Recovery gains traction, fiscal discipline improving Alen Kovac, Chief Economist EBC May 216 Ljubljana Real economy highlights Recent GDP track record reveals more favorable footprint
UNIQA Insurance Group AG
 UNIQA Insurance Group AG Investor Presentation Michael Oplustil, Head of Investor Relations Madrid, 03.10.2018. Key Financial Indicators Earnings per share (EUR) Regulatory and Economic Capital Position
6 th Capital Markets Day 12 December 2008, Vienna
 , Vienna An in-depth look at assets and asset quality Bernhard Spalt, Chief Risk Officer Presentation topics Analysing customer loans Overview CEE loan book in detail Real estate loans in detail Non-performing
Strategy and Positioning in Emerging Europe Gerhard Randa Member of the Board of Managing Directors. Berlin, September 16, 2003
 Strategy and Positioning in Emerging Europe Gerhard Randa Member of the Board of Managing Directors Berlin, September 16, 2003 Sustained financial turnaround and consistent execution of 2003 transformation
AUSTRIA + CEE = VIG. Half year financial report 2017 Vienna Insurance Group
 AUSTRIA + CEE = VIG Half year financial report 2017 Vienna Insurance Group Letter from the Chairwoman of the Managing Board Dear Shareholders, Ladies and Gentlemen! The positive start achieved by Vienna
Welcome to the Annual General Meeting of Raiffeisen International Bank-Holding AG
 Welcome to the Annual General Meeting of Raiffeisen International Bank-Holding AG Agenda Item One Presentation of the adopted financial statements and the management report and of the consolidated financial
RESPONSIBLE AND SAFE. Interim report 1 st 3 rd quarter 2015 Vienna Insurance Group
 RESPONSIBLE AND SAFE Interim report 1 st 3 rd quarter 2015 Vienna Insurance Group Letter from the chairman of the Managing Board Dear Shareholders, ladies and gentlemen! We are living in extremely turbulent
Investor presentation Europe roadshow September 2012
 Europe roadshow Manfred Wimmer Chief Financial Officer and Chief Performance Officer Thomas Sommerauer Head of Group Investor Relations Christian Reiss Head of Debt Capital Markets Disclaimer Cautionary
CONFERENCE CALL FOR THE FIRST QUARTER REPORT 2009 HERBERT STEPIC CEO MARTIN GRÜLL CFO
 CONFERENCE CALL FOR THE FIRST QUARTER REPORT 2009 HERBERT STEPIC CEO MARTIN GRÜLL CFO 14 May 2009 Main Developments Managing the Crisis Outlook Financials Risk Management Appendix Main Developments HERBERT
Retail Banking - Building a Growth Machine. By Aris Bogdaneris Board Member RI Group. The Current Environment. Slide 1. Slide 2
 Retail Banking Building a Growth Machine By Aris Bogdaneris Board Member RI Group Slide 1 Capital Markets Day, September 2008 The Current Environment Slide 2 Capital Markets Day, September 2008 Investor
FIRST QUARTER REPORT 2018 / UNIQA GROUP. Spot on.
 FIRST QUARTER REPORT 2018 / UNIQA GROUP Spot on. 2 Consolidated Key Figures 1 3/2018 1 3/2017 Change Premiums written 1,460.4 1,385.8 + 5.4 % Savings portions from unit-linked and index-linked life insurance
Erste Group Bank AG Annual results 2012
 Erste Group Bank AG Annual results 2012 Andreas Treichl, Chief Executive Officer Manfred Wimmer, Chief Financial Officer Gernot Mittendorfer, Chief Risk Officer Presentation topics Erste Group s development
Slovakia: Eurozone country with high growth potential
 Erste Group 8 th Capital Markets Day, Jozef Síkela, CEO, Slovenská sporiteľňa Disclaimer Cautionary note regarding forward-looking statements THE INFORMATION CONTAINED IN THIS DOCUMENT HAS NOT BEEN INDEPENDENTLY
FDI in Central, East and Southeast Europe: Recovery amid Stabilising Economic Growth
 Wiener Institut für Internationale Wirtschaftsvergleiche The Vienna Institute for International Economic Studies www.wiiw.ac.at wiiw FDI Report 217 FDI in Central, East and Southeast Europe: Recovery amid
POTENCEEAL. Half year financial report 2016 Vienna Insurance Group
 POTENCEEAL Half year financial report 2016 Vienna Insurance Group Letter from the Chair of the Managing Board Dear Shareholders, Ladies and Gentlemen! Vienna Insurance Group (VIG) has been focusing on
FDI in Central, East and Southeast Europe: Declines due to Disinvestment
 Wiener Institut für Internationale Wirtschaftsvergleiche The Vienna Institute for International Economic Studies www.wiiw.ac.at wiiw FDI Report 218 FDI in Central, East and Southeast Europe: Declines due
What unites us? Our regional roots.
 HALF YEAR FINANCIAL REPORT 2014 VIENNA INSURANCE GROUP What unites us? Our regional roots. Letter from the chairman of the Managing Board Dear Shareholders, ladies and gentlemen! The positive trend at
ERSTE GROUP. Morgan Stanley European Banks & Financials Conference London, 2 April Increasing the focus. Andreas Treichl, CEO, Erste Group
 Morgan Stanley European Banks & Financials Conference London, Andreas Treichl, CEO, Erste Group Disclaimer Cautionary note regarding forward-looking statements THE INFORMATION CONTAINED IN THIS DOCUMENT
New wiiw forecast for Central, East and Southeast Europe, Riding the global growth wave
 Wiener Institut für Internationale Wirtschaftsvergleiche The Vienna Institute for International Economic Studies wiiw.ac.at wiiw Spring Seminar, 12 April 218 New wiiw forecast for Central, East and Southeast
International Financial Market Indicators Short-Term Interest Rates Long-Term Interest Rates Stock Indices Corporate Bond Spreads
 International Financial Market Indicators Short-Term Interest Rates Long-Term Interest Rates Stock Indices Corporate Bond Spreads Table A A A3 A4 Financial Indicators of the Austrian Corporate and Household
Riding the global growth wave. Richard Grieveson. Press conference, 13 March New wiiw forecast for Central, East and Southeast Europe,
 Wiener Institut für Internationale Wirtschaftsvergleiche The Vienna Institute for International Economic Studies wiiw.ac.at Press conference, 13 March 2018 New wiiw forecast for Central, East and Southeast
Annex of Tables. Cutoff date for data: November 18, 2011
 Anne of Tables International Environment Echange Rates Key Interest Rates Short-Term Interest Rates Long-Term Interest Rates Corporate Bond Spreads Stock Indices Gross Domestic Product Current Account
UNIQA Group Austria Highlights First Half Year 2006
 UNIQA Group Austria Highlights First Half Year 2006 Hannes Bogner, CFO Investor conference Erste Bank Stegersbach September 29, 2006 2 Shareholder Structure UNIQA Versicherungen AG Raiffeisen Banking Group
> Erste Bank - Strategy and execution
 > Erste Bank - Strategy and execution > Morgan Stanley - Pan European Banks Conference London, 21 24 March 2006 > Andreas Treichl, CEO > Presentation topics 1. Consistent strategy 2. Strong execution track
Central and Eastern Europe: Global spillovers and external vulnerabilities
 Central and Eastern Europe: Central and Eastern Europe: Global spillovers and external vulnerabilities ICEG Annual Conference Brussels, May 28 Christoph Rosenberg International Monetary Fund Overview The
HALF-YEAR FINANCIAL REPORT 2014 / UNIQA GROUP. Deliver.
 HALF-YEAR FINANCIAL REPORT 2014 / UNIQA GROUP Deliver. 2 GROUP KEY FIGURES Group Key Figures Figures in million 1 6/2014 1 6/2013 Change Premiums written 2,856.2 2,725.2 + 4.8 % Savings portion from unit-
Nomura Austrian Conference Tokyo, 31 January Erste Group Strong operating income and strict cost control
 Nomura Austrian Conference, 31 January 211 Erste Group Strong operating income and strict cost control Thomas Sommerauer, Head of Group Investor Relations Disclaimer Cautionary note regarding forward-looking
> Erste Bank. on course for full year targets. > Q Results Roadshow. > November 2004
 > Erste Bank on course for full year targets > > > Table of Contents Hosts Presentation Appendix Andreas Treichl, CEO Reinhard Ortner, CFO Jack Stack, CEO of Ceska sporitelna Gabriele Werzer, Head of IR
> Erste Bank - A Financial Franchise in Central Europe
 > Erste Bank - A Financial Franchise in Central Europe > > > Andreas Treichl, CEO > Presentation topics 1. Erste Bank Where we are now 2. Why did we move eastwards? 3. Outlook and targets 4. Appendix 2
Wiener Städtische Versicherung AG Vienna Insurance Group
 Wiener Städtische Versicherung AG Vienna Insurance Group Supplementary information on the Group Embedded Value results for 2007 1. Introduction The Wiener Städtische Versicherung AG Vienna Insurance Group
UniCredit International Investors Conference January 2008, Kitzbühel
 UniCredit International Investors Conference 20-22 January 2008, Kitzbühel Operating in a challenging environment Gabriele Werzer, Head of IR, Erste Group Disclaimer Cautionary note regarding forward-looking
BANKING IN CEE. Carlo Vivaldi CFO UniCredit Bank Austria
 BANKING IN CEE Carlo Vivaldi CFO UniCredit Bank Austria Brussels, November 10, 2009 EU Parliament Committee on the Financial, Economic and Social Crisis Executive Summary Macroeconomic and Global Banking