|
|
|
- Theresa Copeland
- 6 years ago
- Views:
Transcription
1
2
3
4
5
6
7
8
9
10
11
12
13
14
15
16
17
18
19
20
21
22 SEARCHABLE FORMAT
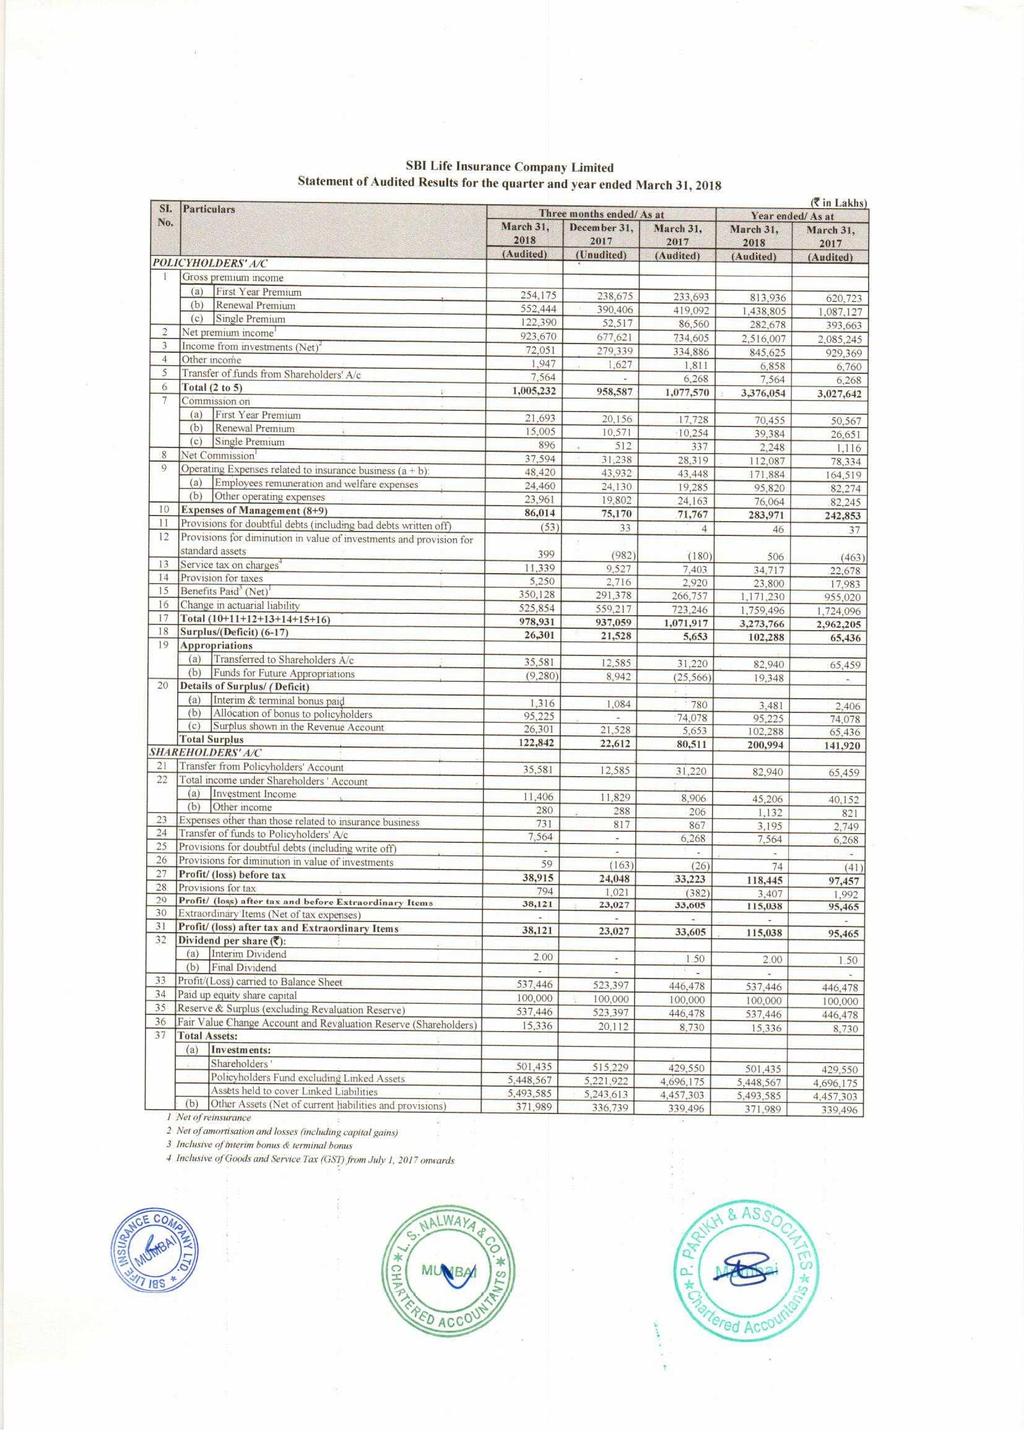
23 SI. No. (` in Lakhs) Three months ended/ As at Year ended/ As at March 31, 2018 December 31, 2017 March 31, 2017 March 31, 2018 March 31, 2017 (Audited) (Unudited) (Audited) (Audited) (Audited) 1 Gross premium income (a) First Year Premium 254, , , , ,723 (b) Renewal Premium 552, , ,092 1,438,805 1,087,127 (c) Single Premium 122,390 52,517 86, , ,663 2 Net premium income 1 923, , ,605 2,516,007 2,085,245 3 Income from investments (Net) 2 72, , , , ,369 4 Other income 1,947 1,627 1,811 6,858 6,760 5 Transfer of funds from Shareholders' A/c 7,564-6,268 7,564 6,268 6 Total (2 to 5) 1,005, ,587 1,077,570 3,376,054 3,027,642 7 Commission on (a) First Year Premium 21,693 20,156 17,728 70,455 50,567 (b) Renewal Premium 15,005 10,571 10,254 39,384 26,651 (c) Single Premium ,248 1,116 8 Net Commission 1 37,594 31,238 28, ,087 78,334 9 Operating Expenses related to insurance business (a + b): 48,420 43,932 43, , ,519 (a) Employees remuneration and welfare expenses 24,460 24,130 19,285 95,820 82,274 (b) Other operating expenses 23,961 19,802 24,163 76,064 82, Expenses of Management (8+9) 86,014 75,170 71, , , Provisions for doubtful debts (including bad debts written off) (53) Provisions for diminution in value of investments and provision for standard assets 399 (982) (180) 506 (463) 13 Service tax on charges 4 11,339 9,527 7,403 34,717 22, Provision for taxes 5,250 2,716 2,920 23,800 17, Benefits Paid 3 (Net) 1 350, , ,757 1,171, , Change in actuarial liability 525, , ,246 1,759,496 1,724, Total ( ) 978, ,059 1,071,917 3,273,766 2,962, Surplus/(Deficit) (6-17) 26,301 21,528 5, ,288 65, Appropriations (a) Transferred to Shareholders A/c 35,581 12,585 31,220 82,940 65,459 (b) Funds for Future Appropriations (9,280) 8,942 (25,566) 19, Details of Surplus/ ( Deficit) (a) Interim & terminal bonus paid 1,316 1, ,481 2,406 (b) Allocation of bonus to policyholders 95,225-74,078 95,225 74,078 (c) Surplus shown in the Revenue Account 26,301 21,528 5, ,288 65,436 Total Surplus 122,842 22,612 80, , ,920 SHAREHOLDERS' A/C 21 Transfer from Policyholders' Account 35,581 12,585 31,220 82,940 65, Total income under Shareholders ' Account (a) Investment Income 11,406 11,829 8,906 45,206 40,152 (b) Other income , Expenses other than those related to insurance business ,195 2, Transfer of funds to Policyholders' A/c 7,564-6,268 7,564 6, Provisions for doubtful debts (including write off) Provisions for diminution in value of investments 59 (163) (26) 74 (41) 27 Profit/ (loss) before tax 38,915 24,048 33, ,445 97, Provisions for tax 794 1,021 (382) 3,407 1, Profit/ (loss) after tax and before Extraordinary Items 38,121 23,027 33, ,038 95, Extraordinary Items (Net of tax expenses) Profit/ (loss) after tax and Extraordinary Items 38,121 23,027 33, ,038 95, Dividend per share (`): (a) Interim Dividend (b) Final Dividend Profit/(Loss) carried to Balance Sheet 537, , , , , Paid up equity share capital 100, , , , , Reserve & Surplus (excluding Revaluation Reserve) 537, , , , , Fair Value Change Account and Revaluation Reserve (Shareholders) 15,336 20,112 8,730 15,336 8, Particulars POLICYHOLDERS' A/C 37 Total Assets: (a) SBI Life Insurance Company Limited Statement of Audited Results for the quarter and year ended March 31, 2018 Investments: Shareholders ' 501, , , , ,550 Policyholders Fund excluding Linked Assets 5,448,567 5,221,922 4,696,175 5,448,567 4,696,175 Assets held to cover Linked Liabilities 5,493,585 5,243,613 4,457,303 5,493,585 4,457,303 (b) Other Assets (Net of current liabilities and provisions) 371, , , , ,496 Net of reinsurance Net of amortisation and losses (including capital gains) Inclusive of interim bonus & terminal bonus Inclusive of Goods and Service Tax (GST) from July 1, 2017 onwards
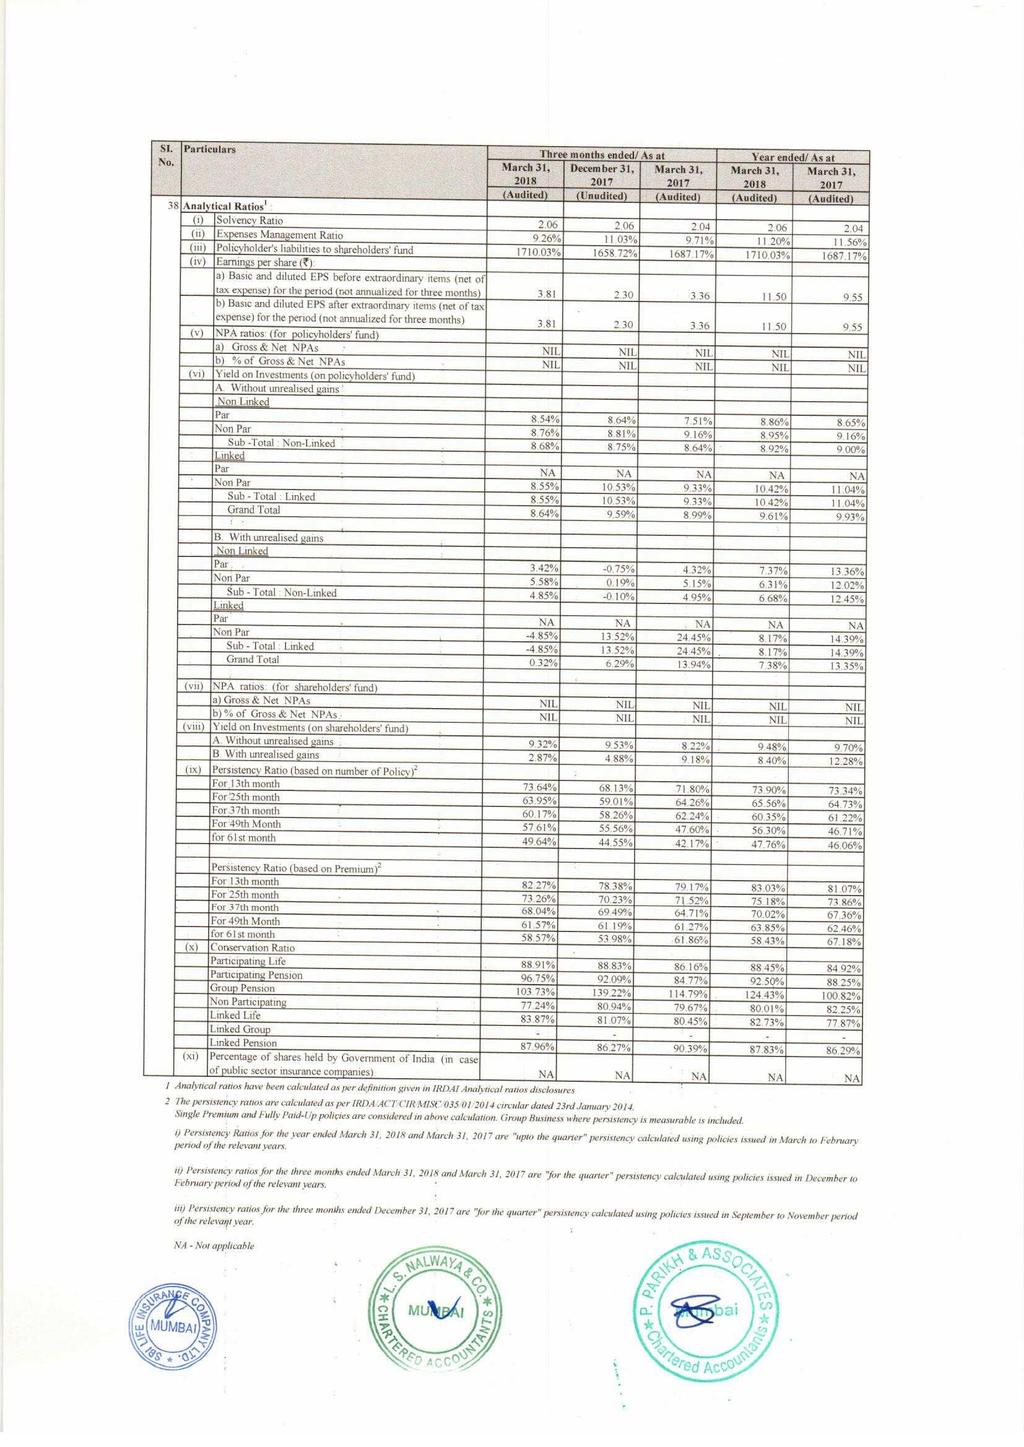
24 SI. No. Particulars Three months ended/ As at Year ended/ As at March 31, 2018 December 31, 2017 March 31, 2017 March 31, 2018 March 31, 2017 (Audited) (Unudited) (Audited) (Audited) (Audited) 38 Analytical Ratios 1 : (i) Solvency Ratio (ii) Expenses Management Ratio 9.26% 11.03% 9.71% 11.20% 11.56% (iii) Policyholder's liabilities to shareholders' fund % % % % % (iv) Earnings per share (`): a) Basic and diluted EPS before extraordinary items (net of tax expense) for the period (not annualized for three months) b) Basic and diluted EPS after extraordinary items (net of tax expense) for the period (not annualized for three months) (v) NPA ratios: (for policyholders' fund) a) Gross & Net NPAs NIL NIL NIL NIL NIL b) % of Gross & Net NPAs NIL NIL NIL NIL NIL (vi) Yield on Investments (on policyholders' fund) A. Without unrealised gains Non Linked Par 8.54% 8.64% 7.51% 8.86% 8.65% Non Par 8.76% 8.81% 9.16% 8.95% 9.16% Sub -Total : Non-Linked 8.68% 8.75% 8.64% 8.92% 9.00% Linked Par NA NA NA NA NA Non Par 8.55% 10.53% 9.33% 10.42% 11.04% Sub - Total : Linked 8.55% 10.53% 9.33% 10.42% 11.04% Grand Total 8.64% 9.59% 8.99% 9.61% 9.93% 1 2 B. With unrealised gains Non Linked Par 3.42% -0.75% 4.32% 7.37% 13.36% Non Par 5.58% 0.19% 5.15% 6.31% 12.02% Sub - Total : Non-Linked 4.85% -0.10% 4.95% 6.68% 12.45% Linked Par NA NA NA NA NA Non Par -4.85% 13.52% 24.45% 8.17% 14.39% Sub - Total : Linked -4.85% 13.52% 24.45% 8.17% 14.39% Grand Total 0.32% 6.29% 13.94% 7.38% 13.35% (vii) NPA ratios: (for shareholders' fund) a) Gross & Net NPAs NIL NIL NIL NIL NIL b) % of Gross & Net NPAs NIL NIL NIL NIL NIL (viii) Yield on Investments (on shareholders' fund) A. Without unrealised gains 9.32% 9.53% 8.22% 9.48% 9.70% B. With unrealised gains 2.87% 4.88% 9.18% 8.40% 12.28% (ix) Persistency Ratio (based on number of Policy) 2 For 13th month 73.64% 68.13% 71.80% 73.90% 73.34% For 25th month 63.95% 59.01% 64.26% 65.56% 64.73% For 37th month 60.17% 58.26% 62.24% 60.35% 61.22% For 49th Month 57.61% 55.56% 47.60% 56.30% 46.71% for 61st month 49.64% 44.55% 42.17% 47.76% 46.06% (x) (xi) Persistency Ratio (based on Premium) 2 For 13th month 82.27% 78.38% 79.17% 83.03% 81.07% For 25th month 73.26% 70.23% 71.52% 75.18% 73.86% For 37th month 68.04% 69.49% 64.71% 70.02% 67.36% For 49th Month 61.57% 61.19% 61.27% 63.85% 62.46% for 61st month 58.57% 53.98% 61.86% 58.43% 67.18% Conservation Ratio Participating Life 88.91% 88.83% 86.16% 88.45% 84.92% Participating Pension 96.75% 92.09% 84.77% 92.50% 88.25% Group Pension % % % % % Non Participating 77.24% 80.94% 79.67% 80.01% 82.25% Linked Life 83.87% 81.07% 80.45% 82.73% 77.87% Linked Group Linked Pension 87.96% 86.27% 90.39% 87.83% 86.29% Percentage of shares held by Government of India (in case of public sector insurance companies) NA NA NA NA NA Analytical ratios have been calculated as per definition given in IRDAI Analytical ratios disclosures The persistency ratios are calculated as per IRDA/ACT/CIR/MISC/035/01/2014 circular dated 23rd January Single Premium and Fully Paid-Up policies are considered in above calculation. Group Business where persistency is measurable is included. i) Persistency Ratios for the year ended March 31, 2018 and March 31, 2017 are "upto the quarter" persistency calculated using policies issued in March to February period of the relevant years. ii) Persistency ratios for the three months ended March 31, 2018 and March 31, 2017 are "for the quarter" persistency calculated using policies issued in December to February period of the relevant years. iii) Persistency ratios for the three months ended December 31, 2017 are "for the quarter" persistency calculated using policies issued in September to November period of the relevant year. NA - Not applicable
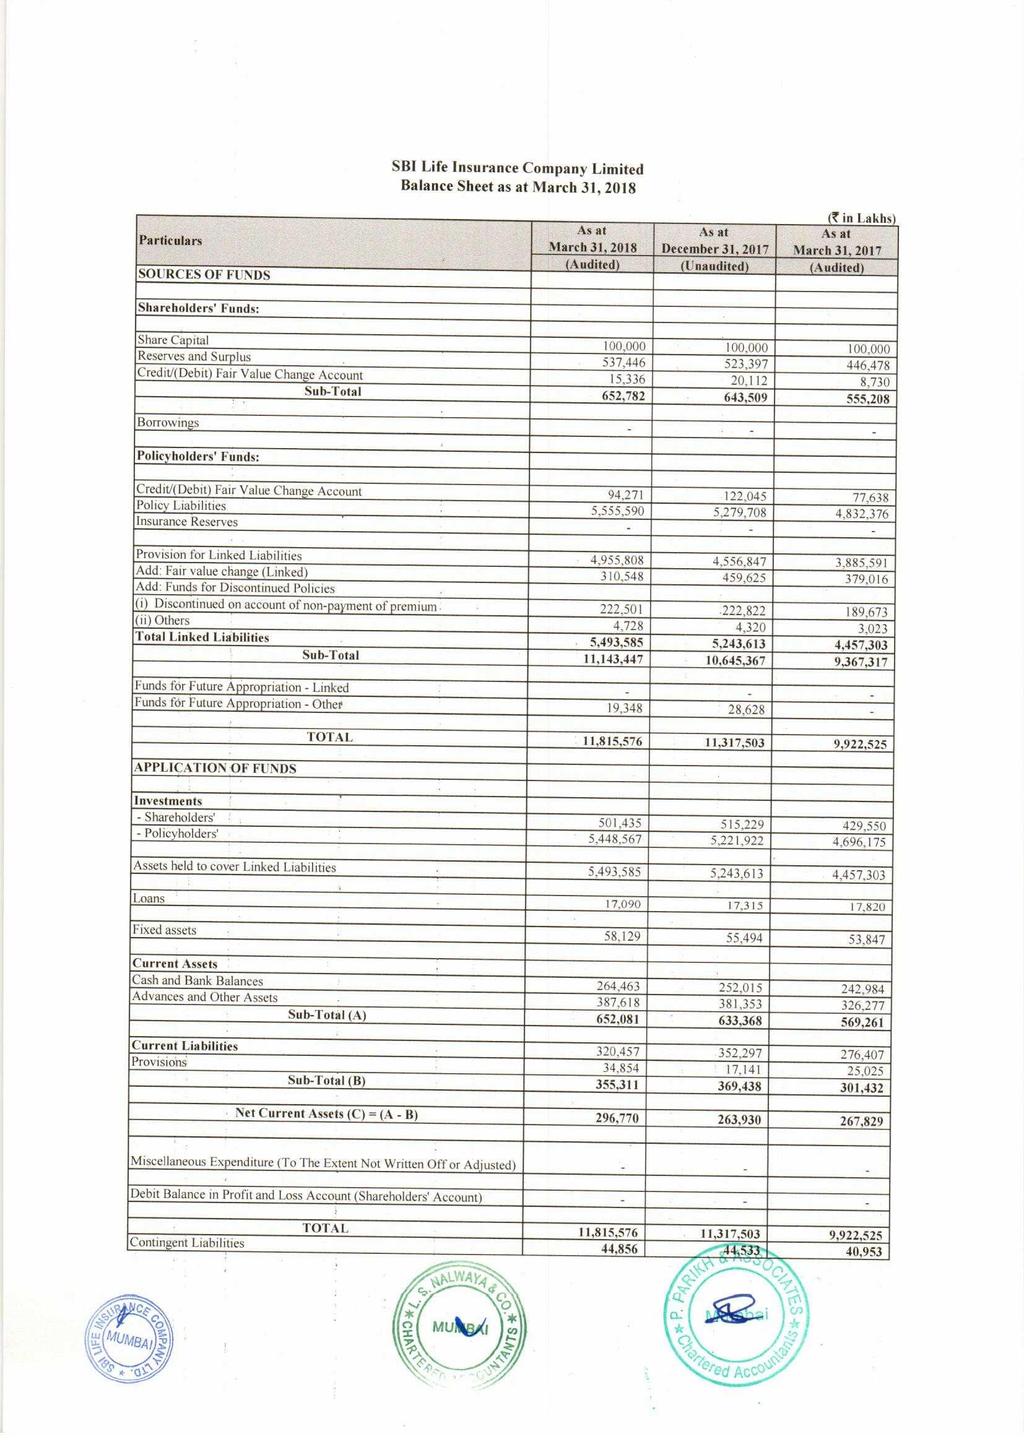
25 SBI Life Insurance Company Limited Balance Sheet as at March 31, 2018 Particulars SOURCES OF FUNDS (` in Lakhs) As at As at As at March 31, 2018 December 31, 2017 March 31, 2017 (Audited) (Unaudited) (Audited) Shareholders' Funds: Share Capital 100, , ,000 Reserves and Surplus 537, , ,478 Credit/(Debit) Fair Value Change Account 15,336 20,112 8,730 Sub-Total 652, , ,208 Borrowings Policyholders' Funds: Credit/(Debit) Fair Value Change Account 94, ,045 77,638 Policy Liabilities 5,555,590 5,279,708 4,832,376 Insurance Reserves Provision for Linked Liabilities 4,955,808 4,556,847 3,885,591 Add: Fair value change (Linked) 310, , ,016 Add: Funds for Discontinued Policies (i) Discontinued on account of non-payment of premium 222, , ,673 (ii) Others 4,728 4,320 3,023 Total Linked Liabilities 5,493,585 5,243,613 4,457,303 Sub-Total 11,143,447 10,645,367 9,367,317 Funds for Future Appropriation - Linked Funds for Future Appropriation - Other 19,348 28,628 - APPLICATION OF FUNDS TOTAL 11,815,576 11,317,503 9,922,525 Investments - Shareholders' 501, , ,550 - Policyholders' 5,448,567 5,221,922 4,696,175 Assets held to cover Linked Liabilities 5,493,585 5,243,613 4,457,303 Loans 17,090 17,315 17,820 Fixed assets 58,129 55,494 53,847 Current Assets Cash and Bank Balances 264, , ,984 Advances and Other Assets 387, , ,277 Sub-Total (A) 652, , ,261 Current Liabilities 320, , ,407 Provisions 34,854 17,141 25,025 Sub-Total (B) 355, , ,432 Net Current Assets (C) = (A - B) 296, , ,829 Miscellaneous Expenditure (To The Extent Not Written Off or Adjusted) Debit Balance in Profit and Loss Account (Shareholders' Account) TOTAL 11,815,576 11,317,503 9,922,525 Contingent Liabilities 44,856 44,533 40,953
26 SBI Life Insurance Company Limited Segment 1 Reporting for the quarter and year ended March 31, 2018 (` in Lakhs) SI. Particulars Three months ended/ As at Year ended/ As at No. March 31, 2018 December 31, 2017 March 31, 2017 March 31, 2018 March 31, 2017 (Audited) (Unaudited) (Audited) (Audited) (Audited) 1 Segment Income: Segment A:Par life Net Premium 178, , , , ,685 Income from lnvestments 2 34,275 33,627 23, ,748 97,276 Transfer of Funds from shareholders' account Other Income ,477 1,895 Segment B:Par pension Net Premium 7,582 8,273 5,321 26,074 17,905 Income from lnvestments 2 2,666 2,724 2,116 10,994 8,128 Transfer of Funds from shareholders' account Other Income Segment C:Par Variable Net Premium 33,373 23,859 24,304 86,309 57,342 Income from lnvestments 2 4,701 4,313 2,719 16,839 9,847 Transfer of Funds from shareholders' account Other Income Segment D - Non Par Individual Life Net Premium 38,085 37,869 43, , ,322 Income from lnvestments 2 16,053 16,276 15,292 65,234 57,118 Transfer of Funds from shareholders' account Other Income Segment E - Non Par Pension Net Premium 1, ,526 3,127 3,991 Income from lnvestments ,398 3,930 5,070 Transfer of Funds from shareholders' account Other Income Segment F - Non Par Group life Net Premium 84,850 47,928 76, , ,816 Income from lnvestments 2 44,540 44,617 40, , ,361 Transfer of Funds from shareholders' account 6,317-5,148 6,317 5,148 Other Income Segment G - Non Par Annuity Net Premium 6,924 5,264 6,182 21,156 20,362 Income from lnvestments 2 5,063 5,015 4,786 20,207 19,117 Transfer of Funds from shareholders' account Other Income Segment H - Non Par Health Net Premium Income from lnvestments 2 (10) Transfer of Funds from shareholders' account Other Income Segment I - Non Par Variable Net Premium 55,486 10,681 30,232 84, ,766 Income from lnvestments 2 5,802 5,791 4,909 22,603 17,340 Transfer of Funds from shareholders' account 335-1, ,120 Other Income Segment J - Linked Individual Life Net Premium 460, , ,562 1,240, ,351 Income from lnvestments 2 (38,866) 150, , , ,366 Transfer of Funds from shareholders' account Other Income 1,139 1,082 1,060 4,085 4,689
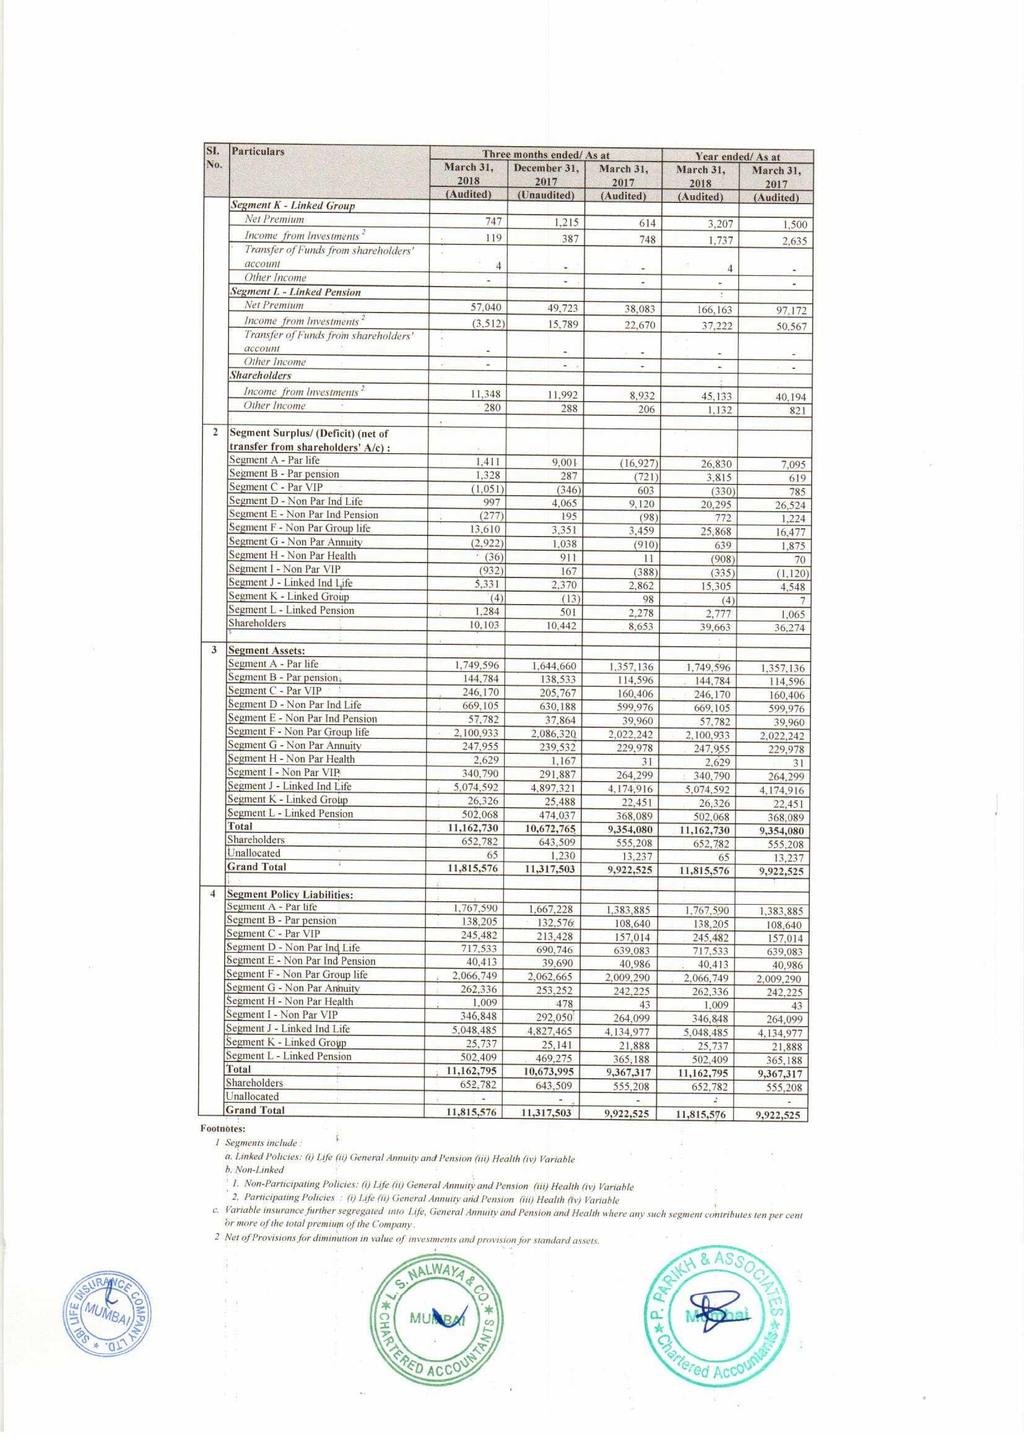
27 SI. No. Particulars Three months ended/ As at Year ended/ As at March 31, 2018 December 31, 2017 March 31, 2017 March 31, 2018 March 31, 2017 (Audited) (Unaudited) (Audited) (Audited) (Audited) Segment K - Linked Group Net Premium 747 1, ,207 1,500 Income from lnvestments ,737 2,635 Transfer of Funds from shareholders' account Other Income Segment L - Linked Pension Net Premium 57,040 49,723 38, ,163 97,172 Income from lnvestments 2 (3,512) 15,789 22,670 37,222 50,567 Transfer of Funds from shareholders' account Other Income Shareholders Income from lnvestments 2 11,348 11,992 8,932 45,133 40,194 Other Income , Segment Surplus/ (Deficit) (net of transfer from shareholders' A/c) : Segment A - Par life 1,411 9,001 (16,927) 26,830 7,095 Segment B - Par pension 1, (721) 3, Segment C - Par VIP (1,051) (346) 603 (330) 785 Segment D - Non Par Ind Life 997 4,065 9,120 20,295 26,524 Segment E - Non Par Ind Pension (277) 195 (98) 772 1,224 Segment F - Non Par Group life 13,610 3,351 3,459 25,868 16,477 Segment G - Non Par Annuity (2,922) 1,038 (910) 639 1,875 Segment H - Non Par Health (36) (908) 70 Segment I - Non Par VIP (932) 167 (388) (335) (1,120) Segment J - Linked Ind Life 5,331 2,370 2,862 15,305 4,548 Segment K - Linked Group (4) (13) 98 (4) 7 Segment L - Linked Pension 1, ,278 2,777 1,065 Shareholders 10,103 10,442 8,653 39,663 36,274 3 Segment Assets: Segment A - Par life 1,749,596 1,644,660 1,357,136 1,749,596 1,357,136 Segment B - Par pension 144, , , , ,596 Segment C - Par VIP 246, , , , ,406 Segment D - Non Par Ind Life 669, , , , ,976 Segment E - Non Par Ind Pension 57,782 37,864 39,960 57,782 39,960 Segment F - Non Par Group life 2,100,933 2,086,320 2,022,242 2,100,933 2,022,242 Segment G - Non Par Annuity 247, , , , ,978 Segment H - Non Par Health 2,629 1, , Segment I - Non Par VIP 340, , , , ,299 Segment J - Linked Ind Life 5,074,592 4,897,321 4,174,916 5,074,592 4,174,916 Segment K - Linked Group 26,326 25,488 22,451 26,326 22,451 Segment L - Linked Pension 502, , , , ,089 Total 11,162,730 10,672,765 9,354,080 11,162,730 9,354,080 Shareholders 652, , , , ,208 Unallocated 65 1,230 13, ,237 Grand Total 11,815,576 11,317,503 9,922,525 11,815,576 9,922,525 4 Segment Policy Liabilities: Segment A - Par life 1,767,590 1,667,228 1,383,885 1,767,590 1,383,885 Segment B - Par pension 138, , , , ,640 Segment C - Par VIP 245, , , , ,014 Segment D - Non Par Ind Life 717, , , , ,083 Segment E - Non Par Ind Pension 40,413 39,690 40,986 40,413 40,986 Segment F - Non Par Group life 2,066,749 2,062,665 2,009,290 2,066,749 2,009,290 Segment G - Non Par Annuity 262, , , , ,225 Segment H - Non Par Health 1, , Segment I - Non Par VIP 346, , , , ,099 Segment J - Linked Ind Life 5,048,485 4,827,465 4,134,977 5,048,485 4,134,977 Segment K - Linked Group 25,737 25,141 21,888 25,737 21,888 Segment L - Linked Pension 502, , , , ,188 Total 11,162,795 10,673,995 9,367,317 11,162,795 9,367,317 Shareholders 652, , , , ,208 Unallocated Grand Total 11,815,576 11,317,503 9,922,525 11,815,576 9,922,525 Footnotes: 1 Segments include : a. Linked Policies: (i) Life (ii) General Annuity and Pension (iii) Health (iv) Variable b. Non-Linked 1. Non-Participating Policies: (i) Life (ii) General Annuity and Pension (iii) Health (iv) Variable 2. Participating Policies : (i) Life (ii) General Annuity and Pension (iii) Health (iv) Variable c. Variable insurance further segregated into Life, General Annuity and Pension and Health where any such segment contributes ten per cent or more of the total premium of the Company. 2 Net of Provisions for diminution in value of investments and provision for standard assets.
28 Other disclosures: Status of Shareholders Complaints for the year ended March 31, 2018 SI. Particulars Numbers No. 1 No. of investor complaints pending at the beginning of the year ^ - 2 No. of investor complaints received during the year No. of investor complaints disposed off during the year No. of investor complaints remaining unresolved at the end of the year - ^ The equity shares of the Company were listed on National Stock Exchange Limited (NSE) and Bombay Stock Exchange Limited (BSE) on October 03, 2017, hence the number of complaints at the beginning of the year is NIL.
29 Notes: The above financial results have been approved by the Board of Directors at its meeting held on April 26, The audited accounts are subject to review by the Comptroller and Auditor General of India (C&AG) under section 143(6) of the Companies Act, The financial results have been prepared in accordance with the requirement of Regulation 33 of the SEBI (Listing Obligations and Disclosure Requirements) Regulations 2015, to the extent applicable, IRDAI circular IRDA/F&I/REG/CIR/208/10/2016 dated October 25, 2016 on publication of financial results for life insurance companies. The Board of Directors, in its meeting held on March 23, 2018, has declared an interim dividend of ` 2.00 per equity share of face value of ` 10 each for the year ended March 31, The figures of quarter ended March 31, 2018 and the corresponding quarter ended in the previous year as reported in these financial results are the balancing figures between audited figures in respect of full financial year and published year-to-date figures upto the end of the third quarter of the relevant financial year. The above financial results are audited by the joint statutory auditors, L.S. Nalwaya & Co., Chartered Accountants and P. Parikh & Associates, Chartered Accountants. In accordance with requirement of IRDAI Master Circular on 'Presentation of Financial Statements and Filing of Returns', the Company will publish the financials on the Company's website latest by May 26, Figures of the previous period/year have been regrouped/ reclassified wherever necessary, in order to make them comparable. For and on behalf of Board of Directors Place: Mumbai Sanjeev Nautiyal Managing Director & CEO Date: April 26, 2018 (DIN: )
30 L. S. NALWAYA & Co. P.PARIKH & ASSOCIATES Chartered Accountants Chartered Accountants 122, Sher-E-Punjab, 501, Sujata Chambers, Opp. St. Dominic Savio High School, Off. Narsi Natha Street, Andheri (East), Mumbai Mumbai Auditor's Report on Quarterly Financial Results and Year to Date Results of SBI Life Insurance Company Limited pursuant to the Regulation 33 of the SEBI (Listing Obligations and Disclosure Requirements) Regulations, 2015 read with IRDA Circular reference: IRDAI /F&I / REG/ CIR/ 208 /10/ 2016 dated 25 th October 2016 To The Board of Directors of SBI Life Insurance Company Limited We have audited the accompanying quarterly financial results of SBI Life Insurance Company Limited (the Company ) for the quarter ended March 31, 2018 and the year to date financial results for the period April 01, 2017 to March 31, 2018, being submitted by the Company pursuant to the requirement of Regulation 33 of the SEBI (Listing Obligations and Disclosure Requirements) Regulations, 2015 and IRDA Circular reference: IRDAI/F&I/REG/CIR/208/10/2016 dated October 25, These quarterly financial results as well as the year to date financial results have been prepared on the basis of financial statements, which are the responsibility of the Company's management and have been approved by the Board of Directors on April 26, Our responsibility is to express an opinion on these financial results and year to date financial results based on our audit of such financial statements, which have been prepared in accordance with the recognition and measurement principles specified under Section 133 of the Companies Act, 2013 ("the Act") read with Rule 7 of the Companies (Accounts) Rules, 2014 issued there under, including the relevant provisions of the Insurance Act, 1938 (the "Insurance Act"), the Insurance Regulatory and Development Authority Act, 1999 (the "IRDA Act") and other accounting principles generally accepted in India, to the extent considered relevant and appropriate for the purpose of quarterly financial results as well as the year to date financial results and which are not inconsistent with the accounting principles as prescribed in the Insurance Regulatory and Development Authority (Preparation of Financial Statements and Auditors' Report of Insurance Companies) Regulations, 2002 (the "Regulations") and orders/directions/circulars issued by the Insurance Regulatory and Development Authority of India ("IRDAI") to the extent applicable. We conducted our audit in accordance with the auditing standards generally accepted in India. Those standards require that we plan and perform the audit to obtain reasonable assurance about whether the financial results are free of material misstatements. An audit includes examining, on a test basis, evidence supporting the amounts disclosed as financial results. An audit also includes assessing the accounting principles used and significant estimates made by management. We believe that our audit provides a reasonable basis for our opinion.
31 In our opinion and to the best of our information and according to the explanations given to us these quarterly financial results as well as the year to date results: (i) (ii) are presented in accordance with the requirements of Regulation 33 of the SEBI (Listing Obligations and Disclosure Requirements) Regulations, 2015 and IRDAI Circular reference IRDAI/F&I/REG/CIR/208/10/2016 dated October 25, 2016 in this regard; and give a true and fair view of the net profit and other financial information for the quarter ended March 31, 2018 as well as the year to date results for the year from April 01, 2017 to March 31, Other Matters The actuarial valuation of liabilities for life policies in force is the responsibility of the Company's Appointed Actuary (the "Appointed Actuary"). The actuarial valuation of these liabilities for life policies in force and for policies in respect of which premium has been discontinued but liability exists as at March 31, 2018 has been duly certified by the Appointed Actuary and in his opinion, the assumptions for such valuation are in accordance with the guidelines and norms issued by the IRDAI and the Institute of Actuaries of India in concurrence with the Authority. We have relied upon the Appointed Actuary's certificate in this regard for forming our opinion on the valuation of liabilities for life policies in force and for policies in respect of which premium has been discontinued but liability exists, as contained in the financial statements of the Company. For L. S. NALWAYA & CO. Chartered Accountants Firm Regn. No W For P. PARIKH & ASSOCIATES Chartered Accountants Firm Regn. No W Ashish Nalwaya Ashok Rajagiri Partner Partner Membership No Membership No Place: Mumbai Date: April 26, 2018
32
33 April 26, 2018 Performance for the year ended March 31, Operating Performance Review Particulars FY2018 FY2017 (` in billion) Growth (Y-o-Y) New Business Annualized Premium Equivalent (APE) % New Business Individual Rated Premium (IRP) % New Business Premium Protection (Individual + Group) % Renewal Premium % Private Market Share based on IRP % 20.7% - Persistency Ratios (based on premium) 2 13 th month persistency 83.03% 81.07% - 37 th month persistency 70.02% 67.36% - 49 th month persistency 63.85% 62.46% - 61 st month persistency 58.43% 67.18% - Operating expense ratio 3 6.8% 7.8% - Commission ratio 4.4% 3.7% - Total cost ratio % 11.6% - Value of New business (VoNB) % VoNB Margin (%) % 15.4% - Indian embedded value (IEV) % Profit after Tax (PAT) % Assets under management (AuM) 1, % Net Worth % Solvency Ratio Source : Life insurance council 2. The persistency ratios are calculated as per IRDA/ACT/CIR/MISC/035/01/2014 circular dated 23rd January Single Premium and Fully Paid-Up policies are considered in above calculation. Group Business where persistency is measurable is included. Persistency Ratios for the year ended March 31, 2018 and March 31, 2017 are "upto the quarter" persistency calculated using policies issued in March to February period of the relevant years. 3. Operating expense ratio = Operating expenses / Gross Written Premium (GWP) 4. Total cost ratio = (Operating expenses + Commission + Provision for doubtful debt and bad debt written off) /GWP 5. VoNB/ VoNB Margin and IEV has been reviewed by Independent Actuary.
34 Business growth and market share a. New Business Annualized Premium Equivalent (APE) New business annualized premium equivalent has increased by 26.9% from ` 67.3 billion in FY 2017 to ` 85.4 billion in FY 2018 primarily driven by an increase in individual NBP generated through bancassurance and agency channel. b. New Business Individual rated Premium (IRP) and Market Share The Company has registered a y-o-y growth of 31.2% in new business individual rated premium for the FY The new business individual rated premium has increased from ` 59.4 billion in FY 2017 to ` 77.9 billion in FY In FY 2018, the Company has increased the private market share based on IRP from 20.7% in FY 2017 to 21.8 %. While the overall market share based on IRP has increased from 11.1% in FY 2017 to 12.3% in FY c. Renewal Premium Renewal premium grew at 32.3% from ` billion in FY 2017 to ` billion in FY 2018 primarily due to increase in renewal premium from retail business by 35.3%. This has resulted into increase in Gross Written Premium by 20.6% from ` billion in FY 2017 to ` billion in FY d. Product Mix The Company develops and distributes a range of participating, non-participating and unit-linked individual products as well as group products. In FY 2018, New Business Premium from participating products, non-participating products and unit-linked products contributed 18.5%, 25.5% and 55.9% respectively of New Business Premium. Persistency The Company has focused on providing superior customer service and customer retention. We had 13 th month and 61 st month persistency ratios of 83.03% and 58.43%, respectively for FY Cost efficiency The total cost ratio stood at 11.2% in FY 2018 as compared to 11.6 % in FY a. Commission The commission expense has increased by 43.1% from ` 7.8 billion in FY 2017 to ` 11.2 billion in FY The increase in commission is broadly in line with the change in product mix, increase in
35 Individual New Business Premium by 30.0% and increase in Individual Renewal Business by 35.3% in FY 2018 as compared to FY b. Operating Expenses The operating expense has increased marginally by 4.5% from ` 16.5 billion in FY 2017 to ` 17.2 billion in FY Operating expense to gross written premium ratio stood at 6.8% in FY 2018 as compared to 7.8% in FY Profitability Value of New Business (VoNB) for FY 2018 was ` 13.9 billion. The VoNB margin increased from 15.4% in FY 2017 to 16.2% in FY The Company s profit after tax was ` 11.5 billion for the year ended March 31, 2018 as compared to ` 9.5 billion for the year ended March 31, Assets under Management (AuM) Assets under management have increased by 19% from ` billion as of March 31, 2017 to ` 1,162.6 billion as of March 31, As of March 31, 2018, AUM was ` 1,162.6 billion, of which equities constituted 23%, government securities constituted 45%, corporate bonds 25% and other securities 7%. The Company has debt equity mix of 77:23. Over 90% of the debt investments are in AAA rated and sovereign instruments. Net worth and capital position The Company s net worth increased by 17.6% from ` 55.5 billion as at March 31, 2017 to ` 65.3 billion as at March 31, The solvency ratio was at 2.06 as against the regulatory requirement of 1.50.
36 2. Financial Performance Review Summary of Revenue and Profit & Loss Account Particulars Year ended (` in billion) March 31, 2018 March 31, 2017 Premium earned Premium on reinsurance ceded (1.9) (1.6 ) Net premium earned Investment income Other income Total income Commission paid Operating & other expenses Provision for tax- policyholders Claims/benefits paid (net) Change in actuarial liability Total expenses Profit before tax Provision for tax- Shareholders Profit after tax Net of Provision for diminution in the value of investment and provision for standard assets 2. Includes provision for doubtful debt (including write off) and service tax on charges 3. Inclusive of interim & terminal bonus 4. Includes movement in fund for future appropriation Premium Income Net premium earned (gross premium less premium on reinsurance ceded) increased by 20.7% from ` billion in FY 2017 to ` billion in FY 2018 primarily due to increase in retail new business premium by 30.0% from ` 64.7 billion in FY 2017 to ` 84.1 billion in FY 2018 and also due to increase in renewal premium from retail business by 35.3% from ` 99.2 billion in FY 2017 to ` billion in FY Investments and Other income i. Investment Income Total income from investment was ` 89.0 billion in FY 2018 comprised of ` 39.7 billion under unitlinked portfolio, ` 44.8 billion under traditional portfolio and ` 4.5 billion under shareholder portfolio. Total investment income has decreased by ` 8.0 billion from ` 97.0 billion in FY 2017 to ` 89.0 billion in FY 2018.
37 Unit Linked Portfolio: Total investment income under unit linked portfolio has decreased by ` 15.5 billion from ` 55.3 billion in FY 2017 to ` 39.7 billion in FY 2018 due to fair value change. Fair value change has decreased by ` billion from a gain of ` 15.2 billion in FY 2017 to a loss of ` 6.8 billion in FY This is offset with the corresponding decrease in unit-linked liability (fund reserves) as it is pass through to linked policyholders. Traditional Portfolio: Total investment income under traditional has increased by ` 7.1 billion from ` 37.7 billion in FY 2017 to ` 44.8 billion in FY 2018 majorly due to following: a. Interest income (net of amortization and accretion) under traditional portfolio has increased by ` 4.6 billion from ` 33.6 billion in FY 2017 to ` 38.2 billion in FY 2018 due to increase in investment of debt securities by 14.1% under traditional portfolio. b. Net profit on sale of investment under traditional portfolio has increased by ` 2.3 billion from ` 3.7 billion in FY 2017 to ` 6.0 billion in FY 2018 due to higher profit booking. Shareholders Portfolio: Investment income under shareholder portfolio has increased by ` 0.5 billion from ` 4.0 billion in FY 2017 to ` 4.5 billion in FY 2018 is mainly due to increase in interest income and higher profit booking. ii. Other Income Other income includes fees and charges, income on unclaimed fund, rental income, etc. Other income for FY 2018 and FY 2017 has remained flat at ` 0.8 billion. Commission Commission expense has increased by 43.1% from ` 7.8 billion in FY 2017 to ` 11.2 billion in FY The increase in commission is broadly in line with the change in product mix, increase in Individual New Business Premium by 30.0% and increase in Individual Renewal Business Premium by 35.3% in FY 2018 as compared to FY Operating and other expenses Operating expenses relating to insurance business and other expenses (including service tax/ goods and service tax on charges) has increased by 10.5%, from ` 19.0 billion in FY 2017 to ` 21.0 billion in FY This increase was primarily due to an increase in employee s remuneration expenses. Employee s remuneration expense has increased by 16.5% from ` 8.2 billion in FY 2017 to ` 9.6 billion in FY 2018 due to salary increments and increase in number of employees to support an increase in the size of business operations.
38 Claims/benefits paid (net) Claims and benefits payout increased by 22.6% from ` 95.5 billion FY 2017 to ` billion in FY 2018 primarily on account of increase in withdrawals by ` 11.3 billion and increase in survival benefit by ` 5.1 billion in FY 2018 as compared to FY Change in actuarial liability Change in actuarial liability including fund for future appropriation (FFA) increased from ` billion in FY 2017 to ` billion in FY a. Fund reserve, which represents liability carried on account of units held by unit-linked policyholders, has increased from ` 82.8 billion in FY 2017 to ` billion in FY The increase in fund reserve is primarily due to an increase in premium and investment income net of benefit payout in the linked funds. b. Traditional policyholder s liability (including non-unit liability and FFA) net of reinsurance ceded has decreased from ` 85.9 billion in FY 2017 to ` 73.0 billion in FY Profit after tax As a result of the above, the profit after tax increased by 20.5% from ` 9.5 billion in FY 2017 to ` 11.5 billion in FY Disclaimer Except for the historical information contained herein, statements in this release which contain words or phrases such as 'will', would, indicating, expected to, etc., and similar expressions or variations of such expressions may constitute 'forward-looking statements'. These forward-looking statements involve a number of risks, uncertainties and other factors that could cause actual results, opportunities and growth potential to differ materially from those suggested by the forwardlooking statements. These risks and uncertainties include, but are not limited to, the actual growth in demand for insurance and other financial products and services in the countries that we operate or where a material number of our customers reside, our ability to successfully implement our strategy, including our use of the Internet and other technology our exploration of merger and acquisition opportunities, our ability to integrate mergers or acquisitions into our operations and manage the risks associated with such acquisitions to achieve our strategic and financial objectives, our growth and expansion in domestic and overseas markets, technological changes, our ability to market new products, the outcome of any legal, tax or regulatory proceedings in India and in other jurisdictions we are or become a party to, the future impact of new accounting standards, our ability to implement our dividend policy, the impact of changes in insurance regulations and other regulatory changes in India and other jurisdictions on us. SBI Life insurance undertakes no obligation to update forwardlooking statements to reflect events or circumstances after the date thereof. This release does not constitute an offer of securities. For investor queries please call Sangramjit Sarangi at or investorrelations@sbilife.co.in (`1 billion = ` 100 crore)
39 News Release April 26, 2018 BSE Code: NSE Code: SBILIFE Performance for the year ended March 31, 2018 Market leadership in Individual New Business Premium with 30% Y-o-Y growth Value of New Business (VoNB) increased by 34% Embedded Value (IEV) rises to ` billion Profit after tax increased by 21% to ` 11.5 billion in FY 2018 Key measures of performance (` in billion) Particulars FY 2018 FY 2017 Growth New Business Annualized Premium Equivalent (APE) % New Business Individual Rated Premium (IRP) % New Business Premium Protection (Individual + Group) % Renewal Premium % Private Market Share based on IRP % 20.7% - Persistency Ratios (based on premium) 2 13 th month persistency 83.03% 81.07% - 37 th month persistency 70.02% 67.36% - 49 th month persistency 63.85% 62.46% - 61 st month persistency 58.43% 67.18% - Operating expense ratio 3 6.8% 7.8% - Commission ratio 4.4% 3.7% - Total cost ratio % 11.6% - Value of New business (VoNB) % VoNB Margin (%) % 15.4% - Indian embedded value (IEV) % Profit after Tax (PAT) % Assets under Management (AuM) 1, % Net Worth % Solvency Ratio Source : Life insurance council 2. The persistency ratios are calculated as per IRDA/ACT/CIR/MISC/035/01/2014 circular dated 23rd January Single Premium and Fully Paid-Up policies are considered in above calculation. Group Business where persistency is measurable is included. Persistency Ratios for the year ended March 31, 2018 and March 31, 2017 are "upto the quarter" persistency calculated using policies issued in March to February period of the relevant years. 3. Operating expense ratio = Operating expenses / Gross Written Premium (GWP) 4. Total cost ratio = (Operating expenses + Commission + Provision for doubtful debt and bad debt written off) /GWP 5. VoNB/VoNB Margin and IEV has been reviewed by Independent Actuary. N.B: Refer the section on definitions, abbreviations and explanatory notes
40 The Board of Directors of SBI Life Insurance Company Limited approved and adopted its audited financial results for the year ended March 31, 2018, following its meeting on Thursday, April 26, 2018 in Mumbai. The disclosure of financial results submitted to exchanges is annexed to this release. New business growth and market share New Business APE increased by 26.9% in FY 2018 to ` 85.4 billion from ` 67.3 billion for the same period last year New Business Individual Rated Premium (IRP) has increased by 31.2% in FY 2018 to ` 77.9 billion from ` 59.4 billion for the same period last year Private market share based on IRP increased from 20.7% in FY 2017 to 21.8 % in FY While the overall market share based on IRP has increased from 11.1% in FY 2017 to 12.3% in FY 2018 Quality of business 13 th month persistency stood at 83.03% for FY2018 as compared to 81.07% for FY 2017 Renewal premium grew at 32.3% to ` billion in FY 2018 Cost Efficiency Operating Expense ratio has decreased to 6.8% in FY 2018, from 7.8% in FY 2017 Profitability Value of New Business (VoNB) stood at ` 13.9 billion for FY2018 VoNB margin of 16.2% for FY2018 as compared to 15.4% for FY2017 PAT increased by 20.5% from ` 9.5 billion in FY 2017 to ` 11.5 billion in FY 2018 Assets under Management AuM has grown by 19% to ` 1,162.6 billion as of March 31, 2018, from ` billion as of March 31, 2017 Net worth and capital position The Company s net worth increased by 17.6% from ` 55.5 billion as at March 31, 2017 to ` 65.3 billion as at March 31, The solvency ratio was at 2.06 as against the regulatory requirement of 1.50.
41 Performance for quarter ended March 31, 2018 Individual Rated Premium grew by 10.2% in Q4 FY 2018 New Business Premium Protection (Individual + Group) grew by 34.5% Renewal Premium grew by 31.8% in Q4 FY 2018 Total Premium (GWP) increased by 25.7% in Q4 FY 2018 Profit after tax grew by 13.4% from ` 3.4 billion in Q4 FY 2017 to ` 3.8 billion in Q4 FY Operating Expense to Gross Written Premium at 5.2% in Q4 FY 2018 Definitions, abbreviations and explanatory notes New Business Premium (NBP): Insurance premium that is due in the first policy year of a life insurance contract or a single lump sum payment from the policyholder New Business Annualized Premium Equivalent (APE): The sum of annualized first year premiums on regular premium policies, and 10% of single premiums, written by the Company during the fiscal year from both retail and group customers Individual Rated Premium (IRP): New business premiums written by the Company under individual products and weighted at the rate of 10% for single premiums Renewal Premium: Life insurance premiums falling due in the years subsequent to the first year of the policy Embedded Value: The measure of the consolidated value of shareholders interest in the covered life insurance business, which is all life insurance business written by the Company since inception and inforce as on the valuation date (including lapsed business which have the potential of getting revived). The Embedded Value of the Company has been determined on the basis of the Indian Embedded Value (IEV) Methodology calculated as per APS 10 set forth by the Institute of Actuaries of India (IAI) Value of New Business (VoNB): VoNB is the present value of expected future earnings from new policies written during a specified period and it reflects the additional value to shareholders expected to be generated through the activity of writing new policies during a specified period. Value of New Business Margin / VoNB Margin: VoNB Margin is the ratio of VoNB to New Business Annualized Premium Equivalent for a specified period and is a measure of the expected profitability of new business Solvency Ratio: Solvency ratio means ratio of the amount of Available Solvency Margin to the amount of Required Solvency Margin as specified in form-kt-3 of IRDAI Actuarial Report and Abstracts for Life Insurance Business Regulations
42 Net worth: Net worth represents the shareholders funds and is computed as sum of share capital and reserves including share premium, share application money and fair value change account net of debit balance in profit and loss account About SBI Life Insurance SBI Life Insurance Company Limited ( SBI Life / the Company ), established in 2001, is a joint venture between State Bank of India and BNP Paribas Cardif S.A. and is one of the leading life Insurance companies in India. SBI Life has an authorized capital of ` 20.0 billion and a paid up capital of ` 10.0 billion. SBI Life offers a comprehensive range of life insurance and pension products at competitive prices, ensuring high standards of customer service and world class operating efficiency. The Company offers individual and group products which include savings and protection plans to address the insurance needs of diverse customer segments. SBI Life has a multi-channel distribution network comprising of an expansive Bancassurance channel with SBI, which has an unrivalled strength of over 22,000 branches across the country. SBI Life also has a large and productive agent network comprising of 108,261 agents, as on March 31, The Company s other distribution channels include direct sales and sales through corporate agents, brokers, insurance marketing firms and other intermediaries. As on March 31, 2018, the Company has a widespread network of 825 offices across the Country to address customer needs effectively and efficiently. The Company had an AuM of ` 1,162.6 billion as of March 31, The Company is listed on National Stock Exchange ( NSE ) and The Bombay Stock Exchange ( BSE ). Disclaimer Except for the historical information contained herein, statements in this release which contain words or phrases such as 'will', expected to, etc., and similar expressions or variations of such expressions may constitute 'forward-looking statements'. These forward-looking statements involve a number of risks, uncertainties and other factors that could cause actual results, opportunities and growth potential to differ materially from those suggested by the forward-looking statements. These risks and uncertainties include, but are not limited to, the actual growth in demand for insurance and other financial products and services in the countries that we operate or where a material number of our customers reside, our ability to successfully implement our strategy, including our use of the Internet and other technology our exploration of merger and acquisition opportunities, our ability to integrate mergers or acquisitions into our operations and manage the risks associated with such acquisitions to achieve our strategic and financial objectives, our growth and expansion in domestic and overseas markets, technological changes, our ability to market new products, the outcome of any legal, tax or regulatory proceedings in India and in other jurisdictions we are or become a party to, the future impact of new accounting standards, our ability to implement our dividend policy, the impact of changes in insurance regulations and other regulatory changes in India and other jurisdictions on us. SBI Life Insurance Company Limited undertakes no obligation to update forward looking statements to reflect events or circumstances after the date thereof. This release does not constitute an offer of securities. For further press queries please call Vikash Sharma at / Divya Shukla at or vikash.sharma@sbilife.co.in / divya.shukla@sbilife.co.in (`1 billion = ` 100 crore)


43 SBI Life Insurance Performance update FY 2018 Investor Presentation April 2018
44 Performance update 2
45 Key performance metrics Parameters FY16 FY17 FY18 Growth ` in billion 3 year CAGR Revenue Parameters New Business APE % 33% Individual Rated Premium % 36% Renewal Premium % 25% Gross Written Premium % 25% Financial Parameters Profit after tax % 12% Indian Embedded Value (IEV) % - Value of New Business % - New Business Margin % 15.4% 16.2% 5% - Consistent growth in Individual Business Premium continues Profitable growth for all the stakeholders The Embedded Value pre-dividend stands at ` billion which is a growth of 17% 1. IEV has been reviewed by Independent Actuary 2. FY 16 numbers are calculated internally based on MCEV methodology Numbers and Percentages are rounded off to nearest one decimal 3
46 Premium and market share Focus on individual business Gross Written Premium Individual rated Premium ` in billion % 32% 30% Year CAGR 36% % FY 15 FY 16 FY 17 FY 18 Individual NBP Renewal Premium Group NBP 35% growth in individual renewal premium - `135.2 bn in FY 18 FY 15 FY 16 FY 17 FY 18 Growth of 31% in regular individual business Growth in market share NBP Market Share 20.0% 17.3% 18.5% 15.9% 4.9% 5.1% 5.8% 5.7% 15.6% 7.7% IRP Market Share 18.8% 20.7% 9.7% 11.2% 21.8% 12.3% FY 15 FY 16 FY 17 FY 18 FY 15 FY 16 FY 17 FY 18 Private Market Share Total Market Share Private Market Share Total Market Share Growth in IRP by 31% while the private industry has grown by 24% and total industry has grown by 19% Components may not add up to total due to rounding-off 4
47 Product portfolio Diversified product portfolio (%) Product type Total NBP Product type Individual NBP 3 Year CAGR 26% 3 Year CAGR 31% 35% 45% 51% 56% 50% 64% 79% 73% 39% 34% 26% 21% 39% 26% 11% 19% 11% 39% 6% 29% 4% 17% 3% 24% FY 15 FY 16 FY 17 FY 18 Par Non Par ULIP FY 15 FY 16 FY 17 FY 18 Par Non Par Ulip Product Mix 11 FY 15 FY16 FY17 FY18 Mix Y-o-Y Growth Strong and consistent growth in Individual Savings and Protection business reflecting balanced product mix Need based selling helps us to cater client s requirements ` in billion 3 year CAGR Individual Savings % 31% 32% - Par % 86% 12% - Non Par % 24% (8%) - ULIP % 19% 48% Group Savings % -38% 11% Protection % 23% 12% Total NBP % 26% 1. New business premium basis 2. Includes Individual and Group products. Components may not add up to total due to rounding-off 5
48 Channel mix 1 Multi-channel distribution ` in billion NBP channel mix IRP channel mix % 18% 25% 33% 27% 22% 12% 25% 22% 2% 1% 1% 1% 45% 38% 34% 31% 20% 48% 54% 53% 62% 27% 54% 61% 65% 68% 37% FY 16 FY 16 FY 17 FY 18 Channel efficiency Banca Agency Others FY 15 FY 16 FY 17 FY 18 Banca Agency Others in 000s Number of policies Agent Productivity 2 Banca Branch Productivity 3 1,126 1,274 1,276 1, % 8% ,302 1,759 2,433 FY 15 FY 16 FY 17 FY 18 Banca Agency Others FY 15 FY 16 FY 17 FY 18 Productivity No. of Agents FY 15 FY 16 FY 17 FY Others include Corporate Agents other than banks, Brokers and Direct channel 2. Agent Productivity is calculated as the Individual NBP of Agency Channel divided by the average number of agents 3. Banca branch productivity is calculated as the Individual NBP of Banca Channel divided by the average banca branches Components may not add up to total due to rounding-off 6
49 Cost efficiency Operating expense (Opex) ratio 1 Total cost ratio 3 9.1% 9.2% 7.8% 6.8% 13.8% 13.7% 11.6% 11.2% FY15 FY 16 FY 17 FY 18 Commission ratio 2 4.7% 4.5% 4.4% 3.7% FY15 FY 16 FY 17 FY 18 FY15 FY 16 FY 17 FY 18 Maintaining cost leadership through operational efficiency 1. Opex ratio is operating expenses (excluding commission) divided by Gross Written Premium 2. Commission ratio is commission expenses divided by Gross Written Premium 3. Total cost ratio is operating expenses including commission, provision for doubtful debts and bad debts written off divided by Gross Written Premium Components may not add up to total due to rounding-off 7
50 Components of Indian Embedded Value (IEV) Indian Embedded Value (IEV) ` in billion Embedded Value Operating Profit (EVOP): ` 29.5 billion Operating Return on Embedded Value: 17.9% Value of Inforce (VIF) Business (0.6) (2.8) (6.4) 74.7 ANW PVFP TVFOG FCRC CRNHR IEV 1. The rate of income tax applied to the surplus is set at 14.56% 2. Tax deductions available by way of dividend income from equity etc. is not taken into consideration. Rate of taxation applied to individual pension business is zero 3. The Required Capital is taken at 180% of the Statutory RSM, which is the internally approved norm for the company The IEV estimates as on 31st March 2018 have been carried out internally by SBI Life. The methodology, assumptions and the results have been reviewed by Willis Towers Watson Actuarial Advisory LLP. Components may not add up to total due to rounding-off 8
51 Analysis of movement in IEV Indian Embedded Value (IEV) ` in billion EV grown by 23% CAGR between FY 16 to FY (1.8) (2.4) Opening EV VoNB Unwinding Operating Experience Variance Change in Operating Assumptions Economic Assumption Change & Variance Dividend Paid Closing EV Improvement in persistency leading to favourable experience variance of ` 1.91 billion Components may not add up to total due to rounding-off 9
52 Components of Value of New Business (VoNB) Value of New Business (VoNB) ` in billion Robust VoNB growth of 34% from ` 10.4 billion to ` 13.9 billion 17.0 (0.1) (0.6) (2.4) 13.9 VoNB Before CoC TVFOG FCRC CRNHR VoNB After CoC VoNB Margin increases to 16.2% Components may not add up to total due to rounding-off 10
53 Profitability Increasing profit ` in billion Strong Solvency Dividend Payout Ratio 1 18% 17% 19% 21% FY 15 FY 16 FY 17 FY 18 FY 15 FY 16 FY 17 FY 18 Robust growth in profit after tax with strong solvency despite consistent growth Increasing networth ` in billion RoE 22% 20% 19% 19% Improving Earning per share RoIC 82% 86% 95% 115% FY 15 FY 16 FY 17 FY 18 FY 15 FY 16 FY 17 FY 18 Improving networth and EPS adding value to shareholders 1. Dividend Payout Ratio is calculated as the dividend amount including dividend distribution tax divided by profit after tax 11
54 Customer retention and satisfaction Customer retention through quality underwriting 79.3% 80.7% 81.1% 83.0% 73.9% 73.2% 73.9% 75.2% Persistency % 69.2% 67.4% 70.0% 76.9% 64.5% 62.5% 63.9% 67.2% 58.4% 53.8% 40.7% 13th Month 25th Month 37th Month 49th Month 61st Month Customer satisfaction metrics FY 15 FY 16 FY 17 FY 18 Surrender Ratio 2 Unfair Business Practice 3 Individual death claim settlment ratio % 8.2% 8.7% 7.2% 0.48% 0.29% 0.20% 0.14% 89.7% 93.4% 96.7% 96.8% FY 15 FY 16 FY 17 FY 18 FY 15 FY 16 FY 17 FY 18 FY15 FY16 FY17 FY18 Strong customer service ethos to promote ethical sales and ensure an improved overall customer experience Continuous customer engagement and awareness campaigns Overall Death Claim Settlement ratio of 98.4% for FY The persistency ratios are calculated as per IRDAI circular dated 23rd January Single premium and fully paid-up policies are considered. Ratios are calculated based on premium. 2.Surrender ratio-individual linked products (Surrender/average AuM). 3. Number of grievances with respect to unfair business practice that are reported to the Company divided by policies issued by the Company in the same period. 4. Number of death claims settled/ (Claims outstanding at the beginning of the year + claims received during the year) 12
55 Assets under management 1 Assets under Management growth AuM Linked/Non Linked ,162.6 AuM Debt/Equity ,162.6 ` in billion 23% 94:6 51% 93:7 55% 90:10 54% 89:11 53% 23% 31% 23% 42:58 49% 58:42 45% 61:39 46% 65:35 47% 69% 77% 77% 77% FY 15 FY 16 FY 17 FY 18 Linked Non - Linked FY 15 FY 16 FY 17 FY 18 Debt Equity Investment performance 1 7.1% 6.0% 15.2% 12.2% 8.2% 6.4% 14.1% 11.6% 8.0% 6.4% 13.5% 11.6% 7.4% 8.1% 8.5% 8.6% 8.3% 7.3% 11.2% 10.7% 3 Yr CAGR 5 Yr CAGR 3 Yr CAGR 5 Yr CAGR 3 Yr CAGR 5 Yr CAGR 3 Yr CAGR 5 Yr CAGR 3 Yr CAGR 5 Yr CAGR Equity Fund Equity Elite Fund II Equity Optimiser Fund Bond Fund Balanced Fund Fund Benchmark AUM growth of 18% from FY 15 to FY 18 More than 90% of the debt investments are in AAA and Sovereign instruments 1. As on March 31, 2018 Debt:Equity 13
56 Strategy 1 Leverage insurance industry growth through deeper penetration Number of lives covered ~ 23 millions Protection business increased by 23% New Business Sum Assured increased by 29% to ` 2,820 billion 2 Expansive distribution network Strong distribution network of 159,004 trained insurance professional (Agents/CIFs/ SPs) Number of CIFs increased by 25% to 49,527 and Agents increased by 14% to 108,261 Widespread operation with 825 offices across country Direct touch point for customers Ensure profitable growth with balanced product mix Maintain cost leadership Decrease in Opex ratio to 6.8% Focus on protection products enhancing customer as well as shareholder values Average Individual new business policy term of 12 years and average customer age of 39 years Customer satisfaction and engagement Pre Issuance Welcome Call to ensure customer is well educated about the policy features Grievances under 47 policies per 10,000 policies Average TAT for mortality claim settlement of 3.7 days Digital Initiatives Automation and digitalization of sales processes to improve distribution and operational efficiencies Connect life Robust IT infrastructure to deliver strong customer service and engagement Easy Access, Geo mapping etc. 2,00,000 policies issued, 82,000 policies renewed and 65% of premium collection through online mode All growth/drop numbers are with respect to FY18 over FY17 14


57 Corporate Social Responsibility SBI Life s CSR philosophy Child Education Healthcare Rural Development Environment Skill Development 256 projects undertaken 2.2 lakh+ lives impacted 15
 Won Bancassurance Leader, Life Insurance (Large")
 (Fintelekt Awards 2017) Awarded India")


 in Customer")

58 Awards & Recognitions Won Private Sector Life Insurance Company of the Year (Large Category) Won Bancassurance Leader, Life Insurance (Large Companies Category) Won Data Analytics Initiative of the Year (Overall Award Across Life, General, Health) (Fintelekt Awards 2017) Awarded India s Leading insurance Company Life (Private sector) at the Dun & Bradstreet BFSI Summit 2018 Won Skoch Resilient India Awards 2017 for Predictive Analytics and automation of renewal Management System Integrated Death Claims Management System Adjudged as one of the Most Trusted Brand, 2017 for the seventh consecutive year by the Economic Times Brand Equity Nielson Survey Won the Legal Era Risk Award 2017" under the Most Innovative Risk Management Startegy category for the year 2017 Won the Brand of the Year Award in the Insurance Category by WCRC Won the DSCI Excellence Awards 2017" under category "Best Practices for Insurance Sector for the year 2017 Ranked #1 (in a jointly held spot) in Customer loyalty in the Life Insurance Category in a survey conducted across more than 15 key cities in India, according to Kantar IMRB Survey 2017 Stood 3 rd in order of Merit for Excellence in HR Technology 16
 News release: April 24, 2018 NSE Code: ICICIPRULI BSE Code: 540133 VNB growth of 93.1% Embedded Value rises to ` 187.88 billion ICICI Prudential Life Insurance announces a strong full year financial performance.
VNB growth of 93.1% Embedded Value rises to ` billion
 News release: April 24, 2018 NSE Code: ICICIPRULI BSE Code: 540133 VNB growth of 93.1% Embedded Value rises to ` 187.88 billion ICICI Prudential Life Insurance announces a strong full year financial performance.
ICICI Prudential Life declares results for Nine months ended December 31, 2018
 News Release January 22, 2019 NSE Code: ICICIPRULI BSE Code: 540133 ICICI Prudential Life declares results for Nine months ended December 31, 2018 Value of New Business (VNB) registers a growth of 18.6%
IRDA PUBLIC DISCLOSURES FOR THE QUARTER ENDED JUNE 30, 2015
 IRDA PUBLIC DISCLOSURES FOR THE QUARTER ENDED JUNE 30, 2015 Name of the Insurer: HDFC Standard Life Insurance Company Limited Registration Number and Date of Registration with the IRDAI : 101 dated 23rd
IRDAI PUBLIC DISCLOSURES FOR THE QUARTER ENDED JUNE 30, 2016.
 IRDAI PUBLIC DISCLOSURES FOR THE QUARTER ENDED JUNE 30, 2016. Name of the Insurer: HDFC Standard Life Insurance Company Limited Registration Number and Date of Registration with the IRDAI : 101 dated 23rd
VNB growth of 61.7% New Business APE up 28.1% Embedded Value rises to ` billion Final Dividend of 35%
 News release: April 25, 2017 NSE Code: ICICIPRULI BSE Code: 540133 VNB growth of 61.7% New Business APE up 28.1% Embedded Value rises to `161.84 billion Final Dividend of 35% ~ New business Annualised
 1 ICICI Prudential Life Insurance Company Limited Embedded Value Results This report on Embedded Value results as at March 31, 2017 has been prepared by the Company and the results presented in the report
Life Non Participating. (b) Reinsurance Ceded (3,203) (20) (2,42,575) (0) - - (9,223) (5) (2,55,026) (c) Reinsurance accepted
 Reinsurance Ceded (3,203) (20) (2,42,575) (0) - - (9,223) (5) (2,55,026) (c) Reinsurance accepted") FORM L-1-A-RA KOTAK MAHINDRA OLD MUTUAL LIFE INSURANCE LIMITED Registration No: 107; Date of Registration: January 10, 2001 SEGMENT-WISE REVENUE ACCOUNT FOR THE QUARTER ENDED JUN 30, 2017 Policyholders'
FORM L-1-A-RA KOTAK MAHINDRA OLD MUTUAL LIFE INSURANCE LIMITED Registration No: 107; Date of Registration: January 10, 2001 SEGMENT-WISE REVENUE ACCOUNT FOR THE QUARTER ENDED JUN 30, 2017 Policyholders'
Pension Participating. (b) Reinsurance Ceded (3,263) (70) (1,67,076) (1) - - (26,380) (7) (1,96,797) (c) Reinsurance accepted
 Reinsurance Ceded (3,263) (70) (1,67,076) (1) - - (26,380) (7) (1,96,797) (c) Reinsurance accepted") FORM L-1-A-RA KOTAK MAHINDRA OLD MUTUAL LIFE INSURANCE LIMITED Registration No: 107; Date of Registration: January 10, 2001 SEGMENT-WISE REVENUE ACCOUNT FOR THE QUARTER ENDED MARCH 31, 2017 Policyholders'
FORM L-1-A-RA KOTAK MAHINDRA OLD MUTUAL LIFE INSURANCE LIMITED Registration No: 107; Date of Registration: January 10, 2001 SEGMENT-WISE REVENUE ACCOUNT FOR THE QUARTER ENDED MARCH 31, 2017 Policyholders'
IRDA Public Disclosures
 IRDA Public Disclosures QUARTER ENDED 31ST MARCH 2015 Aviva Life Insurance Company India Limited S. No. Form No. Description Page No. 1 L-1 REVENUE ACCOUNT 1-2 2 L-2 PROFIT & LOSS ACCOUNT 3 3 L-3 BALANCE
Performance for the period ended December 31, 2016
 News release January 24, 2017 BSE Code: 540133 NSE Code: ICICIPRULI Performance for the period ended December 31, 2016 ~ New business Annualised Premium Equivalent (APE*) increased by 27.6% to ` 44.58
IRDAI PUBLIC DISCLOSURES FOR THE YEAR ENDED MARCH 31, 2018.
 IRDAI PUBLIC DISCLOSURES FOR THE YEAR ENDED MARCH 31, 2018. Name of the Insurer: HDFC Standard Life Insurance Company Limited Registration Number and Date of Registration with the IRDAI : 101 dated 23rd
IRDA PUBLIC DISCLOSURES FOR THE YEAR ENDED MARCH 31, 2016
 IRDA PUBLIC DISCLOSURES FOR THE YEAR ENDED MARCH 31, 2016 Name of the Insurer: HDFC Standard Life Insurance Company Limited Registration Number and Date of Registration with the IRDAI : 101 dated 23rd
IRDA PUBLIC DISCLOSURES FOR THE QUARTER ENDED JUNE 30, 2014
 IRDA PUBLIC DISCLOSURES FOR THE QUARTER ENDED JUNE 30, 2014 Name of the Insurer: HDFC Standard Life Insurance Company Limited Registration Number and Date of Registration with the IRDA : 101 dated 23rd
ANNEXURE-1 AUDITED FINANCIAL RESULTS FOR THE QUARTER AND YEAR ENDED MARCH 31, Reviewed
 1 ANNEXURE-1 AUDITED FINANCIAL RESULTS FOR THE QUARTER AND YEAR ENDED MARCH 31, 2018 1 Interest Earned (a+b+c+d) a) Interest/Discount on advances/ bills b) Income on Investments c) Interest on balances
IRDA PUBLIC DISCLOSURES FOR THE YEAR ENDED MARCH 31, 2014
 IRDA PUBLIC DISCLOSURES FOR THE YEAR ENDED MARCH 31, 2014 Name of the Insurer: HDFC Standard Life Insurance Company Limited Registration Number and Date of Registration with the IRDA : 101 dated 23rd October
Name of the Insurer: HDFC Standard Life Insurance Company Limited
 Name of the Insurer: HDFC Standard Life Insurance Company Limited Registration Number and Date of Registration with the IRDAI : 101 dated 23rd October 2000 List of Website Disclosure Sr No. Form No. Description
CLSA Investor forum. September 14, 2017
 CLSA Investor forum September 14, 2017 Agenda Opportunity Industry and Competitive landscape Company strategy and performance 2 Agenda Opportunity Industry and Competitive landscape Company strategy and
Disclosures - LIFE INSURANCE COMPANIES- WEBSITE
 Disclosures - LIFE INSURANCE COMPANIES- WEBSITE Form NO. L-1-A-RA L-2-A-PL L-3-A-BS L-4-PREMIUM SCHEDULE L-5-COMMISSION SCHEDULE L-6-OPERATING EXPENSES SCHEDULE L-7-BENEFITS PAID SCHEDULE L-8-SHARE CAPITAL
Discussion Paper on Convergence to Ind-As in Insurance Sector
 Discussion Paper on Convergence to Ind-As in Insurance Sector 1. This discussion paper covers the approach towards convergence towards Ind-AS in the insurance sector from the date which will be notified
FORM L-1-A : Revenue Account. FORM L-1-A : Revenue Account UP TO THE QUARTER ENDED ON JUNE Non Participating. (Linked) Individual
 Individual") Insurer : DHFL Pramerica Insurance Company Limited Registration No. 140 ; Date of Registration with the IRDAI: June 27, 2008 Revenue Account For the quarter Ended March 31, 2018 FORM L-1-A : Revenue Account
Insurer : DHFL Pramerica Insurance Company Limited Registration No. 140 ; Date of Registration with the IRDAI: June 27, 2008 Revenue Account For the quarter Ended March 31, 2018 FORM L-1-A : Revenue Account
GUIDANCE NOTE PREPRATATION OF INVESTMENT RETURNS
 INSURANCE REGULATORY AND DEVELOPMENT AUTHORITY OF INDIA GUIDANCE NOTE PREPRATATION OF INVESTMENT RETURNS Ver 02 AUGUST, 2016 The Authority, to bring consistency in the data filed through electronic submission,
FORM L-1-A : Revenue Account. FORM L-1-A : Revenue Account UP TO THE QUARTER ENDED ON JUNE Non Participating (Linked) Total
 Total") Insurer : DHFL Pramerica Insurance Company Limited Registration No. 140 ; Date of Registration with the IRDAI: June 27, 2008 Revenue Account For the quarter Ended June 30, 2017 FORM L-1-A : Revenue Account
Insurer : DHFL Pramerica Insurance Company Limited Registration No. 140 ; Date of Registration with the IRDAI: June 27, 2008 Revenue Account For the quarter Ended June 30, 2017 FORM L-1-A : Revenue Account
SBI Life Insurance Co Ltd
 SBI Life Insurance Co Ltd Strong parent backing leaves no scope for doubts SBI Life Insurance is a JV between State Bank of India (SBI-70%), and BNP Paribas Cardiff (26%). The insurer s new business premium
Performance update: 9M-FY2019. January 22, 2019
 Performance update: 9M-FY2019 January 22, 2019 Agenda Company strategy and performance Opportunity Industry overview Image to be pasted Agenda Company strategy and performance Opportunity Industry overview
CENTRAL DEPOSITORY SERVICES (INDIA) LIMITED CIN: U67120MH1997PLC112443
 LIMITED CIN: U67120MH1997PLC112443") I. INCOME Statement of Standalone Financial Results for the Quarter Ended June 30, 2016 PARTICULARS 2016 (Audited) 2015 a) Income from operations 2,598.27 1,850.53 Total Income 2,598.27 1,850.53 II. EXPENDITURE
I. INCOME Statement of Standalone Financial Results for the Quarter Ended June 30, 2016 PARTICULARS 2016 (Audited) 2015 a) Income from operations 2,598.27 1,850.53 Total Income 2,598.27 1,850.53 II. EXPENDITURE
News Release July 29, 2011
 News Release July 29, 2011 Performance Review Quarter ended June 30, 2011 53% year-on-year increase in consolidated profit after tax to ` 1,667 crore (US$ 373 million) for the quarter ended June 30, 2011
SBI Life Insurance Company (SBILIFE IN ) Rating: BUY CMP: Rs673 TP: Rs840
 Rating: BUY CMP: Rs673 TP: Rs840") (SBILIFE IN ) Rating: BUY CMP: Rs673 TP: Rs840 July 20, 2018 Q1FY19 Result Update Continued improvement in biz yielding results Quick Pointers Company focuses to grow in protection (both segments) and
(SBILIFE IN ) Rating: BUY CMP: Rs673 TP: Rs840 July 20, 2018 Q1FY19 Result Update Continued improvement in biz yielding results Quick Pointers Company focuses to grow in protection (both segments) and
SBI Life Insurance Company
 Industry Life Insurance CMP Rs. 689.25 Recommendation Buy at CMP and Add on Dips Add on dips to Rs. 689-642 Target Rs. 840 Time Horizon 4 Quarters HDFC Scrip Code SBILIF BSE Code 540719 NSE Code Bloomberg
Performance update: Q1-FY2019. July 24, 2018
 Performance update: Q1-FY2019 July 24, 2018 Agenda Company strategy and performance Opportunity Industry overview 2 Agenda Company strategy and performance Opportunity Industry overview 3 Strategy: Market
Leadership in Life Insurance. June 2013
 Leadership in Life Insurance June 2013 Agenda Industry overview and outlook Performance update Our strategy 2 Agenda Industry overview and outlook Performance update Our strategy 3 India life insurance
Leadership in life insurance. November 2015
 Leadership in life insurance November 215 Agenda Industry overview Outlook Company strategy and performance 2 Agenda Industry overview Outlook Company strategy and performance 3 Evolution of life insurance
IRDA Public Disclosures
 IRDA Public Disclosures QUARTER ENDED 31st DEC 2018 Aviva Life Insurance Company India Limited S. No. Form No. Description Page No. 1 L-1 REVENUE ACCOUNT 1-2 2 L-2 PROFIT & LOSS ACCOUNT 3 3 L-3 BALANCE
Leadership in life insurance. August 2013
 Leadership in life insurance August 2013 Agenda Industry overview and outlook Performance update Our strategy 2 Agenda Industry overview and outlook Performance update Our strategy 3 India life insurance
SBI Life Insurance Company Ltd.
 IPO Note: SBI Life Insurance Company Ltd. Industry: Life Insurance Recommendation: Subscribe Date: September 19, 2017 Issue Snapshot Company Name SBI Life Insurance Company Ltd. Issue Opens September 20,
Press Release. For Immediate Release. Consolidated Audited Financial Results for Q4 and FY Ended 31 st March, 2018
 Press Release For Immediate Release 03 rd May, 2018, New Delhi Consolidated Audited Financial Results for Q4 and FY 2017-18 Ended 31 st March, 2018 The Board of Directors of PNB Housing Finance Limited
HDFC Standard Life Insurance Company Ltd.
 IPO Note: HDFC Standard Life Insurance Company Ltd. Industry: Life Insurance Recommendation: Subscribe Date: November 06, 2017 Issue Snapshot Company Name HDFC Standard Life Insurance Company Ltd. Issue
Max Financial. Improving margins! BUY RESULTS REVIEW 4QFY18 30 MAY Highlights of the quarter
 INDUSTRY Life Insurance CMP (as on 30 May 2018) Rs 485 Target Price Rs 665 Nifty 10,614 Sensex 34,906 KEY STOCK DATA Bloomberg MAXF IN No. of Shares (mn) 268 MCap (Rs bn) / ($ mn) 130/1,924 6m avg traded
Karnataka Bank LtdẎour Family Bank, Across India.
 Karnataka Bank LtdẎour Family Bank, Across India. Regd. & Head Office P. B. No.599, Mahaveera Circle Kankanady Mangalore 575 002 Phone : 0824-2228222 Fax: 0824-2225589 E-Mail : accts@ktkbank.com Website
IRDA Public Disclosures
 IRDA Public Disclosures QUARTER ENDED 31st MARCH 2018 Aviva Life Insurance Company India Limited S. No. Form No. Description Page No. 1 L-1 REVENUE ACCOUNT 1-2 2 L-2 PROFIT & LOSS ACCOUNT 3 3 L-3 BALANCE
IRDA Public Disclosures
 IRDA Public Disclosures QUARTER ENDED 31st DECEMBER 2016 Aviva Life Insurance Company India Limited S. No. Form No. Description Page No. 1 L-1 REVENUE ACCOUNT 1-2 2 L-2 PROFIT & LOSS ACCOUNT 3 3 L-3 BALANCE
OFS: Rs. 82 bn. Rs. 700bn at upper price band JM Financial, Axis Capital, BNP Paribas, Citigroup, Deutsche, ICICI Sec., Kotak, SBI Cap.
 SBI Life Insurance Co. Ltd. - Best placed amongst peers in Life insurance industry but expensively valued - SUBSCRIBE for long term.. SBI Life Insurance Company Limited was incorporated at Mumbai on October
News Release January 24, Performance Review Quarter ended December 31, 2008
 News Release January 24, 2009 Performance Review Quarter ended December 31, 2008 Profit after tax of Rs. 1,272 crore; 25% increase over second quarter 23% year-on-year increase in operating profit for
REF: RCL:KMS:BSE-243-BM-OUTCOME/18: Date: 26/05/2018
 Listing/Corporate Relationship Dept./ Market Operations Department BSE Limited Phiroze Jeejeebhoy Towers Dalal Street, Mumbai - 400 001. REF: RCL:KMS:BSE-243-BM-OUTCOME/18: Date: 26/05/2018 Dear Sir, Sub:
FORM A-RA. ICICI Prudential Life Insurance Company Limited Regn.No. 105 dated
 Consolidated Condensed Revenue Account for the half year ended September 30, 2017 Particulars Schedule Par Life Par Premiums earned (Net of service tax/goods & Service tax) (a) Premium 1 13,324,948 95,675
D. DHANDARIA & COMPANY
 D. DHANDARIA & COMPANY CHARTERED ACCOUNTANTS Dhandaria Market, Thana Road, P.O. TINSUKIA 786125 (Assam) Ph: 0374-2337684 INDEPENDENT AUDITORS' REVIEW REPORT ON REVIEW OF STANDALONE INTERIM FINANCIAL RESULTS
DANGI JAIN & COMPANY CHARTERED ACCOUNTANTS
 DANGI JAIN & COMPANY CHARTERED ACCOUNTANTS 4, N. S. ROAD IST FLOOR KOLKATA 700001 PH : 2230 4469/6914 Independent Auditor s Review Report on quarterly and year to date Financial Results OF HANUMAN AGRO
Edelweiss Tokio Life Insurance Company Limited
 Edelweiss Tokio Life Insurance Company Limited Audited Financial Statements Financial Year 2016-17 1 Auditors Report INDEPENDENT AUDITOR S REPORT TO THE MEMBERS OF EDELWEISS TOKIO LIFE INSURANCE COMPANY
Please note the updated investor presentation enclosed alongwith this letter.
 ICICI PRIDENllAL~1~ I I if #ff ii iitlli!llgfj/j~~i,~~,''s February 6, 2019 General Manager Listing Department BSE Limited, Phiroze Jeejeebhoy Tower, Dalal Street, Mumbai 400 001 Vice President Listing
SBI Life Insurance. Source: Company Data; PL Research
 Recent correction gives further reason to enter March 15, 2018 Vidhi Shah vidhishah@plindia.com / +91 22 66322258 R Sreesankar rsreesankar@plindia.com / +91 22 66322214 Pritesh Bumb priteshbumb@plindia.com
IRDA Public Disclosures
 IRDA Public Disclosures QUARTER ENDED 31st MARCH 2017 Aviva Life Insurance Company India Limited S. No. Form No. Description Page No. 1 L-1 REVENUE ACCOUNT 1-2 2 L-2 PROFIT & LOSS ACCOUNT 3 3 L-3 BALANCE
FORM A-RA. Non Par Variable Pension. Non Par Variable. Non Par
 Consolidated Revenue Account for the year ended March 31, 2017 Particulars Schedule Par Life Par Premiums earned (Net of service tax) (a) Premium 1 25,626,519 329,823 27,982,618 891,208 137,913 2,058,089
ICICI Prudential Life
 INDUSTRY INSURANCE CMP (as on 24 Apr 2018) Rs 418 Target Price Rs 515 Nifty 10,614 Sensex 34,617 KEY STOCK DATA Bloomberg IPRU IN No. of Shares (mn) 1,435 MCap (Rs bn) / ($ mn) 600/9,054 6m avg traded
Veer. Nine months ended/at
 ICICI Prudential Life lneurance Company Limit8d s-mant of Standalone Audit8d Reeulte for the quarter and nine month ended Dece mber 31, 2018 (tl n Lekh) I Three months e nded/at Veer Nine months ended/at
Consolidated Financial Highlights
 Consolidated Financial Highlights 2017-2018 (` In crore) Financial Highlights FY 2014 FY 2015 FY 2016 FY 2017 FY 2018 Advances 71,693 88,632 144,793 167,125 205,997 Investments*$ 26,685 31,910 55,304 49,974
Drivers of valuation. January 15, 2016
 Drivers of valuation January 15, 2016 Life insurance industry in India FY2002 FY2010 FY2015 New business premium 1 (Rs bn) Total premium (Rs bn) 116 501 21.5% 23.2% 550 2,655-5.8% 4.3% 408 3,277 Penetration
fl IC/CI PRLDENT1AL1~,r
 fl IC/CI PRLDENT1AL1~,r December 6, 2018 General Manager Listing Department BSE Limited, Phiroze Jeejeebhoy Tower, Dalal Street, Mumbai 400 001 Vice President Listing Department National Stock Exchange
1.1 Compliance with the requirements of the Accounting Standards (AS)
") 1. INTRODUCTION Every insurer carrying on Life Insurance business shall comply with the requirements of Schedule A of the IRDA (Preparation of Financial Statements and Auditor s Report of Insurance Companies)
1. INTRODUCTION Every insurer carrying on Life Insurance business shall comply with the requirements of Schedule A of the IRDA (Preparation of Financial Statements and Auditor s Report of Insurance Companies)
FORM L-1-A : Revenue Account FORM L-1-A : Revenue Account. Non Participating (Non-Linked) Non Participating (Linked) Participating (Non-Linked) Total
 Non Participating (Linked) Participating (Non-Linked) Total") Insurer : DHFL Pramerica Insurance Company Limited Registration No. 140 ; Date of Registration with the IRDAI: June 27, 2008 Revenue Account For the quarter Ended March 31,2018 FORM L-1-A : Revenue Account
Insurer : DHFL Pramerica Insurance Company Limited Registration No. 140 ; Date of Registration with the IRDAI: June 27, 2008 Revenue Account For the quarter Ended March 31,2018 FORM L-1-A : Revenue Account
SUGGESTED SOLUTION INTERMEDIATE N 2018 EXAM. Test Code CIN 5010
 SUGGESTED SOLUTION INTERMEDIATE N 2018 EXAM SUBJECT- ADVANCED ACCOUNTS Test Code CIN 5010 Date: 25.08.2018 Head Office : Shraddha, 3 rd Floor, Near Chinai College, Andheri (E), Mumbai 69. Tel : (022) 26836666
D. DHANDARIA & COMPANY
 D. DHANDARIA & COMPANY CHARTERED ACCOUNTANTS Dhandaria Market, Thana Road, P.O. TINSUKIA 786125 (Assam) Ph: 0374-2337684 INDEPENDENT AUDITORS' REVIEW REPORT ON REVIEW OF STANDALONE INTERIM FINANCIAL RESULTS
News Release April 25, 2009
 News Release April 25, 2009 Performance Review Year ended March 31, 2009 Dividend of Rs. 11 per share proposed, same as previous year Profit before tax of Rs. 5,117 crore for the year ended March 31, 2009
NPS TRUST A/C HDFC PENSION MANAGEMENT COMPANY LIMITED - SCHEME G TIER II
 UN-AUDITED REVENUE ACCOUNT FOR THE HALF YEAR ENDED SEPTEMBER 30, 2014 Income & Gain For the period ended 30.09.2014 For the period ended 30.09.2013 Interest income 29,025 - Dividend income - - Profit on

UNAUDITED FINANCIAL RESULTS FOR THE QUARTER/ NINE MONTHS ENDED DEC
 Regd. & Head Office P. B. No.599, Mahaveera Circle Kankanady Mangalore 575 002 Karnataka Bank Ltd. Your Family Bank, Across India. Phone : 0824-2228222 Fax: 0824-2225589 E-Mail : accts@ktkbank.com Website
HDFC Life Insurance. Investor presentation 9M FY18
 HDFC Life Insurance Investor presentation 9M FY18 This is the sole and exclusive property of HDFC Life. January 19, 2018 Agenda A Performance Snapshot Additional Business Information Annexure 2 Company
Schemes Tier - I. Total Schedule. Grand Total Tier - II Income from investments
 UNAUDITED FUND REVENUE ACCOUNT FOR THE PERIOD ENDED SEPTEMBER 30, 2013 HPMC-E-T-I HPMC-C-T-I HPMC-G-T-I HPMC-E-T-II HPMC-C-T-II HPMC-G-T-II I Schedule Grand E C G E C G Income from investments Interest/Amortisation
News Release January 21, Performance Review Quarter ended December 31, 2009
 News Release January 21, 2010 Performance Review Quarter ended December 31, 6% sequential increase in standalone profit after tax to Rs. 1,101 crore for the quarter ended December 31, from Rs. 1,040 crore
NPS TRUST A/C HDFC PENSION MANAGEMENT COMPANY LIMITED - SCHEME C TIER II
 UN-AUDITED BALANCE SHEET AS AT MARCH 31, 2015 Sources of funds Schedule Unitholders Funds Unit Capital 1 6,099,940 321,050 Reserves & Surplus 2 988,716 19,850 Current Liabilities and Provisions 3 5,274
NPS TRUST A/C HDFC PENSION MANAGEMENT COMPANY LIMITED - SCHEME G TIER I
 UN-AUDITED REVENUE ACCOUNT FOR THE HALF YEAR ENDED SEPTEMBER 30, 2014 Schedule For the period ended 30.09.2014 For the period ended 30.09.2013 Income & Gain Interest income 1,744,238 10,746 Profit on sale/redemption
(Provisions) (Shareholders Fund) (Policyholders Fund) (Bonus) (Interim Bonus) Provisions. (Surplus) (Policy Holders Fund)
 (Shareholders Fund) (Policyholders Fund) (Bonus) (Interim Bonus) Provisions. (Surplus) (Policy Holders Fund)") (Provisions) (Shareholders Fund) (Policyholders Fund) (Bonus) (Interim Bonus) Provisions (Surplus) (Policy Holders Fund) General 1. This directive should be interpreted in the context of the regulations
(Provisions) (Shareholders Fund) (Policyholders Fund) (Bonus) (Interim Bonus) Provisions (Surplus) (Policy Holders Fund) General 1. This directive should be interpreted in the context of the regulations
IRDA Public Disclosures
 IRDA Public Disclosures QUARTER ENDED 31st DECEMBER 2017 Aviva Life Insurance Company India Limited S. No. Form No. Description Page No. 1 L-1 REVENUE ACCOUNT 1-2 2 L-2 PROFIT & LOSS ACCOUNT 3 3 L-3 BALANCE
Walaa Cooperative Insurance Company (A Saudi Joint Stock Company) Interim Condensed Financial Information (Unaudited)
 Interim Condensed Financial Information (Unaudited)") Walaa Cooperative Company Interim Condensed Financial Information (Unaudited) September 30, 2018 (A SAUDI JOINT STOCK COMPANY) INTERIM CONDENSED FINANCIAL INFORMATION (UNAUDITED) INDEX PAGE Independent
Walaa Cooperative Company Interim Condensed Financial Information (Unaudited) September 30, 2018 (A SAUDI JOINT STOCK COMPANY) INTERIM CONDENSED FINANCIAL INFORMATION (UNAUDITED) INDEX PAGE Independent
ANNEXXURE I AUDITED FINANCIAL RESULTS FOR THE QUARTER AND YEAR ENDED
 Regd. & Head Office P. B. No.599, Mahaveera Circle Kankanady Mangalore 575 002 Karnataka Bank Ltd. Your Family Bank, Across India. Phone : 0824-2228222 Fax: 0824-2225589 E-Mail : accts@ktkbank.com Website
BSE SAMMAAN CSR LIMITED
 Public BSE SAMMAAN CSR LIMITED ANNUAL ACCOUNTS FY 2017-18 BSE SAMMAAN CSR LIMITED INDEPENDENT AUDITOR'S REPORT TO THE MEMBERS OF BSE SAMMAAN CSR LIMITED Report on the Financial Statements We have audited
 NSE Code: ISEC BSE Code: 541179 Press Release 9MFY19 Performance Highlights 1.2 million active clients, +10% Vs 9MFY18 3.2+ lakh new clients acquired Revenue at `1,299 crore; PAT at ` 369 crore PAT margin
DHFL PRAMERICA LIFE INSURANCE COMPANY LIMITED CIN : U66000HR2007PLC Audited Financial Statements For the year ended 31 st March, 2018
 DHFL PRAMERICA LIFE INSURANCE COMPANY LIMITED CIN : U66000HR2007PLC052028 Audited Financial Statements For the year ended 31 st March, 2018 S. N. Dhawan & Co LLP J.C. Bhalla & Co. (Formerly S.N. Dhawan
(CIN: L74999DL1995PLC069631)
") Indiabulls Ventures Limited (CIN: L74999DL1995PLC069631) Audited Consolidated Financial Results for the quarter and year ended 31 March 2018 Statement of Audited Consolidated Financial Results for the
Indiabulls Ventures Limited (CIN: L74999DL1995PLC069631) Audited Consolidated Financial Results for the quarter and year ended 31 March 2018 Statement of Audited Consolidated Financial Results for the
Intermediate (IPC) Course Paper 1: Accounting Chapter 2: Financial Statements of Companies CA. Pankajj Goel
 Course Paper 1: Accounting Chapter 2: Financial Statements of Companies CA. Pankajj Goel") Intermediate (IPC) Course Paper 1: Accounting Chapter 2: Financial Statements of Companies CA. Pankajj Goel The Institute of Chartered Accountants of India Recorded on: 24-October-2014 1 This lecture has
Intermediate (IPC) Course Paper 1: Accounting Chapter 2: Financial Statements of Companies CA. Pankajj Goel The Institute of Chartered Accountants of India Recorded on: 24-October-2014 1 This lecture has
NPS TRUST A/C HDFC PENSION MANAGEMENT COMPANY LIMITED - SCHEME G TIER I
 UN-AUDITED BALANCE SHEET AS AT MARCH 31, 2015 Sources of funds Schedule Unitholders Funds Unit Capital 1 139,818,985 19,444,475 Reserves & Surplus 2 33,286,326 646,530 Current Liabilities and Provisions
RELIANCE JIO MESSAGING SERVICES PRIVATE LIMITED 1. Reliance Jio Messaging Services Private Limited
 RELIANCE JIO MESSAGING SERVICES PRIVATE LIMITED 1 Reliance Jio Messaging Services Private Limited 2 RELIANCE JIO MESSAGING SERVICES PRIVATE LIMITED Independent Auditor s Report To The Members Of Reliance
INDEX. Revenue Account : Policyholders Account (Technical Account) Profit & Loss Account : Shareholders Account (Non Technical Account)...
 Profit & Loss Account : Shareholders Account (Non Technical Account)...") Annual Report 2007-2008 INDEX Directors Report... 2 Management Report... 4 Auditors Report... 6 Revenue Account : Policyholders Account (Technical Account)... 8 Profit & Loss Account : Shareholders Account
Annual Report 2007-2008 INDEX Directors Report... 2 Management Report... 4 Auditors Report... 6 Revenue Account : Policyholders Account (Technical Account)... 8 Profit & Loss Account : Shareholders Account
Leadership in life insurance. April 2008
 Leadership in life insurance April 2008 Agenda Indian life insurance opportunity Organisational overview Performance highlights 2 Agenda Indian life insurance opportunity Organisational overview Performance
HDFC Standard Life Insurance Company (HDFCLIFE IN ) Rating: BUY CMP: Rs359 TP: Rs500
 Rating: BUY CMP: Rs359 TP: Rs500") HDFC Standard Life Insurance Company (HDFCLIFE IN ) Rating: BUY CMP: Rs359 TP: Rs500 October 24, 2018 Q2FY19 Result Update Margins on rise mainly led by protection biz Quick Pointers Protection share has
HDFC Standard Life Insurance Company (HDFCLIFE IN ) Rating: BUY CMP: Rs359 TP: Rs500 October 24, 2018 Q2FY19 Result Update Margins on rise mainly led by protection biz Quick Pointers Protection share has
1. Mr. V P Mahendra, Director retired as a Director of the Company
 July 28, 2011 NSE / BSE NSDL / CDSL / WDM-NSE Dear Sir, We wish to inform you of the following changes in the constitution of the Board of directors of the Company approved at the 33 rd annual general
News Release July 31, 2014
 News Release July 31, 2014 Performance Review: Quarter ended June 30, 2014 17% year-on-year increase in standalone profit after tax to ` 2,655 crore (US$ 441 million) for the quarter ended June 30, 2014
Overview of Life insurance industry. Date :
 Overview of Life insurance industry Date : 15.11.2017 INDEX 1. Meaning 2. Glossary 3. Type of Life insurance 4. How they earn 5. Industry evolution 6. World Data 7. Domestic Data 8. Risk 10. Data about
Karnataka Bank Ltd[ SECRETARI AL DEPARTMENT
 F. No.1304 (H.O.) Karnataka Bank Ltd[ Estd : 1924 CIN : L85110KA1924PLC001128 Regd. & Head Office P.B. No. 599, Mahaveera Circle Kankanady, Mangalore - 575 002 Phone : 0824-2228222 Fax : 0824-2225588 Website
 3flll (it iif%iii fcl fll e\s (1JJ"«f m
 Affinity Names, Inc. AFFINITY NAMES, INC. 1
 Affinity Names, Inc. AFFINITY NAMES, INC. 1 2 AFFINITY NAMES, INC. Independent Auditors Report To the Board of Directors Reliance Industries Limited Report on the Standalone Financial Statements We have
Performance Analysis:
 Performance Analysis: Q3 FY 2016 (April December 2015) February 13, 2016 2016 Bank of Baroda. All Rights Reserved 1 Bank of Baroda: Our Key Strengths Bank of Baroda is a 107 years old State-owned Bank
Consolidated Financial Highlights
 Consolidated Financial Highlights 2016-17 ` in crore FINANCIAL HIGHLIGHTS FY 2013 FY 2014 FY 2015 FY 2016 FY 2017 Advances 66,258 71,693 88,632 144,793 167,125 Investments*$ 30,823 26,685 31,910 55,304
YES Securities (India) Limited
 Limited") Balance Sheet EQUITY AND LIABILITIES Note 31 March 2017 31 March 2016 Shareholders funds Share capital 3 500,000 500,000 Reserves and surplus 4 (144,289) (242,181) Non-current liabilities Other non-current
Balance Sheet EQUITY AND LIABILITIES Note 31 March 2017 31 March 2016 Shareholders funds Share capital 3 500,000 500,000 Reserves and surplus 4 (144,289) (242,181) Non-current liabilities Other non-current
Performance Review: FY2007. April 28, 2007
 Performance Review: FY2007 April 28, 2007 Agenda Highlights Operating Review Financial Performance Life Insurance General Insurance 2 Highlights 22% increase in profit after tax to Rs. 31.10 billion in
HDFC Standard Life Insurance
 Decent performance on all fronts January 21, 2018 Vidhi Shah vidhishah@plindia.com / +91 22 66322258 R Sreesankar rsreesankar@plindia.com / +91 22 66322214 Pritesh Bumb priteshbumb@plindia.com / +91 22
News Release October 30, Performance Review: Quarter ended September 30, 2014
 News Release October 30, Performance Review: Quarter ended September 30, 15% year-on-year increase in standalone profit after tax to ` 2,709 crore (US$ 439 million) for the quarter ended September 30,
Date: The Manager BSE Limited Phiroze Jeejeebhoy Towers Dalal Street, Mumbai Security Code: , Security ID: EFPL
 CORPORATE INDENTIFICATION NUMBER: L45209DL2008PLC181131 Date: 26.05.2018 The Manager BSE Limited Phiroze Jeejeebhoy Towers Dalal Street, Mumbai- 400001 Security Code: 534839, Security ID: EFPL Sub: Outcome
DIVIDEND DISTRIBUTION POLICY
 DIVIDEND DISTRIBUTION POLICY 1 1.Overview of the Policy i. Statement of Purpose and Coverage ii. Philosophy iii. Definitions SEBI has, through its notification dated July 8, 2016, released the Securities
BSE: NSE: GTL Reuters: GTL.BO & GTL.NS Bloomberg: GTS.IN. GTL registers Revenue of ` Crore for the quarter ended June 30, 2013
 Press Release For Immediate circulation BSE: 500160 NSE: GTL Reuters: GTL.BO & GTL.NS Bloomberg: GTS.IN GTL registers Revenue of ` 651.81 Crore for the quarter ended 2013 Mumbai, August 3, 2013 GTL Limited
News Release November 7, Performance Review: Quarter ended September 30, 2016
 News Release November 7, 2016 Performance Review: Quarter ended September 30, 2016 21% year-on-year growth in retail portfolio; domestic advances grew by 16% year-on-year at September 30, 2016 18% year-on-year