ANNUAL FINANCIAL REPORT OF ΕΤΕΜ S.A LIGHT METALS COMPANY. PURSUANT TO ARTICLE 4 L.3556/2007 (1 st January to 31 st December 2013)
|
|
|
- Gilbert Greene
- 6 years ago
- Views:
Transcription
1 ANNUAL FINANCIAL REPORT OF ΕΤΕΜ S.A LIGHT METALS PURSUANT TO ARTICLE 4 L.3556/2007 (1 st January to 31 st December 2013) This report has been translated from the original Greek report that has been prepared in the Greek language. In the event that differences exist between this translation and the original, the Greek report will prevail over this document.
2 Index 1) Statements of the Board of Directors' Members. 2) Annual Report of the Board of Directors. 3) Corporate Governance Statement. 4) Independent Auditor s Report of Annual Financial Statements. 5) Annual Financial Statements (Group and Company) for the fiscal year ) Summarized financial data and information. 7) Information of article 10 Law 3401/2005. The present Annual Financial Report of ETEM S.A LIGHT METALS and the Group for the fiscal year 2013, can be found in the official web site of ETEM S.A ( and the official web site of Athens Stock Exchange (
3 Statements of the Board of Directors Members In accordance with article 4 par. 2 of Law 3556/2007 Hereby we state and confirm that according to our knowledge the separate and consolidated Annual Financial Statements of ETEM S.A LIGHT METALS for the fiscal year 2013, which were drawn up in accordance with the applicable accounting standards, reflect in a true manner the actual details and figures of the assets and liabilities, the equity and the profit and loss of ETEM S.A LIGHT METALS, as well as the entities included in consolidation taken as a whole. Also hereby we state and confirm that according to our knowledge the Annual Report of the Board of Directors presents in a true manner the evolution, the performance and the financial position of ETEM S.A as well as the entities included in consolidation taken as a whole, including their risks and uncertainties they are facing up. Athens, March 24, 2014 Certified by Markos Kallergis Georgios Mentzelopoulos Emmanouil Kartsomichelakis Chairman of the Board of Directors Member of the Board of Directors & General Manager Member of the Board of Directors
4 ANNUAL REPORT OF THE BOARD OF DIRECTORS OF ETEM S.A-LIGHT METALS ON THE CONSOLIDATED AND SEPARATE FINANCIAL STATEMENTS FOR THE PERIOD FROM 1st JANUARY 2013 TO 31st DECEMBER Dear shareholders, In accordance with the provisions laid down in Law No. 3556/2007 and the executive decisions made by the Hellenic Capital Market Commission based on that law, we would like to submit to you the Annual Report prepared by the Board of Directors for fiscal year This report includes a summary of the financial results and changes that happened during 2013, reference to important events that took place, an analysis of prospects and risks, as well as a list of transactions with affiliated entities. Such information pertains both to the company and ETEM Group. The consolidated Financial Statements arose from the consolidation of the relevant data included in the Financial Statements of the parent company ΕΤΕΜ S.A.- LIGHT METALS, and its subsidiaries ETEM BULGARIA S.A. established in Sofia, Bulgaria, ALUBUILD S.R.L. established in Reggio Emilia, Italy; MOPPETS LTD. established in Nicosia, Cyprus; ETEM SCG D.O.O. established in Belgrade, Serbia; ETEM SYSTEMS S.R.L., established in Bucharest, Romania; LLC ETEM SYSTEMS UKRAINE established in Kiev, Ukraine; QUANTUM PROFILES S.A. established in Sofia, Bulgaria; ETEM ALBANIA SHPK established in Tirana, Albania; ALAMAR S.A. established in Tripoli, Libya and ETEM S.A. COMMERCIAL AND INDUSTRIAL LIGHT METALS (former KANAL S.A.) established in Athens, Attica. The relation under the consolidation was the one of parent-subsidiaries. The associated company STEELMET ROMANIA S.A. established in Bucharest, Romania was consolidated using the equity method. During 2013, the merger of the subsidiaries of ETEM S.A., STEELMET S.A. and ETEM BULGARIA S.A., both established in Sofia, Bulgaria was completed, through the absorption of the first from the latter. The merger did not affect the Company s participation in ETEM BULGARIA S.A. which remains 100%. Neither the parent company nor any of the companies included in the consolidation hold any shares of the parent company.
5 I. ANNUAL REPORT 2013 Year end Results The decline in demand and sales of extrusion products in the Greek market continued for sixth consecutive year. Between 2007 and 2013, according to the official figures from the Greek Aluminium Association, the decline is estimated at over 65 % (decrease in sales from tns in 2007 to tns in 2013) while the fall of 2013 compared with the previous year was about 22 %. Sustained fiscal measures against property contributed greatly to the further decline of construction activity and further weakened the demand of extrusion products as well as their associated materials. As a result of the above conditions and the continued economic crisis in Greece the separate and consolidated corporate results have been burdened additionally with about 7.5 million of impairment in company s fixed assets and about 2.5 million of bad and doubtful customers provision and inventories, which contributed to worse results compared to previous year. The ETEM Group in an attempt to balance the extremely adverse conditions in Greece, is dedicated to an extroverted strategy, research and development of new products with high added value and penetration into new markets and sectors which could provide the long term sustainability and growth. The first positive signs have come already in surface with the operating profitability of foreign subsidiaries growing. Furthermore, the company is in process of negotiating long-term contracts with strategic partners that will offer potential penetration in both new markets and production expertise while strengthening the Group's cash flows. In this context, the continued investment plan in 2014 is expected to absorb financial resources of about 5 million. The developed business plan of the ETEM Group contributed to the refinancing of 38.3 million in 2013, for the parent company ETEM SA, of short-term debt with long-term bond loan. The same financial restructuring is expected to be concluded, for ETEM BULGARIA SA early in 2014, alongside with new financing based on the investment plan for the coming years. Briefly, Group and Company results are presented in the following tables. (Amounts in Euros) 31/12/ /12/2012* Variation % Sales 84,440,275 99,607,661 (15.23%) Net profit / (loss) before tax, financing, investments, depreciation and amortization (10,290,494) (74,786) (13,659.92%) Percentage on sales (12.19%) (0.08%) Net profit / (loss) before tax, depreciation and amortization (15,117,421) (4,903,061) (208.33%) Percentage on sales (17.90%) (4.92%) Net profit / (loss) before tax (21,565,339) (11,363,031) (89.79%) Percentage on sales (25.54%) (11.41%) Net profit / (loss) after tax (19,933,857) (9,741,613) (104.63%) Percentage on sales (23.61%) (9.78%) * Adjusted amounts due to amended IAS 19 Employee benefits (see note 37).
6 (Amounts in Euros) 31/12/ /12/2012* Variation % Sales 27,192,931 41,885,239 (35.08%) Net profit / (loss) before tax, financing, investments, depreciation and amortization (12,304,550) (1,360,919) (804.14%) Percentage on sales (45.25%) (3.25%) Net profit / (loss) before tax, depreciation and amortization (15,296,491) (4,131,462) (270.24%) Percentage on sales (56.25%) (9.86%) Net profit / (loss) before tax (18,455,984) (7,369,913) (150.42%) Percentage on sales (67.87%) (17.60%) Net profit / (loss) after tax (17,490,376) (7,278,435) (140.30%) Percentage on sales (64.32%) (17.38%) * Adjusted amounts due to amended IAS 19 Employee benefits (see note 37). Balance sheet Group total assets as of 31 December 2013 amount to million decreased by 23 million compared to the respective period of 2012 due to the decrease in non-current assets by 10.7million and specifically due to the decrease in property, plant and equipment by 5.8 million and investment property by 4.8 million as well as to the decrease in current assets by 12.3 million and specifically the decrease in inventories by 1.7 million and trade and other receivables by 9.5 million. The decrease in current assets in Greece and abroad resulted from the focus of ETEM Management on reducing working capital. Total net borrowing (loans less cash at banks and cash equivalents) was increased by 3.2 million to 83.7 million from 80.5 million on Shareholders Equity amounts to 9 million compared to 28.9 million at the end of the previous fiscal year. Accordingly, the Company s net borrowing (loans less cash at banks and cash equivalents) is increased by 1.9 million standing at 52.4 million from 50.5 million on Finally, Shareholders Equity amounts to 7.3 million compared to 24.6 million at the end of the previous fiscal year. As at 31 December 2013, total short-term liabilities of the Group and the Company exceeded by 20.3 million and 0.1 million respectively their short-term receivables and in addition the Group presented current year losses after tax amounted to 19.9 million with the total equity reaching the amount of 9 million. Within 2013 refinancing of the existing loans of the parent company ETEM S.A. was achieved with the long term bond loan of 38.3 million. It is noted that, ETEM S.A. received the comfort letter from its parent company ELVAL S.A. for providing support if necessary. Based on the above the financial statements of the Company and the Group have been prepared on a going concern basis. Therefore the accompanying financial statements do not include any adjustments regarding the recoverability and classification of assets, the amounts and classification of liabilities or other adjustments that might be necessary had the Company and the Group were not in a position to continue as a going concern. Cash Flows The Consolidated and the Company operating cash inflows amounted to 0.6 million and 1.9 million respectively. The outflows from investment activities at the end of the year 2013 amounted to 3.6 million for the Group and inflows of 0.01 million for the Company while there were inflows from financing activities equal to 3 million and 2 million for the Group and the Company respectively.
7 Investments In 2013, the Group made investments in total of 3.8 million, of which 0.6 million pertained to Parent Company investments whereas the investments realized by the subsidiary ETEM BULGARIA S.A. amounted to 3.1 million. Main financial ratios of the Group and the company are presented in the following table. Group Company RATIOS * * Gross profit margin 8.51% 11.75% 2.25% 10.63% (Gross profit/sales) Net profit margin (23.61%) (9.78%) (64.32%) (17.38%) (Net profit/sales) Debt/equity ratio (Loans/shareholders equity) Liquidity ratio (Current assets / current liabilities) Return on Equity (221.07%) (33.76%) (238.47%) (29.56%) (Net income / shareholders equity) Inventory turnover ratio (Inventories / cost of sales) x 360 days Receivable turnover ratio (Trade and other receivables/ Sales) x 360 days Payable turnover ratio (Suppliers and other payables / cost of sales) x 360 days * Adjusted amounts due to amended IAS 19 Employee benefits (see note 37).
8 IMPORTANT EVENTS FROM 1/1/2013 TO 31/12/2013 The important events that took place during the fiscal year 2013 are the following: i. Investments in ETEM subsidiaries and other holdings. During the fiscal year 2013, the changes in the holdings of the Group ETEM S.A. were as follows: a) The parent Company ETEM S.A. reclassified its investments in ENERGY SOLUTIONS S.A. and COPPERPROM LTD respectively. b) On 17 April 2013, ETEM BULGARIA S.A., established in Sofia, Bulgaria proceeded in a share capital increase of its fully owned subsidiary ΕΤΕΜ SYSTEMS SRL, established in Bucharest, Romania, by Euro 650,000 in cash. c) On 17/09/2013 the merger of the subsidiaries STEELMET S.A. and ETEM BULGARIA S.A., both established in Sofia, Bulgaria was completed, through the absorption of the first from the latter. The merger did not affect the Company s participation in ETEM BULGARIA S.A. which remains 100%. ii. Changes in the Management and administration of the Group a) According to the decision of the Board of Directors since 16/07/2013 as new non-executive independent members of the BoD were elected Messrs. Emmanouil Dryllis and Athanasios Koufopoulos instead of the resigned members Messrs. Nikolaos Galetas and Andreas Kyriazis. b) According to the decision of the Board of Directors since 06/09/2013 new members were elected as follows: Messrs. Emmanouil Kartsomichelakis, as an executive member, Thomas Purnell as a nonexecutive member and Athanasios Patsouras as an executive member instead of the resigned members Messrs. Ioannis Oikonomou, Dimitrios Kyriakopoulos and Charalampos Papanikolaou. According to the aforementioned decision the Vice Chairman Mr. Dimitrios Pavlakis appointed as a nonexecutive member. The aforementioned decisions of the Board of Directors were validated by the Extraordinary General Shareholders Meeting that held on 2nd October c) According to the decision of the Board of Directors since 16/09/2013 Mr. Karakostas Dimitrios appointed to the position of the Internal Auditor instead of Mr. Mousouris Spyridon. iii. Annual Ordinary General Meeting of Shareholders On 13 June 2013, the Annual Ordinary General Meeting of the Shareholders of ETEM S.A. took place. The meeting was attended by persons representing 71.84% of the company s shares, and they passed the following resolutions unanimously: 1. They approved the annual financial statements for the fiscal year 2012, together with the reports of the Board of Directors and the Auditors thereupon. 2. They released the members of the Board of Directors and the Auditors from all liability with regard to the fiscal year They appointed the audit firm DFK PD AUDIT S.A.. for the fiscal year 2013, in accordance with their offer. 4. They approved the fees to be paid to the members of the Board of Directors for the services they provided to the company according to the provisions of the article 24 par. 2 of Law 2190/1920.
9 iv. Extraordinary General Shareholder Meeting (02/10/2013) On 2 October 2013, an extraordinary General Meeting of the Shareholders of ETEM S.A. took place. The meeting was attended by persons representing 71.84% of the company s shares, and on the topics of the General Meeting they decided the following unanimously: 1. The accreditation of the election of the following contemporary members of the Board: a) Messrs. Koufopoulos Athanasios and Dryllis Emmanouil as non-executive independent members on 16/07/2013 instead of the abdicated Messrs. Kyriazis Andreas and Galetas Nikolaos, also non- executive independent members and b) Messrs. Kartsomichelakis Emmanouil, as an executive member, Patsouras Athanasios as an executive member and Purnell Thomas, as a non-executive member on 06/09/2013 instead of the abdicated Messrs. Kyriakopoulos Dimitrios, Economou Ioannis and Papanikolaou Charalampos 2. The election as new members of the Audit Committee of the Company according to art.37 of the law 3693/2008 of Messrs. Koufopoulos Athanasios, non-executive independent member, Dryllis Emmanouil, non-executive independent member and Pavlakis Dimitrios non-executive Vice President instead of the abdicated Messrs. Kyriazis Andreas, Galetas Nikolaos and Papanikolaou Charalampos, already mentioned on the previous topic. v. Extraordinary General Shareholder Meeting (28/11/2013) On 28 November 2013, an extraordinary General Meeting of the Shareholders of ETEM S.A. took place. The meeting was attended by persons representing 71.56% of the company s shares, and on the topics of the General Meeting they decided the following unanimously. 1. The issuance of joint bond secured loan with a total nominal value Euro 38,254,000, with five (5) years duration with option to extend for two (2) more years in total. 2. The issuance of mid-term common bond loans of the Company with a total nominal value Euro 20,000,000 with a short-term duration. A detailed account of the resolutions passed by the Annual Ordinary General Meeting and the Extraordinary General Shareholders Meetings is posted on the ΕΤΕΜ Website ( and on the Website of the Athens Stock Exchange ( II. PROSPECTS FOR THE YEAR 2014 AND MAIN RISKS AND UNCERTAINTIES FOR THE YEAR i. Prospects The year 2014 is also expected to be difficult regarding the demand for aluminium extruded products not only in Greece but in the area of Balkans in general. The export orientation of the Group, mainly in Central and Northern Europe and in the markets of Asia and Africa, as well as the dedication to the development of high tech added value products, are of a top priority and strategic choice of the Management, not only for 2014 but for the medium-term horizon. At the level of ETEM Group, investments in machinery amounting to Euro 5 m. have been scheduled for the year 2014 in order to improve the automation and modernization of the production process. Moreover, these investments, will create further production subunits for processing the finished products and adding value. Finally, Management has undertaken the major commitment tο evaluate all the available choices regarding the improvement of the parent Company s equity which will ensure the sustainability and the continuation of its presence in the extrusion sector.
10 ii. Main risks and uncertainties The company and its subsidiaries apply risk management policies so that risks can be promptly identified and analyzed, risk-taking limits can be set, and suitable risk controls can be implemented. Supervision of such policies has been assigned to the Internal Audit Department, which conducts ordinary and extraordinary audits regarding the application of procedures, whose findings are disclosed to the company s Board of Directors. Credit Risk Credit risk is the risk of loss in the event that a customer or third party to a financial transaction does not fulfil his contractual obligations and is mainly related to trade receivables and securities investments. (a) Trade and other receivables The company and its subsidiaries have credit control departments and have implemented appropriate procedures to ensure the maximum possible security of their trade receivables. Each customer is scrutinized separately as to his credit capacity, and then appropriate payment terms are proposed, such as limits and deadlines for payment of liabilities. Furthermore, the company and its subsidiaries insure their trade receivables with insurance companies to the maximum possible degree, and domestic sales are mostly covered by Bank Credits. (b) Investments The investments of the Group are classified pursuant to the purpose for which they were acquired. The Management decides on the appropriate classification of the investment during the time such was realized and reviews the classification on each presentation date. (c) Guarantees According to the Group s policy, no collateral is provided; however, if the Board of Directors decides so in exceptional cases, such collateral may be provided to subsidiaries. Liquidity risk Liquidity risk consists in the Group not being in a position to meet its financial liabilities when these expire. The approach adopted by the Group regarding liquidity management is to ensure, by holding all absolutely necessary cash and sufficient credit limits from co-operating banks, that the Group will always have sufficient liquidity to meet its obligations when these expire under normal and adverse circumstances without incurring any inadmissible losses or jeopardizing the Group s reputation. In order to avoid liquidity risks, the Group sets up a provision for cash flows for a year when preparing the annual budget and a monthly rolling provision of three months so as to ensure sufficient cash in hand to meet its operating needs, including coverage of its financial obligations. This policy does not take into account the relevant effect from extreme conditions that cannot be foreseen. Market risk Market risk is the risk of changes in the prices of raw materials, in exchange rates and interest rates that have an effect on the Group s results or the value of its financial instruments. The purpose of market risk management is to control the Group s exposure to these risks in the context of acceptable parameters while optimizing returns. The Group enters into transactions with derivative financial instruments so as to hedge a part of the risks arising from market conditions.
11 (a)) Raw material (aluminium) price fluctuation risk The Group bases a part of its purchases and sales on market prices/ ratios relating to the price of aluminium used and contained in its products. The risk from metal price fluctuation is covered by hedging instruments (futures on London Metal Exchange-LME). The Group, however, does not use hedging instruments for the entire stock of its operation and, as a result, any drop in metal prices may have a negative effect on its results through stocks depreciation. (b) Foreign exchange risk The Group is exposed to foreign exchange risk with regard to its purchases and sales. The currencies used to effect the majority of such transactions are mainly Euro, USD, GBP, RON, the Serbian dinar, and the Bulgarian leva. If the foreign currency was increased by 10% in relation to Euro, the effect in the income statement and in shareholders equity would be: Amount in Euros USD 1,798 2,120 GBP 22,848 23,638 LEV 233,786 45,562 RON 148, ,141 Serbian Dinar 93,645 89, USD 1,313 1,457 GBP 16,962 16,974 LEV - - RON - - Serbian Dinar - - If the foreign currency was depreciated by 10% in relation to Euro, the effect in the income statement and in shareholders equity would be: Amount in Euros USD (1,471) (1,734) GBP (18,694) (19,340) LEV (191,280) (37,278) RON (121,184) (122,842) Serbian Dinar (76,619) (73,130) USD (1,074) (1,192) GBP (13,878) (13,888) LEV - - RON - - Serbian Dinar - - Loan interest is denominated in the same currency with that of cash flows, which arises from the Group s operating activities and is mostly Euro.
12 The investments of the Group in other subsidiaries are not hedged because these exchange positions are considered to be long-term. (c) Interest rate risk The Group finances its investments and its working capital needs through bank loans and bond loans, resulting in additional interest rate charges in the income statement. Any upward trend of interest rates will have a negative effect on results since the Group will be charged with additional borrowing costs. If interest rates were increased by 25 basis points, the effect in the income statement and in shareholders equity would be: Amount in Euros Floating rate (227,275) (228,043) Interest rate swap Floating rate (149,370) (138,604) Interest rate swap - - If interest rates were decreased by 25 basis points, the effect in the income statement and in shareholders equity would be: Amount in Euros Floating rate 227, ,043 Interest rate swap Floating rate 149, ,604 Interest rate swap - - Capital management The Board of Director s policy consists in maintaining a strong capital base to ensure investors, creditors and market trust in the Group and to allow Group activities to expand in the future. The Board of Directors monitors the return on capital which is defined by the Group as net results divided by total equity, excluding non-convertible preference shares and non-controlling interests. The Board of Directors also monitors the level of dividends distributed to holders of common shares. The Board of Directors tries to maintain balance between higher returns that would be feasible through higher borrowing levels and the advantages and security offered by a strong and robust capital structure. The Group does not have a specific plan for treasury shares purchase. There were no changes in the approach adopted by the Group in relation to capital management during the year 2013.
13 Subsequent events No significant subsequent events have occurred after December 31, Groups management is monitoring closely the political and economic developments in Ukraine, where the subsidiary of the Group LLC ETEM SYSTEMS is established. These developments are not expected to have a material effect in the Group s financial position.
14 III. SIGNIFICANT TRANSACTIONS WITH AFFILIATED ENTITIES A summary of ETEM Group's transactions under arm s length with associates and other affiliated entities follows: (Amounts in Euros) Company Sale of goods, services & fixed assets Purchase of goods, services & fixed assets Receivables Liabilities ELVAL S.A. 7,051,373 25,139,754 11,586 10,496,576 ELVAL COLOUR S.A. 78,602 2,314,632 65,845 3,418,712 METAL AGENCIES LTD 3,255,347 5, ,915 84,690 SYMETAL S.A. 235,170 1,542,293 57, ,719 SOFIA MED S.A. 2,693 1,790, ,929 84,643 VIOMAL S.A. 518, , ,094 83,511 STEELMET ROMANIA S.A. 413, ,454 7,330 99,321 CCS S.A. 29, ,445 9, ,033 STEELMET S.A , ,675 OTHER COMPANIES 314,060 1,959, ,667 1,303,449 TOTAL 11,898,896 34,585,247 1,442,466 16,470,329 The transactions of parent company ETEM S.A. with subsidiaries, associates and affiliated entities are presented below: (Amounts in Euros) Company Sale of goods, services & fixed assets SUBSIDIARIES Purchase of goods, services & fixed assets Receivables Liabilities ETEM BULGARIA S.A. 3,304,525 4,281, ,517 - ALUBUILD SRL - - 1,955,614 - AL AMAR S.A ,130 - ETEM ALBANIA SHPK 14,865 90, ,975 - ETEM SYSTEMS SRL 48,150 3,521 38,470 3,521 QUANTUM PROFILES S.A ,962 - ETEM SCG DOO 17, LLC ETEM SYSTEMS UKRAINE SUBSIDIARIES TOTAL 3,384,587 4,375,587 3,757,843 3,521 (Amounts in Euros) Company (*) AFFILIATED ENTITIES Sale of goods, services & fixed assets Purchase of goods, services & fixed assets Receivables Liabilities ELVAL S.A. 1,593,355 6,761,153-4,231,523 STEELMET S.A , ,675 VIOMAL S.A. 92, ,135 21,888 83,511 ΤΕΚΑ SYSTEMS S.A. - 98, ,812 METAL AGENCIES LTD ,294 84,690 SYMETAL S.A. 176, ,927 - VIEXAL S.A ,048-8,333 ENERGY SOLUTIONS S.A ,221 - TEPROMETAL AG - 47,518-82,313 OTHER COMPANIES 80,861 56,819 93,262 92,806 AFFILIATED ENTITIES TOTAL 1,943,756 7,946, ,592 5,109,663 S GRAND TOTAL 5,328,343 12,322,535 4,239,435 5,113,184 * Companies that belong to the VIOHALCO S.A. Group, parent company of ELVAL S.A. (Basic shareholder of ETEM S.A.).
15 Benefits to members of the Board of Directors and Key Management Personnel Benefits paid to executive officers and members of the Management in 2013 amounted to Euro 499,178 (2012: Euro 762,058) for the Company and Euro 587,326 (2012: Euro 818,788) for the Group. IV. Explanatory Report of the Board of Directors pursuant to article 4 par. 7 and 8 of Law 3556/2007 a) Structure of Share Capital The Company s share capital amounts to Euro 9,302,855 and is divided into 30,009,210 ordinary unregistered shares with a nominal value of Euro 0.31 each. All shares are listed and traded in the Mid- Small Caps equities market of Athens Stock Exchange. The shares of the Company are dematerialized, unregistered and have voting rights. Pursuant to the Company s Articles of Association, the rights and obligations of shareholders are as follows: i) Right on dividend from the annual profits of the Company. Dividend per share is paid to its holder within two (2) months from the date the General Meeting having approved the financial statements was held. The right to dividend collection is deleted following five (5) years from the end of the year during which its distribution was approved by the General Meeting. ii) Pre-emption right to each rise in share capital and subscription for new shares. iii) Right to participate in the General Meeting of shareholders. iv) The attribute of shareholder automatically signifies that the latter accepts the Company s Articles of Association and the decisions made by its bodies provided they are in line with such Articles and Law. v) The shares of the Company are indivisible and the Company acknowledges only a single owner of each share. All co-owners of a share by entirety as well as those having the usufruct or bare ownership thereof shall be represented at the General Meeting by a single person appointed by the same following agreement. In case of disagreement, the share of the foregoing persons shall not be represented. iv) The liability of shareholders shall be limited to the nominal capital of each share. b) Restrictions on transfer of Company shares Shares of the Company are transferred as provided by law and the Articles of Association do not include any restrictions on the transfer of shares. c) Significant direct or indirect holdings in the sense of articles 9 to 11 of Law 3556/2007 On 31/12/2013, the significant (over 5%) holdings are established as follows: ELVAL S.A.: holding 70.78% of the share capital (Parent Company direct holding) VIOHALCO S.A.: holding 72.62% of the total voting rights (Parent Company of ELVAL S.A.) d) Shares conferring special control rights None of the Company shares carry any special rights of control. e) Restrictions on voting right The Company s Articles of Association do not include any restrictions on the voting rights arising from its shares. The rules of the Company s Articles of Association regulating voting issues are set forth in Article 24.
16 f) Agreements between Shareholders of the Company The Company has not been notified of any agreements between its shareholders that may entail restrictions on the transfer of its shares or on the exercise of the voting rights arising from its shares. g) Rules for the appointment and substitution of BoD members and for the amendment of the Articles of Association The rules stipulated by the Company s Articles of Association for the appointment and substitution of Board of Directors members and for the amendments of the Articles of Association do not differ from the stipulations of Codified Law 2190/1920. h) Competence of the BoD to issue new shares or purchase own shares -Article 6 par.1 of the Company s Articles of Association stipulates that only the General Meeting of shareholders held with a two-thirds (2/3) quorum of the paid-up share capital shall be entitled to increase the Company's share capital through the issue of new shares by way of decision made by a 2/3 majority of the represented votes. -The Company s Articles of Association do not stipulate the assignment of any rights falling under the competence of the General Meeting with respect to the issue of shares and share capital increase to the BoD or certain members of the latter. -The Board of Directors shall purchase own shares in the context of a decision made by the General Meeting pursuant to Article 16 par of Codified Law 2190/1920. i) Significant agreements put into force, amended or terminated in the event of a change in the control of the Company The agreement of joint bond secured loan of the Company, which was fully taken over by Banks and refers to Note 19 of the financial statements (separate and consolidated Euro 38,254,000 which is long term as a whole) include a clause on the change of control which provides the bond-holders with the right of early termination. There are no other agreements that are put into force, amended or terminated in the event of a change in the control of the Company. j) Agreements with members of the Board of Directors or personnel of the Company There are no agreements concluded between the Company and members of its BoD or its personnel that stipulate the payment of compensation especially in the case of resignation or dismissal without good reason or termination of their period of office or employment.
17 CORPORATE GOVERNANCE STATEMENT The current statement has been conducted in accordance with requirements of Law 3873/10. In accordance with article 2 of L.3873/2010 we have the following: 1. Code of Corporate Governance The Company has adopted the practices of Corporate Governance as for its management and operation, as these are specified under the applicable institutional framework and the Hellenic Corporate Governance Code (HCGC), (hereinafter the Code ) which is available on the website: In the context of preparation of the Annual Report of the Board of Directors, the Company reviewed the Code. Based on this review, the Company concluded that it applies the special practices for listed companies which are set out and described in the Code, with the exception of the following practices for which the respective explanations are listed below: - Part Α.ΙΙ 2.3 Size and composition of the Board of Directors. The number of independent non-executive members of the current Board of Directors are two (2) out of nine (9) and, therefore, their number is less than the one third of all its members, as indicated in the Code. Under the current circumstances, it was deemed that the increase in the number of independent members would not improve the company's effective operation. - Part Α.V 5.5 Nomination of Board of Directors members. There was no committee to nominate members until the time this Statement was drafted for the same reasons as explained above. - Part Α.VII Evaluation of Board of Directors and its Committees. Until the time this Statement was prepared, the Company had not chosen any specific collective method to evaluate the effectiveness of the Board of Directors and its Committees. - Part C.I 1.6. Level and structure of remuneration. Until the time this Statement was prepared, there was no Remuneration Committee. The issue will be soon reviewed. Management has proceeded to the establishment of a task group with the mission to study and overview all the necessary actions needed in order to establish, in a reasonable time, all the necessary committees in accordance with the Code of Corporate Governance and to comply with the practices of the above Code. The Company does not implement any other Corporate Governance practices than the special practices of the Code and the provisions of the Law 3873/ Main characteristics of the Internal Control and Risk Management Systems in relation to the preparation of the Financial Statements and financial reports. i. Description of main characteristics and details of the Internal Control and Risk Management Systems - in relation to the preparation of the consolidated financial statements. The Internal Control System of the Company covers the control procedures involving the operation of the Company, its compliance with the requirements of supervisory authorities, risk management and preparation of financial reports. The Internal Audit Department controls the appropiate implementation of each procedure and internal control system regardless of their accounting or non-accounting content and evaluates the enterprise by reviewing its activities, acting as a separate service to the Management.
18 The Internal Control System aims, among others, to secure the completeness and reliability of the data and information required for the accurate and timely preparation of the Company s financial statements. In relation to the preparation of financial statements, the Company reports that the financial reporting process of ETEM S.A uses an accounting system that is adequate for reporting to Management and to external users. The financial statements and other analyses reported to Management on a quarterly basis are prepared on a separate and consolidated basis in accordance with the International Financial Reporting Standards, as adopted by the European Union. These financial statements prepared for reporting purposes to Management, are also prepared for the purposes of publication in accordance with applicable regulations on a quarterly basis. Both management information and financial reports to be published include all the necessary details about an updated internal control system including analyses of sales, cost/expenses and operating profits as well as other data and indexes. All reports to Management include the data of the current period compared to the respective data of the budget, as the budget has been approved by the Board of Directors, and the data of the respective previous financial year. Published interim and annual financial statements include all necessary information and disclosures about the financial statements, in accordance with the International Financial Reporting Standards, as adopted by the European Union, and are reviewed by the Audit Committee and approved by the Board of Directors. Controls are implemented with respect to: a) risk identification and evaluation as for the reliability of financial statements; b) management planning and monitoring of financial figures; c) fraud prevention and disclosure; d) roles and responsibilities of executives; e) year end financial reporting process including consolidation (e.g. recorded procedures, access, approvals, agreements, etc.) and f) safeguarding of the data provided by information systems. The preparation of internal reports to Management and the reports required under Codified Law 2190/1920 and by the supervisory authorities are prepared by the Financial Services Division, which is staffed with the appropriate and experienced executives for the above purposes. Management takes the necessary steps to ensure that these executives are adequately trained and updated about any changes in accounting and tax regulation concerning both the Company and the Group. The Company has established separate procedures in order to collect the necessary information from the subsidiaries, and secures the reconciliation of intercompany transactions and the implementation of Group accounting policies. ii. Annual evaluation of corporate strategy, main business risks and Internal Control Systems. The Company s Board of Directors states that it has examined the main business risks facing the Group as well as the Internal Control Systems. On an annual basis, the Board of Directors reviews the corporate strategy, main business risks and Internal Control Systems. iii. Provision of non-audit services to the Company by its legal auditors and evaluation of the effect this fact may have on the objectivity and effectiveness of mandatory audit, taking also into consideration the provisions of Law 3693/2008. The statutory auditors of the Company for the fiscal year 2013, i.e. DFK PD AUDIT S.A., who have been elected by the Ordinary General Meeting of the Company s Shareholders on 13 June 2013, do not provide non-audit services to the Company and its subsidiaries apart from those prescribed under law.
19 3. Public takeover offers - Information - There are no binding takeover bids and/or rules of mandatory assignment and mandatory takeover of the Company's shares or any statutory provision on takeover. - There are no third-party public offers to take over the Company s share capital during the last and current year. - In case the Company takes part in such a procedure, this will take place in accordance with European and Greek regulation. 4. General Meeting of the Shareholders and rights of shareholders The General Meeting is convened and operates in compliance with the provisions of the Articles of Association and the relevant provisions of Law 2190/1920, as amended and in force today. The Company makes the necessary publications in line with the provisions of Law 3884/2010 and generally takes all steps required for the timely and appropriate information of shareholders in regard to the exercise of their rights. The latter is ensured by publishing the invitations of General Meetings and uploading them on the Company s website, the text of which contains a detailed description of shareholders rights and exercising rules. 5. Composition and operation of the Board of Directors, the Supervisory Bodies and the Committees of the Company Roles and responsibilities of the Board of Directors The Company s Board of Directors is responsible for the long-term strategy and the operational targets of the Company and generally for the control and decision-making within the framework of the provisions of Codified Law 2190/1920 and the Articles of Association, and for compliance with corporate governance principles. The Board of Directors meetings are held on a regular basis in order to perform its duties effectively. The role and responsibilities of the Board of Directors are summarized as follows: Supervision and monitoring of Company operations as well as control of the achievement of business goals and long-term plans; Formulation and specification of Company core values and objectives; Securing the alignment of the adopted strategy with Company goals. The Board of Directors ensures that there are no situations of conflict of interests and examines any incidents or cases of deviation from the confidential information policy; Ensuring the reliability and approval of the Company s Financial Statements prior to their final approval by the Ordinary General Meeting; Securing the execution of its business activity on a daily basis through a special authorization system, while other affairs falling under its scope of responsibility are implemented under special decisions. The secretary of the Board of Directors is appointed for each Board of Directors meeting and his main responsibilities are to support the Chairman and the operation of the Board in general. The existing Board of Directors of the Company consists of 9 members of whom: 4 are executive members (other Members) 3 are non-executive members (Chairman, Vice-Chairman, Member) 2 are independent members (Other Members)
20 The current Board of Directors of ETEM S.A LIGHT METALS. consists of the following: Kallergis Markos, non- executive member, Chairman, Pavlakis Dimitrios, non-executive member, Vice chairman Mentzelopoulos Georgios, executive member Dryllis Emmanouil, independent non-executive member Kartsomichelakis Emmanouil, executive member Patsouras Athanasios, executive member Koufopoulos Athanasios, independent non-executive member Purnell Thomas, non-executive member Katopodis Spyridon, executive member Brief curriculum vitae of the Board of Directors members is presented below: Markos Kallergis, Chairman of Board of Directors, non-executive member Mr Markos Kallergis is a Chairman of Board of Directors since the establishment of the Company. He is a graduate mechanical-electrical engineer of the National Technical University of Athens. From 1969 to 1971 worked to the company OWENS ILLINOIS of Bothosakis Group. In 1971 as a co-founder of VIOHALCO Group, established ETEM S.A. Since then and until 2008 was Managing Director of ETEM S.A. and then a non-executive Chairman of the Board of Directors of ETEM S.A. Pavlakis Dimitrios, Vice chairman, non-executive member Mr Pavlakis Dimitrios is a Vice chairman of Board of Directors of the company since He is a graduate of Psychics and Engineering Department of Dartmouth College. He holds also an MSc in Engineering and in Business Administration (Μ.Β.Α.) from Dartmouth College. In his long term career Mr Pavlakis has been a vice chairman of Salomnon Brothers Inc., founder and Executive member of Alpha Finance SA and Managing Director of E.T.E.V.A. From 2001 and until today he provides consultancy services to VIOHALCO Group. From 2008 to 2010 he was a General Manager of ETEM S.A. Mentzelopoulos Georgios, executive member Mr Mentzelopoulos is a member of Board of Directors of the company since He is a graduate of Athens University of Economics and Business. From 1996 until 2004 he worked as a Finance Manager of Corinth Pipeworks SA. From 2004 until 2008 he worked as a Finance and Administrator Manager of Group Yzatis. In 2008 he returned to VIOHALCO Group and worked as a CFO of Stomana Industry SA and then as a Financial Controller of VIOHALCO Group. Since July 2010 is a General Manager of ETEM S.A. Katopodis Spyridon, executive member Mr Katopodis is a member of Board of Directors since He is a graduate of Chemical Engineers of National Technical University of Athens and holds a MSc of Business Administration. In his long term professional career, he managed to promote from the lower levels of the Commercial Department to the position of Commercial Manager, which holds until today. Important steps in his career was when he was an Exports Manager in EVGA from 1996 to 1999 and when he was a Commercial Manager of M.J. Maillis Group from 1999 to April On July 2008 became an Exports Manager of ETEM S.A. and on May 2010 was promoted to Commercial Manager of ETEM Group. Kartsomichelakis Emmanouil, executive member Mr Kartsomichelakis is a member of company s executive team since 2007 and currently is company s Finance Manager since He is a graduate of Business Administration of Piraeus University and holds a MSc in Finance from Lancaster University. From 2005 to 2007 worked in the Internal Audit department of VIOHALCO Group. In the past he worked also in the Banking sector. Patsouras Athanasios, executive member Mr Patsouras is a graduate from Mechanical Electrical Engineer department of National Technical University of Athens and holds a MSc of Engineering Business Management & Computation of Universities of Warwick and Oxford respectively. Is a member of company s executive team since 2003, as in charge of the department of Maintenance and New projects and since 2008 is the plant director of the factory situated in Magoula.
21 Purnell Thomas, non-executive member Mr Purnell is a graduate of Business Administration and holds a MSc of Financial Management from Greenwich University. He worked abroad and specifically in England as an executive of Human Resources department of retailing sector and has also experience in banking sector in Greece. He joined the executive team of VIOHALCO group at 2003 as a Human Resources Manager of ETEM SA and since 2013 is a the Administrative Director of ETEM BULGARIA SA, a subsidiary company of ETEM group. Koufopoulos Athanasios, independent non-executive member Mr Koufopoulos is a civil engineer and is a graduate from National Technical University of Athens. At 1954 established a technical office providing services for important projects in Athens and during also his career he was a consultant on Hellenic Telecommunications Organization and ERT. Dryllis Emmanouil, independent non-executive member Mr Dryllis is a graduate of University of Athens Law School. He worked in Emporiki Bank and in Olympic Airways and during his career he also had cooperation with Ship Owing Firm Chandris and Travel Agency Manos. For three years owned a wood exports firm. The members of Board of Directors are appointed for a period of three years from Shareholders General Meeting. The members of Company s Board of Directors were appointed from the Ordinary General Shareholder s Meeting of 18 June 2011 with their term expiring on the first semester of The composition of the initial Board of Directors has changed based on the decisions of Shareholders General Meetings of 28 June 2012 and 2 October The Board of Directors had 47 meetings during 2013 and all the members have participated in person. Audit Committee i. Description of the composition, operation, work, responsibilities and the issues discussed during Committee meetings The Audit Committee, which is elected and operates according to Law 3693/2008 (Article 37), consists of three non-executive members of the Board of Directors, two of which are independent, and their main tasks, in the context of the obligations described by the above law, is to support the Company s Board of Directors onachieving its mission to safeguard the effectiveness of accounting and financial systems, audit mechanisms, business risk management systems, assure compliance with the legal and regulatory framework, and effectively implement Corporate Governance principles. More specifically, the Audit Committee has the following responsibilities: Responsibilities - To examine the effectiveness of all Management levels in relation to the safeguarding of the resources they manage and their compliance with the Company s established policy and procedures; - To evaluate the procedures and data in terms of adequacy as for the achievement of objectives and assess the policy and the program concerning the activity under review; - To control periodically the various activities of different divisions or departments in order to ensure that their actions are carried out regularly and are in compliance with Management instructions, Company s policy and procedures, and that these procedures follow Company s objectives and standards of management practice; - To review internal audit reports and specifically: - to evaluate the adequacy of their scope; - to confirm the accuracy of reports; - to examine the adequacy of documentation of the results.
22 The Audit Committee receives the following reports on audit activity: - Extraordinary reports - Quarterly financial reports - Annual audit reports - Corporate Governance Reports The Audit Committee examines and ensures the independence of the Company s internal auditors, is informed with the findings from internal auditors reports and is informed also with the Auditors Reports on the annual or interim financial statements of the Company. Also it recommends actions and procedures in order to resolve any findings or failures in the areas of financial reports or other important functions of the Company. According to the Audit Committee Regulation, the Audit Committee consists of two independent and non-executive members of the Board of Directors and one non-executive member who have the necessary knowledge and experience for the Committee s work. The existing Audit Committee consists of the following persons: Members: Dryllis Emmanouil, independent non-executive member of BoD Koufopoulos Athanasios, independent non-executive member of BoD Pavlakis Dimitrios, Vice chairman, non-executive member of BoD ii. Number of Committee meetings and frequency of each member s participation in meetings The Audit Committee met 4 times during 2013 having full quorum but was not attended by the statutory auditors as prescribed under the Code. iii. Evaluation of effectiveness and performance of the Committee Until the time this Statement was prepared, no special procedures had been established to evaluate the effectiveness of the Audit Committee. Company Management will establish such procedures in the future
23 DFK PD AUDIT S.A., Certified Auditors Accountants 4, Vasilissis Sofias ave., Athens, Greece. Tel: , Fax: INDEPENDENT CERTIFIED AUDITOR S ACCOUNTANT S REPORT To the Shareholders of ETEM S.A. LIGHT METALS Report on the Separate and Consolidated Financial Statements We have audited the accompanying separate and consolidated financial statements of ETEM S.A. LIGHT METALS which comprise the separate and consolidated statement of financial position as of 31 December 2013 and the separate and consolidated income statement and statement of comprehensive income, statement of changes in equity and cash flow statement for the year then ended and a summary of significant accounting policies and other explanatory information. Management s Responsibility for the Separate and Consolidated Financial Statements Management is responsible for the preparation and fair presentation of these separate and consolidated financial statements in accordance with International Financial Reporting Standards, as adopted by the European Union, and for such internal control as management determines is necessary to enable the preparation of separate and consolidated financial statements that are free from material misstatement, whether due to fraud or error. Auditor s Responsibility Our responsibility is to express an opinion on these separate and consolidated financial statements based on our audit. We conducted our audit in accordance with International Standards on Auditing. Those standards require that we comply with ethical requirements and plan and perform the audit to obtain reasonable assurance about whether the separate and consolidated financial statements are free from material misstatement. An audit involves performing procedures to obtain audit evidence about the amounts and disclosures in the separate and consolidated financial statements. The procedures selected depend on the auditor's judgment, including the assessment of the risks of material misstatement of the separate and consolidated financial statements, whether due to fraud or error. In making those risk assessments, the auditor considers internal control relevant to the entity's preparation and fair presentation of the separate and consolidated financial statements in order to design audit procedures that are appropriate in the circumstances, but not for the purpose of expressing an opinion on the effectiveness of the entity's internal control. An audit also includes evaluating the appropriateness of accounting policies used and the reasonableness of accounting estimates made by management, as well as evaluating the overall presentation of the separate and consolidated financial statements. We believe that the audit evidence we have obtained is sufficient and appropriate to provide a basis for our audit opinion.
24 Opinion In our opinion, the separate and consolidated financial statements present fairly, in all material respects, the financial position of ETEM S.A. LIGHT METALS and its subsidiaries as at December 31, 2013, and their financial performance and cash flows for the year then ended in accordance with International Financial Reporting Standards, as adopted by the European Union. Other matter The separate and consolidated financial statements of ETEM S.A LIGHT METALS for the year ended 31 December 2012 were audited by other auditors who expressed an unmodified opinion on those separate and consolidated statements on 25 February Reference on Other Legal and Regulatory Requirements a) The Board of Directors Report includes a statement of corporate governance which includes the information required by paragraph 3d of article 43a of Codified Law 2190/1920. b) We verified the conformity and consistency of the information given in the Board of Directors Report with the accompanying separate and consolidated financial statements in accordance with the requirements of articles 43a, 108 and 37 of codified Law 2190/1920. Athens, 24 March 2014 DFK PD AUDIT S.A. Certified Auditors Accountants 4 Vasilissis Sofias Avenue Athens, Greece SOEL Reg No 163 CERTIFIED AUDITOR ACCOUNTANT SPYROS GROUITS SOEL Reg No 27931
25 ΕΤΕΜ S.A. Annual Financial statements (separate and consolidated) December 31, 2013 The Chairman of the Board of Directors The General Manager and Finance Director Member of the Board of Directors Member of the Board of Directors MARKOS GEORGIOS SRYRIDON EMMANOUIL KALLERGIS MENTZELOPOULOS KATOPODIS KARTSOMICHELAKIS ID No.: ΑΚ ID N.: Χ ID N.: ΑΖ ID N.: ΑΚ Reg. No CLASS Α ΕΤΕΜ S.A. Commercial Registry No , S.A. Reg. No: 7777/06/Β/86/ Messogion Av., Athens
26 Contents Ι. Statements of financial position ΙΙ. Income statements III. Statements of comprehensive income ΙV. Statements of changes in equity V. Statements of cash flow Notes to the financial statements General information Significant accounting policies Basis of preparation of financial statements and Going Concern Basis of consolidation and investments Foreign currency translation Property plant and equipment and investment property Intangible Assets Impairment of non-financial assets Financial Assets Inventories Trade receivables Cash and cash equivalents Share Capital Borrowings Income Tax Employee benefits Grants Provisions Revenue recognition Leases Dividend distribution Financial Instruments Financial risk management and accounting policies applied Fair values Significant accounting estimates and judgments Segment Information Property, plant and equipment Intangible assets Investment property Investments in associates Investments in subsidiaries Available for sale securities Deferred Tax Inventories Trade and other receivables Financial Instruments fair value hierarchy Cash on hand and cash equivalents Share capital Other reserves Borrowings Employee benefits Government Grants Trade and other payables Provisions Expenses per function Payroll Cost Financial income / expenses Income tax expense Other Income Expenses Commitments Contingent liabilities-assets Transactions with related parties Earnings/(losses) per share Dividend per share Financial risk management Unaudited tax years Number of employees Restated amounts Subsequent events... 76
27 Ι. Statements of financial position Amounts in Euros Note 31/12/ /12/2012* 31/12/ /12/2012* ASSETS Non-current assets Property, plant and equipment 6 68,232,285 74,006,298 21,944,021 32,562,872 Intangible assets 7 1,109, , , ,784 Investment properties 8 1,506,164 6,278,497 1,506,164 1,382,832 Investments in associates 9 994,425 1,062, , ,347 Investments in subsidiaries ,432,744 22,432,744 Available-for-sale securities , , , ,317 Other receivables , , , ,060 Total non-current assets 72,261,050 82,980,490 46,770,436 57,585,956 Current assets Inventories 13 28,045,997 29,761,239 9,556,452 10,882,162 Trade and Other receivables 14 23,680,583 33,189,786 13,821,671 18,742,890 Receivables from income tax 27 90,723 1,162,449 84,074 1,141,756 Derivatives 15-4, Cash on hand and cash equivalents 16 2,508,025 2,522, , ,182 Total current assets 54,325,328 66,640,589 24,316,375 31,505,990 Total assets 126,586, ,621,079 71,086,811 89,091,946 EQUITY Capital and reserves attributable to equity holders of the Company Share capital 17 9,302,855 9,302,855 9,302,855 9,302,855 Share premium 32,349,082 32,349,082 32,349,082 32,349,082 Other reserves 18 19,695,854 19,101,477 17,402,606 17,402,606 Foreign exchange differences due to consolidation of foreign subsidiaries 18 (233,118) (127,362) - - Retained earnings (52,189,689) (31,864,054) (51,720,261) (34,432,013) Total equity attributable to equity holders of the Company 8,924,984 28,761,998 7,334,282 24,622,530 Non-controlling interests 92,139 92, Total equity 9,017,123 28,854,608 7,334,282 24,622,530 LIABILITIES Long-term liabilities Loans 19 38,254,000 12,450,000 38,254,000 12,450,000 Deferred tax liability 12 1,119,212 2,686, ,328 1,126,918 Employee benefits , , , ,682 Government grants 21 3,269,882 3,867, , ,690 Total long-term liabilities 42,934,142 19,924,269 39,303,053 15,140,290 Short-term liabilities Trade and other payables 22 25,749,679 29,734,412 9,127,901 10,471,804 Other tax liabilities , , ,967 40,117 Loans 19 47,944,736 70,562,686 15,000,608 38,799,319 Derivatives 15 69,011 17,886-17,886 Provisions , , ,000 - Total short-term liabilities 74,635, ,842,202 24,449,476 49,329,126 Total liabilities 117,569, ,766,471 63,752,529 64,469,416 Total equity and liabilities 126,586, ,621,079 71,086,811 89,091,946 * Adjusted amounts due to amended IAS 19 Employee benefits (see note 37). The adoption of the amended standard IAS 19 «Employee benefits» resulted in an increase of the Employee benefit liabilities by 182,201 and the attributable taxes recognized in deferred tax liabilities amounted to 36,440 for the Group and the Company respectively. As a result Group s and Company s Equity decreased by 145,761. The notes on pages 31 to 76 constitute an integral part of these financial statements. 27
28 ΙΙ. Income statements Amounts in Euros Note * * Sales 84,440,275 99,607,661 27,192,931 41,885,239 Cost of sales (77,252,272) (87,905,945) (26,580,733) (37,432,829) Gross profit 7,188,003 11,701, ,198 4,452,410 Selling and distribution expenses 24 (12,434,542) (14,074,776) (5,868,211) (6,156,589) Administrative expenses 24 (5,731,594) (6,444,945) (2,928,958) (3,764,448) Other operating income / (expenses) (net) 28 (5,760,279) 2,283,249 (7,279,072) 869,257 Operating results (16,738,412) (6,534,756) (15,464,043) (4,599,370) Finance income , ,727 28,511 29,841 Finance expense 26 (5,110,461) (5,395,208) (3,031,252) (2,831,589) Income from dividends 28 10,800 31,205 10,800 31,205 Share of the profit or loss of associates 28 (20,526) 34, Profit/ (loss) before tax (21,565,339) (11,363,031) (18,455,984) (7,369,913) Income tax expense 27 1,631,482 1,621, ,608 91,478 Net profit / (loss) of the year from continuing operations (19,933,857) (9,741,613) (17,490,376) (7,278,435) Distributed to: Equity holders of the Company (19,933,386) (9,739,948) (17,490,376) (7,278,435) Non-controlling interest (471) (1,665) - - (19,933,857) (9,741,613) (17,490,376) (7,278,435) Losses per share attributable to the Equity holders of thecompany for the period ( per share) Basic & diluted 32 (0.6642) (0.3246) (0.5828) (0.2425) * Adjusted amounts due to amended IAS 19 Employee benefits (see note 37). The adoption of the amended standard IAS 19 «Employee benefits» resulted in an decrease for the Group s and the Company s Cost of Sales by 5,548. The attributable taxes recognized in Groups and the Company s income tax amounted to 1,110. The notes on pages 31 to 76 constitute an integral part of these financial statements. 28
29 III. Statements of comprehensive income Amounts in Euros * * Profit/(loss) for the year (19,933,857) (9,741,613) (17,490,376) (7,278,435) Items that may be subsequently reclassified to profit or loss: Foreign currency translation differences (105,756) (76,180) - - Net change in fair value of cash flow hedges - 28,250-28,250 Income tax effect - (5,650) - (5,650) Total items that may be subsequently reclassified to profit or loss (105,756) (53,580) - 22,600 Items that will not be reclassified to profit or loss Gain/ (losses) due to amended IAS ,146 (188,965) 273,146 (188,965) Income tax effect (71,018) 37,793 (71,018) 37,793 Total items that will not be reclassified to profit or loss 202,128 (151,172) 202,128 (151,172) Other comprehensive income/(loss) for the year 96,372 (204,752) 202,128 (128,572) Total comprehensive income/(loss) for the year (19,837,485) (9,946,365) (17,288,248) (7,407,007) Attributable to: Equity holders of the Company (19,837,014) (9,944,700) (17,288,248) (7,407,007) Non-controlling interests (471) (1,665) - - (19,837,485) (9,946,365) (17,288,248) (7,407,007) * Adjusted amounts due to amended IAS 19 Employee benefits (see note 37). The notes on pages 31 to 76 constitute an integral part of these financial statements. 29
30 ΙV. Statements of changes in equity Amounts in Euros Share capital and share premium Fair value reserves Attributable to Owners of the Parent Other reserves Retained earnings Foreign exchange differences Total Noncontrolling interest Total Equity Balance as of 1 January ,651,937 (22,600) 19,101,477 (21,975,378) (51,182) 38,704,254 94,275 38,798,529 Amendment of IAS Adjusted balance as of 1 January 2012* 41,651,937 (22,600) 19,101,477 (21,974,405) (51,182) 38,705,227 94,275 38,799,502 Foreign currency translation differences (76,180) (76,180) - (76,180) Other comprehensive Income /(loss) for the year - 22,600 - (151,172) - (128,572) - (128,572) Profit / (loss) for the year (9,739,948) - (9,739,948) (1,665) (9,741,613) Total comprehensive income /( loss) for the year - 22,600 - (9,891,120) (76,180) (9,944,700) (1,665) (9,946,365) Change in Equity due to change in consolidation method of ΚΑΝΑL S.A ,471-1,471-1, ,471-1,471-1,471 Balance as of 31 December 2012* 41,651,937-19,101,477 (31,864,054) (127,362) 28,761,998 92,610 28,854, Balance as of 1 January ,651,937-19,101,477 (31,864,054) (127,362) 28,761,998 92,610 28,854,608 Foreign currency translation differences (105,756) (105,756) - (105,756) Other comprehensive Income /(loss) for the year , , ,128 Profit / (loss) for the year (19,933,386) - (19,933,386) (471) (19,933,857) Total comprehensive income /(loss) for the year (19,731,258) (105,756) (19,837,014) (471) (19,837,485) Transfers of reserves due to merger ,377 (594,377) ,377 (594,377) Balance as of 31 December ,651,937-19,695,854 (52,189,689) (233,118) 8,924,984 92,139 9,017,123 Share capital and share premium Fair value reserves Other reserves Retained losses Total Equity Balance as of 1 January ,651,937 (22,600) 17,402,606 (27,003,379) 32,028,564 Amendment of IAS Adjusted balance as of 1 January 2012* 41,651,937 (22,600) 17,402,606 (27,002,406) 32,029,537 Other comprehensive Income /(loss) for the year - 22,600 - (151,172) (128,572) Profit / (loss) for the year (7,278,435) (7,278,435) Total comprehensive income /( loss) for the year - 22,600 - (7,429,607) (7,407,007) Balance as of 31 December 2012* 41,651,937-17,402,606 (34,432,013) 24,622,530 Balance as of 1 January ,651,937-17,402,606 (34,432,013) 24,622,530 Other comprehensive Income /(loss) for the year , ,128 Profit / (loss) for the year (17,490,376) (17,490,376) Total comprehensive income /( loss) for the year (17,288,248) (17,288,248) Balance as of 31 December ,651,937-17,402,606 (51,720,261) 7,334,282 - * Adjusted amounts due to amended IAS 19 Employee benefits (see note 37). The notes on pages 31 to 76 constitute an integral part of these financial statements. 30
31 V. Statements of cash flow Amounts in Euros Note 1/1 to 31/12/2013 1/1 to 31/12/2012* 1/1 to 31/12/2013 1/1 to 31/12/2012* Operating activities Loss for the year (21,565,339) (11,363,031) (18,455,984) (7,369,913) Adjustments for: Depreciation-Amortization -Grants 6,7,8,2 1 6,037,985 5,669,596 3,043,179 2,687,368 Results from investing activities 12,591 47,258 (90,818) (41,316) Finance expense and related expenses 4,348,895 4,413,491 2,873,637 2,807,008 Provisions 1,566, ,199 2,268, ,668 Impairment loss on property, plant and equipment 6 7,500,000-7,500,000 - Impairment loss on investments , ,720 - Change in inventories 1,403,797 2,889, ,157 2,592,887 Change in trade and other receivables 9,619, ,350 4,640,361 2,485,805 Change in trade and other payables (excluding bank loan liabilities) (3,393,333) 5,548,554 (1,129,287) 529,751 Other adjustments (250,913) (127,450) (298,160) (184,465) Interest paid (4,810,250) (4,281,272) (3,088,253) (2,735,238) Net cash flows from / (used in) operating activities 622,394 3,875,607 (1,902,935) 873,555 Investing activities Purchase of property, plant and equipment 6,7 (3,762,337) (3,224,293) (554,169) (1,091,015) Proceeds from sale of property, plant and equipment 92,132 56, , ,579 Proceeds from sale of investment property - 260, Acquisition of subsidiaries (45,000) Proceeds from the sale of investments ,000 Dividends received 10,800 31,205 10,800 31,205 Interest received 30,180 90,424 22,019 17,924 Acquisition of interest in available for sale investments (6,000) - (6,000) - Net cash flows from / (used in) investing activities (3,635,225) (2,785,944) 12,643 (104,307) Financing activities Proceeds from borrowings 19 38,254,000-38,254,000 - Repayment of borrowings (28,107,143) (6,936,143) (27,250,000) (6,250,000) Net change in short-term loans (6,960,808) (1,592,440) (8,998,712) 647,225 Proceeds from /(return of) government grants (188,113) 1,242,143-1,242,143 Net cash flows from / (used in) financing activities 2,997,936 (7,286,440) 2,005,288 (4,360,632) Net (decrease) / increase in cash on hand and cash equivalents (14,895) (6,196,777) 114,996 (3,591,384) Cash and cash equivalents at the beginning of year 16 2,522,920 8,719, ,182 4,330,566 Cash and cash equivalents at the end of year 16 2,508,025 2,522, , ,182 * Adjusted amounts due to amended IAS 19 Employee benefits (see note 37). The notes on pages 31 to 76 constitute an integral part of these financial statements. 31
32 Notes to the financial statements 1. General information The accompanying financial statements consists of the separate financial statements of ETEM S.A ( the Company ) and the consolidated financial statements of the Company and its subsidiaries (together the Group ). The subsidiaries of the Group are presented in note 10 of the financial statements. The financial statements are subject to the approval of the Ordinary Shareholders Meeting which is expected to be held on May The main activities of the Group are the production and sale of architectural and industrial profile. Main activity of the Group is in Greece and in the area of Balkans and Europe. Company s shares are traded in Athens Stock Exchange. The Company is seated in Greece, 2-4 Mesogheion Ave, Athens and its website is The accompanying financial statements have been approved from Board of Directors at 24/03/2014. The parent Company of ETEM S.A is ELVAL S.A, which its shares are traded in Athens Stock Exchange. The Company and ELVAL S.A. are members of VIOHALCO Group. The direct and indirect participation of ELVAL S.A to ETEM S.A as at 31 December 2013 was 70,78% (2012: 70,78%). 2. Significant accounting policies The principal accounting policies adopted in the preparation of the accompanying financial statements are in accordance with IFRS and are set out below. These policies have been consistently applied in all the years presented unless otherwise stated. 2.1 Basis of preparation of financial statements and Going Concern These financial statements have been prepared in accordance with the lnternational Financial Reporting Standards (IFRS) issued by International Accounting Standards Board (IASB) as adopted by the European Union. The financial statements have been prepared under the historical cost except that derivatives and available for sale investments which are carried at fair value. The financial statements are presented in Euros except when otherwise indicated. The Group and the Company on a daily basis use generated cash flows and all the available funds together with the bank loans, in order to cover their working capital needs. As at 31 December 2013, total short-term liabilities of the Group and the Company exceeded by 20.3 million and 0.1 million respectively their short-term receivables and in addition the Group presented current year losses after tax amounted to 19.9 million with the total equity reaching the amount of 9 million. Within 2013 refinancing of the existing loans of the parent company ETEM S.A. was achieved with the long term bond loan of 38.3 million. It is noted that, ETEM S.A. received the comfort letter from its parent company ELVAL S.A. for providing support if necessary. Based on the above the financial statements of the Company and the Group have been prepared on a going concern basis. Therefore the accompanying financial statements do not include any adjustments regarding the recoverability and classification of assets, the amounts and classification of liabilities or other adjustments that might be necessary had the Company and the Group were not in a position to continue as a going concern. 32
33 The preparation of the financial statements in conformity with IFRS requires management to exercise its judgment in the process of applying the accounting estimates. It requires also the use of estimates, accounting policies and assumptions from the management which affect the reported assets and liabilities, the recognition of contingent liabilities, as well as the recognition of income and expenses in the financial statements. statements.the actual results may differ from these estimates. The areas involving a higher degree of judgement or complexity, or areas where assumptions and estimates are significant to the financial statements, are disclosed in Note 4. The financial statements have been prepared with the same accounting policies of the prior financial year, except for the adoption of the new or revised standards, amendments and/or interpretations that are mandatory for the periods beginning on or after the current fiscal year. The Group estimate of the adoption of these new standards, amendments and interpretations is presented below. Standards and interpretations effective for the current financial year IAS 1 (Amendment) «Presentation of Financial Statements»: The amendment requires entities to separate items presented in other comprehensive income into two groups, based on whether or not they may be recycled to profit or loss in the future. The amendment affects only the presentation of the statement of comprehensive income. IAS 19 (Amendment) «Employee Benefits»: This amendment makes significant changes to the recognition and measurement of defined benefit pension expense and termination benefits (eliminates the corridor approach) and to the disclosures for all employee benefits. The key changes relate mainly to recognition of actuarial gains and losses, recognition of past service cost / curtailment, measurement of pension expense, disclosure requirements, treatment of expenses and taxes relating to employee benefit plans and distinction between short-term and other long-term benefits. The impact of this amendment is further explained in Note 37. IAS 12 (Amendment) «Income Taxes»: The amendment to IAS 12 provides a practical approach for measuring deferred tax liabilities and deferred tax assets when investment property is measured using the fair value model in IAS 40 Investment Property. IFRS 13 «Fair Value Measurement»: IFRS 13 provides new guidance on fair value measurement and disclosure requirements. These requirements do not extend the use of fair value accounting but provide guidance on how it should be applied where its use is already required or permitted by other standards within IFRSs. IFRS 13 provides a precise definition of fair value and a single source of fair value measurement and disclosure requirements for use across IFRSs. Disclosure requirements are enhanced and apply to all assets and liabilities measured at fair value, not just financial ones. IFRS 7 (Amendment) «Financial Instruments»: «Disclosures»: The International Accounting Standards Board ( IASB ) has published this amendment to include information that will enable users of an entity s financial statements to evaluate the effect or potential effect of netting arrangements, including rights of set-off associated with the entity s recognized financial assets and recognized financial liabilities, on the entity s financial position. IFRIC 20 «Stripping costs in the production phase of a surface mine»: This interpretation sets out the accounting for overburden waste removal (stripping) costs in the production phase of a mine. The interpretation may require mining entities to write off existing stripping assets to opening retained earnings if the assets cannot be attributed to an identifiable component of an ore body. IFRIC 20 applies only to stripping costs that are incurred in surface mining activity during the production phase of the mine, while it does not address underground mining activity or oil and natural gas activity. The interpretation does not apply to the Group and the Company. Amendments to standards that form part of the IASB s 2011 annual improvements project The amendments set out below describe the key changes to IFRSs following the publication in May 2012 of the results of the IASB s annual improvements project 33
34 IAS 1 «Presentation of financial statements»: The amendment clarifies the disclosure requirements for comparative information when an entity provides a third balance sheet either (a) as required by IAS 8 Accounting policies, changes in accounting estimates and errors or (b) voluntarily. IAS 16 «Property, plant and equipment»: The amendment clarifies that spare parts and servicing equipment are classified as property, plant and equipment rather than inventory when they meet the definition of property, plant and equipment, i.e. when they are used for more than one period. IAS 32 «Financial instruments: Presentation»: The amendment clarifies that income tax related to distributions is recognized in the income statement and income tax related to the costs of equity transactions is recognized in equity, in accordance with IAS 12. IAS 34, «Interim financial reporting»: The amendment clarifies the disclosure requirements for segment assets and liabilities in interim financial statements, in line with the requirements of IFRS 8 Operating segments. Standards and Interpretations effective for periods beginning on or after January 1, 2014 and not early adopted by the Group IFRS 9 «Financial Instruments»: (effective for annual periods beginning on or after January 1, 2015). IFRS 9 is the first Phase of the IASB s project to replace IAS 39 and deals with the classification and measurement of financial assets and financial liabilities. The IASB intends to expand IFRS 9 in subsequent phases in order to add new requirements for impairment. The Group is currently investigating the impact of IFRS 9 on its financial statements. The Standard has not yet been endorsed by the EU. IFRS 9 «Financial Instruments»: Hedge accounting and amendments to IFRS 9, IFRS 7 and IAS 39 : (effective for annual periods beginning on or after January 1, 2015). The IASB has published IFRS 9 Hedge Accounting, the third phase of its replacement of IAS 39 which establishes a more principlesbased approach to hedge accounting and addresses inconsistencies and weaknesses in the current model in IAS 39. The second amendment requires changes in the fair value of an entity s debt attributable to changes in an entity s own credit risk to be recognised in other comprehensive income and the third amendment is the removal of the mandatory effective date of IFRS 9. These amendments have not yet been endorsed by the EU. IFRS 7 (Amendment) «Financial Instruments: Disclosures»: (effective for annual periods beginning on or after January 1, 2015). The amendment requires additional disclosures on transition from IAS 39 to IFRS 9. The amendment has not yet been endorsed by the EU. IAS 32 (Amendment) «Financial Instruments: Presentation»: (effective for annual periods beginning on or after January 1, 2014). This amendment to the application guidance in IAS 32 clarifies some of the requirements for offsetting financial assets and financial liabilities on the statement of financial position. Group of standards on consolidation and joint arrangements (effective for annual periods beginning on or after January 1, 2014) The IASB has published five new standards on consolidation and joint arrangements: IFRS 10, IFRS 11, IFRS 12, IAS 27 (amendment) and IAS 28 (amendment). These standards are effective for annual periods beginning on or after January 1, Earlier application is permitted only if the entire package of five standards is adopted at the same time. The Group is in the process of assessing the impact of the new standards on its consolidated financial statements. The main provisions are as follows: IFRS 10 «Consolidated Financial Statements»: IFRS 10 replaces all of the guidance on control and consolidation in IAS 27 and SIC 12. The new standard changes the definition of control for the purpose of determining which entities should be consolidated. This definition is supported by extensive application guidance that addresses the different ways in which a reporting entity (investor) might control another entity (investee). The revised definition of control focuses on the need to have both power (the 34
35 current ability to direct the activities that significantly influence returns) and variable returns (can be positive, negative or both) before control is present. The new standard also includes guidance on participating and protective rights, as well as on agency/ principal relationships. IFRS 11 «Joint Arrangements»: IFRS 11 provides for a more realistic reflection of joint arrangements by focusing on the rights and obligations of the arrangement, rather than its legal form. The types of joint arrangements are reduced to two: joint operations and joint ventures. Proportional consolidation of joint ventures is no longer allowed. Equity accounting is mandatory for participants in joint ventures. Entities that participate in joint operations will follow accounting much like that for joint assets or joint operations today. The standard also provides guidance for parties that participate in joint arrangements but do not have joint control. IFRS 12 «Disclosure of Interests in Other Entities»: IFRS 12 requires entities to disclose information, including significant judgments and assumptions, which enable users of financial statements to evaluate the nature, risks and financial effects associated with the entity s interests in subsidiaries, associates, joint arrangements and unconsolidated structured entities. An entity can provide any or all of the above disclosures without having to apply IFRS 12 in its entirety, or IFRS 10 or 11, or the amended IAS 27 or 28. IAS 27 (Amendment) «Separate Financial Statements»: This Standard is issued concurrently with IFRS 10 and together, the two IFRSs supersede IAS 27 Consolidated and Separate Financial Statements. The amended IAS 27 prescribes the accounting and disclosure requirements for investment in subsidiaries, joint ventures and associates when an entity prepares separate financial statements. At the same time, the IASB relocated to IAS 27 requirements from IAS 28 Investments in Associates and IAS 31 Interests in Joint Ventures regarding separate financial statements. IAS 28 (Amendment) «Investments in Associates and Joint Ventures»: IAS 28 Investments in Associates and Joint Ventures replaces IAS 28 Investments in Associates. The objective of this Standard is to prescribe the accounting for investments in associates and to set out the requirements for the application of the equity method when accounting for investments in associates and joint ventures, following the issue of IFRS 11. IFRS 10, IFRS 11 and IFRS 12 (Amendment) Consolidated financial statements, joint arrangements and disclosure of interests in other entities: Transition guidance : (effective for annual periods beginning on or after January 1, 2014). The amendment to the transition requirements in IFRSs 10, 11 and 12 clarifies the transition guidance in IFRS 10 and limits the requirements to provide comparative information for IFRS 12 disclosures only to the period that immediately precedes the first annual period of IFRS 12 application. Comparative disclosures are not required for interests in unconsolidated structured entities. IFRS 10, IFRS 12 and IAS 27 (Amendment) Investment entities : (effective for annual periods beginning on or after January 1, 2014). The amendment to IFRS 10 defines an investment entity and introduces an exception from consolidation. Many funds and similar entities that qualify as investment entities will be exempt from consolidating most of their subsidiaries, which will be accounted for at fair value through profit or loss, although controlled. The amendments to IFRS 12 introduce disclosures that an investment entity needs to make. These amendments have not yet been endorsed by the EU. IAS 36 (Amendment) «Recoverable amount disclosures for non-financial assets»: (effective for annual periods beginning on or after January 1, 2014). This amendment requires: a) disclosure of the recoverable amount of an asset or cash generating unit (CGU) when an impairment loss has been recognised or reversed and b) detailed disclosure of how the fair value less costs of disposal has been measured when an impairment loss has been recognised or reversed. Also, it removes the requirement to disclose recoverable amount when a CGU contains goodwill or indefinite lived intangible assets but there has been no impairment. This amendment has not yet been endorsed by the EU. IFRIC 21 «Levies»: (effective for annual periods beginning on or after January 1, 2014). This interpretation sets out the accounting for an obligation to pay a levy imposed by government that is not income tax. The interpretation clarifies that the obligating event that gives rise to a liability to pay a levy 35
36 (one of the criteria for the recognition of a liability according to IAS 37) is the activity described in the relevant legislation that triggers the payment of the levy. The interpretation could result in recognition of a liability later than today, particularly in connection with levies that are triggered by circumstances on a specific date. This interpretation has not yet been endorsed by the EU. IAS 39 (Amendment) Financial Instruments: Recognition and Measurement : (effective for annual periods beginning on or after January 1, 2014). This amendment will allow hedge accounting to continue in a situation where a derivative, which has been designated as a hedging instrument, is novated to effect clearing with a central counterparty as a result of laws or regulations, if specific conditions are met. IAS 19 (Amendment) «Employee Benefits» (effective for annual periods beginning on or after July 1, 2014). These narrow scope amendments apply to contributions from employees or third parties to defined benefit plans and simplify the accounting for contributions that are independent of the number of years of employee service, for example, employee contributions that are calculated according to a fixed percentage of salary. These amendments have not yet been endorsed by the EU. Annual Improvements to IFRSs 2012 (effective for annual periods beginning on or after July 1, 2014) The amendments set out below describe the key changes to seven IFRSs following the publication of the results of the IASB s cycle of the annual improvements project. The improvements have not yet been endorsed by the EU. IFRS 2 «Share-based payment»: The amendment clarifies the definition of a vesting condition and separately defines performance condition and service condition. IFRS 3 «Business combinations»: The amendment clarifies that an obligation to pay contingent consideration which meets the definition of a financial instrument is classified as a financial liability or as equity, on the basis of the definitions in IAS 32 Financial instruments: Presentation. It also clarifies that all non-equity contingent consideration, both financial and non-financial, is measured at fair value through profit or loss. IFRS 8 «Operating segments»: The amendment requires disclosure of the judgments made by management in aggregating operating segments. IFRS 13 «Fair value measurement»: The amendment clarifies that the standard does not remove the ability to measure short-term receivables and payables at invoice amounts in cases where the impact of not discounting is immaterial. IAS 16 «Property, plant and equipment» and IAS 38 «Intangible assets»: Both standards are amended to clarify how the gross carrying amount and the accumulated depreciation are treated where an entity uses the revaluation model. IAS 24 «Related party disclosures»: The standard is amended to include, as a related party, an entity that provides key management personnel services to the reporting entity or to the parent of the reporting entity. Annual Improvements to IFRSs 2013 (effective for annual periods beginning on or after July 1, 2014) The amendments set out below describe the key changes to four IFRSs following the publication of the results of the IASB s cycle of the annual improvements project. The improvements have not yet been endorsed by the EU. 36
37 IFRS 3 «Business combinations»: This amendment clarifies that IFRS 3 does not apply to the accounting for the formation of any joint arrangement under IFRS 11 in the financial statements of the joint arrangement itself. IFRS 13 «Fair value measurement»: The amendment clarifies that the portfolio exception in IFRS 13 applies to all contracts (including non-financial contracts) within the scope of IAS 39/IFRS 9. IAS 40 «Investment property»: The standard is amended to clarify that IAS 40 and IFRS 3 are not mutually exclusive. IFRS 1 «First-time adoption of International Financial Reporting Standards»: The amendment clarifies that a first-time adopter can use either the old or the new version of a revised standard when early adoption is permitted 2.2 Basis of consolidation and investments (a) Subsidiaries Subsidiaries are all the companies (including the special purpose entities) that are controlled by the Company directly or indirectly. Control exists when the Company has the power to govern the financial and operating policies of the subsidiaries so as to obtain benefits from their activities, generally accompanying a shareholding of more than one half of the voting rights. Subsidiaries are fully consolidated from the date on which control is transferred to the Group and cease to be consolidated from the date on which control ceases. In the separate financial statements, the Company measures holdings in subsidiaries at their acquisition cost less any impairment of their value. Business combinations are accounted for using the acquisition method as at the acquisition date, which is the date on which control is transferred to the Group. The consideration transferred for the acquisition of a subsidiary is the fair values of the assets transferred, the liabilities incurred to the former owners of the acquiree and the equity interests issued by the Group. The consideration transferred includes the fair value of any asset or liability resulting from a contingent consideration arrangement. Identifiable assets acquired and liabilities and contingent liabilities assumed in a business combination are measured initially at their fair values at the acquisition date. Goodwill is initially measured at cost being the excess of the aggregate of the consideration transferred and the fair value of non-controlling interest over the net identifiable assets acquired and liabilities assumed. If this consideration is lower than the fair value of the net assets of the subsidiary acquired, the difference is recognized in the income statement. If the business combination is achieved in stages, the acquisition date fair value of the acquirer s previously held equity interest in the acquiree is remeasured to fair value at the acquisition date through profit or loss. Any contingent consideration to be transferred by the acquirer is recognized at fair value at the acquisition date. Subsequent changes to the fair value of the contingent consideration is recognized in accordance with IAS 39 either in profit or loss or as a change to other comprehensive income. Contingent consideration that is classified as equity is not remeasured, and its subsequent settlement is accounted for within equity. For acquisitions that do not qualify as a business (i.e. group of fixed assets), the Group allocates the acquition cost to the fair values of the assets and liabilities acquired. These transactions do not create goodwill. Transactions, balances and unrealized gains between companies of the Group are eliminated. Unrealized losses, are also eliminated except for transactions that present impairment indications. The accounting policies of the subsidiaries have been adjusted to those adopted by the Group. 37
38 (b) Associates Associates are those entities in which the Group has significant influence upon, but not control over their financial and operating strategy, generally accompanying a shareholding of between 20% and 50% of the voting rights. Investments in associates in which the Group has significant influence are accounted for using the equity method of accounting. Under this method the investment is initially recognized at cost, and is adjusted to recognize the investor s share of the profit or loss after the date of acquisition. The Group s investment in associates includes goodwill identified on acquisition. In the separate financial statements, investments in subsidiaries and associates are accounted for at cost adjusted for any impairment where necessary. 2.3 Foreign currency translation (a) Functional and presentation currency. Items included in the financial statements of each entity in the Group are measured in the functional currency, which is the currency of the primary economic environment in which each Group entity operates. The consolidated financial statements are presented in Euros, which is the functional and presentation currency of the Company. (b) Transactions and balances Foreign currency transactions are translated into the functional currency using the exchange rates (i.e. spot rates) prevailing at the dates of the transactions or valuation where items are re-measured. Foreign exchange gains and losses resulting from the settlement of such transactions and from the translation at year-end exchange rates of monetary assets and liabilities denominated in foreign currencies are recognized in the income statement. (c) Group Companies The operating results and financial position of all group entities (none of which operate in a hyperinflationary economy) that have a functional currency different from the presentation currency are translated into the presentation currency as follows: i. Assets and liabilities for each balance sheet presented are translated at the closing rate at the date of the balance sheet, ii. iii. Income and expenses for each income statement are translated at average exchange rates (if the average exchange rate is not a reasonable approximation of the cumulative effect of the rate at the the date of the transaction, then income and expenses are translated at the rate of the transaction date) and All exchange differences resulting from the above are recognised in other comprehensive income and subsequently included in "foreign currency translation reserve". In the consolidated financial statemements, the exchange differences relating to the conversion of a net investment in a foreign operation are recognized in equity. On the disposal of a foreign operation, the cumulative exchange differences relating to that particular foreign operation, recognized in the "foreign currency translation reserve" within equity, are recognised in the income statement as part of the gain or loss on sale. Goodwill and fair value adjustments arising on the acquisition of a foreign entity are treated as assets and liabilities of the foreign entity and translated at the closing rate. 38
39 2.4 Property plant and equipment and investment property Property, plant and equipment is stated at historical cost less accumulated depreciation and impairment losses. Cost includes expenditure that is directly attributable to the acquisition of the items. Subsequent costs are included in the asset s carrying amount or recognized as a separate asset, as appropriate, only when it is probable that future economic benefits associated with the item will flow to the entity and the cost of the item can be measured reliably. All other repairs and maintenance are charged to the income statement as incurred. Depreciation, with the exception of land which is not depreciated, is calculated using the straight-line method to allocate the cost of the assets to their residual values over their estimated useful lives as follows: Buildings Machinery and other equipment Transportation means Telecommunication equipment Furniture and fittings years 5 25 years 4 8 years 4 6 years 3 7 years The assets residual values and useful lives are reviewed, and adjusted if appropriate, at each reporting date. Where the carrying amount of an asset is greater than its estimated recoverable amount, then an impairment loss is recognized as an expense in the income statement.. Gains and losses on disposals are determined by comparing proceeds with carrying amount and are included in operating profit. Investment property is measured initially at cost and after initial recognition are carried at cost less straight line depreciation and possible impairments. The useful life of investment property is measured in years. Investment property years 2.5 Intangible Assets Software Software licenses are estimated at their acquisition cost less accumulated amortisation and accumulated impairment losses. Depreciation is calculated using the straight line method to allocate the cost of the assets to their residual values over their estimated useful lives which is 3-5 years. Maintenance software costs are recognized in the income statement. 2.6 Impairment of non-financial assets Assets that have an indefinite useful life are not subject to amortisation and are tested annually for impairment. Assets that are subject to amortisation are reviewed for impairment whenever events or changes in circumstances indicate that the carrying amount may not be recoverable. An impairment loss is recognized, as an expense immediately, for the amount by which the asset s carrying amount exceeds its recoverable amount. The recoverable amount of an asset is the higher of its fair value less costs to sell and its value in use. In measuring value in use, estimated future cash flows are discounted to their present value using a pre-tax discount rate that reflects current market assessments of the time value of money and the risks specific to that asset. If an asset does not generate cash flows individually, the recoverable amount is determined for the cash generating unit to which the asset belongs. At each reporting date the Group and the Company assess whether there is an indication that an impairment loss recognized in prior periods may no longer exist. If any such indication exists, the Group and the Company estimate the 39
40 recoverable amount of that asset and the impairment loss is reversed, increasing the carrying amount of the asset to its recoverable amount, to the extent that the recoverable amount does not exceed the carrying value of the asset that would have been determined (net of amortization or depreciation) had no impairment loss been recognized for the asset in prior years. The impairment losses are recognized as expense in the income statement. 2.7 Financial Assets Group classifies its financial assets in 4 categories. The classification depends on the purpose for which the financial assets were acquired. Management determines the classification of its financial assets at initial recognition. (a) Financial assets at fair value through profit or loss Financial assets at fair value through profit or loss are financial assets held for trading. A financial asset is classified in this category if it is acquired principally for the purpose of selling in the short term. Assets in this category are classified as current assets if expected to be settled within 12 months, otherwise they are classified as noncurrent. (b) Loans and receivables Loans and receivables are non-derivative financial assets with fixed or determinable payments that are not quoted in an active market. They are included in current assets, except for maturities greater than 12 months after the end of the reporting period. These are classified as non-current assets. (c) Held for maturity Financial assets held for maturity include non derivative financial assets with fixed or determinable payments and a fixed maturity date, which the Group has the intention and ability to hold until maturity. During the current fiscal year the Group does not hold financial assets held for maturity. (d) Available for sale assets Available-for-sale financial assets are non-derivatives that are either designated in this category or not classified in any of the other categories. They are included in non-current assets unless the investment matures or management intends to dispose of it within 12 months of the end of the reporting period. Regular purchases and sales of financial assets are recognised on the trade-date. This is the date on which the group commits to purchase or sell the asset. Investments are initially recognized at fair value plus transaction costs for all financial assets not carried at fair value through profit or loss. Financial assets carried at fair value through profit or loss is initially recognized at fair value, and transaction costs are expensed in the income statement. Financial assets are derecognized when the rights to receive cash flows from the investments have expired or have been transferred and the Group has transferred substantially all risks and rewards of ownership. Available-for-sale financial assets and financial assets at fair value through profit or loss are subsequently carried at fair value. Changes in the fair value of monetary and non-monetary securities classified as available for sale are recognized in other comprehensive income. When securities classified as available for sale are sold or impaired, the accumulated fair value adjustments recognized in equity are included in the income statement. For the available for sale securities held by the Group are measured at cost less impairment as these assets are not traded in an active market and therefore fair value cannot be measured reliably. Reversals of impairment in respect of equity instruments classified as available-for-sale are not recognized in the income statement. (e) Derivative financial instruments Derivatives include futures for hedging the financial risk from the variation of stock exchange price of aluminum and interest rate swaps for hedging the future cash flows from the variation of interest rate risk. 40
41 The results from the settlement of hedging transactions are recognized in profit and loss. (difference of interest on interest rate swaps and stock exchange results in aluminum and foreign currency). The Group on regular basis, examines the effectiveness of the cash flow hedge and at each reporting date records in Equity the result of the valuation of the open positions to the part that valuation is effective. 2.8 Inventories Inventories are measured at the lower of cost and net realisable value. The cost of inventories is based on the annual average weighted cost method and includes production and conversion costs and other costs incurred in bringing them to their existing location and condition. Financial expenses are not included to the cost of inventories. Net realisable value is the estimated selling price in the ordinary course of business, less the estimated costs of completion and selling expenses. When there is any subsequent increase of the net realizable value of inventories that have been previously written-down, the amount of the write-down is reversed. 2.9 Trade receivables Trade receivables are initially recognized at their fair value which is equal to the transaction amount and subsequently are measured at amortized cost, less impairment losses. Impairment loss is recognized when there is evidence that the Group will not collect the outstanding amounts based on the contractual terms. The impairment loss is the difference between the carrying amount of receivables less the present value of the future cash flows discounted using the effective interest method. The impairment loss is recognized in the income statement Cash and cash equivalents Cash and cash equivalents include cash, sight deposits and short term placements with duration up to 3 months and of high liquidity and low risk. The overdraft bank amounts are presented in liabilities as short term borrowings Share Capital Ordinary shares are classified as equity. Incremental external costs directly attributable to the issue of new shares are shown in equity as a deduction, net of tax, from the proceeds. Incremental external costs directly attributable to the issue of new shares from a business combination are included in the cost of investment of the entity acquired Borrowings Borrowings are recognized initially at fair value, net of transaction costs incurred. In subsequent periods, borrowings are carried at amortized cost using the effective interest method. Any difference between proceeds (net of transaction costs) and the redemption value is recognized in the income statement over the period of the borrowings using the effective interest method. Borrowings are classified as current liabilities unless the Group entity has an unconditional right to defer settlement for at least 12 months after the balance sheet date Income Tax Current income tax is calculated on the basis of the tax laws enacted or substantively enacted at the reporting date in the countries where the Company and its subsidiaries operate and generate taxable income. 41
42 Deferred income tax is recognized using the liability method, on temporary differences arising between the tax bases of assets and liabilities and their carrying amounts in the financial statements. However, if the deferred income tax arises from initial recognition of an asset or liability in a transaction other than a business combination that at the time of the transaction affects neither accounting nor taxable profit and loss, it is not accounted for. Deferred income tax is determined using tax rates (and laws) that have been enacted or substantively enacted at the reporting date and are expected to apply when the related deferred income tax asset is realized or the related deferred income tax liability is settled. Deferred tax assets are recognized to the extent that it is probable that taxable profit will be available against which the deductible temporary differences can be utilized. Deferred tax liabilities are recognised for taxable temporary differences arising on investments in subsidiaries, joint arrangements and associates, except where the Group is able to control the reversal of the temporary difference and it is probable that the temporary difference will not reverse in the foreseeable future Employee benefits (a) Defined contribution plans Obligations for contributions to defined contribution plans are recognized as an expense as incurred. There are no legal or constructive obligations to pay any further amounts. (b) Defined benefit plans The Group operates various pension and other retirement schemes, including both defined benefit and defined contribution pension plans. The defined contribution plan cost is recognized as an expense when incurred in the income statement. The liability recognized in the statement of financial position in respect of defined benefit pension orretirement plans is the present value of the defined benefit obligation at the reporting date less the fair value of plan assets. The defined benefit obligation is calculated annually by independent actuaries using the projected unit credit method. Actuarial gains or losses are recognized directly in other comprehensive income in the period in which they occur and are not reclassified to income statement in a subsequent period. Past service costs are recognized in the income statement unless there are cases of changes in the plans which derive from the remaining service of the employees. In such cases past service costs are recognized on a straight-line basis in the income statement over the average period until the benefits become vested. (c) Termination benefits Termination benefits are payable whenever an employee s employment is terminated by the Group, before the normal retirement date or whenever an employee accepts voluntary redundancy in exchange for these benefits. The Group recognizes termination benefits when it is demonstrably committed to a termination when the entity has a detailed formal plan to terminate the employment of current employees without possibility of withdrawal or in the case of an offer made to encourage voluntary redundancy. Benefits falling due more than 12 months after the end of the reporting period are discounted to their present value. In cases of termination benefits where the Group cannot determine the actual number of the employees who may use the benefit then the terms of the benefit are disclosed and not recognized. (d) Profit sharing and bonus plans The Group recognizes the liability and the respective expense for bonuses and profit sharing. The amount is calculated net of income taxes and after the deduction of the reserve required under legislation. 42
43 2.15 Grants Government grants are recognized at their fair value where there is a reasonable assurance that the grant will be received and the Group will comply with all attached conditions. Government grants are recognized in profit or loss on a systematic basis over the periods in which the Group recognizes as expenses the related costs for which the grants are intended to compensate. Specifically, government grants whose primary condition is that the Group should purchase, construct or otherwise acquire non-current assets are recognized as deferred revenue in the statement of financial position and transferred to profit or loss on a systematic and rational basis over the useful lives of the related assets Provisions Provisions are recognized when: i. The Group or the Company has a present obligation (legal or constructive) as a result of a past event. ii. It is probable that an outflow of resources embodying economic benefits will be required to settle the obligation. iii. and a reliable estimate can be made of the amount of the obligation. Provisions are measured by discounting the expected future cash flows at a pre-tax rate that reflects current market assessments of the time value of money and the risks specific to the liability Revenue recognition Revenue is measured at the fair value of the consideration received or receivable, and represents amounts receivable for the sale of goods and services stated net of value-added tax, rebates and discounts. Intercomany sales are eliminated for consolidation purposes. The revenue recognition is as follows: (a) Sales of goods Revenue from the sale of goods is recognized when significant risks and rewards of ownership of the goods are transferred to the buyer (usually upon delivery and customer acceptance) and the realization of the related receivable is reasonably assured. In cases of cash returns from sale of goods these are accounted for net of revenues based on statistical data. (b) Services Revenue arising from services is recognized in the accounting period in which the services are rendered, by reference to stage of completion of the specific transaction and assessed on the basis of the actual service provided as a proportion of the total services to be provided. (c) Interest income Interest income is recognized on an accrual basis using the effective interest method. Interest income on impaired receivables is recognized based on the carrying amount of the receivable net of impairment at the original effective interest rate. (d) Dividends Dividend income is recognized when the right to receive the payment is established following the approval of the Shareholders meeting. 43
44 2.18 Leases (a) When a Group entity is a lessee Leases of property, plant and equipment where the Group has substantially all the risks and rewards of ownership are classified as finance leases. Finance leases are capitalized at the commencement of the lease at the lower of the fair value of the leased property or the present value of the minimum lease payments, each determined at the inception of the lease. Each lease payment is allocated between the liability and finance charges so as to achieve a constant rate on the finance balance outstanding. The corresponding rental obligations, net of finance charges, are included in liabilities. The interest element of the finance cost is charged to the income statement over the lease period so as to produce a constant periodic rate of interest on the remaining balance of the liability for each period. Property, plant and equipment acquired under finance leases are depreciated over the shorter of the useful life of the asset and the lease term. Leases where substantially all the risks and rewards of ownership are retained by the lessor are classified as operating leases. Payments made under operating leases (net of any incentives received from the lessor) are charged to the income statement on a straight-line basis over the period of the lease. (b) When a Group entity is a lessor When assets are leased out under an operating lease, the asset is included in the balance sheet based on the nature of the asset. Leased fixed assets are depreciated based on the remaining useful life as owned fixed assets. Lease income on operating leases is recognized over the term of the lease on a straight-line basis Dividend distribution Dividends declared to the shareholders are recognized as a liability in the period they are approved by the General Assembly of shareholders. 3. Financial Instruments The Group bases both its purchases and its sales on market prices/indices for the price of aluminium it uses and that are included in its products. The risk from the fluctuation of metal prices is covered with hedging (futures contracts on the London Metal Exchange LME Financial risk management and accounting policies applied The results from the settlement of hedging transactions are recognized in profit and loss. (difference of interest on interest rate swaps and stock exchange results in aluminum and foreign currency). The Group on regular basis, examines the effectiveness of the cash flow hedge and at each reporting date records in Equity the result of the valuation of the open positions to the part that valuation is effective Fair values The fair value of the financial instruments traded in active markets (stock exchange) (for example derivatives, shares, bonds, mutual funds) is measured using quoted market prices at the balance sheet date. For the financial assets the bid prices are used and for financial liabilities ask prices are used. The fair value of financial instruments not quoted in active markets is measured using valuation techniques and assumptions that are based on market conditions existing at each reporting date. Based on the amendment of IFRS 7 the Company and the Group have to disclose the fair value measurement of the financial instruments presented on balance sheet. The financial instruments of the 44
45 Group are derivatives and available for sale assets as presented in note 15. These financial instruments are measured at level 1, 2 and 3 of fair value hierarchy as described in IFRS 7. The fair value of trade receivables less allowance for bad debts approximates the carrying amounts. The fair values of financial liabilities are calculated based on the present value of the estimated future cash flows derived from the contractual agreements and the discount rate used is that of similar instruments. 4. Significant accounting estimates and judgments The preparation of the financial statements requires management to make estimations and judgments that affect the reported disclosures. Estimates and judgments are continually evaluated and are based on historical experience and other factors, including expectations of future events that are believed to be reasonable under the circumstances. The key assumptions concerning the future and other key sources of estimation uncertainty at the reporting date, that have a significant risk of causing material adjustment to the carrying amounts of assets and liabilities within the next financial year relates to the recoverable amounts of fixed assets, the calculation of income taxes, the valuation of inventories, the calculation of allowance for bad debts and the calculation of other provisions. Regarding property, plant and equipment, the Group evaluates the recoverability thereof based on the value in use of the cash generating unit under which such assets fall. The calculated value in use is based on a five-year business plan prepared by the Management and, thus, it is sensitive to the verification or not of expectations relating to the attainment of sales objectives, gross margin percentages, operating results, growth rates and discount rates of the estimated cash flows. The companies of the Group are subject to different legislations of income tax. In order to define the provision of the Group for income taxes a substantial concept of the above is required. Upon the normal flow of the business a lot of transactions and estimates take place for which the exact estimation of the tax is uncertain. In the event that the final taxes arising after the tax audits are different than the amounts that were initially recorded, these differences will affect the income tax and the provisions for deferred taxes in the fiscal year that the determination of the tax differences took place. The provisions are estimated in the present value of the expenses which based on the best evaluation of management, they are required to cover the current liabilities on the balance sheet date. The rate of discount used for the determination of the current value reflecting the current market estimates for the time value of the money and increases regarding the specific liability. The Group and the Company establish an allowance for doubtful accounts sufficient to cover reasonably estimable loss for these accounts The Group s and Company s management periodically reassess the adequacy of the allowance for doubtful accounts receivable using parameters such as its credit policy, reports from its legal counsel on recent developments of the cases they are handling, and its judgment/estimate about the impact of other factors affecting the recoverability of the receivables. 45
46 5. Segment Information The Group, since the year 2009, applies IFRS 8 Operating segments which replaced IAS 14 Segment reporting. For the identification of operating segments, IFRS 8 adopts the management reporting approach. According to this approach, the information for operating segments that is necessary to be disclosed, is based on the internal organizational and management Group structure and the key figures of internal reports. The above reports are delivered to the chief operating decision maker which is considered to be the Board of Directors that is responsible for measuring the business performance of the segments. The Group is structured in business activity centers and business units, depending on the geographical position of the production and the ability for profitability. Therefore, there are the following operating segments: The parent company ETEM S.A.-LIGHT METALS which has its production activity in Greece and the subsidiaries ETEM BULGARIA S.A. and QUANTUM PROFILES S.A. with their production activity in Bulgaria. The third operating segment consists of the other countries that the Group operates through subsidiaries. Greece operating segment includes the parent company ETEM S.A-LIGHT METALS. The parent company has its production activity in Greece. In fiscal year 2013, ETEM S.A. sold its products in 13 countries. This segment also includes the subsidiary ETEM COMMERCIAL AND INDUSTRIAL S.A. (former KANAL S.A.) Bulgaria operating segment includes the subsidiaries ETEM BULGARIAS S.A. and QUANTUM PROFILES S.A. The two companies produce all of their products in Bulgaria. In 2013 they sold their products in 24 countries. Other countries operating segment incudes the following subsidiaries of the Group: ALUBUILD SRL, established in Italy, MOPPETS LTD established in Cyprus, ETEM SCG D.O.O. established in Serbia, ΕΤΕΜ SYSTEMS SRL established in Romania, LLC ΕΤΕΜ SYSTEMS UKRAINE established in Ukraine, AL AMAR established in Libya and ETEM ALBANIA SHPK established in Albania. Management monitors the operating results of the operating segments separately for the purpose of making decisions about resource allocation and performance assessment. Segment performance is evaluated based on operating results which in certain respects, is measured differently from operating results in the consolidated financial statements. Transactions between operating segments occur in the normal course of business in a manner similar to transactions with related parties. 46
47 The following tables present sales, results, assets and liabilities of Group s operating segments for the year ended 31 December 2013 and 2012 respectively: 2013 (Amounts in Euros) Greece Bulgaria Other countries Eliminations and adjustments Group Sales to third parties 24,366,523 51,955,363 8,118,389-84,440,275 Inter-segment sales 2,826,408 10,997,828 95,426 (13,919,662) - Total sales 27,192,931 62,953,191 8,213,815 (13,919,662) 84,440,275 Gross profit 612,198 5,002,678 1,401, ,875 7,188,003 Other income 287, , , ,287 1,813,568 Administrative expenses (2,947,283) (2,589,368) (511,828) 316,885 (5,731,594) Selling and distribution expenses (5,868,211) (5,180,509) (1,385,822) - (12,434,542) Other expenses (7,566,850) (1,915) (5,082) - (7,573,847) Operating results (15,482,368) (2,142,911) (363,180) 1,250,047 (16,738,412) Finance income 28,653 30, , ,260 Finance expense (3,031,294) (1,657,457) (421,710) - (5,110,461) Income from dividends 10, ,800 Share of profit / (loss) from associates (20,526) (20,526) Profit/(Loss) before tax (18,474,209) (3,770,282) (550,369) 1,229,521 (21,565,339) Depreciation and amortization 3,159,492 3,235,660 52,766-6,447,918 Income tax expense - - (6,767) - (6,767) Capitalization expenses * 554,169 3,459,539 58,181 (309,551) 3,762,338 Segment assets 71,130,955 82,120,106 12,166,295 (38,830,978) 126,586,378 Segment liabilities 63,764,367 54,985,851 7,834,062 (9,015,025) 117,569, (Amounts in Euros) Greece Bulgaria Other countries Eliminations and adjustments Group Sales to third parties 39,841,896 51,884,749 7,881,016-99,607,661 Inter-segment sales 2,043,342 10,847,165 66,024 (12,956,531) - Total sales 41,885,238 62,731,914 7,947,040 (12,956,531) 99,607,661 Gross Profit** 4,452,409 5,885,410 1,395,640 (31,743) 11,701,716 Other income 927, , , ,214 2,578,064 Administrative expenses (3,768,271) (2,395,677) (566,134) 285,137 (6,444,945) Selling and distribution expenses (6,156,588) (6,714,198) (1,203,990) - (14,074,776) Other expenses (58,735) (125,890) (104,306) (5,884) (294,815) Operating results** (4,603,193) (2,673,766) (224,521) 966,724 (6,534,756) Finance income 30, , , ,727 Finance expense (2,831,590) (1,996,512) (567,106) - (5,395,208) Income from dividends 31, ,205 Share of the profit or loss of associates ,001 34,001 Profit/ (Loss) before tax** (7,373,500) (4,527,529) (462,727) 1,000,725 (11,363,031) Depreciation and amortization 3,238,451 3,163,222 58,297-6,459,970 Income tax expense Capitalization expenses * 1,091,015 2,303,446 45,691 (215,859) 3,224,293 Segment assets 89,143,939 87,931,339 12,920,930 (40,375,129) 149,621,079 Segment liabilities ** 64,470,881 56,337,117 8,582,238 (8,623,765) 120,766,471 * Capitalization expenses consist of the amounts for the purchases of property, plant and equipment and intangible assets. ** Adjusted amounts due to amended IAS 19 Employee benefits (see note 37). 47
48 6. Property, plant and equipment Property, plant and equipment for the Group and the Company as of 31 December 2012 and 2013 and their movement during these years are analyzed as follows: Plant and machinery Transportation means Furniture and fixtures Assets under construction Amounts in Euros Land Buildings Total Cost Balance as of 1 January ,259,433 28,161,358 62,973,023 1,349,302 3,224,711 8,788, ,756,080 Foreign exchange differences (9,421) (43) (1,214) (10,685) (5,176) (2,189) (28,728) Additions 46,445 58, ,502-37,525 2,417,517 3,111,231 Sales - - (3,520,393) (27,500) (100,649) - (3,648,542) Write offs - - (1,223,650) - (8,917) - (1,232,567) Impairment (2,000,000) (2,000,000) Transfer to intangible assets (49,779) (49,779) Reclassification 28, ,778 3,034,449 9,405 (5,713) (3,662,528) - Change of consolidation method Balance as of 31 December ,325,066 28,815,335 61,813,717 1,320,522 3,142,516 5,491, ,908,430 Accumulated depreciation Balance as of 1 January (8,622,121) (25,064,743) (822,014) (2,361,012) - (36,869,890) Foreign exchange differences ,096 (2,106) - 2,824 Depreciation - (1,308,619) (4,097,276) (95,281) (227,282) - (5,728,458) Sales - - 3,405,418 20,048 96,405-3,521,871 Write offs - - 1,163,762-8,494-1,172,256 Change of consolidation method (735) - (735) Reclassification - - (9,597) (117) 9, Balance as of 31 December (9,930,713) (24,601,629) (893,268) (2,476,522) - (37,902,132) Net book value as at 31 December ,325,066 18,884,622 37,212, , ,994 5,491,274 74,006,298 Cost Balance as of 1 January ,325,066 28,815,335 61,813,717 1,320,522 3,142,516 5,491, ,908,430 Foreign exchange differences (31,314) (780) (1,925) (341) (1,953) (42,855) (79,168) Additions ,200 25,456 45,952 3,304,548 3,745,736 Sales (1,564) - (172,220) (162,945) (39,209) (13,702) (389,640) Write offs (28,609) - (120,388) - (1,087) - (150,084) Impairment (Note 28) - (4,546,845) (10,987,173) (15,534,018) Transfer to intangible assets (598,240) (598,240) Reclassification - 93,879 1,388,597 16, ,611 (1,619,125) - Transfer to investment property (33,633) (381,866) (415,499) Transfer from investment property (Note 8) - 5,639, ,639,285 Balance as of 31 December ,230,526 29,619,008 52,289,808 1,198,730 3,266,830 6,521, ,126,802 Accumulated depreciation Balance as of 1 January (9,930,713) (24,601,629) (893,268) (2,476,522) - (37,902,132) Foreign exchange differences , ,222-3,232 Depreciation - (1,521,407) (4,032,360) (87,177) (213,072) - (5,854,016) Sales , ,962 26, ,328 Write offs ,838-1,087-58,925 Transfer to investment property - 188, ,748 Transfer from investment property (Note 8) - (743,620) (743,620) Impairment (Note 28) - 2,046,845 5,987, ,034,018 Reclassification - - 1,153 (1,153) Balance as of 31 December (9,960,033) (22,423,781) (850,112) (2,660,591) - (35,894,517) Net book value as at 31 December ,230,526 19,658,975 29,866, , ,239 6,521,900 68,232,285 48
49 Amounts in Euros Land Buildings Plant and machinery Transportation means Furniture and fixtures Assets under construction Cost Balance as of 1 January ,732,682 14,372,957 32,350, ,054 2,043,589 16,519 58,090,412 Additions 46,445 58, ,584-35,358 94, ,621 Sales - - (3,403,858) (27,500) (1,762) - (3,433,120) Transfer to intangible assets (48,800) (48,800) Balance as of 31 December ,779,127 14,431,199 29,699, ,554 2,077,185 62,711 55,596,113 Total Accumulated depreciation Balance as of 1 January (5,152,563) (15,780,386) (469,528) (1,802,280) - (23,204,757) Depreciation - (714,369) (2,138,396) (25,851) (100,912) - (2,979,528) Sales - - 3,130,809 20, ,151,044 Balance as of 31 December (5,866,932) (14,787,973) (475,331) (1,903,005) - (23,033,241) Net book value as at 31 December ,779,127 8,564,267 14,911,364 71, ,180 62,711 32,562,872 Cost Balance as of 1 January ,779,127 14,431,199 29,699, ,554 2,077,185 62,711 55,596,113 Additions ,954 25,456 27, , ,169 Sales - - (986,539) (77,384) (15,185) - (1,079,108) Destructions - - (116,215) (116,215) Impairment (Note 28) - (4,546,845) (10,987,173) (15,534,018) Transfer to investment property (33,633) (381,866) (415,499) Transfer to intangible assets (21,097) (21,097) Reclassification - 7,345 78,882-3,026 (89,253) - Balance as of 31 December ,745,494 9,509,833 18,049, ,626 2,092,144 93,002 38,984,345 Accumulated depreciation Balance as of 1 January (5,866,932) (14,787,973) (475,331) (1,903,005) - (23,033,241) Depreciation - (715,767) (2,040,343) (22,964) (87,195) - (2,866,269) Sales ,689 62,429 11, ,229 Destructions , ,191 Impairment (Note 28) - 2,046,845 5,987, ,034,018 Transfer to investment property - 188, ,748 Balance as of 31 December (4,347,106) (10,278,263) (435,866) (1,979,089) - (17,040,324) Net book value as at 31 December ,745,494 5,162,727 7,770,983 58, ,055 93,002 21,944,021 Due to the decrease in the demand and sales of aluminum extrusion products in the Greek market and the continually financial turmoil in Greece, ETEM A.E. management decided according to IAS 36 «Impairment of Assets» to perform impairment test of the Company s assets and in particular of land, buildings and machinery. The impairment test has been assigned to an independent valuator s company, which prepared the assessment in accordance with the standards of RICS (RICS Valuation-Professional Standards [the Red Book] 2012). The fair value of estimated assets of the Group, derived from the above study, amounted to 11.1 million and it is less than the carrying value of assets by 2.5 million. This resulted in an equal reduction of the fixed assets of the company with a corresponding charge in the income statement. 49
50 The impairment test for machinery has been determined based on value-in-use calculations. Value-inuse was calculated using cash flow projections based on financial budgets approved by management covering a five-year period which were initially projected to a five year period and afterwards to the remaining useful life of the machinery. The discount rate used for the first five year period was 9.95% and for the remaining useful life of the machinery the discount rate used was 12.95%. Based on the impairment test results as at 31 December 2013, the recoverable amount calculated based on value in use is less than the carrying value by 5 million. This resulted in an equal reduction of the fixed assets of the Group with a corresponding charge in the income statement. 7. Intangible assets The intangible assets of the Group and the Company as of 31 December 2012 and 2013 consists of software programs. The movements in intangible assets during 2012 and 2013 are analyzed as follows: Amounts in Euros Cost Balance as of 1 January ,370,447 2,771,362 Foreign exchange differences (1,110) - Additions 113, ,395 Sales (81,974) (7,362) Write offs (1,153) - Transfers from property, plant and equipment 49,779 48,800 Balance as of 31 December ,449,051 2,916,195 Accumulated amortization Balance as of 1 January 2012 (3,110,485) (2,346,634) Foreign exchange differences Amortization (422,798) (156,777) Sales 81,974 - Write offs 1,144 - Balance as of 31 December 2012 (3,449,448) (2,503,411) Net book value as at 31 December , ,784 Cost Balance as of 1 January ,449,051 2,916,195 Foreign exchange differences (676) - Additions 16,602 - Sales (3,029) - Write offs (15,232) - Transfers from property, plant and equipment 598,240 21,097 Balance as of 31 December ,044,956 2,937,292 Accumulated amortization Balance as of 1 January 2013 (3,449,448) (2,503,411) Foreign exchange differences Amortization (490,483) (189,805) Sales 2,483 - Write offs 1,382 - Balance as of 31 December 2013 (3,935,597) (2,693,216) Net book value as at 31 December ,109, ,076 50
51 8. Investment property Investment properties as of 31 December 2012 and 2013 consist of lands and buildings and are analyzed as follows: 31/12/ /12/ /12/ /12/2012 Net book value Opening balance 6,278,497 6,875,448 1,382,832 1,484,978 Foreign exchange differences - (23,585) - - Sales - (264,652) - - Transfer to property, plant and equipment (note 6) (5,639,285) Depreciation transfer to property, plant and equipment (note 6) 743, Transfer from property, plant and equipment 226, ,751 - Depreciation (103,419) (308,714) (103,419) (102,146) Closing balance 1,506,164 6,278,497 1,506,164 1,382,832 The transfer to property, plant and equipment of cost amounting to 5,639,285 and depreciation amounting to 743,620 relates to a reclassification of property owned by ETEM BULGARIA S.A, and leased to the Group subsidiary QUANTUM PROFILES S.A. Amounts recoginsed in the income statement and relate to investment property are presented below: 31/12/ /12/ /12/ /12/2012 Income from leases - 94, Direct operating expenses related to investment property by which leases are received (276,274) (280,129) - - Total (276,274) (186,068) - - Gains/ (losses) from the sale of investment property include: 31/12/ /12/ /12/ /12/2012 Net book value Gains / (losses) from the sale of investment property - (4.652) - - Sale s value of investment property Investments in associates Amounts in Euros 31/12/ /12/ /12/ /12/2012 Opening balance 1,062,314 1,069, , ,347 Share of profit/ (loss) after tax (20,526) 34, Foreign exchange differences (6,052) (26,095) - - Change in consolidation method of ΕΤΕΜ Commercial (former ΚΑΝΑL S.A.) - (15,000) - (15,000) Transfer of Energy Solutions from investments in associates to available for sale securities (37,711) - (41,425) - Increase in the investment COPPERPROM due to share capital increase 6,000-6,000 - Transfer of COPPERPROM from investments in associates to available for sale securities (9,600) - (9,600) - Closing balance 994,425 1,062, , ,347 51
52 During the year 2013, the investments of ETEM S.A. in Energy Solutions S.A. and in COPPERPROM Ltd were transferred from investments in associates to available for sale investments. Investments in associates include: Holding percentage Company Name Country 31/12/ /12/2012 STEELMET ROMANIA S.A. Romania 20,00% 20,00% Condensed financial information of STEELMET ROMANIA S.A. is presented below: Amounts in Euros Assets Liabilities Sales Gains / (losses) after tax 31/12/2013 6,549,895 1,577,767 16,313,863 (103,889) 31/12/2012 7,205,244 2,100,228 19,381, , Investments in subsidiaries Amounts in Euros 31/12/ /12/2012 Opening balance 22,432,744 23,072,744 Additions - 45,000 Sales - (1,536,979) Reversal of impairment - 836,979 Change in consolidation method of ΚΑΝΑL S.A. - 15,000 Closing balance 22,432,744 22,432,744 Ownership percentages in subsidiaries which are all not listed are analyzed below: 2013 Company Name Country Direct percentage of participation Indirect percentage of participation Total percentage of participation ETEM BULGARIA S.A. Bulgaria % 0.00% % ALU BUILD S.R.L. Italy % 0.00% % MOPPETS LIMITED Cyprus 100,00% 0.00% % ΕΤΕΜ SCG D.O.O. Serbia 0.00% % % ETEM SYSTEMS S.R.L. Romania 0.00% % % LLC ETEM SYSTEMS UKR Ukraine 0.00% % % AL - AMAR S.A. Libya 90.00% 0.00% 90.00% ΕΤΕΜ ALBANIA SHPK Albania 0.00% % % QUANTUM PROFILES S.A. Bulgaria 0.00% % % ΕΤΕΜ COMMERCIAL AND INDUSTRIAL S.A. (former ΚΑΝΑL S.A.) Greece % 0.00% % 52
53 2012 Company Name Country Direct percentage of participation Indirect percentage of participation Total percentage of participation ETEM BULGARIA S.A. Bulgaria 89.44% 10.56% % STELLMET S.A. Βουλγαρία % 0.00% % ALU BUILD S.R.L Italy % 0.00% % MOPPETS LIMITED Cyprus % 0.00% % ΕΤΕΜ SCG D.O.O. Serbia 0.00% % % ETEM SYSTEMS S.R.L. Romania 0.00% % % LLC ETEM SYSTEMS UKR Ukraine 0.00% % % AL - AMAR SA Libya 90.00% 0.00% 90.00% ΕΤΕΜ ALBANIA SHPK Albania 0.00% % % QUANTUM PROFILES S.A. Bulgaria 0.00% % % ΕΤΕΜ COMMERCIAL AND INDUSTRIAL S.A. (former ΚΑΝΑL S.A.) Greece % 0.00% % On 17/4/2013 ETEM BULGARIA S.A., established in Sofia Bulgaria proceeded in share capital increase in its 100% subsidiary ΕΤΕΜ SYSTEMS SRL, established in Bucharest Romania by 650,000 in cash. On 17/9/2013 the merger of the subsidiaries of ETEM S.A., STEELMET S.A. and ETEM BULGARIA S.A., both established in Sofia Bulgaria was completed, through the absorption of the first by the latter. This transaction did not have any effect on the ownership percentage of ETEM S.A. in ETEM BULGARIA S.A., which remains 100%. 11. Available for sale securities Available-for-sale financial assets concern investments in domestic and foreign companies with holding percentage less than 20%. Amounts in Euros Balance 1 January , ,317 Balance 31 December , ,317 Amounts in Euro Balance 1 January , ,317 Impairment of investment in ΕΚΑΝΑL (152,720) (152,720) Reclassification of the investment ENERGY SOLUTIONS S.A. 37,711 41,425 Reclassification of the investment COPPERPROM LTD 9,600 9,600 Balance 31 December , ,622 Non-current assets 196, , , ,622 Available-for-sale financial assets include the following: Amounts in Euros 31/12/13 31/12/13 Non-listed securities - Domestic participations 153, ,431 - Foreign participations 43,477 47, , ,622 53
54 12. Deferred Tax Deferred income tax assets and liabilities are offset when there is a legally enforceable right to offset current tax assets against current tax liabilities and when the deferred income taxes assets and liabilities relate to income taxes levied by the same taxation authority. Net amounts are presented below: Amounts in Euros 31/12/ /12/2012* 31/12/ /12/2012* Deferred tax liabilities, net 1,119,212 2,686, ,328 1,126,918 Total 1,119,212 2,686, ,328 1,126,918 The majority of deferred tax liabilities is expected to be settled in more than one year. The movement in the deferred income tax account prior to set-offs is as follows: Assets Liabilities Total Assets Liabilities Total Balance 1/1/2012 7,894,332 (12,233,939) (4,339,607) 4,722,588 (5,972,884) (1,250,296) Effect of revised IAS 19 - (243) (243) - (243) (243) Adjusted balance 1/1/2012* 7,894,332 (12,234,182) (4,339,850) 4,722,588 (5,973,127) (1,250,539) Foreign exchange differences (Debit) / credit of profit and loss (51,548) 1,674,081 1,622,533 (121,205) 213,793 92,588 (Debit) / credit of equity - (5,650) (5,650) - (5,650) (5,650) Effect of revised IAS 19 in profit and loss (1,110) - (1,110) (1,110) - (1,110) Effect of revised IAS 19 in equity 37,793-37,793 37,793-37,793 Balance 31/12/2012* 7,879,526 (10,565,751) (2,686,225) 4,638,066 (5,764,984) (1,126,918) Balance 1/1/2013 7,879,526 (10,565,751) (2,686,225) 4,638,066 (5,764,984) (1,126,918) Reclassifications (4,474,821) 4,474,821 - (1,626,392) 1,626,392 - Foreign exchange differences - (217) (217) (Debit) / credit of profit and loss 1,284, ,951 1,638,249 1,378,594 (412,985) 965,609 (Debit) / credit of equity (71,019) - (71,019) (71,019) - (71,019) Balance 31/12/2013 4,617,984 (5,737,196) (1,119,212) 4,319,249 (4,551,577) (232,328) The movement in deferred tax assets and liabilities during the year is as follows: Revaluation of assets/ Differences in depreciation rates Difference in provisions Non recognised intangible assets Hedging Change of tax rate Tax losses Other Total Balance 1/1/2012 (4,942,256) 1,993,456 95,676 5,650 (2,471,513) 699, ,115 (4,339,607) Effect of revised IAS 19 - (243) (243) Adjusted balance 1/1/2012* (4,942,256) 1,993,213 95,676 5,650 (2,471,513) 699, ,115 (4,339,850) Reclassifications - 584, (584,347) - - Foreign exchange differences (Debit) / credit of profit and loss 105,484 (11,724) (10,745) - 1,579,342 (109,217) 69,393 1,622,533 (Debit) / credit of equity (5,650) (5,650) Effect of revised IAS 19 in profit and loss - (1,110) (1,110) Effect of revised IAS 19 in equity - 37, ,793 Balance 31/12/2012* (4,836,772) 2,602,519 84,931 - (892,171) 5, ,567 (2,686,225) Balance 1/1/2013 (4,836,772) 2,602,519 84,931 - (892,171) 5, ,567 (2,686,225) Reclassifications (366,311) 656,830 (9,970) - 4,322 - (284,871) - Foreign exchange differences (217) (217) (Debit) / credit of profit and loss (533,898) 1,304,714 16, ,849 1,710 (38,657) 1,638,249 (Debit) / credit of equity - (71,019) (71,019) Balance 31/12/2013 (5,736,981) 4,493,044 91, ,411 25,822 (1,119,212) * Adjusted amounts due to amended IAS 19 Employee benefits. 54
55 Revaluation of assets/ Differences in depreciation rates Difference in provisions Non recognised intangible assets Hedging Tax losses Other Total Balance 1/1/2012 (4,363,130) 2,319,912 85,707 5, ,265 2,300 (1,250,296) Effect of revised IAS 19 - (243) (243) Adjusted balance 1/1/2012* (4,363,130) 2,319,669 85,707 5, ,265 2,300 (1,250,539) Reclassifications - 584, (584,347) - - (Debit) / credit of profit and loss 224,538 (11,989) (10,745) - (109,216) - 92,588 (Debit) / credit of equity (5,650) - - (5,650) Effect of revised IAS 19 in profit and loss - (1,110) (1,110) Effect of revised IAS 19 in equity - 37, ,793 Balance 31/12/2012* (4,138,592) 2,928,710 74,962-5,702 2,300 (1,126,918) Balance 1/1/2013 (4,138,592) 2,928,710 74,962-5,702 2,300 (1,126,918) Reclassifications - (13,808) ,808 - (Debit) / credit of profit and loss (412,986) 1,366,766 16,531-1,710 (6,412) 965,609 (Debit) / credit of equity - (71,019) (71,019) Balance 31/12/2013 (4,551,578) 4,210,649 91,493-7,412 9,696 (232,328) * Adjusted amounts due to amended IAS 19 Employee benefits. 13. Inventories Amounts in Euros 31/12/ /12/ /12/ /12/2012 Merchandise 9,021,471 10,224,742 3,479,779 3,507,238 Finished products 5,580,188 6,496,017 2,036,375 2,192,339 Semi-finished 2,927,928 2,663,192 2,829,842 2,535,898 By-products and scrap 50,726 60, Raw and indirect materials consumables - spare parts and packaging materials 11,232,035 10,765,878 1,843,088 2,640,068 Down-payments for the purchase of inventory 130, ,092 11,911 6,607 Total 28,942,483 30,346,279 10,201,007 10,882,162 Less: Impairment Merchandise (439,621) (342,139) (233,738) - Finished products (83,010) - (36,962) - Semi-finished (83,130) (9,650) (83,130) - By-products and scrap (1,141) - (1,141) - Raw and indirect materials consumables - spare parts and packaging material (289,584) (233,251) (289,584) - (896,486) (585,040) (644,555) - Total net realizable value 28,045,997 29,761,239 9,556,452 10,882,162 55
56 14. Trade and other receivables Amounts in Euros Current Assets 31/12/ /12/ /12/ /12/2012 Customers 26,359,828 25,995,137 13,484,202 12,637,142 Notes - cheques receivables 10,839,555 14,148,926 10,514,835 13,915,965 Less: Allowance for customers (17,030,295) (17,066,802) (15,322,915) (13,898,956) Net receivables from customers 20,169,088 23,077,261 8,676,122 12,654,151 Other down payments 90,272 48,461 25,506 - Receivables from subsidiaries - - 3,757,843 3,901,192 Receivables from other affiliated companies 1,442,466 7,109, , ,322 Current tax claims 497, , Sundry debtors 1,481,033 2,766, ,608 1,418,225 Total trade and other receivables 23,680,583 33,189,786 13,821,671 18,742,890 Non-current Assets Other long-term receivables 221, , , ,060 Total other long-term receivables 221, , , ,060 Total receivables 23,902,492 33,521,247 13,951,158 18,876,950 Exposure to credit risk: The ageing analysis for customers is analyzed as follows: 31/12/ /12/ /12/ /12/2012 Customers Amounts in Euro Not due 12,890,093 20,321,270 8,443,964 13,161,424 Due Up to 6 months 1,899,990 2,306, , ,332 More than 6 months 6,821,471 7,558,698 4,128,430 3,251,909 Total 21,611,554 30,186,472 12,915,557 17,324,665 The above analysis is after allowances for doubtful debts and also includes notes and cheques. The above Not due amounts also include receivables from other affiliated companies. The movement of impairment for trade and other receivables is presented below: 31/12/ /12/ /12/ /12/2012 Opening balance 17,066,802 19,041,439 13,898,956 13,797,288 Charge of the year 1,447,209 1,487,449 1,423, ,268 Reversals (1,477,121) (1,438,984) - (103,600) Reclassifications - (2,000,000) - - Foreign exchange differences (6,595) (23,102) - - Closing balance 17,030,295 17,066,802 15,322,915 13,898,956 No material receivables in foreign currencies exist. 56
57 15. Financial Instruments fair value hierarchy The amounts included in the accompanying financial statements for cash and cash equivalents, trade and other receivables, advances and trade and other payables approximate their fair value due to short term maturity of these financial assets. The fair value of available for sale securities are not traded in an active market. The Group and the Company value these securities in internal book value since: -The issuers are entities operating in low tradability markets -The values of the investments are not material compared to Group s and Company s total assets. These securities are included in level 3. The fair values of loans approximate their carrying amount since the loans bear floating interest rate. The Group uses the following levels to define and disclose financial instruments fair value, by valuation method: Level 1: quoted prices (unadjusted) in active markets for identical assets or liabilities, Level 2: Based on valuation techniques whereby all inputs having a significant effect on the fair value are observable, either directly or indirectly. Level 3: Based on valuation techniques whereby all inputs having a significant effect on the fair value are not observable market data. There were no transfers between levels 1 and 2 during the year, neither between level 3 for the measurement of fair value. On 31 December 2013 and 31 December 2012, the Group and the Company held the following derivative financial instruments at fair value through Level 2 valuation techniques for forward contracts and Level 1 for futures as described below: 31/12/ /12/ /12/ /12/2012 Amounts in Euros Current assets Future contracts - 4, Total - 4, Current liabilities Forward contracts - 17,886-17,886 Future contracts 69, Total 69,011 17,886-17,886 Contracts Notional amounts Futures/ Forwards ( ) 1,360,531 2,215,785-1,586,500 The amounts recorded in the income statement during 2012 and 2013 from settled financial transactions are as follows: Amounts in Euros 31/12/ /12/ /12/ /12/2012 Swaps - (28,441) - (28,441) Futures/ Forwards (384,042) (157,558) (166,850) (7,320) 57
58 16. Cash on hand and cash equivalents Cash on hand and cash equivalents of the Group and the Company as of 31 December 2013 and 2012 are analysed as follows: Amounts in Euros 31/12/ /12/ /12/ /12/2012 Cash on hand and banks 6, ,681 1, ,132 Short-term bank deposits 2,501,669 2,390, , ,050 Total 2,508,025 2,522, , ,182 The short-term bank deposits mainly relate to sight deposits. 17. Share capital The share capital amounted to 9,302,855 fully paid in, analyzed to 30,009,210 common, unregister shares of nominal value 0.31 each. Amounts in Euros Number of shares Common shares Share premium Treasury shares Total 1 January ,009,210 9,302,855 32,349,082-41,651, December ,009,210 9,302,855 32,349,082-41,651, December ,009,210 9,302,855 32,349,082-41,651,937 Amount in Euros Number of shares Common shares Share premium Treasury shares Total 1 January ,009,210 9,302,855 32,349,082-41,651, December ,009,210 9,302,855 32,349,082-41,651, December ,009,210 9,302,855 32,349,082-41,651, Other reserves Amounts in Euros Fair Value reserves Statutory Reserve Special Reserve Tax exempt Reserve Other resrerves Other reserves Total Foreign currency translation differences Total Other reserves Balance 1 January 2012 (22,600) 3,527,854 4,393,432 9,582,023 1,598,168 19,101,477 (51,182) 19,050,295 Foreign exchange differences (76,180) (76,180) Transfer from / to retained earnings 22, Balance 31 December ,527,854 4,393,432 9,582,023 1,598,168 19,101,477 (127,362) 18,974,115 Balance 1 January ,527,854 4,393,432 9,582,023 1,598,168 19,101,477 (127,362) 18,974,115 Foreign exchange differences (105,756) (105,756) Transfers due to merger of subsidiaries - 594, ,900 - (336,900) 594, ,377 Balance 31 December ,122,231 4,730,332 9,582,023 1,261,268 19,695,854 (233,118) 19,462,736 Other reserves Amounts in Euros Fair Value reserves Statutory Reserve Special Reserve Tax exempt Reserve Other reserves Total Other reserves Balance 1 January 2012 (22,600) 2,219,478 4,339,837 9,582,023 1,261,268 17,402,606 Transfer from / to retained earnings 22, Balance 31 December ,219,478 4,339,837 9,582,023 1,261,268 17,402,606 Balance 1 January ,219,478 4,339,837 9,582,023 1,261,268 17,402,606 Balance 31 December ,219,478 4,339,837 9,582,023 1,261,268 17,402,606 58
59 18.1 Fair value reserve The fair value reserves related to valuation of the derivatives used by the Group and the Company (contracts of futures and contracts of interest rate swaps) to hedge the risk from the change in Companies and Groups future cash flows Statutory reserve Pursuant to the Greek Trade legislation, the companies are obliged, from their annual profits, to form 5% as a statutory reserve until it reaches one third of their paid share capital. The distribution of the legal reserve is prohibited Special and untaxed reserves The special and tax exempt reserves include reserves formed by the Company and certain Group subsidiaries by applying developmental laws. The distribution of these reserves can be carried out after the approval of the shareholders at the Annual General Meeting and the payment of the applicable tax. The Group has no intention to distribute the remaining amount of these reserves and consequently, has not calculated the income tax that would arise from such distribution. In addition the above tax exempt reserves have not been formed under the requirements of L.2238/1994 where taxes are imposed in accordance with L.4172/ Borrowings Long-term and short-term loans are analysed as followed: Amounts in Euros 31/12/ /12/ /12/ /12/2012 Long term loams Bank loans - 857, Bond loans 38,254,000 27,250,000 38,254,000 27,250,000 Total long-term loans 38,254,000 28,107,143 38,254,000 27,250,000 Minus: paid in next 12 months period - (15,657,143) - (14,800,000) Total long-term loans 38,254,000 12,450,000 38,254,000 12,450,000 Short-term loans Long-term loans paid in next 12 months period - 15,657,143-14,800,000 Bank loans 47,944,736 54,905,543 15,000,608 23,999,319 Total short-term loans 47,944,736 70,562,686 15,000,608 38,799,319 Total loans 86,198,736 83,012,686 53,254,608 51,249,319 The maturity dates of the long-term loans are presented below : Amounts in Euros 31/12/ /12/ /12/ /12/2012 Between 1 to 2 years - 12,450,000-12,450,000 Between 2 to 5 years 38,254,000-38,254,000 - More than 5 years ,254,000 12,450,000 38,254,000 12,450,000 59
60 The Company in 2013 proceeded in a refinance of part of its borrowings through a syndicated collateralized long-term bond loan amounting to 38,254,000 with co-arrangers the Banks, NATIONAL BANK OF GREECE S.A., ALPHA BANK S.A. and EUROBANK ERGASIAS S.A. The loan, that represents approximately 72% of the Company s total borrowings, has 5 years maturity, with a two year grace period and was issued according to Law 3156/2003 and Codified Law 2190/1920 and the decisions of General Shareholders Meetings of the Company. Encumbrances and mortgages of the above mentioned loan amount to 58,108,800. The actual weighted average interest rates at the balance sheet date are the following: 31/12/ /12/ /12/ /12/2012 Bank loans (short-term) 5.50% 5.65% 6.09% 6.38% Bank loans (long-term) 3.12% 3.19% - - Bonds 4.26% 3.84% 4.26% 3.84% The nominal rates are approximately equal to actual interest rates. Fair values of loans are approximate their carrying values due to their floating rate interest affected by the credit spreads of the borrowers. The carrying amounts of Group loans relate entirely to loans in Euro. The Group has sufficient credit limits to cover future needs which as of 31 December 2013 amount to 4 million. 20. Employee benefits Pursuant to the Greek labor law, employees are entitled to an indemnification in the event of their discharge or their retirement, the amount of which is variable depending on the wages, their years of service and the manner by which they withdraw from the company (discharge or retirement). Employees that resign or are discharged justifiably are not entitled to an indemnification. The payable indemnity in the event of retirement is equal to 40% of the indemnification which would be payable in the event of unjustifiable discharge. In Greece these programs are not funded. The Group charges its results for accumulated benefits in each period with a corresponding increase of the retirement liability. Benefits that are paid to pensioners during each period are charged against this liability. The Company s and Group s liability for personnel compensation as of 31 December 2012 and 2013 is analysed as follows: Amounts in Euros 31/12/ /12/2012* 31/12/ /12/2012* Statement of Financial Position liabilities for : Retirement benefits 291, , , ,682 Charges to income statement Retirement benefits (Note 25) (355,922) (187,769) (357,187) (184,465) Present value of obligations 291, , , ,682 Liability in the Statement of Financial Position 291, , , ,682 Changes in net liability recognised Net liability at the beginning of the period 920, , , ,182 Employer contributions - 187, Amount recognized directly in Equity (273,146) - (273,146) 188,965 Total expenditure recognized in the income statement (355,922) (187,769) (357,187) (184,465) Net liability at end of year 291, , , ,682 Analysis of expenses recognized in the income statement Current service cost 59,962 74,348 56,348 74,348 Interest cost 24,940 39,956 23,967 39,956 Cost of additional benefits (964,509) (904,151) (961,417) (900,847) Expenses (230) 5,900-5,900 Cost of past service during the period 523, , , ,178 Total expenditure recognized in the income statement (355,922) (187,769) (357,187) (184,465) * Adjusted amounts due to amended IAS 19 Employee benefits. The main actuarial assumptions used for accounting purposes are the following: 60
61 21. Government Grants 31/12/ /12/ /12/ /12/2012 Discount interest rate 3.1% 3.4% 3.2% 2.7% Future salary increases 4.0% 5.0% 2.0% 4.0% Government grants consist mainly investments for machinery. Amounts in Euros 31/12/ /12/ /12/ /12/2012 Balance at beginning of year 3,867,928 3,519, ,690 87,580 Government grants received - 1,139,193-1,139,193 Return of government grants (188,113) Amortization of government grants (409,933) (790,374) (116,314) (551,083) Balance at end of year 3,269,882 3,867, , , Trade and other payables Amounts in Euros 31/12/ /12/ /12/ /12/2012 Suppliers 7,536,415 10,423,135 3,397,120 4,923,914 Customers advances 456,125 1,575, , ,562 Liabilities to insurance organisations 163, , , ,340 Amounts due to related parties - - 3,521 34,262 Amounts due to other affiliated companies 16,470,329 15,448,055 5,109,663 4,105,300 Sundry creditors 525, , , ,468 Accrued income - 23, Accrued expenses 555,166 1,311, , ,398 Other transitory credit accounts 42,439 24,570-24,560 Total 25,749,679 29,734,412 9,127,901 10,471, Provisions The movement of provisions is presented below: CURRENT LIABILITIES Amounts in Euros Other provisions Total Other provisions Total 1 January ,309 8, Provision charges for the year 130, , Used provisions for the year (8,309) (8,309) December , , Provision charges for the year 321, , , ,000 Used provisions for the year (130,779) (130,779) December , , , ,000 61
62 24. Expenses per function 31/12/2013 Amounts in Euros Cost of sales Distributions and selling expenses Administrative expenses Employee benefits (note 25) 4,761,401 3,862,945 1,883,056 10,507,402 Cost of inventories recognised as an expense 62,783, ,783,509 Depreciation-Amortization 4,426,980 1,234, ,417 6,447,918 Insurance costs 64,396 29,316 82, ,403 Rents 103, , , ,375 Transportation 86,849 1,916,755 95,463 2,099,067 Advertisement expenses ,589 13, ,680 Third parties fees 2,614,787 2,396,091 1,514,177 6,525,055 Provisions 626,668 1,102, ,000 1,928,802 Other expenses 1,783, , ,058 3,510,197 Total 77,252,272 12,434,542 5,731,594 95,418,408 Total 31/12/2012* Amounts in Euros Cost of sales Distributions and selling expenses Administrative expenses Employee benefits (note 25) 5,882,895 4,307,062 2,448,944 12,638,901 Cost of inventories recognised as an expense 72,859, ,859,665 Depreciation-Amortization 4,502,834 1,226, ,494 6,459,970 Insurance costs 63,906 57,238 64, ,222 Rents 111, , , ,855 Transportation 103,511 2,229,062 94,199 2,426,772 Advertisement expenses 3, ,545 3, ,897 Third parties fees 2,325,184 2,724,533 1,565,754 6,615,471 Provisions 2, ,710 3, ,580 Other expenses 2,050,302 1,208,276 1,319,755 4,578,333 Total 87,905,945 14,074,776 6,444, ,425,666 On Group level, Third parties fees for year ended 2013, include audit services from Group auditors amounting to 102,958 and other services from auditors amounting to 3,000. * Adjusted amounts due to amended IAS 19 Employee benefits. Total 62
63 31/12/2013 Amounts in Euros Cost of sales Distributions and selling expenses Administrative expenses Employee benefits (note 25) 2,281,296 1,849, ,788 4,936,291 Cost of inventories recognised as an expense 18,425, ,425,123 Depreciation-Amortization 2,249, , ,208 3,159,493 Insurance costs 47,419 9,174 44, ,686 Rents 26, ,880 69, ,300 Transportation 86, ,454 76, ,239 Advertisement expenses ,993 1, ,647 Third parties fees 1,629, ,182 1,075,134 3,535,991 Provisions 626,668 1,423, ,000 2,250,627 Other expenses 1,208, , ,871 1,914,505 Total 26,580,733 5,868,211 2,928,958 35,377,902 Total 31/12/2012* Amounts in Euros Cost of sales Distributions and selling expenses Administrative expenses Employee benefits (note 25) 3,540,887 2,437,049 1,561,865 7,539,801 Cost of inventories recognised as an expense 28,459, ,459,418 Depreciation-Amortization 2,375, , ,626 3,238,451 Insurance costs 62,669 46,612 47, ,544 Rents 29, ,619 61, ,927 Transportation 101, ,367 91,441 1,020,717 Advertisement expenses 3, ,862 1, ,078 Third parties fees 1,296, ,303 1,149,905 3,381,896 Other expenses 1,562, , ,251 2,833,034 Total 37,432,829 6,156,589 3,764,448 47,353,866 * Adjusted amounts due to amended IAS 19 Employee benefits. Total 25. Payroll Cost Amounts in Euros 31/12/ /12/2012* 31/12/ /12/2012* Personnel fees and expenses 8,919,914 10,150,911 4,412,549 6,332,813 Social security contributions 1,667,149 2,376, ,929 1,391,454 Retirement benefits (Defined benefit plan) (Note 20) (355,922) (187,769) (357,187) (184,466) Other benefits 276, , Total 10,507,402 12,638,901 4,936,291 7,539,801 * Adjusted amounts due to amended IAS 19 Employee benefits. 63
64 26. Financial income / expenses Amounts in Euros 31/12/ /12/ /12/ /12/2012 Finance income Interest income 30, ,041 22,019 17,924 Foreign exchange differences 263, ,563 6,492 11,917 Other Total finance income 293, ,727 28,511 29,841 Finance expenses Interest expense and related expenses (4,526,324) (4,758,146) (2,873,637) (2,807,008) Foreign exchange differences (429,984) (634,781) (4,895) (24,581) Impairment of investments (152,720) - (152,720) - Other (1,433) (2,281) - - Total finance expense (5,110,461) (5,395,208) (3,031,252) (2,831,589) Finance income / (expenses) - net (4,817,201) (4,893,481) (3,002,741) (2,801,748) 27. Income tax expense The income tax reconciliation applying the Parent Company tax rate is as follows: 31/12/ /12/2012* 31/12/ /12/2012* Current tax (6,767) (5) - - Deferred tax 1,638,249 1,621, ,608 91,478 Total 1,631,482 1,621, ,608 91,478 Profit before tax (21,565,339) (11,363,031) (18,455,984) (7,369,913) Tax rate (2013:26%, 2012: 20%) 26% 20% 26% 20% Attributable tax 5,606,988 2,272,606 4,798,556 1,473,983 Exempt income (1) Adjustment in tax values of assets - 201, ,081 Change in tax rate (337,692) - (338,074) - Difference tax rate of foreign subsidiaries (337,250) (274,407) - - Deferred tax in intercompany results (32,624) Non deductible expenses (142,161) (320,070) (99,509) (283,711) Additional tax (67) Reversal of tax for dividends from foreign subsidiaries due to losses 887,849 1,579, Tax losses with no deferred tax (4,009,263) (1,837,998) (3,395,365) (1,299,875) Tax losses 2, Tax audit differences (6,353) * Adjusted amounts due to amended IAS 19 Employee benefits. 1,631,482 1,621, ,608 91,478 64
65 The movement of receivable from taxes is presented below: Amounts in Euros 31/12/ /12/ /12/ /12/2012 Opening balance 1,162,449 1,392,893 1,141,756 1,375,059 Plus:current income tax (412) Minus return/settlement of income tax (1,055,937) (222,965) (1,055,937) (222,965) Prior year restatements (16,466) (12,083) - (12,083) Income tax advance 1,089 4,604 (1,745) 1,745 Closing balance 90,723 1,162,449 84,074 1,141, Other Income Expenses Amounts in Euros 31/12/ /12/ /12/ /12/2012 Other income Income from incidental activities , ,230 Amortization of government grants received 293, , ,769 Income from services 181, , , ,889 Buildings and machinery rents 122, , ,035 94,063 Profit from the sale of property, plant and equipment 34,525 29,706 47,940 40,405 Prior year income 7, ,889 7, ,889 Compensation from customers, suppliers - 40, Unused provisions 1,100,817 1,000, Other 72, ,109 1,581 66,747 Total other income 1,813,568 2,578, , ,992 Other expenses Impairment loss on property, plant and equipment (note 6) (7,500,000) - (7,500,000) - Fines (1,809) Loss from the sale of property, plant and equipment (12,250) (58,793) (7,826) (48,044) Destruction of property, plant and equipment (59,024) - (59,024) - Other (764) (230,138) - (10,691) Total (7,573,847) (288,931) (7,566,850) (58,735) Gains / (losses) from the sale of investments - (5,884) - 10,000 Total other operating income / (expenses) (net) (5,760,279) 2,283,249 (7,279,072) (869,257) Dividend income 10,800 31,205 10,800 31,205 Gain/ Losses from associates Gains from associates - 37, Losses from associates (20,526) (3,715) - - Total (20,526) 34,
66 29. Commitments Amounts in Euros 31/12/ /12/2012 Property, plant and equipment 45, ,604 45, ,604 Liabilities from operating leases The Group leases cars and buildings through operating leases. The future total lease payments in accordance to the operating leases are as follows: Amounts in Euros 31/12/ /12/ /12/ /12/2012 Up to 1 year 561, , , ,632 From 1-5 years 1,076,679 1,196, , ,202 More than 5 years - 228, ,637,845 1,993, , ,834 31/12/ /12/ /12/ /12/2012 Recorded in income statement 666, , , , Contingent liabilities-assets The Group has contingent liabilities and assets that relate to transactions with banks, other guarantees and other transactions in the ordinary course of business, as follows: Amounts in Euros Liabilities 31/12/ /12/ /12/ /12/2012 Guarantees to suppliers 323, , , ,130 Assignment of mortgages and prenotices (note 19) 58,108,800-58,108,800 - Total 58,432, ,130 58,432, ,130 Assets 31/12/ /12/ /12/ /12/2012 Guarantees from customers 1,957,006 2,055, ,000 50,000 Total 1,957,006 2,055, ,000 50,000 There are no any pending court decisions or differences under arbitration which may have a significant effect on Groups financial position. 66
67 31. Transactions with related parties The transactions with related parties which are conducted at arm length are presented below: Amounts in Euros 31/12/ /12/ /12/ /12/2012 Sales of goods Subsidiaries - - 2,826,408 2,043,342 Associates 413, , Other affiliated companies 11,021,567 10,818,234 1,775,895 4,939,935 11,435,071 11,091,850 4,602,303 6,983,277 Sales of services Subsidiaries ,618 8,611 Associates - 1, Other affiliated companies 434,002 1,166, , , ,002 1,168, , ,622 Sales of property, plant and equipment Subsidiaries , ,859 Associates Other affiliated companies 29,823 70,940 25,733 70,940 Purchases of goods 29,823 70, , ,799 Subsidiaries - - 4,366,752 3,384,921 Associates 437, , Other affiliated companies 31,670,816 23,435,617 6,974,010 8,896,515 32,108,679 23,779,241 11,340,762 12,281,436 Purchases of services Subsidiaries - - 8,835 2,423 Associates 23,591 29, Other affiliated companies 2,430,060 2,238, ,021 1,200,317 2,453,651 2,268, ,856 1,202,740 Purchases of property, plant and equipment Subsidiaries Associates Other affiliated companies 22, ,343 22, ,343 22, ,343 22, ,343 67
68 Benefits to Management Amounts in Euros 31/12/ /12/ /12/ /12/2012 Benefits to Board of Directors and management 587, , , , , , , ,058 Year-end balances Amount in Euro 31/12/ /12/ /12/ /12/2012 Receivables from: Subsidiaries - - 3,757,843 3,901,192 Associates 7, , ,221 Other affiliated companies 1,435,136 6,946, , ,101 1,442,466 7,109,211 4,239,435 4,670,514 Liabilities to: Subsidiaries - - 3,521 34,262 Associates 99,321 74, Other affiliated companies 16,371,008 15,373,564 5,109,663 4,105,300 16,470,329 15,448,055 5,113,184 4,139, Earnings/(losses) per share Basic earnings per share is calculated by dividing the profit attributable to equity holders of the company by the weighted average number of ordinary shares in issue during the year. Amounts in Euros 31/12/ /12/2012* 31/12/ /12/2012* Losses attributable to Equity holders of the Company (19,933,386) (9,739,948) (17,490,376) (7,278,435) Weighted average number of shares 30,009,210 30,009,210 30,009,210 30,009,210 Basic losses per share ( / share) (0.6642) (0.3246) (0.5828) (0.2425) * Adjusted amounts due to amended IAS 19 Employee benefits. 33. Dividend per share The company will not distribute dividend for the year Financial risk management Financial risk management factors The Group is exposed to the following risks that arising from the use of the financial instruments: Credit risk Liquidity risk Market risk 68
69 This note provides information regarding the exposure of the Group to each of the above risks, the goals of the Group, its risk assessment and management policies and procedures, as well as the Group s capital management. More quantitative data regarding the aforementioned disclosures are included throughout the consolidated financial statements. The Group s risk management policies are implemented in order to identify and analyse risks faced by the Group as well as set risk-taking limits and implement controls thereon. Risk management policies and related systems are periodically monitored, in order to ensure that they incorporate the changes in market conditions and in the Group s activities. The Internal Audit department is responsible for monitoring compliance with risk management policies and procedures. The department carries out regular as well as special audits in order to ascertain compliance with proper procedures and its findings are communicated to the Board of Directors. Credit risk Credit risk is the risk of loss in the event that a customer or third party to a financial transaction does not fulfill its contractual obligations and is mainly related to trade receivables and securities investments. The Financial assets subject to credit risk are as follows: Amounts in Euros 31/12/ /12/ /12/ /12/2012 Available for sale securities 196, , , ,317 Customers (less impairment) & cheques 21,611,554 30,186,472 12,915,557 17,324,665 Cash in hand and cash equivalents 2,508,025 2,522, , ,182 Derivatives - 4, Total 24,316,487 33,015,904 13,970,357 18,366,164 (a) Trade and other receivables The Group s exposure to credit risk is mainly affected by the characteristics of each customer. The demographic characteristics of the Group s client base, including the risk of default payments that characterizes the specific market and the country where customers operate in, affect credit risk less as there is no geographic concentration of credit risk. None of the customer balances exceeded 10% of the total balance of trade receivables as of 31 December 2013 and Therefore, there is a diversification of credit risk to a large number of customers. The Board of Directors has established a credit policy, according to which each new customer is examined on an individual basis for its credit ability before the ordinary payment terms are proposed to such. The examination of credit ability performed by the Group includes the examination of bank resources and other third party resources for credit rating, if available. Credit lines are defined for each customer, and are re-examined according to the current conditions, while if necessary the sales and payment terms are readjusted. The credit lines of customers are mainly defined according to the insurance limit received for them from insurance companies and following the receivables are insured according to such limits. During the monitoring of customer credit risk, customers are grouped according to their credit characteristics, the maturity characteristics of their receivables and any possibly prior payment problems displayed. Customers and other receivables mainly include wholesale customers of the Group. Customers characterized as high risk are placed in a special customer statement and future sales must be precollected and approved by the Board of Directors. According to the customer s history and capacity, in order to secure its receivables, the Group requests real guarantees or collateral (i.e. letters of guarantee), when possible. 69
70 The Group registers an impairment provision, which represents its estimation for losses regarding its customers, other receivables and investments in securities. This provision is mainly comprised of impairment losses of specific receivables that it is estimated (based on the given conditions) that they will be realized but have not yet been finalized. (b) Guarantees According to the Group s policy, no collateral is provided; however, if the Board of Directors decides so in exceptional cases, such collateral may be provided to subsidiaries. Liquidity risk Liquidity risk is the risk that the Group would be unable to fulfill its financial obligations when they fall due. The approach adopted by the Group for the liquidity management is to secure, through holding the minimum necessary cash and sufficient credit limits from cooperating banks, that will always have enough liquidity in order to fulfill its financial liabilities when those become due, under normal as well as difficult conditions, without sustaining non-acceptable losses or risking the Group s reputation. In order to avoid liquidity risks, the Group realizes a cash flow provision for a period of one year during the preparation of the annual budget, and a monthly rolling three-month provision in order to secure that it has adequate cash equivalents to cover its operating needs, including covering its financial liabilities. This policy does not take into account the relevant effect from extreme conditions that cannot be forecasted. The analysis of financial liabilities and derivatives (buys are presented with plus and sells are presented with minus), interest excluded, is based on their maturity, as follows: 31 December 2013 Financial liabilities Carrying amount 31/12/2013 <1 year 1-2 years 2-5 years > 5 years Total Bank loans 47,944,736 47,944, ,944,736 Bond loans 38,254, ,254,000-38,254,000 Trade and other payables 25,749,679 25,749, ,749, ,948,415 73,694,415-38,254, ,948,415 Derivatives Carrying amount 31/12/2013 <1 year 1-2 years 2-5 years > 5 years Total Notional amount of aluminum derivatives 1,360,531 1,360, ,360,531 1,360,531 1,360, ,360, December 2013 Financial liabilities Carrying amount 31/12/2013 <1 year 1-2years 2-5 years > 5 years Total Bond loans 38,254, ,254,000-38,254,000 Bank overdrafts 15,000,608 15,000, ,000,608 Trade and other payables 9,127,901 9,127, ,127,901 62,382,509 24,128,509-38,254,000-62,382,509 70
71 Carrying amount 31/12/2012 <1 year 1-2 years 2-5 years > 5 years Total 31 December 2012 Financial liabilities Bank loans 55,762,686 55,762, ,762,686 Bond loans 27,250,000 14,800,000 12,450, ,250,000 Trade and other payables 29,734,412 29,734, ,734, ,747, ,297,098 12,450, ,747,098 Carrying amount Derivatives 31/12/2012 <1 year 1-2 years 2-5 years > 5 years Total Notional amount of aluminum derivatives 2,215,785 2,215, ,215,785 2,215,785 2,215, ,215,785 Carrying amount 31/12/2012 <1 year 1-2 years 2-5 years > 5 years Total 31 December 2012 Financial liabilities Bond loans 27,250,000 14,800,000 12,450, ,250,000 Bank overdrafts 23,999,319 23,999, ,999,319 Trade and other payables 10,471,804 10,471, ,471,804 61,721,123 49,271,123 12,450, ,721,123 Carrying amount Derivatives 31/12/2012 <1 year 1-2 years 2-5 years > 5 years Total Notional amount of aluminum derivatives 1,586,500 1,586, ,586,500 1,586,500 1,586, ,586,500 It is noted that the liabilities arising from future interest payments are not included in the aforementioned analysis. This is due to the fact that the Group s loans are based on floating interest rate and therefore it is not possible to estimate the future interest rates in order to calculate the respective liability. Market risk Market risk corresponds to risk from changes in the prices of raw materials, foreign exchange rates and interest rates that affect the Group s results or the value of its financial instruments. The aim of market condition risk management is to control the Group s exposure to such risks in the context of acceptable parameters, by optimizing performance at the same time. The Group realizes transaction on financial derivatives in order to hedge part of the risk from market conditions. (a) Risk from Fluctuation of Prices of Metal Raw Materials (aluminium) The Group bases both its purchases and its sales on market prices/indices for the price of aluminium it uses and that are included in its products. The risk from the fluctuation of metal prices is covered with hedging (futures contracts on the London Metal Exchange LME). However the Group does not cover its entire basic operational stock with hedging and as a result a possible decrease in metal prices may negatively affect its results through the devaluation of stocks. According to the financial data as of 31/12/2013 a possible decrease in metal prices would not materially affect the Company s and Group s income statement and equity through the devaluation of stocks. 71
72 (b) Foreign exchange risk The Group is exposed to foreign exchange risk in its sales and purchases and in loans that have been issued in currencies other than the operating currency of the Group s companies, which is principally the Euro. Currencies in which such transactions take place is mainly the Euro, USD, GBP, the Bulgarian lev, the Serbian Dinar and Romanian RON. The loan interest is in the same currency as that used in the cash flows, which arise from the Group s operating activities, mainly the Euro. The Group s investments in other subsidiaries are not hedged, as such foreign exchange positions are considered long-term. The risk from changes in foreign exchange fluctuations is as follows: 31-DEC-13 EURO USD GBP LEV Dinar RON Other TOTAL Trade and other receivables 13,835,598 41, ,613 6,890, ,886 1,368, ,834 23,680,583 Borrowings (86,198,736) (86,198,736) Trade and other payables (20,299,071) (28,076) (41,875) (5,166,033) (12,451) (187,632) (14,541) (25,749,679) Cash on hand and cash equivalent 1,785,687 2,794 47, ,464 26, , ,704 2,508,025 Total risk (90,876,522) 16, ,635 2,104, ,805 1,333, ,997 (85,759,807) 31-DEC-13 EURO USD GBP LEV Dinar RON Other TOTAL Trade and other receivables 13,587,585 39, , ,821,671 Borrowings (53,254,608) (53,254,608) Trade and other payables (9,057,950) (28,076) (41,875) (9,127,901) Cash on hand and cash equivalent 853, ,178 Total risk (47,871,129) 11, , (47,706,660) 31-DEC-12 EURO USD GBP LEV Dinar RON Other TOTAL Trade and other receivables 24,714,249 15, ,212 5,483, ,044 1,378, ,808 33,189,786 Borrowings (83,012,686) (83,012,686) Trade and other payables (23,499,027) (1,792) (42,467) (5,981,573) (10,236) (139,186) (60,131) (29,734,412) Cash on hand and cash equivalent 1,442,257 5, ,881 13, ,388 41,562 2,522,920 Total risk (80,355,207) 19, , , ,432 1,351, ,239 (77,034,392) 31-DEC-12 EURO USD GBP LEV Dinar RON Other TOTAL Trade and other receivables 18,535,415 12, , ,742,890 Borrowings (51,249,319) (51,249,319) Trade and other payables (10,428,203) (1,792) (41,809) (10,471,804) Cash on hand and cash equivalent 737,177 2, ,182 Total risk (42,404,930) 13, , (42,239,051) 72
73 Sensitivity analysis: If the foreign currency was increased by 10% in relation to Euro, the effect in the income statement and in shareholders equity would be: Amounts in Euros USD 1,798 2,120 GBP 22,848 23,638 LEV 233,786 45,562 RΟΝ 148, ,141 Serbian Dinar 93,645 89, USD 1,313 1,457 GBP 16,962 16,974 LEV - - RΟΝ - - Serbian Dinar - - If the foreign currency was depreciated by 10% in relation to Euro, the effect in the income statement and in shareholders equity would be: Amounts in Euros USD (1,471) (1,734) GBP (18,694) (19,340) LEV (191,280) (37,278) RΟΝ (121,184) (122,842) Serbian Dinar (76,619) (73,130) USD (1,074) (1,192) GBP (13,878) (13,888) LEV - - RΟΝ - - Serbian Dinar - - (c) Interest rate risk The Group finances its investments as well as its needs in working capital through bank debt and corporate bond loans, and as a consequence its results are charged with interest expense, Increasing trends in interest rates will have a negative effect on results as the Group will be charged with additional borrowing costs. The risk from interest rate fluctuations is as follows: Amounts in Euros 31/12/ /12/ /12/ /12/2012 Floating interest rate Financial liabilities 86,198,736 83,012,686 53,254,608 51,249,319 86,198,736 83,012,686 53,254,608 51,249,319 73
74 If interest rates were increased by 25 basis points, the effect in the income statement and in shareholders equity would be: Amounts in Euros Floating interest rate (227,275) (228,043) Interest rate swaps Floating interest rate (149,370) (138,604) Interest rate swaps - - If interest rates were decreased by 25 basis points, the effect in the income statement and in shareholders equity would be: Amounts in Euros Floating interest rate 227, ,043 Interest rate swaps Floating interest rate 149, ,604 Interest rate swaps - - Capital management The policy of the Board of Directors corresponds to maintaining a powerful capital base, in order to maintain trust in the Group from investors, creditors and the market and to allow the future development of the Group s activities. The Board of Directors monitors the return on capital, which is defined by the Group as the net results divided with the total equity, excluding non-controlling interest. The Board of Directors also monitors the level of dividends to shareholders of common shares. The Board of Directors tries to maintain a balance between the highest returns that would be possible with higher debt levels and the advantages and security that would be provided by a powerful and healthy capital position. The Group does not have a specific plan for purchase of own shares. There were no changes in the approach adopted by the Group as regards to capital management during the period. Amounts in Euros 31/12/ /12/ /12/ /12/2012 Equity 9,017,123 28,854,608 7,334,282 24,622,530 Debt 117,569, ,766,471 63,752,529 64,469,416 Debt/Equity ratio Unaudited tax years The Company has not been audited from the tax authorities for the years up to 2008 up to The audit for the issuance of annual tax certificate for the year 2011 and 2012 was conducted from the Company s legal auditors, as provided for by paragraph 5 of Article 82 of L.2238/1994. No significant tax liabilities resulted from the above mentioned audit apart from those included in the financial statements. 74
75 For the year 2013, the tax audit is in progress from the legal auditors of the Company. Company s management does not expect any significant tax liabilities to result from the audit apart from those included in the financial statements. The subsidiaries and associates have not been audited by the tax authorities for the years presented below and consequently their tax liabilities are not definite. Company Country of registration Participation Method of Consolidation Unaudited tax years ΕΤΕΜ COMMERCIAL S.A. GREECE % FULL CONSOLIDATION From 2010 to 2013 ETEM BULGARIA S.A. BULGARIA % FULL CONSOLIDATION From 2007 to 2013 STEELMET ROMANIA S.A. ROMANIA 20.00% EQUITY METHOD From 2009 to 2013 ALUBUILD SRL ITALY % FULL CONSOLIDATION From 2007 to 2013 MOPPETS LTD CYPRUS % FULL CONSOLIDATION From 2010 to 2013 ETEM S.C.G. D.O.O. SERBIA % FULL CONSOLIDATION From 2011 to 2013 ETEM SYSTEMS SRL ROMANIA % FULL CONSOLIDATION From 2008 to 2013 LLC ETEM SYSTEMS UKR UKRAINE % FULL CONSOLIDATION From 2006 to 2013 QUANTUM PROFILES S.A. BULGARIA % FULL CONSOLIDATION From 2009 to 2013 AL AMAR S.A. LIBYA 90.00% FULL CONSOLIDATION From 2006 to 2013 ΕΤΕΜ ΑLBANIA SHPK ALBANIA % FULL CONSOLIDATION From 2011 to Number of employees Number of employees at the end of the year 2013: Group 566, Company 90 (2012: Group 575, Company 152) 37. Restated amounts On , the employee benefits recognition policy on group financial statements changed based on the adoption of the revised International Accounting Standard (IAS) 19, as endorsed by the EU during the fourth quarter of The revised IAS 19 includes significant changes in the recognition and measurement of employee benefits (removing the corridor mechanism) and in the disclosures. The effect of the amendment is presented below: 31/12/2012 INCOME STATEMENT Before the adoption of the amended IAS 19 (9,744,386) (7,282,873) Effect of the amended IAS 19 5,548 5,548 Adjustment of income taxes (1,110) (1,110) After the adoption of the amended IAS 19 (9,739,948) (7,278,435) EQUITY 31/12/ /01/ /12/ /01/2012 Before the adoption of the amended IAS 19 29,000,369 38,798,530 24,768,291 32,028,564 Effect of the amended IAS 19 (182,201) 1,216 (182,201) 1,216 Change in deferred tax liabilities 36,440 (243) 36,440 (243) After the adoption of the amended IAS 19 28,854,608 38,799,503 24,622,530 32,029,537 31/12/2012 EMPLOYEE BENEFITS Before the adoption of the amended IAS , ,481 Effect of the amended IAS , ,201 After the adoption of the amended IAS , ,682 75
76 38. Subsequent events No significant subsequent events have occurred after December 31, 2013 Groups management is monitoring closely the political and economic developments in Ukraine, where the subsidiary of the Group LLC ETEM SYSTEMS is established. These developments are not expected to have a material effect in the Group s financial position. 76
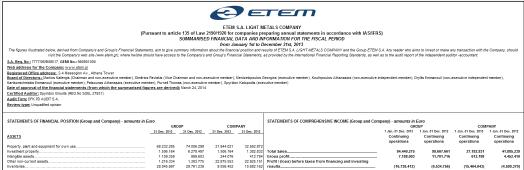
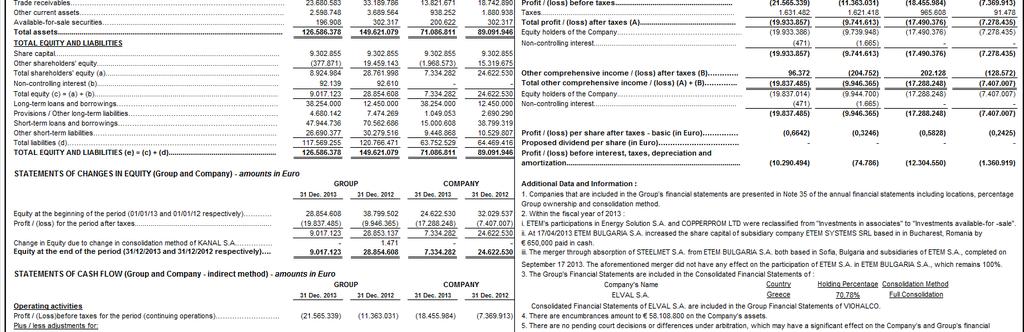
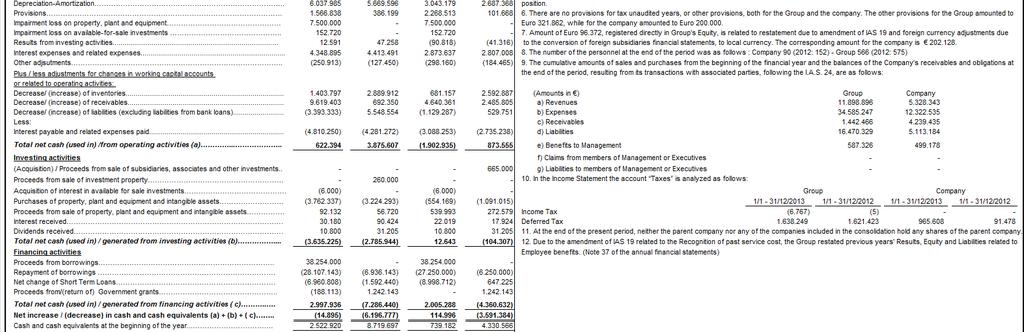
77 Summarized financial data and information
Annual Financial Report
 Annual Financial Report as at 31 December 2013 Based on article 4 of L. 3556/2007 HALCOR METAL WORKS SA G.C.Registry.: 303401000 No in SA Registry: 2836/06/B/86/48 ADDRESS: Athens Tower, Building B, 2-4,
Annual Financial Statements (Corporate and Consolidated) of 31 December 2008
 of 31 December 2008") Annual Report 2008 ETEM S.A. Group of Companies Annual Financial Statements (Corporate and Consolidated) of 31 December 2008 General Manager Member of the B.o.D Chairman of the B.o.D. Financial Manager
Annual Report 2008 ETEM S.A. Group of Companies Annual Financial Statements (Corporate and Consolidated) of 31 December 2008 General Manager Member of the B.o.D Chairman of the B.o.D. Financial Manager
Contents CONTENTS MESSAGE FROM THE GENERAL MANAGER... 5
 Annual Report 09 Annual Report 09 CONTENTS Contents MESSAGE FROM THE GENERAL MANAGER... 5 Invitation to Ordinary General Shareholders Meeting... 7 BOARD OF DIRECTORS MEMBERS... 8 THE ETEM GROUP... 8
[DRAFT] ARTICLES OF ASSOCIATION. GRIVALIA PROPERTIES Real Estate Investment Company CHAPTER A INCORPORATION REGISTERED OFFICE DURATION CAPITAL
![[DRAFT] ARTICLES OF ASSOCIATION. GRIVALIA PROPERTIES Real Estate Investment Company CHAPTER A INCORPORATION REGISTERED OFFICE DURATION CAPITAL](/thumbs/88/115667188.jpg "[DRAFT] ARTICLES OF ASSOCIATION. GRIVALIA PROPERTIES Real Estate Investment Company CHAPTER A INCORPORATION REGISTERED OFFICE DURATION CAPITAL") [DRAFT] ARTICLES OF ASSOCIATION GRIVALIA PROPERTIES Real Estate Investment Company CHAPTER A INCORPORATION REGISTERED OFFICE DURATION CAPITAL Article 1 Name The present articles of association govern the
[DRAFT] ARTICLES OF ASSOCIATION GRIVALIA PROPERTIES Real Estate Investment Company CHAPTER A INCORPORATION REGISTERED OFFICE DURATION CAPITAL Article 1 Name The present articles of association govern the
Annual Financial Report
 Annual Financial Report as at 31 December 2016 Pursuant to article 4 of L. 3556/2007 HALCOR METAL WORKS SA G.C.Registry.: 303401000 SA Registry No:2836/06/B/86/48 SEAT: Athens Tower, Building B, 2-4 Mesogeion
ANNUAL FINANCIAL REPORT For the year from January 1st to December 31st According to article 4, Law 3556/2007
 ANNUAL FINANCIAL REPORT For the year from January 1st to December 31st 2014 According to article 4, Law 3556/2007 CONTENTS Α) STATEMENTS BY THE REPRESENTATIVES OF THE BOARD OF DIRECTORS ACCORDING TO ARTICLE
FLUIDRA, S.A. AND SUBSIDIARIES. Consolidated Financial Statements and Consolidated Management Report. 31 December 2017
 FLUIDRA, S.A. AND SUBSIDIARIES Consolidated Financial Statements and Consolidated Management Report 31 December 2017 (Together with the Audit Report thereon) Translation of consolidated financial statements
In view of all these, the BoD formulated the following Reasoned Opinion pursuant to current legislation:
 REASONED OPINION OF THE BOARD OF DIRECTORS OF THE COMPANY DIAGNOSTIC AND THERAPEUTIC CENTER OF ATHENS HYGEIA SA ON THE MANDATORY TENDER OFFER SUBMITTED BY COMPANY HELLENIC HEALTHCARE SINGLE-MEMBER HOLDINGS
PAYZONE SOCIETE ANONYME FOR THE PROVISION OF SERVICES
 PAYZONE SOCIETE ANONYME FOR THE PROVISION OF SERVICES for the fiscal period that ended on December 31, 2015 (January 1, 2015 - December 31, 2015) in accordance with the International Financial Reporting
INTERIM FINANCIAL STATEMENTS AS OF JUNE 30, 2014 According to article 5 of Law 3556/2007
 Company's No 7946/06/Β/86/2 in the register of Societes Anonymes G.E.MI. 3618010 30, Vas. Georgiou Av., Halandri, 15233, Athens, Greece. Tel: 210 3498200, Fax: 210 3475856 www.sidma.gr INTERIM FINANCIAL
KOMERCIJALNA BANKA A.D., BEOGRAD. Consolidated Financial Statements December 31, 2006 and Independent Auditors Report
 KOMERCIJALNA BANKA A.D., BEOGRAD Consolidated Financial Statements and Independent Auditors Report CONTENTS Page Independent Auditors Report 1 2 Consolidated Statement of Income 3 Consolidated Balance
Annual Financial Statements For the year ended 31 December 2014
 Annual Financial Statements For the year ended 31 December 2014 These financial statements have been translated from the original statutory financial statements that have been prepared in the Greek language.
INTERIM FINANCIAL STATEMENTS For the period January 1 st to September 30 th, Pursuant to article 6, of Law no. 3556/2007
 's No 7946/06/Β/86/2 in the register of Societes Anonymes 30, Vas. Georgiou Av., Halandri, 15233, Athens, Greece. Tel: 210 3498200, Fax: 210 3475856 www.sidma.gr INTERIM FINANCIAL STATEMENTS For the period
INTERIM FINANCIAL STATEMENTS AS OF JUNE
 Company's No 7946/06/Β/86/2 in the register of Societes Anonymes G.E.MI. 361801000 30, Vas. Georgiou Av., Halandri, 15233, Athens, Greece. Tel: 210 3498200, Fax: 210 3475856 www.sidma.gr INTERIM FINANCIAL
CORPORATE CHARTER POWSZECHNA KASA OSZCZĘDNOŚCI BANK POLSKI SPÓŁKA AKCYJNA
 CORPORATE CHARTER POWSZECHNA KASA OSZCZĘDNOŚCI BANK POLSKI SPÓŁKA AKCYJNA I. General provisions 1 1. Powszechna Kasa Oszczędności Bank Polski Spółka Akcyjna, hereinafter referred to as the Bank, is a bank
SEMI-ANNUAL FINANCIAL REPORT. as at 30 June Based on Article 5 of Law 3556/2007
 SEMI-ANNUAL FINANCIAL REPORT as at 30 June 2016 Based on Article 5 of Law 3556/2007 Athens Tower, Building B, 2-4, Mesogheion Avenue, GR-11527, Athens www.cablel.gr HELLENIC CABLES S.A. HOLDINGS SOCIETE
The following issues were brought to the attention of the BoD members:
 Maroussi, August 11 th, 2017 REASONED OPINION OF THE BOARD OF DIRECTORS OF THE COMPANY TRADING AS ''GRIVALIA PROPERTIES REAL ESTATE INVESTMENT COMPANY'' AND WITH DISTINCTIVE TITLE ''GRIVALIA PROPERTIES
VOJVOĐANSKA BANKA A.D., NOVI SAD. Financial Statements Year Ended December 31, 2017 and Independent Auditors Report
 VOJVOĐANSKA BANKA A.D., NOVI SAD Financial Statements Year Ended December 31, 2017 and Independent Auditors Report VOJVOĐANSKA BANKA A.D., NOVI SAD CONTENTS Page Independent Auditors' Report 1 Financial
Notes on pages 9 to 30 form an integral part of these financial statements.
 Eurobank EFG Property Services S.A. Financial Statements for the year ended 31 December 2011 This financial report has been translated from the original report that has been prepared in the Greek language.
Financial statements and independent auditor s report. Sileks Banka ad, Skopje. 31 December 2007
 Financial statements and independent auditor s report Sileks Banka ad, Skopje 31 December 2007 Sileks Banka ad, Skopje Contents Page Independent Auditor s Report 1 Statement on income 3 Balance sheet 4
1 P a g e LAW ON ACCOUNTING. ("Off. Herald of RS", No. 62/2013)
") LAW ON ACCOUNTING ("Off. Herald of RS", No. 62/2013) I GENERAL PROVISIONS Scope of Application Article 1 This law shall regulate the subjects of application of this law, the classification of legal persons,
LAW ON ACCOUNTING ("Off. Herald of RS", No. 62/2013) I GENERAL PROVISIONS Scope of Application Article 1 This law shall regulate the subjects of application of this law, the classification of legal persons,
Code of Corporate Governance MOTOR OIL (HELLAS) S.A.
 S.A.") DISCLAIMER The code set out hereunder describes the best practices in the area of corporate governance followed by the Company with regard to fundamental aspects of its operation. In cases of future changes
DISCLAIMER The code set out hereunder describes the best practices in the area of corporate governance followed by the Company with regard to fundamental aspects of its operation. In cases of future changes
CORPORATE GOVERNANCE CHARTER OF VIOHALCO SA
 CORPORATE GOVERNANCE CHARTER OF VIOHALCO SA as approved by the board of directors of the company on 27 September 2018 TABLE OF CONTENTS 1. INTRODUCTION... 3 2. SHAREHOLDING STRUCTURE... 3 2.1 MAJOR SHAREHOLDERS...
EULER HERMES GROUP ARTICLES OF ASSOCIATION
 Free Translation only EULER HERMES GROUP ARTICLES OF ASSOCIATION French corporation with a Management Board and a Supervisory Board Société anonyme à Directoire et Conseil de Surveillance Registered office:
OJSC NOVOLIPETSK STEEL INTERIM CONDENSED CONSOLIDATED FINANCIAL STATEMENTS
 OJSC NOVOLIPETSK STEEL INTERIM CONDENSED CONSOLIDATED FINANCIAL STATEMENTS PREPARED IN ACCORDANCE WITH ACCOUNTING PRINCIPLES GENERALLY ACCEPTED IN THE UNITED STATES OF AMERICA AS AT MARCH 31, 2014 AND
ARTICLES OF ASSOCIATION OF THE BANK HANDLOWY W WARSZAWIE S.A.
 Uniform text of the Articles of Association of the Bank Handlowy w Warszawie S.A. edited by the Resolution of the Supervisory Board of November 14, 2015 with the amendments adopted by the Resolution No
S.A. REGISTER NUMBER 45340/1NT/B/00/230(00) REGISTERED OFFICE: 34, AMFITHEAS AVENUE, P. FALIRO
 REGISTERED OFFICE: 34, AMFITHEAS AVENUE, P. FALIRO") FINANCIAL STATEMENTS IN ACCORDANCE WITH INTERNATIONAL FINANCIAL REPORTING STANDARDS FOR YEAR 2006 (1 JANUARY 31 DECEMBER 2006), FOR THE COMPANY FORTH-CRS S.A. COMPANY FOR THE RESEARCH, DEVELOPMENT AND
FINANCIAL STATEMENTS IN ACCORDANCE WITH INTERNATIONAL FINANCIAL REPORTING STANDARDS FOR YEAR 2006 (1 JANUARY 31 DECEMBER 2006), FOR THE COMPANY FORTH-CRS S.A. COMPANY FOR THE RESEARCH, DEVELOPMENT AND
FIRST INVESTMENT BANK AD UNCONSOLIDATED FINANCIAL STATEMENTS AS AT 31 DECEMBER 2007 WITH INDEPENDENT AUDITOR S REPORT THEREON
 UNCONSOLIDATED FINANCIAL STATEMENTS AS AT 31 DECEMBER 2007 WITH INDEPENDENT AUDITOR S REPORT THEREON KPMG REPORT OF THE INDEPENDENT AUDITOR TO THE SHAREHOLDERS OF FIRST INVESTMENT BANK AD Sofia, 15 February
Annual Corporate Financial Statements for the year from 1st July 2012 till 30th June 2013 according to IFRS as adopted by the European Union
 Annual Corporate Financial Statements for the year from 1st July 2012 till 30th June 2013 according to IFRS as adopted by the European Union The attached financial statements were approved by the Board
UniSystems Information Technology Systems SA
 UniSystems Information Technology Systems SA Consolidated and Separate Financial Statements for financial year 2017 (from January 1 st to December 31 st, 2017) in accordance with International Financial
FINANCIAL REPORT For the Financial Year from to ACCORDING TO THE INTERNATIONAL FINANCIAL REPORTING STANDARDS
 TORA DIRECT SA- Annual Financial Report 2017 FINANCIAL REPORT For the Financial Year from 01.01.2017 to 31.12.2017 ACCORDING TO THE INTERNATIONAL FINANCIAL REPORTING STANDARDS June 2018 TORA DIRECT SA-
NAME - REGISTERED OFFICE - PURPOSE AND DURATION OF THE COMPANY... 2 SHARE CAPITAL - SHARES - BONDS... 3 BOARD OF DIRECTORS... 6
 BYLAWS MARCH 2017 CONTENTS NAME - REGISTERED OFFICE - PURPOSE AND DURATION OF THE COMPANY... 2 SHARE CAPITAL - SHARES - BONDS... 3 BOARD OF DIRECTORS... 6 BOARD OF STATUTORY AUDITORS... 10 SHAREHOLDERS'
YIOULA GLASSWORKS S.A. AND SUBSIDIARIES NOTES TO THE CONSOLIDATED FINANCIAL STATEMENTS SEPTEMBER 30, 2012
 1. CORPORATE INFORMATION: Yioula Glassworks S.A., a corporation formed under the laws of the Hellenic Republic (also known as Greece), οn August 5, 1959, by Messrs Kyriacos and Ioannis Voulgarakis is the
According to the provisions of current stock market regulation and in specific Presidential Decree 348/1985 and Decisions No. 5/204/14.11.
 ANNUAL BULLETIN 2007 According to the provisions of current stock market regulation and in specific Presidential Decree 348/1985 and Decisions No. 5/204/14.11.2000 and decision No. 7/372/15.02.2006 of
Code of Corporate Governance MOTOR OIL (HELLAS) S.A.
 S.A.") Code of Corporate Governance MOTOR OIL (HELLAS) S.A. Disclaimer The code set out hereunder describes the best practices in the area of corporate governance followed by the Company with regard to fundamental
Code of Corporate Governance MOTOR OIL (HELLAS) S.A. Disclaimer The code set out hereunder describes the best practices in the area of corporate governance followed by the Company with regard to fundamental
Notes to Consolidated Financial Statements Hitachi Chemical Co., Ltd. and Consolidated Subsidiaries For the Years Ended March 31, 2005, 2004 and 2003
 Notes to Consolidated Financial Statements Hitachi Chemical Co., Ltd. and Consolidated Subsidiaries For the Years Ended March 31, 2005, 2004 and 2003 1. BASIS OF PRESENTATION AND SUMMARY OF SIGNIFICANT
Consolidated Balance Sheets
 Consolidated Balance Sheets ANRITSU CORPORATION AND CONSOLIDATED SUBSIDIARIES March 31, 2005 and 2004 (Note 1) 2005 2004 2005 ASSETS Current assets: Cash 31,845 32,830 $ 296,729 Marketable securities (Note
FLUIDRA, S.A. AND SUBSIDIARIES. Consolidated Financial Statements and Consolidated Management Report. December 31, 2016
 FLUIDRA, S.A. AND SUBSIDIARIES Consolidated Financial Statements and Consolidated Management Report December 31, 2016 (Together with the Audit Report thereon) Translation of consolidated financial statements
Articles of Association Zurich Insurance Group Ltd
 Articles of Association Zurich Insurance Group Ltd April 4, 2018 Translation of the Articles of Association of Zurich Insurance Group Ltd, Switzerland This is a translation of the original German version.
INTERIM FINANCIAL RESULTS For the period from 1 July 2009 to 31 December 2009 (According to the article 5 of the Law 3556/2007)
") JUMBO S.A. GROUP OF COMPANIES REG No. 7650/06/B/86/04 Cyprou 9 & Hydras Street, Moschato Attikis INTERIM FINANCIAL RESULTS For the period from 1 July 2009 to 31 December 2009 (According to the article
JUMBO S.A. GROUP OF COMPANIES REG No. 7650/06/B/86/04 Cyprou 9 & Hydras Street, Moschato Attikis INTERIM FINANCIAL RESULTS For the period from 1 July 2009 to 31 December 2009 (According to the article
YIOULA GLASSWORKS S.A. AND SUBSIDIARIES NOTES TO THE CONSOLIDATED FINANCIAL STATEMENTS JUNE 30, 2011
 1. CORPORATE INFORMATION: Yioula Glassworks S.A., a corporation formed under the laws of the Hellenic Republic (also known as Greece), οn August 5, 1959, by Messrs Kyriacos and Ioannis Voulgarakis is the
C I M E N T S F R A N Ç A I S
 C I M E N T S F R A N Ç A I S BY-LAWS 4 November 2014 Translation* *This is an unofficial translation. In case of doubt or difference of interpretation, the official French version of the Articles of Association
AEGEAN AIRLINES S.A. Societe Anonyme Reg. No.: 32603/06/Β/95/3 31 Viltanioti Street, Kifissia, Attica
 AEGEAN AIRLINES S.A. Societe Anonyme Reg. No.: 32603/06/Β/95/3 31 Viltanioti Street, Kifissia, Attica Interim Financial Report for the period (1 st January to 30 th September 2015) In accordance with the
COMPANY ANNOUNCEMENT
 COMPANY ANNOUNCEMENT The following is a Company Announcement issued by GO p.l.c. ( GO ) pursuant to the Malta Financial Services Authority Listing Rules. Quote GO hereby announces that, with reference
This financial report has been translated from the original report that has been prepared in the Greek language. Reasonable care has been taken to
 Eurobank Properties REIC FINANCIAL REPORT for the six month period ended June 30 2012 This financial report has been translated from the original report that has been prepared in the Greek language. Reasonable
THRACE PLASTICS Co. S.A.
 THRACE PLASTICS Co. S.A. SEMI-ANNUAL FINANCIAL REPORT 1st January - 30th June 2017 IN ACCORDANCE WITH THE ARTICLE 5 OF LAW 3556/2007 Company Reg. No. 11188/06/Β/86/31 General Commerce Reg. No. 12512246000
Financial Section. P. 44 Consolidated Balance Sheet. P. 46 Consolidated Statement of Income. P. 47 Consolidated Statement of Comprehensive Income
 Financial Section P. 44 Consolidated Balance Sheet P. 46 Consolidated Statement of Income P. 47 Consolidated Statement of Comprehensive Income P. 48 Consolidated Statement of Changes in Equity P. 49 Consolidated
Annual Financial Report
 Annual Financial Report as at 31 December 2017 Pursuant to article 4 of L. 3556/2007 ELVALHALCOR HELLENIC COPPER AND ALUMINIUM INDUSTRY S.A. G.C.Registry.: 303401000 SA Registry No:2836/06/B/86/48 SEAT:
Uni Systems Information Systems AE
 Uni Systems Information Systems AE Consolidated and Separate Financial Statements for the Year 2009 (period from 1 January to 31 December 2009) compiled in accordance with the International Financial Reporting
Consolidated Financial Statements for the year ended December 31 st, 2007 In accordance with International Financial Reporting Standards («IFRS»)
") INFO-QUEST S.A. Consolidated Financial Statements for the year ended December 31 st, 2007 In accordance with International Financial Reporting Standards («IFRS») The attached financial statements have
INFO-QUEST S.A. Consolidated Financial Statements for the year ended December 31 st, 2007 In accordance with International Financial Reporting Standards («IFRS») The attached financial statements have
Articles of Association
 Aéroports de Paris A public limited company (Société Anonyme) with share capital of 296,881,806 Registered office: 1, rue de France, 93290 Tremblay en France Registered in the Trade and Companies Register
AKTOR SA GROUP. Annual Financial statements under the International Financial Reporting Standards for the financial year ended 31 December 2005
 AKTOR SA GROUP Annual Financial statements under the Standards for the financial year ended AKTOR S.A. 18 FILELLINON st. 152 32 CHALANDRI VAT Number: 094149722 Tax Office: FAVE ATHENS No in the Register
We believe that the audit evidence we have obtained is sufficient and appropriate to provide a basis for our audit opinion.
 ABCD KPMG d.o.o. Beograd Kraljice Natalije 11 11000 Belgrade Serbia Telephone: Fax: E-mail: Internet: +381 11 20 50 500 +381 11 20 50 550 info@kpmg.rs www.kpmg.rs Independent Auditors Report TO THE OWNERS
ANNUAL DISCLOSURES FOR 2010 ON AN UNCONSOLIDATED BASIS
 ANNUAL DISCLOSURES FOR 2010 ON AN UNCONSOLIDATED BASIS ACCORDING TO THE REQUIREMENTS OF ORDINANCE 8 OF THE BULGARIAN NATIONAL BANK FOR THE CAPITAL ADEQUACY OF CREDIT INSTITUTIONS /ART. 335 OF ORDINANCE
SYSTEMS SUNLIGHT S.A
 SYSTEMS SUNLIGHT S.A Registration Number: 31055/04/B/94/157 (2006) No G.E.C.R 001579901000 ERMOY 2 & NIKIS, ATHENS SIX-MONTH FINANCIAL REPORT FOR THE PERIOD ENDED 30 JUNE 2017 According to the article
LAW ON BANKING AGENCY OF REPUBLIKA SRPSKA. Article 1
 Translation by Banking Agency of Republika Srpska LAW ON BANKING AGENCY OF REPUBLIKA SRPSKA I. GENERAL PROVISIONS Article 1 This Law shall regulate the status, authority, organization, financing and operation
E Consolidated Financial Statements
 E Consolidated Financial Statements 1. Significant accounting policies 204 2. Accounting estimates and assessments 214 3. Consolidated Group 215 4. Revenue 216 5. Functional costs 217 6. Other operating
FINANCIAL REPORT For The Financial Year from to ACCORDING TO THE INTERNATIONAL FINANCIAL REPORTING STANDARDS July 2018.
 TORA DIRECT SA- Annual Financial Report 2017 FINANCIAL REPORT For The Financial Year from 01.01.2017 to 31.12.2017 ACCORDING TO THE INTERNATIONAL FINANCIAL REPORTING STANDARDS July 2018 1 of 61 TORA DIRECT
BYLAWS. September 2015 CONTENTS
 TELECOM ITALIA BYLAWS TELECOM ITALIA STATUTO BYLAWS September 2015 CONTENTS Name - Registered office - Purpose and duration of the Company 2 Share Capital Shares Bonds 3 Board of Directors 6 Board of Statutory
LAW 2832/2000. Chapter A Deposit Guarantee Scheme
 LAW 2832/2000 Chapter A Deposit Guarantee Scheme Article 1: Purpose Part III of this Law aims to incorporate provisions of Directive 94/19/EC of the European Parliament and of the Council of the European
SELONDA AQUACULTURES A.E.G.E. GENERAL ELECTRONIC COMMERCIAL REGISTRY (GEMI) NO.
 NO.") SELONDA AQUACULTURES A.E.G.E. GENERAL ELECTRONIC COMMERCIAL REGISTRY (GEMI) NO. 769101000 Annual Financial Report Financial Year 2015 (Period from 1st January -31st December 2015) According to article
SELONDA AQUACULTURES A.E.G.E. GENERAL ELECTRONIC COMMERCIAL REGISTRY (GEMI) NO. 769101000 Annual Financial Report Financial Year 2015 (Period from 1st January -31st December 2015) According to article
Financial Statements. and Independent Auditors Report
 KOMERCIJALNA BANKA A.D., BEOGRAD Financial Statements Year Ended and Independent Auditors Report KOMERCIJALNA BANKA A.D., BEOGRAD CONTENTS Page Independent Auditors' Report 1-2 Income Statement 3 Statement
Consolidated Financial Statements. Independent Auditors Report
 KOMERCIJALNA BANKA A.D., BEOGRAD Consolidated Financial Statements Year Ended and Independent Auditors Report CONTENTS Page Independent Auditors' Report 1-2 Consolidated Financial Statements: Consolidated
mts banka a.d. BELGRADE Financial Statements as of and for the Year Ended 31 December 2016 and Independent Auditor s Report
 mts banka a.d. BELGRADE Financial Statements as of and for the Year Ended 31 December 2016 and Independent Auditor s Report mts banka a.d. Belgrade CONTENTS Page INDEPENDENT AUDITOR S REPORT 1-2 FINANCIAL
FOLLI-FOLLIE COMMERCIAL MANUFACTURING AND TECHNICAL SOCIETE ANONYME FOR THE PERIOD TO
 2017 FOLLI-FOLLIE COMMERCIAL MANUFACTURING AND TECHNICAL SOCIETE ANONYME REG. NO.: 3027701000 23 RD KM ATHENS LAMIA HIGHWAY 145 65, AG. STEFANOS, ATTICA FOR THE PERIOD 01.01.2017 TO 30.06.2017 According
World Duty Free S.p.A. Procedure for the Management and Public Disclosure of Inside Information
 World Duty Free S.p.A. Procedure for the Management and Public Disclosure of Inside Information Approved by the Board of Directors on 31 July 2013 DEFINITIONS For the purposes of this procedure: (i) all
Condensed Consolidated Interim Financial Information for the period ended June 30 th, 2008
 INFO-QUEST S.A. Condensed Consolidated Interim Financial Information for the period ended June 30 th, 2008 in accordance with International Financial Reporting Standards («IFRS») The attached interim financial
We believe that the audit evidence we have obtained is sufficient and appropriate to provide a basis for our audit opinion.
 ABCD KPMG d.o.o. Beograd Kraljice Natalije 11 11000 Belgrade Serbia Telephone: Fax: E-mail: Internet: +381 11 20 50 500 +381 11 20 50 550 info@kpmg.rs www.kpmg.rs Independent Auditors Report TO THE SHAREHOLDERS
Articles of Incorporation Zurich Insurance Group Ltd 2016
 Articles of Incorporation Zurich Insurance Group Ltd 2016 Translation of the Articles of Incorporation of Zurich Insurance Group Ltd, Switzerland This is a translation of the original German version. In
BANCA INTESA a.d. BELGRADE. Separate Financial Statements as of and for the Year Ended 31 December 2017 and Independent Auditor s Report
 Separate Financial Statements as of and for the Year Ended 31 December 2017 and Independent Auditor s Report CONTENTS Page INDEPENDENT AUDITOR S REPORT 1-2 SEPARATE FINANCIAL STATEMENTS Separate Balance
SERBIAN EXPORT AND INSURANCE AGENCY j.s.c., UŽICE. Restated Financial Statements for the Year Ended 31 December 2013 and Independent Auditor s Report
 SERBIAN EXPORT AND INSURANCE AGENCY j.s.c., UŽICE Restated Financial Statements for the Year Ended 31 December 2013 and Independent Auditor s Report This version of our report/ the accompanying documents
CONSOLIDATED FINANCIAL STATEMENTS
 TSUBAKIMOTO CHAIN CO. and Consolidated Subsidiaries CONSOLIDATED FINANCIAL STATEMENTS Year Ended March 31, 2017 with Independent Auditor s Report Consolidated Balance Sheet TSUBAKIMOTO CHAIN CO. and Consolidated
ACERINOX, S.A. AND SUBSIDIARIES. 31 December 2015
 ACERINOX, S.A. AND SUBSIDIARIES Annual Accounts of the Consolidated Group 31 December 2015 (Free translation from the original in Spanish. In the event of discrepancy, the Spanishlanguage version prevails.)
THE LIMITED LIABILITY COMPANY FOR FINANCE LEASE INTESA LEASING d.o.o. BELGRADE
 THE LIMITED LIABILITY COMPANY FOR FINANCE LEASE INTESA LEASING d.o.o. BELGRADE Financial Statements as of and for the Year Ended 31 December 2017 and Independent Auditor s Report CONTENTS Page INDEPENDENT
I. GENERAL PROVISIONS
 ARTICLES OF ASSOCIATION OF SELENA FM S.A. I. GENERAL PROVISIONS 1 The Company was established by way of transformation of Selena FM sp. z o.o. (limited liability company) into a joint stock company (S.A).
Financial Statements and Independent Auditors Report. Eurostandard Banka AD, Skopje. 31 December 2008
 Financial Statements and Independent Auditors Report Eurostandard Banka AD, Skopje 31 December 2008 Eurostandard Banka AD Skopje Contents page Independent Auditors Report 1 Income Statement 2 Balance Sheet
GROUP AUDIT AND RISK COMMITTEE CHARTER 1. CONSTITUTION AND COMPOSITION 2. PURPOSE AND OBJECTIVES
 GROUP AUDIT AND RISK COMMITTEE CHARTER The Coronation Group includes Coronation Fund Managers Limited ( Coronation Fund Managers ) and all companies that from time to time are directly or indirectly subsidiaries
Amadeus IT Group, S.A. Auditors Report, Annual Accounts and Directors Report for the year ended December 31, 2014
 Amadeus IT Group, S.A. Auditors Report, Annual Accounts and Directors Report for the year ended December 31, 2014 Amadeus IT Group, S.A. Auditors Report for the year ended December 31, 2014 Amadeus IT
Unaudited Consolidated Financial Statements of NAV CANADA. Three and nine months ended May 31, 2010
 Unaudited Consolidated Financial Statements of NAV CANADA Three and nine months ended May 31, 2010 Consolidated Balance Sheets (unaudited) (in millions of dollars) Assets Current assets May 31 August 31
ALPHA BANK CYPRUS LTD
 ALPHA BANK CYPRUS LTD ANNUAL REPORT 2011 Table of Contents CONTENTS Page Board of Directors and Professional Advisers 4 Statement of the members of the Board of Directors and the responsible person of
PROFILE SYSTEMS & SOFTWARE S.R.L. DRAFT FINANCIAL STATEMENTS for the year ended 31 December 2009 prepared in accordance with IFRS
 DRAFT FINANCIAL STATEMENTS for the year ended 31 December 2009 prepared in accordance with IFRS FINANCIAL STATEMENTS CONTENTS PAGE Administrator and other officers 1 Report of the Administrator 2 Auditors'
Financial and Non-financial Highlights Financial Section Consolidated Balance Sheet
 Financial and Non-financial Highlights Financial Section Consolidated Balance Sheet Yokogawa Electric Corporation and its Consolidated Subsidiaries March 31, 2017 ASSETS (Note 1) Current Assets: Cash and
INTERIM FINANCIAL RESULTS For the period from 1 July 2013 to 31 December 2013 (According to the article 5 of the Law 3556/2007)
") JUMBO S.A. GROUP OF COMPANIES REG No. 7650/06/B/86/04 - G.E.MI.No. 121653960000 Cyprou 9 & Hydras Street, Moschato Attikis INTERIM FINANCIAL RESULTS For the period from 1 July 2013 to 31 December 2013
JUMBO S.A. GROUP OF COMPANIES REG No. 7650/06/B/86/04 - G.E.MI.No. 121653960000 Cyprou 9 & Hydras Street, Moschato Attikis INTERIM FINANCIAL RESULTS For the period from 1 July 2013 to 31 December 2013
Articles of Association of Mikron Holding AG. 12 April 2016
 Articles of Association of Mikron Holding AG 12 April 2016 Contents I. General Provisions 3 II. Capital 3 III. Organisation 5 A. General Meeting B. The Board of Directors C. The Auditors IV. Accounting
NOTES TO CONSOLIDATED FINANCIAL STATEMENTS Hitachi Chemical Co., Ltd. and Consolidated Subsidiaries For the Years Ended March 31, 2006, 2005 and 2004
 NOTES TO CONSOLIDATED FINANCIAL STATEMENTS Hitachi Chemical Co., Ltd. and Consolidated Subsidiaries For the Years Ended March 31, 2006, 2005 and 2004 1. BASIS OF PRESENTATION AND SUMMARY OF SIGNIFICANT
FLEXOPACK PLASTICS S.A.
 TZIMA LOCATION 194 00 KOROPI ATTICA, GREECE General Commercial Registry No. 582101000 FLEXOPACK PLASTICS S.A. Semi-Annual Financial Report For the period from 1st January to 30th June 2017 According to
BANCA TRANSILVANIA S.A. Consolidated Financial Statements 31 December 2009
 BANCA TRANSILVANIA S.A. Consolidated Financial Statements 31 December 2009 Prepared in accordance with the International Financial Reporting Standards as endorsed by the European Union TRANSLATOR S EXPLANATORY
"TITLE II TAKEOVER BIDS OR EXCHANGE TENDER OFFERS. Chapter I General rules. Article 35 (Definitions)
") Unofficial English version of Amendments to the enactment regulation of Italian Legislative Decree no. 58 of 24 February 1998, concerning the issuers' regulation, adopted with resolution no. 11971 of 14
Unofficial English version of Amendments to the enactment regulation of Italian Legislative Decree no. 58 of 24 February 1998, concerning the issuers' regulation, adopted with resolution no. 11971 of 14
DEPOSIT INSURANCE AGENCY, BELGRADE. Financial Statements for the Year Ended 31 December 2015 and Independent Auditor s Report
 Financial Statements for the Year Ended 31 December 2015 and Independent Auditor s Report Public Disclosure Authorized Public Disclosure Authorized Public Disclosure Authorized Public Disclosure Authorized
Disclaimer FORWARD LOOKING STATEMETNS. This text includes forward looking statements.
 May 2017 Disclaimer This presentation has been prepared by Halcor S.A. (the «Company») for use during the Hellenic Fund and Asset Management Association. This text is provided under confidentiality for
KOMERCIJALNA BANKA A.D., BEOGRAD. Financial Statements Year Ended December 31, 2014 and Independent Auditors Report
 KOMERCIJALNA BANKA A.D., BEOGRAD Financial Statements Year Ended and Independent Auditors Report KOMERCIJALNA BANKA A.D., BEOGRAD CONTENTS Page Independent Auditors' Report 1 Financial Statements: Balance
Translation from Polish Bank Millennium S.A. MANAGEMENT BOARD S OPERATIONS BYLAWS
 Translation from Polish Bank Millennium S.A. MANAGEMENT BOARD S OPERATIONS BYLAWS Text determined in the Resolution of the Supervisory Board No. 28/2015 dated 24 July 2015. Bank Millennium S.A. MANAGEMENT
NOTES TO CONSOLIDATED FINANCIAL STATEMENTS
 NOTES TO CONSOLIDATED FINANCIAL STATEMENTS Asahi Group Holdings, Ltd. and Consolidated Subsidiaries 1. Basis of Presenting Consolidated Financial Statements The accompanying consolidated financial statements
CI GAMES GROUP CONSOLIDATED QUARTERLY REPORT Q3 2013
 CI GAMES GROUP Q3 2013 Warsaw, November 14, 2013 2 CONTENTS I. CONSOLIDATED FINANCIAL DATA - CI GAMES GROUP 4 II. SEPARATE FINANCIAL DATA - CI GAMES S.A. 13 III. FINANCIAL HIGHLIGHTS 22 IV. NOTES TO THE
Notice of no Auditor Review of Interim Financial Report 2. Consolidated Interim Statements of Financial Position 3
 Consolidated Interim Financial Statements For the nine months ended September 30, 2014 Index Page Notice of no Auditor Review of Interim Financial Report 2 Consolidated Interim Financial Statements Consolidated
American Bank of Albania Sh.a. Consolidated Financial Statements as of 31 December 2007 (with independent auditor s report thereon)
") Consolidated Financial Statements as of 31 December 2007 (with independent auditor s report thereon) Ernst & Young Certified Auditors Sh.p.k.Skopje - Tirana Branch Blv. Bajram Curri, European Trade Center
Consolidated Financial Statements as of 31 December 2007 (with independent auditor s report thereon) Ernst & Young Certified Auditors Sh.p.k.Skopje - Tirana Branch Blv. Bajram Curri, European Trade Center
FINANZIA, BANCO DE CREDITO, S.A. BY-LAWS INCORPORATION, NAME, REGISTERED OFFICES, CORPORATE PURPOSE AND DURATION OF INCORPORATION
 FINANZIA, BANCO DE CREDITO, S.A. BY-LAWS CHAPTER I INCORPORATION, NAME, REGISTERED OFFICES, CORPORATE PURPOSE AND DURATION OF INCORPORATION Art. 1.- The Company, herein named FINANZIA, Banco de Crédito,
TOTAL S.A. Registered Office. 2, place Jean Millier La Défense Courbevoie FRANCE CHARTER AND BYLAWS. Last update on 31 December, 2014
 TOTAL S.A. A SOCIETE ANONYME WITH A CAPITAL OF 5,963,168,812.50 EUROS REPRESENTED BY 2,385,267,525 SHARES OF 2.50 EUROS EACH NANTERRE TRADE AND COMPANIES REGISTER 542 051 180 Registered Office 2, place
International Endesa B.V. Financial Statements 2011
 International Endesa B.V. Financial Statements 2011 Index Page Financial Statements 2011 Management Board report 2 Financial Statements 6 Balance sheet 7 Profit and loss 8 Statement of cash flows 9 Statement
CONNECTED PARTY TRANSACTIONS
 Details of Connected Party Transactions Following completion of the Global Offering, there will be continuing transactions between The Link REIT and the following persons noted below, which will constitute