XL Capital Ltd Global Loss Triangles
|
|
|
- Leon Walsh
- 6 years ago
- Views:
Transcription

1 XL Capital Ltd 2006 Global Loss Triangles Global Loss JUNE 6, 2007
2 XL Capital Ltd 2006 Global Loss TriangleS GLOBAL LOSS TRIANGLES CAUTIONARY LANGUAGE 1 - Cautionary Note Regarding Forward-Looking Statements 1 INTRODUCTION 2 DESCRIPTION OF DATA PRESENTED 2 - Global Loss Triangle Classes 3 - Large Losses 4 - Discontinued Business 4 - Miscellaneous Adjustments 4 - Discounting 5 - London Market Data Adjustment to Accident Year 5 RECONCILIATION TO FINANCIAL STATEMENTS 5 - Reconciliation of Global Loss Triangles with GAAP Reserves 6 RESERVING PROCESSES 7 - Standard Processes 7 - Limitations of the Standard Processes 7 - Underwriting Year Projections 8 GLOBAL LOSS TRIANGLES CLASS DESCRIPTIONS 8 - Insurance Property 9 - Insurance Casualty 9 - Insurance Professional 9 - Insurance Specialty 10 - Reinsurance Property Catastrophe 10 - Reinsurance Property Other 10 - Reinsurance U.S. Casualty 11 - Reinsurance Non-U.S. Casualty 12 - Reinsurance Marine and Aviation 12 - Reinsurance Other AND 2005 LARGE EVENT LOSS SUMMARY 14 XL CAPITAL LTD 2006 GLOBAL LOSS TRIANGLES INSURANCE SEGMENT - XL Insurance Segment Total 15 - Property 16 - Casualty 17 - Professional 18 - Specialty 19 XL CAPITAL LTD 2006 GLOBAL LOSS TRIANGLES REINSURANCE SEGMENT - XL Reinsurance Segment Total 20 - Property Catastrophe 21 - Property Other 22 - U.S. Casualty 23 - Non-U.S. Casualty 24 - Marine and Aviation 25 - Other 26
3 XL Capital Ltd 2006 Global Loss TriangleS GLOBAL LOSS TRIANGLES CAUTIONARY LANGUAGE The data in this publication is for informational purposes only and is current only as of its stated date, which is December 31, The Company is under no obligation to and does not expect to update or revise this data, whether as a result of new information, future events or otherwise, even when such new data has been reflected in the Company s filings with the U.S. Securities and Exchange Commission (the SEC ). The development patterns disclosed are an important factor in the process used by the Company to estimate loss reserve requirements, however they are not the only factors considered by the Company to establish reserves. The process for establishing reserves is subject to considerable variability, as it requires the use of informed estimates and judgments. Important details, such as specific loss development expectations for particular contracts, years or events, cannot be developed by analyzing the information provided herein. In addition to analyzing loss development information, the Company incorporates additional information into its reserving process such as pricing and market conditions. Readers are cautioned to consider these and any other qualifications described in this publication when reviewing this data. This publication should be read in conjunction with those documents filed by the Company with the SEC including the Company s most recent Annual Report on Form 10-K and Quarterly Reports on Form 10-Q. Cautionary Note Regarding Forward-Looking Statements: This publication contains forward-looking statements that are made pursuant to the Private Securities Litigation Reform Act of 1995 ( PSLRA ) safe harbor for forward-looking statements. Statements that are not historical facts, including statements about the Company s beliefs, plans or expectations, and statements that include the words expect, intend, plan, believe, project, anticipate, will, may, and similar statements of a future or forward-looking nature, identify forward-looking statements for purposes of the PSLRA or otherwise. These statements are based on current plans, estimates, and expectations. Actual results may differ materially from those included in such forward-looking statements and therefore you should not place undue reliance on them. A non-exclusive list of the important factors that could cause actual results to differ materially from those in such forward-looking statements includes the following: (a) changes in the size of the Company s claims relating to natural catastrophes; (b) greater frequency or severity of claims and loss activity than the Company s underwriting, reserving or investment practices anticipate based on historical experience or industry data; (c) trends in rates for property and casualty insurance and reinsurance; (d) developments in the world s financial and capital markets that adversely affect the performance of the Company s investments or access to such markets; (e) changes in general economic conditions, including foreign currency exchange rates, inflation and other factors; and (f) the other factors set forth in the Company s most recent reports on Form 10-K, Form 10-Q, and other documents on file with the SEC, as well as management s response to any of the aforementioned factors. The Company undertakes no obligation to update or revise publicly any forward-looking statement, whether as a result of new information, future developments or otherwise.
4 XL Capital Ltd 2006 Global Loss TriangleS INTRODUCTION As an enhancement to our regular financial disclosures, XL Capital is pleased to introduce its first publication of Global Loss Triangles (GLTs), providing gross paid and reported loss and allocated loss adjustment expense (ALAE) data as of December 31, 2006 for our Insurance and Reinsurance Segments. These triangles are intended to provide a view of the Company s global spread of insurance and reinsurance business by general class and type and additional insights into the loss development characteristics of our business as of December 31, Our results of operations and financial condition depend upon our ability to assess accurately the potential losses associated with the risks that we insure and reinsure. Loss reserves are established due to the significant periods of time that may lapse between the occurrence, reporting and payment of a loss. The process of establishing reserves for property and casualty claims can be complex and is subject to considerable variability as it requires the use of informed estimates and judgments. Actuarial estimates of unpaid loss and loss adjustment expense (LAE) reserves are subject to potential errors of estimation, which could be significant, due to the fact that the ultimate disposition of claims incurred prior to the date of such estimation, whether reported or not, is subject to the outcome of events that have not yet occurred. Any estimate of future costs is subject to the inherent limitation on the ability to predict the aggregate course of future events. It should therefore be expected that the actual emergence of ultimate loss and LAE will vary, perhaps materially, from any such estimate. The GLTs are presented in thousands of U.S. dollars, reflecting conversions from the local currencies in which the business was written. Changes in foreign exchange rates could cause dramatic shifts in apparent loss development if historical rates of exchange were applied in subsequent year-end valuations. Foreign currency denominated losses throughout the triangles are stated at the exchange rates in effect as of the system close dates for year-end 2006 processing. An adjustment is made in the reconciliation to reflect movements in exchange rates from the system close date to December 31, Paid losses are also shown at historical rates of exchange. Our Insurance and Reinsurance Segments are presented separately. The Insurance triangles contain accident/report year information for The Reinsurance triangles contain underwriting year information for , with U.S. Casualty business shown for All triangles also show a Prior line for earlier years than those detailed. The legal environment in the U.S. is typically less predictable than in other countries, and reinsurance claims typically develop over a longer period than primary claims. The expanded number of underwriting years for U.S. Casualty reinsurance business should help illustrate reasonable expectations concerning the development for this business. DESCRIPTION OF DATA PRESENTED For each class of business shown, we present written premiums and earned premiums, both gross and net of reinsurance. We also show a triangle of cumulative gross paid loss and ALAE, a triangle of cumulative gross reported (paid plus case reserves) loss and ALAE, and the latest cumulative net paid and reported loss and ALAE. For Insurance Segment data, the triangles are shown on either an accident year or report year basis, with the premiums on a calendar year basis. Loss data related to the Insurance Professional class of business is presented on a report year basis while all other Insurance classes are presented on an accident year basis. For the Reinsurance Segment, the triangles are shown on an underwriting year basis, with the premiums also on an underwriting year basis. These conventions match the standard reserving practices for direct insurance and for reinsurance, respectively. We have not included net loss and ALAE triangles for reasons explained below. Case reserves for the Company s reinsurance general operations are generally established based on reports received from ceding companies. Additional case reserves (ACRs) may be established by the Company
5 XL Capital Ltd 2006 Global Loss TriangleS to reflect the Company s estimated ultimate cost of a loss. Any such ACRs have been included along with case reserves in the reported loss triangles presented herein. It should be noted that much of the loss data included in the triangles in years prior to 2002 corresponds to business underwritten by entities prior to their acquisition by XL. Significant underwriting changes were made in many of these operations postacquisition that have had impacts on the profitability and loss development characteristics of the business. For this reason, caution should be exercised if data from these older years are used to project results for more recent years. As a result of the underwriting changes as well as the maturity of the business, premium data for years prior to 2002 has not been provided. While acquisition activity has also impacted the Reinsurance Segment, premium data has been included for a full 10-year period for two reasons. First, the development patterns are longer for Casualty Reinsurance business indicating the need to consider premium-based methods in certain cases for years prior to Second, the classification of the data presented in the triangles for Reinsurance permits the separate analysis of U.S. Casualty business (which forms the bulk of the acquired business) and descriptions of the associated underwriting changes are provided to allow the user to take these changes into consideration. We do believe, however, that reasonable inferences can be drawn concerning our net reserve position from simple ratios of latest net valuations to latest gross valuations, particularly those indicated by our held reserves. Therefore, to allow similar comparisons of gross and net reserve positions, we provide the latest valuation of the related net loss data. That is, net paid and reported loss and ALAE is provided by year by GLT Class as of December 31, Furthermore, since a large portion of our ceded reserves relate to catastrophic events, we have provided full ceded loss information including ceded incurred but not reported (IBNR) for two categories of catastrophic loss events namely the 2004 hurricanes (specifically Charley, Frances, Ivan and Jeanne), and 2005 hurricanes/floods (specifically Katrina, Rita, Wilma, Erwin, and European Floods). These events are shown separately and are discussed in more detail further in this disclosure. Global Loss Triangle Classes Triangles are provided for 10 GLT Classes, four for the Insurance Segment and six for the Reinsurance Segment as follows: Insurance Segment Property Casualty Professional Specialty A further complication to the reserving analysis resulting from historical acquisitions is that we have inherited many complex reinsurance arrangements, especially through the Winterthur International acquisition in Many loss recoveries related to such arrangements can only be evaluated on their own merits with a by-line-ofbusiness or by-treaty analysis. For this reason, gross loss triangles offer a more stable and dependable base from which to project ultimate losses, especially for the years affected by our growth by acquisition. Therefore, the paid and reported triangles herein are presented on a gross basis. For the reasons cited above, you should not draw inferences concerning our net reserve position by projecting net loss development patterns in isolation. Reinsurance Segment Property Catastrophe Property Other U.S. Casualty Non-U.S. Casualty Marine and Aviation Other Insurance Specialty includes marine, energy, aviation, satellite, environmental, programs, equine, warranty and excess and surplus lines. Reinsurance Other includes political risk, surety, warranty, accident and health, whole account business and other lines. Further details on the nature of the business included within each of the classes above are provided in a later section. The user should read these sections carefully
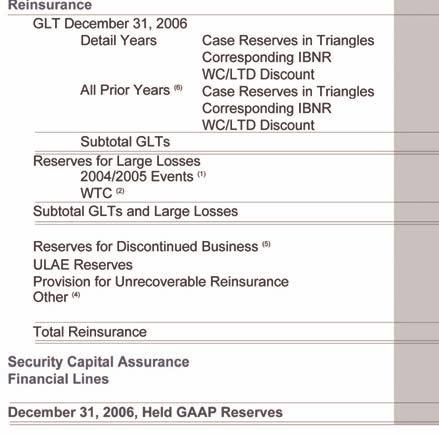
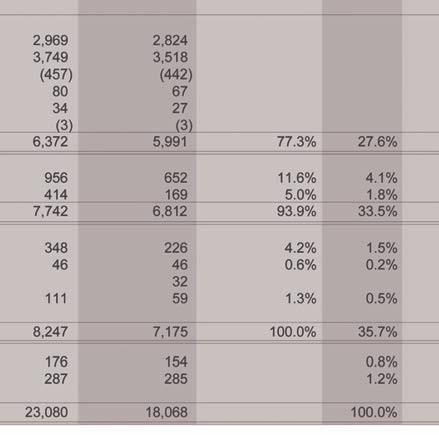
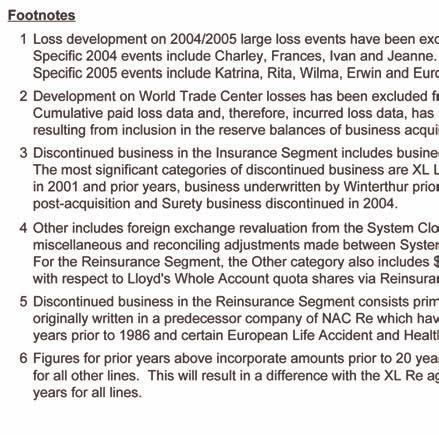
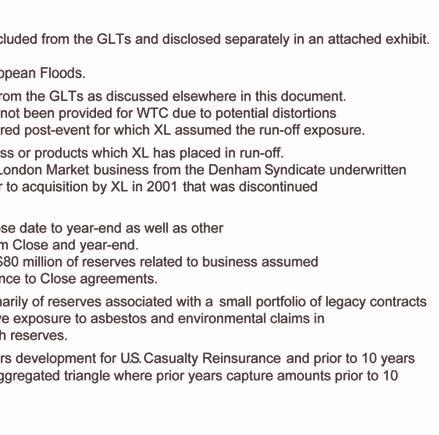
6 XL Capital Ltd 2006 Global Loss TriangleS as they provide important information on the nature of the underlying business and historical changes in business mix that impact the reserve analysis. Large Losses Loss development associated with three major groups of catastrophic losses has been excluded from the triangles, specifically World Trade Center (WTC), 2004 hurricanes, and 2005 hurricanes/floods. These events have been excluded from the triangles due to their magnitude and, in the case of the 2004 and 2005 events, due to their occurrence in recent years, in order to avoid distortions in the development factors and indicated reserve levels. Reserves for these events are not based on aggregate development statistics, but rather on ground-up exposure-based assessments reflecting information provided by insureds and cedants on a contract-by-contract basis. Separate disclosure is provided on these catastrophic losses including gross and net paid losses, gross and net reported losses, and gross and net IBNR as at December 31, For WTC, only the gross and net total reserve amounts are provided due to the complexity arising from the fact that XL assumed the run-off of certain WTC liabilities through acquisition-related activity, specifically the acquisition of a 100% stake in Le Mans Ré in 2003 and as a result of the conclusion of the Winterthur net reserve seasoning process in November This means that the reported reserves include the unpaid portion of the liabilities, yet we were not responsible for all of the historical payments associated with these claims. Thus, the actual portion of the payments made by the Company would not be consistent with the remaining unpaid liabilities and have therefore not been provided. Discontinued Business Discontinued business refers to business that has been excluded from the triangles due to the fact that the business is in run-off. In most cases, the original business was acquired through acquisition and was either already in run-off when acquired or was subsequently placed into run-off because it did not meet our strategic objectives. Loss data from these discontinued lines of business is not reflected in the triangles so as not to distort the historical development patterns that are used as the basis for projecting the more recent years. Also, some of the discontinued business is not suited to loss development analysis (e.g., asbestos and environmental exposures) or loss development statistics are not available for a sufficient time period to allow such analysis (e.g., because credible historical development data was not available from the original underwriting entity). Within the Insurance Segment, the discontinued business is primarily from two business groups which are now in run-off. The first is XL London Market business written in years 2001 and prior from the Denham Syndicate. The second is business written by Winterthur International prior to its acquisition by XL in 2001 that was discontinued post-acquisition. This is primarily Casualty business. Furthermore, Surety business was discontinued in The discontinued business in the Reinsurance Segment consists primarily of loss reserves associated with a small portfolio of legacy contracts originally written in a predecessor company of NAC Re that have exposure to asbestos and environmental claims prior to 1986 and certain European Life Accident and Health reserves. The reconciliation on page six shows that approximately 11% of total held gross reserves and 8% of total held net reserves correspond to discontinued business at December 31, Miscellaneous Adjustments In addition to the excluded business noted above, there are a number of adjustments that are required to reconcile the loss reserves in the triangles and large loss disclosure to the held reserves as at December 31, These items include movement in reserves due to foreign exchange rate movements between our system close date when the triangles were generated and the actual year-end rates, unallocated loss adjustment expense reserves, the provision for unrecoverable reinsurance (which affects the net reserve amounts) and other miscellaneous reconciling adjustments.
7 XL Capital Ltd 2006 Global Loss TriangleS These amounts, which represented approximately 2% of held gross reserves and 4% of held net reserves as at year-end 2006, are shown in the reconciliation on page six. Discounting Except for certain workers compensation and longterm disability liabilities, XL does not discount its unpaid loss and LAE reserves. XL utilizes tabular reserving for workers compensation and long-term disability unpaid losses that are considered fixed and determinable, and discounts such losses using an interest rate of 5%. The interest rate approximates the average yield to maturity on specific fixed income investments that support these liabilities. The tabular reserving methodology results in applying uniform and consistent criteria for establishing expected future indemnity and medical payments (including an explicit factor for inflation) and the use of mortality tables to determine expected payment periods. included in the reconciliation of the reserves from the triangles to the held reserves. London Market Data Adjustment to Accident Year As noted above, the Insurance Segment data is presented on an accident year or report year basis which is consistent with the basis for analysis for the vast majority of this Segment s reserves. The exception to this is for business written in our London Market operation which is generally analyzed on a treaty or underwriting year basis. For the purposes of the Insurance Segment triangles contained herein, we have allocated the London Market underwriting year data to accident year to facilitate the combination of the London Market data with other Insurance Segment data by GLT Class on an accident year basis. The basis for the allocation is the assumption that 50% of a given underwriting year is associated with the corresponding accident year and 50% is associated with the next accident year. The loss triangles included herein are presented on a gross of discount basis, reflecting the undiscounted case-basis reserves established using the tabular reserving methodology. This provides the most appropriate basis for establishing reserve levels on an undiscounted basis. The amount of discount is then determined for both case and IBNR reserves and booked accordingly. The amount of discount is RECONCILIATION TO FINANCIAL STATEMENTS The following page provides a reconciliation of the unpaid reserves in the GLTs to our held reserves at December 31, 2006.


8 XL CAPITAL LTD 2006 GLOBAL LOSS TRIANGLES 6
9 XL Capital Ltd 2006 Global Loss TriangleS RESERVING PROCESSES Standard Processes When estimating IBNR reserves, each of the Company s insurance and reinsurance business units segregate business into exposure classes and over 150 classes are reviewed in total. Within each class, the business is further segregated by either the year in which the contract incepted ( underwriting year ), the year in which the claim occurred ( accident year ), or the year in which the claim is reported ( report year ). The majority of the loss reserves related to the Insurance segment are reviewed on an accident year basis and on an underwriting year basis for the Reinsurance segment. Generally, initial actuarial estimates of IBNR reserves not related to a specific event, i.e., non-catastrophe losses, are based on the loss ratio method applied to each class of business. Actual paid losses and case reserves ( reported losses ) are subtracted from expected ultimate losses to determine IBNR reserves. The initial expected ultimate losses involve management judgment and are based on historical information for that class of business; which includes loss ratios, market conditions, changes in pricing and conditions, underwriting changes, changes in claims emergence, and other factors that may influence expected ultimate losses. Over time, as a greater number of claims are reported, actuarial estimates of IBNR are based on the Bornhuetter-Ferguson (B-F) and loss development (or chain ladder) techniques. The B-F method utilizes actual loss data and the expected patterns of loss emergence, combined with an initial expectation of ultimate losses to determine an estimate of ultimate losses. This method may be appropriate when there is limited actual loss data and a relatively less stable pattern of loss emergence. The chain ladder method utilizes actual loss and expected patterns of loss emergence to determine an estimate of ultimate losses that is independent of the initial expectation of ultimate losses. This method may be appropriate when there is a relatively stable pattern of loss emergence and a relatively larger number of reported claims. These techniques may be inappropriate for many lines of business and in many specific situations such as catastrophe losses. In such situations, specific knowledge of outstanding claims, underlying exposures, the coverages involved, legal trends, known occurrences that have not yet resulted in reported losses, and changes in frequency or severity might be used to establish reserves. Multiple estimates of ultimate losses using a variety of actuarial methods are calculated for many, but not all, of the Company s (150+) classes of business for each year of loss experience. The Company s actuaries look at each class and determine the most appropriate point estimate based on the characteristics of the particular class and other relevant factors, as described above. Once the Company s actuaries make their determination of the most appropriate point estimate for each class, this information is aggregated and presented to management for consideration in establishing the recorded reserves. Limitations of the Standard Processes Reserving actuaries, especially in personal lines or mid-market commercial lines companies, often employ the standard loss development techniques noted above to project ultimate losses from triangles of paid and reported losses. These methods rely on an assumption that losses develop consistently from one year to the next, and, for the loss ratio and B-F methods, on the assumption that an initial expected loss ratio can be accurately selected. While we have made substantial efforts to remove data elements in this disclosure that could create obvious distortions in loss development catastrophes, discontinued lines, etc. we strongly caution against any assumption that the standard loss projection techniques applied mechanically can alone be used to estimate ultimate losses for our data. Reasons to avoid simplistic projections include: XL has experienced considerable growth in the past 10 years through acquisition and through new business unit start-up operations. In most
10 XL Capital Ltd 2006 Global Loss TriangleS cases, the more recently underwritten business is of a very different mix of coverages provided and size of risk written as compared with that in prior years. Our growth also means that more recent years have higher volume. The loss development associated with this business will therefore vary, perhaps significantly, from the loss development observed in the triangles for older periods. The use of loss development factors derived from older business applied to the more recent business may not yield accurate results. This is especially true for the Insurance Professional GLT Class where growth and mix of business changes have been significant. Please refer to the GLT Class Descriptions below for further details on this and other classes. Pricing conditions are cyclical in the (re)insurance industry, and no single initial expected loss ratio can be successfully applied to all accident years or underwriting years. In particular, since 2001, XL has achieved significant improvements in premium rate levels and underwriting terms and conditions that have contributed to lower loss ratios than those experienced in the 1997 to 2001 years for most lines of business. If these changes are not taken into consideration in selecting expected loss ratios, estimates of future losses would likely be misstated, perhaps significantly. Losses develop differently for different classes of liability business. The same is true, to a lesser extent, of property coverages. The aim of the triangles contained herein is to present the Company s loss development experience in an informative format, while protecting proprietary management information. One disadvantage, however, is that loss experience from business that develops differently has been aggregated. This is most significant in the Insurance Specialty, Insurance Professional and U.S. Casualty Reinsurance GLT Classes which contain different mixes of business over time. Paid loss development patterns are generally considerably longer than the corresponding reported loss development patterns and can produce very volatile indications, particularly for long tail classes of business and within the first several years of development. GLT Classes where the mix of business has changed significantly over time are further susceptible to distortions in ultimate loss projections resulting from changing payment patterns. Underwriting Year Projections Data organized by underwriting year assigns claims and premiums to the year in which the assumed reinsurance contract incepted. As such, an underwriting year can cover claims spanning several accident years. This has two primary implications for estimating ultimate loss reserves. First, the payment and reporting patterns are generally slower than for data presented by accident year. This means that it is even more critical that premium-based reserving methods such as the Loss Ratio Method or B-F Method are used for the more recent or immature years rather than loss development methods that can be distorted by small movements in actual paid and reported loss activity due to the application of large development factors (e.g., development factors of 2.00 or more). Second, underwriting years for which the premium is not fully earned require an adjustment to the indicated reserves to reflect only the portion of ultimate underwriting year losses that are associated with losses that have occurred prior to the evaluation date. This is typically done by developing an ultimate loss ratio estimate for the full underwriting year and applying this loss ratio to the earned premium for each underwriting year. GLT CLASS DESCRIPTIONS The following sections provide additional background information on each of the GLT Classes including changes in mix of business over time that may impact the loss development patterns and/or loss ratio levels. In addition, commentary is provided on the general direction of premium rate level movements in recent years. Due to its proprietary nature, detailed premium rate change information is not provided. However, information on industry premium rate changes is
11 XL Capital Ltd 2006 Global Loss TriangleS available from several sources including: The Council of Insurance Agents and Brokers (CIAB) Commercial Insurance Lines survey, Lloyd s of London Premium Rating Index, and Tillinghast-Towers Perrin Directors and Officers Liability Survey. Such rate change information should be considered when applying premium-based reserving methods. Officers Liability (D&O), Errors and Omissions Liability (E&O), and Employment Practice Liability (EPL). In 2006, the written premium was split in the following approximate proportions for these categories: 65%, 26% and 9%, respectively. Premium written by U.S. legal entities was approximately 75% of the total in Insurance Property The Property Class is comprised of (1) first-party property coverages on an all-risks and named perils basis for large commercial, energy and construction risks, and (2) fine art and specie risks. Specie insurance covers financial institutions and other companies for loss or damage to cash and valuables in vaults, on premises or in transit. In 2006, the written premium was split in the following approximate proportions for these two categories: 85% and 15%, respectively. Premium written by U.S. legal entities was approximately 28% of the total in Property and specie loss data has been combined as they typically exhibit short loss development patterns. Generally, Property premium rates have been declining since 2003, with the exception of catastrophe-exposed U.S. business which increased dramatically in Specie premium rates increased in 2006 after a decline in Insurance Casualty The Casualty Class is comprised primarily of (1) global programs coverage for single or multi-territory companies, (2) casualty excess liability coverage and (3) large deductible programs for the U.S. risk management market. In 2006, the written premium was split in the following approximate proportions for these categories: 44%, 44% and 12%, respectively. Premium written on U.S. legal entities was approximately 25% of the total. Generally, premium rate levels for Casualty Lines in total have decreased in 2005 and 2006 following relatively strong rate levels for years Insurance Professional The Professional Class is comprised of Directors and As described elsewhere in this document, the Professional Class is presented on a report year basis, compared to the accident year presentation of the other Insurance GLTs. Premium rate levels for Professional Lines have decreased in 2005 and 2006 following relatively strong rates in Significant growth within the U.S. D&O and E&O business began in 2001 where we had $139 million of gross premium, compared to $49 million in By 2006, this business represented over 75% of gross written premium for the Professional Class. The limit and attachment profile of the business has significantly changed as well. Prior to 2001, the Professional business was characterized by attachments which averaged over $100 million and typical limits between $50 million and $100 million. The claims activity within this high excess exposure was characterized by longer, more volatile reporting patterns as compared with expectations for the current book of business. The current business now includes a significant proportion of policies written on a primary basis with limits at or below $10 million. The combination of these changes, along with the significant increase in earned premium after 2001, have reduced the average limit as a percentage of earned premium, which should lower the impact that any one claim has on loss development factors. Due to the change in the mix of business described above, the use of link ratios derived from Report Years 2001 and prior may not be reflective of the future development expectations for the current book (Report Years 2002 and subsequent). Given this potential distortion, we have supplemented our internal reviews of this business by incorporating the use of NAIC Schedule P loss development data for Other Liability Claims Made business
12 XL Capital Ltd 2006 Global Loss TriangleS from our primary U.S. competitors. We have also supplemented our analysis with both internal and external information regarding the reduction in the number of securities class action lawsuits in the last three years, including that of the Stanford Law School Securities Class Action Clearinghouse. These information sources factored into our ultimate loss ratio selections for more recent years. Insurance Specialty The Specialty Class is comprised of aerospace, marine & offshore energy, environmental, programs, equine, and excess and surplus lines. In 2006, the written premium was split in the following approximate proportions for these categories: 28%, 23%, 22%, 22%, 4% and 1%, respectively. Premium written on U.S. legal entities was approximately 75% of the total, including nearly all of the Environmental and Programs business. The Specialty Class contains first party coverages as well as third party coverages. Generally, premium rates have been declining since 2003 for our XL Aerospace book while rates have been increasing since 2004 for XL Marine and Offshore Energy. Equine rates were flat in 2006 while 2005 saw rates decline after increases in Environmental rates increased considerably during 2003 and 2004 followed by modest declines during 2005 and Rates have been increasing for Programs driven by increases for small and middle market commercial properties due to 2004 and 2005 hurricane activity. For the Specialty class in total, we expect that the impact of premium rate level changes on expected loss ratios would be relatively small over the period. Reinsurance Property Catastrophe Business in this class reinsures natural catastrophe perils such as windstorms, earthquakes, flood, hail, etc. for cedants on a treaty basis. These treaties are mainly per occurrence excess policies written on a losses-occurring basis. Approximately 60% of the premium relates to U.S. source business, about 30% to U.K./Europe and most of the remaining to Japan, Australia, South Asia, Caribbean and South America. For all years presented in the triangles contained herein, 5% to 10% of the book covers inward retrocessional exposures. This class has seen a sharp increase in premium rates for U.S.-exposed business from September 2001 followed by a flattening trend in 2003, 2004 and 2005 and then a sharp increase in The European and Asia Pacific pricing trends have been downward in recent years. Reinsurance Property Other This business reinsures property risks of cedants on a treaty and facultative basis. The business covers a variety of exposures for personal lines and commercial risks including structures, buildings, business interruption, motor, crop, onshore energy and engineering construction/mechanical breakdown risks. The majority of this business is written on a proportional treaty basis with the percentage of these treaties increasing in recent years. Since 2003 approximately 70%-75% of Property Other business was written on a proportional treaty basis, 15%-20% on a nonproportional treaty basis and 5%-15% on a facultative basis. Prior to 2003 about 55%-60% was written on a proportional basis, 20%-30% on a non-proportional basis and 15%-20% on a facultative basis. The facultative book contains both individual risk and automatic coverages. These were roughly equal in proportion historically; however, since 2003 to year-end 2006 the proportion of individual risks has increased to form 70%-75% of the facultative business. Property Other treaties cover risks predominantly in the U.S. but there is also worldwide exposures mainly from U.K./Europe, Asia Pacific and South America. Prior to 2002 we had minimal European exposures, but since 2002 these have formed about 15% of the portfolio. The premium rate changes in this segment have been similar to those described for the Property Catastrophe segment. 0
13 XL CAPITAL LTD 2006 GLOBAL LOSS TRIANGLES Reinsurance U.S. Casualty U.S. Casualty reinsures medium to large cedants, primarily for General Liability, Professional Liability, Workers Compensation, and Auto Liability on both a treaty and facultative basis. The following charts show the distribution of gross reported losses and gross written premiums by class and type of business. These are displayed separately for the , and underwriting periods in order to show how the portfolio composition has changed over time, particularly due to re-underwriting activity in 2002 and subsequent years. to the soft market that existed during that period, and because of market events such as the Enron bankruptcy, premium rates increased dramatically after In addition, at the end of 2001, XL Reinsurance America re-underwrote its book and canceled the worstperforming contracts. As a result, the U.S. Casualty portfolio experienced a pronounced improvement in overall rate adequacy, starting in This should be considered in any analysis of loss reserve levels. The General Liability book has experienced a shift away from high-excess clash policies as we wound down that Distribution of U.S. Casualty Reinsurance Business Underwriting Years Basis for Distribution Professional GL/AL WC Total Reported Losses 31% 57% 11% 100% Written Premium 28% 63% 8% 100% Reported Losses 41% 39% 20% 100% Written Premium 34% 54% 12% 100% Reported Losses 37% 40% 23% 100% Written Premium 47% 45% 8% 100% Distribution of U.S. Casualty Reinsurance Business Underwriting Years Basis for Distribution Proportional Treaty Non-Proportional Treaty Facultative Total Reported Losses 10% 72% 18% 100% Written Premium 8% 77% 15% 100% Reported Losses 23% 62% 14% 100% Written Premium 32% 48% 20% 100% Reported Losses 34% 39% 27% 100% Written Premium 34% 44% 22% 100% When analyzing the data, it should be noted that the underwriting years 1997 to 2001 were extremely unprofitable for the insurance industry as a whole, particularly for the Professional Liability lines. In reaction portfolio beginning in Conversely, we increased our facultative writings. This book has historically been more profitable and benefits from a quicker loss reporting pattern than the high-excess clash book. 11
14 XL Capital Ltd 2006 Global Loss TriangleS In the Workers Compensation non-proportional treaty portfolio, a large contract in force from 1995 to 2001 has experienced unexpectedly high loss development in recent years, mostly driven by loss frequency. The portfolio is now weighted toward higher attachment points, typically requiring the involvement of several claimants to be triggered. This shift limits the possibility for loss frequency to be as much of a factor going forward. There has also been a shift in the Workers Compensation portfolio from almost exclusively nonproportional prior to 1997 to over 50% proportional in recent years. The Professional Liability book consists of D&O, E&O and Medical Malpractice exposures. Prior to 1995 virtually all treaties were non-proportional. Since 1995 approximately two thirds of the treaty contracts are non-proportional. The mix of D&O, E&O and Medical Malpractice exposures has shifted over the years from largely a medical malpractice book (73% of premiums in 1987) to largely a D&O/E&O portfolio (80% to 85% of premiums for the past 10 years). Along with becoming a smaller proportion of the Professional Liability category, the Medical Malpractice portfolio also experienced a shift in business mix away from high deductible aggregate coverage to per risk layers, with lower attachment points. Furthermore, the exposure to excess of loss occurrence basis coverage decreased over time and was minimal as of December 31, These shifts are expected to cause the more recent underwriting years to have a faster reporting pattern for losses as compared with the prior years. Reinsurance Non-U.S. Casualty This business covers risks written in the U.K., Ireland and Europe with smaller percentages mainly in Australia and South America. Risks in the U.K. form the largest portion of the non-u.s. casualty business and these are written primarily on a non-proportional treaty basis for Professional Indemnity, Financial Institutions, Medical Malpractice, Motor, General Liability, and Employer s Liability/Workers Compensation. The portfolio includes two significant Lloyd s syndicate capital gearing quota share contracts. Capital gearing quota shares are those that support Syndicates at Lloyd s with Funds/Capital through a bank LOC (letter of credit) to cover potential adverse deviation in losses. These have been written since 2003 for Professional Indemnity, Medical Malpractice and General Liability risks primarily covering non-u.s. exposures. Since 2001, roughly 70%-80% of the treaty book premiums relate to non-proportional treaties with the remaining being proportional risks. Prior to 2001, premiums were roughly divided equally between proportional and non-proportional contracts. Continental European Casualty premiums have increased in proportion to the total portfolio from 15% in 2002 to about 25% in European exposures are predominantly Motor Liability and General Liability risks written primarily on a non-proportional basis. Reinsurance Marine and Aviation A little over half of this GLT Class represents Marine worldwide exposures with the remainder being Aviation and Satellite. For Marine, the predominant exposures are Hull, Cargo, Generals, Energy and Retro. About 75% of the Marine business is non proportional. A significant portion of this book was re-underwritten in 2002 and in 2006 the aggregate exposure to Gulf of Mexico exposures was significantly reduced. The Marine book has experienced slight premium rate increases in 2002 followed by a flat period in 2003 and 2004, a modest increase in 2005 and a sharp increase in The Aviation treaties are generally written on a nonproportional basis (about 75%), and are typically structured so they respond to market losses above $400 million. Since losses on Airlines generally relate to headline making events, almost all of the IBNR reserve held is in respect of known reported events. The proportional book covers mainly Satellite risks for both launch and in-orbit operations. The Aviation book has experienced sharp increases in premium rates in 2002 followed by gradual declines beginning in 2004.
15 XL Capital Ltd 2006 Global Loss TriangleS Reinsurance Other This GLT Class mainly contains Whole Account, Credit, Bond, Political Risk exposures and European Life, Accident and Health exposures. Since 2001, a significant portion of this business relates to Whole Account exposures which consist of several large capital gearing proportional contracts with Lloyds Syndicates. This formed about 30% of the Other business in 2001 and has steadily increased in size to form about 50% of this class in These policies cover the entire book of business for a particular syndicate and therefore encompass several lines of business. Generally, these contracts go through a process called reinsurance to close (or RITC) where a year of account that is fully earned (three year period) undergoes a loss portfolio transfer to the next year of account. The 2001 to 2003 years have been effectively closed through this process. This results in no change in paid activity and removal of case reserves from the triangles for these underwriting years since the RITC was processed. The changes for these underwriting years reflected through the RITC process should be kept in mind when analyzing the paid and reported triangles. The amounts of reserves held in relation to RITC assumed business totaled $80 million as at December 31, This amount has been included with the miscellaneous adjustments in the reconciliation presented on page six. In recent years, the premium rate levels for Whole Account business have remained relatively flat with a sharp increase in 2006 following 2005 hurricane activity. The predominant portion of the remaining business relates to Credit and Bond exposures written in the U.S., South America and Europe, Political Risk accounts and European Life, Accident and Health exposures. The European Credit and Bond business was written in 2002 and later years, about 75% of which consists of proportional and non-proportional trade credit insurance all written on a risks-attaching basis. 60% of the European bond portfolio arises from exposures in Italy. Political Risk exposures formed approximately 30% of the Other business prior to 2001 and were mostly due to one large contract. This contract was not renewed after the 2000 year. Since 2001 these exposures do not form a significant portion of the Other class. Life, Accident and Health exposures were all written in 2002 and later years and comprise approximately 20% of this segment. These represent primarily European exposures.
16 14 XL Capital Ltd 2004 and 2005 Large Event Loss Summary Loss and Allocated Loss Adjustment Expenses as at December 31, 2006 U.S. dollars in thousands Insurance Segment Gross of Reinsurance Net of Reinsurance Event Paid Case O/S Reported IBNR Ultimate Paid Case O/S Reported IBNR Ultimate 2004 Hurricanes 356,799 23, ,388 11, , ,308 5, ,948 3, , Events 1,083, ,177 1,907, ,940 2,097, , , ,948 93, ,679 Total 1,440, ,765 2,287, ,967 2,488, , ,345 1,088,896 96,861 1,185,757 Total Case and IBNR Reserves 1,047, ,207 Reinsurance Segment Gross of Retrocession Net of Retrocession Event Paid Case O/S Reported IBNR Ultimate Paid Case O/S Reported IBNR Ultimate 2004 Hurricanes 379,911 49, ,296 31, , ,050 13, ,017 16, , Events 928, ,919 1,539, ,758 1,802, , , , ,125 1,076,447 Total 1,308, ,303 1,968, ,342 2,263, , ,299 1,157, ,517 1,357,855 Total Case and IBNR Reserves 955, ,816 Total Insurance and Reinsurance Event Paid Case O/S Gross Reported IBNR Ultimate Paid Case O/S Net Reported IBNR Ultimate 2004 Hurricanes 736,710 72, ,683 42, , ,357 19, ,965 19, , Events 2,012,196 1,434,096 3,446, ,698 3,899, , ,037 1,747, ,856 2,025,126 Total 2,748,907 1,507,069 4,255, ,309 4,752,284 1,386, ,644 2,246, ,378 2,543,612 Total Case and IBNR Reserves 2,003,377 1,157,022 Percentages of Ultimate Loss and ALAE Insurance Segment Gross of Reinsurance Net of Reinsurance Event % Paid % O/S % Reported % IBNR Total % Paid % O/S % Reported % IBNR Total 2004 Hurricanes 91% 6% 97% 3% 100% 96% 2% 99% 1% 100% 2005 Events 52% 39% 91% 9% 100% 48% 42% 90% 10% 100% Total 58% 34% 92% 8% 100% 57% 34% 92% 8% 100% Reinsurance Segment Gross of Retrocession Net of Retrocession Event % Paid % O/S % Reported % IBNR Total % Paid % O/S % Reported % IBNR Total 2004 Hurricanes 82% 11% 93% 7% 100% 89% 5% 94% 6% 100% 2005 Events 51% 34% 85% 15% 100% 42% 41% 83% 17% 100% Total 58% 29% 87% 13% 100% 52% 33% 85% 15% 100% Total Insurance and Reinsurance Event % Paid % O/S Gross % Reported % IBNR Total % Paid % O/S Net % Reported % IBNR Total 2004 Hurricanes 86% 9% 95% 5% 100% 92% 4% 96% 4% 100% 2005 Events 52% 37% 88% 12% 100% 45% 41% 86% 14% 100% Total 58% 32% 90% 10% 100% 55% 34% 88% 12% 100%
17 15 XL Capital Ltd 2006 Global Loss Triangles - Insurance Segment All Classes Combined U.S. dollars in thousands Class: XL Insurance Segment Total Losses Based on Constant Rates of Exchange as at 4th Quarter 2006 System Close Dates Losses Based on Historical Exchange Rates Paid Loss & ALAE - Gross of external ceded reinsurance Paid Loss & ALAE at year-end 2006 Accident/ Accident/ At Year-end Report Report Gross External Ceded Net Year Year Reinsurance Prior 2,037,783 2,310,367 2,653,871 2,936,621 3,031,462 3,171,194 3,293,148 3,440,622 3,496,272 3,549,231 Prior 3,549, ,333 2,918, , , , , , , , , , , , , , , , , , , , , , , , , , , , , ,478 1,011,710 1,081,057 1,149,987 1,224, ,224, , , , ,029 1,275,200 1,450,697 1,690,287 1,974,490 2,103, ,103,792 1,085,003 1,018, , ,531 1,117,808 1,567,152 1,946,436 2,160, ,159,618 1,091,507 1,068, , , ,078 1,090,628 1,305, ,304, , , , ,780 1,074,830 1,292, ,290, , , , ,490 1,065, ,064, , , , , , , , , , , ,982 Reported Loss & ALAE - Gross of external ceded reinsurance Reported Loss & ALAE at year-end 2006 Accident/ Accident/ At Year-end Report Report Gross External Ceded Net Year Year Reinsurance Prior 2,762,227 3,194,605 3,340,415 3,483,573 3,531,837 3,492,637 3,600,125 3,676,037 3,768,025 3,794,998 Prior 3,794, ,569 3,052, , , , , , , , , , , , , , , , , , , , , , , , , , , ,665 1,038,877 1,135,998 1,277,315 1,347,107 1,300,689 1,321, ,321, , , ,248 1,795,195 1,842,234 2,099,094 2,224,522 2,416,673 2,368, ,367,995 1,162,209 1,205, ,245 1,495,476 2,045,217 2,420,460 2,623,858 2,628, ,628,007 1,264,901 1,363, ,345 1,170,547 1,495,168 1,785,084 1,910, ,909, ,821 1,302, ,497 1,316,842 1,652,703 1,854, ,852, ,262 1,382, ,272 1,408,236 1,739, ,738, ,565 1,325, ,062 1,544, ,545, ,378 1,168, , , , ,423 Calendar Year Premiums Gross of Reinsurance Year Gross Earned Gross Written Net Earned Net Written Case O/S IBNR Total ,276,060 3,998,710 2,106,635 2,614,267 Reserves Corresponding to Triangles ,584,090 4,966,308 3,203,716 3,439,677 Prior Years 245,767 72, , ,291,760 5,522,217 3,960,813 4,133, ,203,419 6,294,614 10,498, ,410,896 5,569,773 4,055,181 4,193,076 Total 4,449,186 6,367,609 10,816, ,413,345 5,025,621 3,980,883 3,748,142 Net of Reinsurance Case O/S IBNR Total Reserves Corresponding to Triangles Prior Years 133,532 68, , ,244,046 4,646,345 7,890,391 Total 3,377,578 4,714,794 8,092,372
AXIS Capital Holdings Limited 2008 Loss Development Triangles
 Published October 19, 2009 Loss Development Triangle Cautionary Language This report is for informational purposes only and is as of December 31, 2008. We are under no obligation and do not expect to update
PartnerRe Ltd Loss Development Triangles
 2014 Loss Development Triangles Loss Development Triangle Cautionary Language The information in this financial supplement is for informational purposes only and is current only as of its stated date,
Global Loss Triangles Supplement ACE Limited
 Global Loss Triangles Supplement 2009 ACE Limited Investor Contact Helen M. Wilson Phone: (441) 299-9283 Fax: (441) 292-8675 email: investorrelations@acegroup.com This report is for informational purposes
2016 Global Loss Triangles. May 22, 2017
 2016 Global Loss Triangles May 22, 2017 Table of Contents 01 Global Loss Triangle Cautionary Language 01 Cautionary Note Regarding Forward-Looking Statements 02 Introduction 02 Description of Data Presented
EVEREST RE GROUP, LTD LOSS DEVELOPMENT TRIANGLES
 2017 Loss Development Triangle Cautionary Language This report is for informational purposes only. It is current as of December 31, 2017. Everest Re Group, Ltd. ( Everest, we, us, or the Company ) is under
This page intentionally left blank
 P&C P&C Reserving Reserving 213 213 Development of claim of claim ratios ratios by line by line of business of business This page intentionally left blank Table of Contents Introduction P&C Reserving Basics
AXIS Capital Holdings Limited
 INVESTOR FINANCIAL SUPPLEMENT FOURTH QUARTER 2005 106 Pitts Bay Road Hamilton HM 08 Bermuda Contact Information: Linda Ventresca Investor Relations 441 297 9513 investorrelations@axiscapital.com Website
2013 Loss Development Triangles
 2013 Loss Development Triangles 2013 Loss Development Triangle Cautionary Language This report is for informational purposes only and is current as of December 31, 2013. We are under no obligation and
2015 Statutory Combined Annual Statement Schedule P Disclosure
 2015 Statutory Combined Annual Statement Schedule P Disclosure This disclosure provides supplemental facts and methodologies intended to enhance understanding of Schedule P reserve data. It provides additional
Reserving 2008 Development of claim ratios by line of business
 Reserving Development of claim ratios by line of business Swiss Re s Reserves for Traditional Business 46% of total is Reserves Total Traditional Gross Reserves: CHF 61.0 bn as of 31 December 30 Case reserve
AXIS Capital Holdings Limited
 INVESTOR FINANCIAL SUPPLEMENT SECOND QUARTER 2009 92 Pitts Bay Road Pembroke HM 08 Bermuda Contact Information: Linda Ventresca Investor Relations 441 405 2727 investorrelations@axiscapital.com Website
AXIS Capital Holdings Limited
 INVESTOR FINANCIAL SUPPLEMENT FOURTH QUARTER 2008 92 Pitts Bay Road Pembroke HM 08 Bermuda Contact Information: Linda Ventresca Investor Relations 441 405 2727 investorrelations@axiscapital.com Website
2014 Loss Development Triangles
 2014 Loss Development Triangles 2014 Loss Development Triangle Cautionary Language This report is for informational purposes only and is current as of December 31, 2014. We are under no obligation and
XL Insurance (Bermuda) Ltd Consolidated Financial Statements For The Years Ended
 Ltd Consolidated Financial Statements For The Years Ended") XL Insurance (Bermuda) Ltd Consolidated Financial Statements For The Years Ended December 31, 2010 and 2009 1 CONSOLIDATED STATEMENTS OF INCOME (U.S dollars in thousands, except per share amounts) 2010
XL Insurance (Bermuda) Ltd Consolidated Financial Statements For The Years Ended December 31, 2010 and 2009 1 CONSOLIDATED STATEMENTS OF INCOME (U.S dollars in thousands, except per share amounts) 2010
XL Insurance (Bermuda) Ltd Consolidated Financial Statements For The Years Ended
 Ltd Consolidated Financial Statements For The Years Ended") XL Insurance (Bermuda) Ltd Consolidated Financial Statements For The Years Ended December 31, 2009 and 2008 1 CONSOLIDATED BALANCE SHEETS AS AT DECEMBER 31, 2009 AND 2008 (U.S. dollars in thousands, except
XL Insurance (Bermuda) Ltd Consolidated Financial Statements For The Years Ended December 31, 2009 and 2008 1 CONSOLIDATED BALANCE SHEETS AS AT DECEMBER 31, 2009 AND 2008 (U.S. dollars in thousands, except
AXIS Capital Holdings Limited
 INVESTOR FINANCIAL SUPPLEMENT FIRST QUARTER 2009 92 Pitts Bay Road Pembroke HM 08 Bermuda Contact Information: Linda Ventresca Investor Relations 441 405 2727 investorrelations@axiscapital.com Website
RenaissanceRe. Casualty Treaty
 Syndicate 1458 Casualty Treaty Syndicate 1458 Casualty Treaty operates at Lloyd s of London through Syndicate 1458, which was established in 2009. is a leading global provider of property catastrophe and
ACE LTD FORM 10-Q. (Quarterly Report) Filed 08/14/97 for the Period Ending 06/30/97
 Filed 08/14/97 for the Period Ending 06/30/97") ACE LTD FORM 10-Q (Quarterly Report) Filed 08/14/97 for the Period Ending 06/30/97 Telephone 441 295 5200 CIK 0000896159 Symbol ACE SIC Code 6331 - Fire, Marine, and Casualty Insurance Industry Insurance
ACE LTD FORM 10-Q (Quarterly Report) Filed 08/14/97 for the Period Ending 06/30/97 Telephone 441 295 5200 CIK 0000896159 Symbol ACE SIC Code 6331 - Fire, Marine, and Casualty Insurance Industry Insurance
Development of claim ratios by line of business
 Development of claim s by line of business Content This report covers business from Swiss Re legal entities at 31 December (Insurance Solutions companies are not included) Tles for the following lines
XL CAPITAL LTD (Exact name of registrant as specified in its charter)
") UNITED STATES SECURITIES AND EXCHANGE COMMISSION Washington, D.C. 20549 FORM 10-K x ANNUAL REPORT PURSUANT TO SECTION 13 OR 15(d) OF THE SECURITIES EXCHANGE ACT OF 1934 For the fiscal year ended December
UNITED STATES SECURITIES AND EXCHANGE COMMISSION Washington, D.C. 20549 FORM 10-K x ANNUAL REPORT PURSUANT TO SECTION 13 OR 15(d) OF THE SECURITIES EXCHANGE ACT OF 1934 For the fiscal year ended December
XL Insurance (Bermuda) Ltd. Consolidated Financial Statements For The Years Ended December 31, 2008 and 2007
 Ltd. Consolidated Financial Statements For The Years Ended December 31, 2008 and 2007") Consolidated Financial Statements For The Years Ended December 31, 2008 and 2007 2 Consolidated Balance Sheets As At December 31, 2008 And 2007 (Expressed in Thousands of U.S. dollars) 2008 2007 Assets
Consolidated Financial Statements For The Years Ended December 31, 2008 and 2007 2 Consolidated Balance Sheets As At December 31, 2008 And 2007 (Expressed in Thousands of U.S. dollars) 2008 2007 Assets
Reinsurance Loss Reserving Patrik, G. S. pp
 Section Description Reinsurance Loss Reserving 1 Reinsurance Loss Reserving Problems 2 Components of a Reinsurer s Loss Reserve 3 Steps in Reinsurance Loss Reserving Methodology 4 Methods for Short, Medium
RenaissanceRe Holdings Ltd. Contents. Page Basis of Presentation. i Financial Highlights
 Contents Page Basis of Presentation i Financial Highlights 1 Statements of Operations a. Summary Consolidated Statements of Operations b. Consolidated Segment Underwriting Results c. Segment Underwriting
Fourth Quarter and Full Year Highlights
 Exhibit 99.1 The Hanover Reports Fourth Quarter Net Income and Operating Income of $1.20 and $2.00 per Diluted Share, Respectively; Fourth Quarter Combined Ratio of 95.1%; Combined Ratio Excluding Catastrophes
Third Quarter 2018 Results. November 1, 2018
 Third Quarter 08 Results November, 08 Cautionary Statement Regarding Forward Looking Statements This report contains forward looking statements that are intended to enhance the reader s ability to assess
Endurance Reports Fourth Quarter 2016 Financial Results
 - 1 - Endurance Reports Fourth Quarter 2016 Financial Results PEMBROKE, Bermuda February 24, 2017 Endurance Specialty Holdings Ltd. (NYSE:ENH) today reported net income available to common shareholders
Fourth Quarter 2018 Results. February 26, 2019
 Fourth Quarter 08 Results February 6, 09 Cautionary Statement Regarding Forward Looking Statements This report contains forward looking statements that are intended to enhance the reader s ability to assess
May 1, 2018 FIRST QUARTER 2018 SUMMARY. Underwriting Results by Segment. Property Segment
 RenaissanceRe Reports Net Income of $56.7 Million for the First Quarter of, or $1.42 Per Diluted Common Share; Quarterly Operating Income of $135.2 Million or $3.40 Per Diluted Common Share May 1, PEMBROKE,
MARKEL REPORTS 2017 FINANCIAL RESULTS
 For more information contact: Bruce Kay Markel Corporation 804-747-0136 bkay@markelcorp.com FOR IMMEDIATE RELEASE MARKEL REPORTS 2017 FINANCIAL RESULTS Richmond, VA, February 6, 2018 --- Markel Corporation
Montpelier Reinsurance Ltd. and its subsidiary. Consolidated Financial Statements December 31, 2014 and 2013 (expressed in millions of U.S.
 Montpelier Reinsurance Ltd. and its subsidiary Consolidated Financial Statements Consolidated Balance Sheets As at (expressed in millions of U.S. dollars, except share and per share amounts) 2014 2013
Revised Educational Note. Premium Liabilities. Committee on Property and Casualty Insurance Financial Reporting. March 2015.
 Revised Educational Note Premium Liabilities Committee on Property and Casualty Insurance Financial Reporting March 2015 Document 215017 Ce document est disponible en français 2015 Canadian Institute of
PartnerRe Ltd. Reports Second Quarter and Half Year 2018 Results
 News Release Reports Second Quarter and Half Year 2018 Results Second Quarter Net income available to common shareholder of $125 million, resulting in an Annualized Net Income ROE of 8.4% Non-life combined
RenaissanceRe Holdings Ltd. Contents. Page Basis of Presentation. i Financial Highlights
 Contents Page Basis of Presentation i Financial Highlights 1 Statements of Operations a. Summary Consolidated Statements of Operations b. Consolidated Segment Underwriting Results c. Segment Underwriting
Second Quarter Highlights
 The Hanover Reports Second Quarter Net Income and Operating Income (1) of $1.83 and $1.69 per Diluted Share, Respectively; Combined Ratio of 95.6%, including Catastrophe Impact of 4.8 points; Operating
Consolidated Financial Statements. XL Group Reinsurance. For the Year Ended 31 December XL Re Ltd
 Consolidated Financial Statements XL Group Reinsurance For the Year Ended 31 December 2013 XL Re Ltd XL Re Ltd Consolidated Balance Sheets Assets Investments available for sale: December 31, 2013 December
SCHEDULE P: MEMORIZE ME!!!
 SCHEDULE P: MEMORIZE ME!!! NOTE: This skips all the prior years row calculation stuff, since it is covered pretty well by TIA (and I m sure any other manual). What are the cross-checks performed by the
business of the United States not prone to natural catastrophes, rates are flat or have fallen by 5% to 10%.
 Willis Re 1 st View Renewals 1.1.7 The tipping point? Contents Introduction 1 Class review 2 After the extraordinary challenges of the last few years, buyers and sellers of reinsurance are taking advantage
willis re Conserving 1 April 2009 of 10
 willis re 1ST view 1 April 2009 Conserving capital of 10 TABLE OF CONTENTS RENEWALS 1 APRIL 2009 Introduction 3 Casualty Territory and Placement Type 4 Territory and Comments 4 Rates 4 Specialties Line
Patrik. I really like the Cape Cod method. The math is simple and you don t have to think too hard.
 Opening Thoughts I really like the Cape Cod method. The math is simple and you don t have to think too hard. Outline I. Reinsurance Loss Reserving Problems Problem 1: Claim report lags to reinsurers are
Reinsurance (Passing grade for this exam is 74)
") Supplemental Background Material NAIC Examiner Project Course CFE 3 (Passing grade for this exam is 74) Please note that this study guide is a tool for learning the materials you need to effectively study
Supplemental Background Material NAIC Examiner Project Course CFE 3 (Passing grade for this exam is 74) Please note that this study guide is a tool for learning the materials you need to effectively study
$ % From 2Q 2016
 Contact: Susan Spivak Bernstein Senior Vice President, Investor Relations 212.607.8835 Argo Group Reports 2017 Second Quarter Net Income of $46.0 Million or $1.48 per Diluted Share HAMILTON, Bermuda (Aug.
Analysts conference call 14 February 2006
 Analysts conference call Cautionary note on forward-looking statements Certain statements and illustrations contained herein are forward-looking. These statements and illustrations provide current expectations
IASB Educational Session Non-Life Claims Liability
 IASB Educational Session Non-Life Claims Liability Presented by the January 19, 2005 Sam Gutterman and Martin White Agenda Background The claims process Components of claims liability and basic approach
Aspen Insurance Holdings Limited. Financial Statements for the period 23 May 2002 to 31 December 2002
 Financial Statements for the period 23 May 2002 to 31 December 2002 CONTENTS Page Group Overview 3 Operational Review 4 Consolidated Statement of Operations 8 Consolidated Balance Sheet 9 Consolidated
Fourth Quarter and Full Year 2017 Results. March 1, 2018
 Fourth Quarter and Full Year 07 Results March, 08 Cautionary Statement Regarding Forward Looking Statements This report contains forward looking statements that are intended to enhance the reader s ability
Analysts conference call 13 February 2007
 Analysts conference call Agenda Introduction Ann Godbehere Stefan Lippe Michel Liès Outlook Questions & answers Ann Godbehere All Appendix Page 2 Highly successful renewal for Swiss Re Swiss Re s renewed
KINGSTONE COMPANIES, INC.
 SECURITIES & EXCHANGE COMMISSION EDGAR FILING KINGSTONE COMPANIES, INC. Form: 10-Q Date Filed: 2014-11-13 Corporate Issuer CIK: 33992 Symbol: KINS SIC Code: 6411 Fiscal Year End: 12/31 Copyright 2014,
$ % from 2015
 Contact: Susan Spivak Bernstein Senior Vice President, Investor Relations 212.607.8835 Argo Group Reports 2016 Net Income of $146.7 Million or $4.75 per Diluted Share with Book Value per Share Up 10% for
bma captive report 2018
 bma captive report 2018 CONTENTS 2 Summary 3 Geography of Risk Assumption 4 Industry Utilisation Demographics 6 Industry Utilisation Premium Share 8 Captive Structure 9 Lines of Business Property 10 Lines
Underwriting comes first. Effectively balance risk and return. Operate nimbly through the cycle. Analyst Presentation Q3 2017
 Underwriting comes first Effectively balance risk and return Operate nimbly through the cycle Analyst Presentation Q3 2017 November 2017 www.lancashiregroup.com Safe harbour statements NOTE REGARDING FORWARD-LOOKING
PartnerRe Ltd. Reports First Quarter 2018 Results
 News Release Reports First Quarter 2018 Results First Quarter Net loss attributable to common shareholder of $120 million, due to $222 million net realized and unrealized losses in the Investment portfolio
XL Re Ltd. Consolidated Financial Statements
 XL Re Ltd Consolidated Financial Statements FOR THE YEAR ENDED DECEMBER 31, 2010 1 2 XL Re Ltd Consolidated Balance Sheets (US Dollars in thousands) December 31, December 31, Assets 2010 2009 Investments
CVS CAREMARK INDEMNITY LTD. NOTES TO THE FINANCIAL STATEMENTS DECEMBER 31, 2017 AND 2016 (expressed in United States dollars) 1. Operations CVS Carema
 1. Operations CVS Carema") NOTES TO THE FINANCIAL STATEMENTS 1. Operations CVS Caremark Indemnity Ltd. ("The Company"), formerly known as Twinsurance Limited, was incorporated in Bermuda on March 27, 1980, and is a wholly owned
NOTES TO THE FINANCIAL STATEMENTS 1. Operations CVS Caremark Indemnity Ltd. ("The Company"), formerly known as Twinsurance Limited, was incorporated in Bermuda on March 27, 1980, and is a wholly owned
FINANCIAL SUPPLEMENT. June 30, 2016
 Mar - March LIA 5E+10 FINANCIAL SUPPLEMENT June 30, 2016 Issued on July 27, 2016 This supplement is being furnished to you for informational purposes only. It should be read in conjunction with documents
$ % from 2017
 Contact: Susan Spivak Bernstein Senior Vice President, Investor Relations 212.607.8835 susan.spivak@argolimited.com Argo Group Reports Fourth Quarter and Full Year Results HAMILTON, Bermuda (February 11,
The Hanover Insurance Group, Inc.
 The Hanover Insurance Group, Inc. Third Quarter 2017 Results November 2, 2017 To be read in conjunction with the press release dated November 1, 2017 and conference call scheduled for November 2, 2017
Montpelier Reinsurance Ltd. Consolidated Financial Statements December 31, 2010 and 2009 (expressed in millions of U.S. dollars)
") Consolidated Financial Statements Report of Independent Auditors To: The Board of Directors and Shareholder of Montpelier Reinsurance Ltd.: In our opinion, the accompanying consolidated balance sheets
Consolidated Financial Statements Report of Independent Auditors To: The Board of Directors and Shareholder of Montpelier Reinsurance Ltd.: In our opinion, the accompanying consolidated balance sheets
DATA REPORTING 2018 NEW YORK DATA CALL INFORMATION
 DATA REPORTING 2018 NEW YORK DATA CALL INFORMATION The instructions, due dates and other information are now available for the 2018 reporting of workers compensation statistics as set forth in the New
Third Quarter 2017 Results. November 2, 2017
 Third Quarter 207 Results November 2, 207 Cautionary Statement Regarding Forward Looking Statements This report contains forward looking statements that are intended to enhance the reader s ability to
OneBeacon Insurance Group, Ltd. Investor Financial Supplement. December 31, 2006
 Investor Financial Supplement December 31, 2006 Addresses: 601 Carlson Parkway, Minnetonka, MN 55305 (Executive Offices) 1 Beacon Lane, Canton, MA 02021 (U.S. Headquarters) 1 Beacon Street, Boston, MA
The Hanover Insurance Group, Inc.
 The Hanover Insurance Group, Inc. First Quarter 2017 Results May 3, 2017 To be read in conjunction with the press release dated May 3, 2017 and conference call scheduled for May 4, 2017 1 Forward-Looking
Technical Provisions in Reinsurance: The Actuarial Perspective
 Technical Provisions in Reinsurance: The Actuarial Perspective IAIS Reinsurance Subcommittee Copenhagen May 30, 2002 Presented by Dr. Hans Peter Boller, Converium Ltd (Switzerland) on behalf of the International
1 Jan 2018 Property & Casualty Treaty Renewals. and guidance update 2017 and 2018
 Property & Casualty Treaty Renewals and guidance update 2017 and 2018 Renewals Conference Call Hannover, 7 February 2018 Reinsurance markets Our results Our portfolio Structured reinsurance Outlook 2018
Cyber Update Cyber Insurance Profits and Performance. May Revised with data as of June 23, Aon Benfield Analytics
 Cyber Update 2016 Cyber Insurance Profits and Performance May 2017 Revised with data as of June 23, 2017 Risk. Reinsurance. Human Resources. Key Findings on 2016 Cyber Insurance Performance We are pleased
Starr Insurance & Reinsurance Limited and Subsidiaries
 Starr Insurance & Reinsurance Limited and Subsidiaries Consolidated Financial Statements Table of Contents Page Independent Auditors Report 1 Financial Statements Consolidated Balance Sheet 3 Consolidated
1st View. 1 July Page
 1st View 1 July 2011 Page TABLE OF CONTENTS RENEWALS 1 July 2011 Introduction 3 Property Territory and Comments 4 Rates 5 Pricing Trend Graphs 6 Casualty Territory and Comments 7 Rates 8 Specialties Line
Highlights from the first half of 2009 include:
 Press Release 14-09 PARIS RE Holdings Ltd. reports net operating income of US $59.4 million for the second quarter of and US $120.4 million for the first half of Annualized ROATE of 12.0% for the first
Short-duration contract disclosures: Implementing ASU
 Short-duration contract disclosures: Implementing ASU 2015-09 Prepared by: Joe Lee, Senior Manager, RSM US LLP joe.lee@rsmus.com, +1 515 281 9214 September 2017 Overview In October 2008, the Financial
NEWS RELEASE EMC Insurance Group Inc. Reports 2018 Third Quarter and Nine Month Results
 NEWS RELEASE EMC Insurance Group Inc. Reports 2018 Third Quarter and Nine Month Results Third Quarter Ended September 30, 2018 Net Income Per Share $0.89 Non-GAAP Operating Income Per Share* $0.48 Net
COMBINED ANNUAL STATEMENT FOR THE YEAR ENDED DECEMBER 31, 2003 OF THE CONDITION AND AFFAIRS OF THE
 PROPERTY AND CASUALTY COMPANIES ASSOCIATION EDITION COMBINED ANNUAL STATEMENT FOR THE YEAR ENDED DECEMBER, 00 OF THE CONDITION AND AFFAIRS OF THE ALLSTATE INSURANCE COMPANY its affiliated property casualty
Full Year Net Income of $2.5 Billion and Return on Equity and Operating Return on Equity of 9.8% and 11.0%, Respectively
 NYSE: TRV Travelers Reports Fourth Quarter Net Income of $304 Million or $0.78 per Diluted Share After Catastrophe Losses of $689 Million After-tax, Including Storm Sandy, or $1.78 Per Diluted Share Full
PartnerRe Ltd. Reports Second Quarter and Half Year 2016 Results
 Reports Second Quarter and Half Year 2016 Results Second Quarter Net Income of $136.7 million ($158.4 million adjusted for severance related costs), resulting in an Annualized Net Income ROE of 8.9% (Adjusted
Australia and New Zealand
 Executive Summary July 1 Renewals Update Catastrophe reinsurance pricing decreased moderately more aggressively for higher margin U.S. business than witnessed at January and June renewals. Catastrophe
(203) (441) XL Group Ltd Announces Fourth Quarter and Full Year 2017 Results
 (441) XL Group Ltd Announces Fourth Quarter and Full Year 2017 Results") Press Release Contact: Abbe Goldstein Carol Parker Trott Investor Relations Media Relations (203) 964-3573 (441) 294-7290 XL Group Ltd Announces Fourth Quarter and Full Year 2017 Results Demonstrates underlying
Press Release Contact: Abbe Goldstein Carol Parker Trott Investor Relations Media Relations (203) 964-3573 (441) 294-7290 XL Group Ltd Announces Fourth Quarter and Full Year 2017 Results Demonstrates underlying
1 Jan 2016 Property & Casualty Treaty Renewals
 Property & Casualty Treaty Renewals Hannover, 3 February 2016 R/I markets Our results Our portfolio Outlook Appendix Important note Unless otherwise stated, the renewals part of the presentation is based
Supplemental Background Material. Course CFE 3. Reinsurance. (Passing grade for this exam is 74%)
") Supplemental Background Material Course (Passing grade for this exam is 74%) Please note that this study guide is a tool for learning the materials you need to effectively study for this examination. As
Supplemental Background Material Course (Passing grade for this exam is 74%) Please note that this study guide is a tool for learning the materials you need to effectively study for this examination. As
EMC Insurance Group Inc. Reports 2017 Third Quarter and Nine Month Results
 NEWS RELEASE EMC Insurance Group Inc. Reports 2017 Third Quarter and Nine Month Results 11/8/2017 Third Quarter Ended September 30, 2017 Net Income Per Share $0.03 Non-GAAP Operating Income Per Share*
Third Quarter Highlights
 Exhibit 99.1 The Hanover Reports Third Quarter Net Income and Operating Income of $2.33 and $1.97 per Diluted Share, Respectively; Third Quarter Combined Ratio of 95.1%; Combined Ratio, Excluding Catastrophes,
Captive Primer An Introduction to Captive Insurance
 Captive Primer An Introduction to Captive Insurance This Captive Primer is designed as an introduction to captives to inform those looking to for an introduction to and basic understanding of captives.
Important information about Syndicate Reports and Accounts
 Important information about Syndicate Reports and Accounts Access to this document is restricted to persons who have given the certification set forth below. If this document has been forwarded to you
NAIC Group Code 0008 NAIC Company Code Combined Statement Contact Lynn Cirrincione, (Area Code) (Telephone Number)
 (Telephone Number)") PROPERTY AND CASUALTY COMPANIES - ASSOCIATION EDITION COMBINED ANNUAL STATEMENT FOR THE YEAR ENDED DECEMBER, 00 OF THE CONDITION AND AFFAIRS OF THE ALLSTATE INSURANCE COMPANY AND ITS AFFILIATED its affiliated
PROPERTY AND CASUALTY COMPANIES - ASSOCIATION EDITION COMBINED ANNUAL STATEMENT FOR THE YEAR ENDED DECEMBER, 00 OF THE CONDITION AND AFFAIRS OF THE ALLSTATE INSURANCE COMPANY AND ITS AFFILIATED its affiliated
Willis Re 1st View. Plenty of capacity, plenty of capital. Renewals 1 April Contents. 1st View Willis Re Renewals 1 April 2008
 1st View Willis Re Willis Re 1st View Plenty of capacity, plenty of capital As predicted in the previous edition of 1st View, the global reinsurance industry posted exceptionally strong financial results
Aspen Bermuda Limited. Financial Statements. (With Independent Auditor s Report Thereon) December 31, 2012 and 2011
 December 31, 2012 and 2011") Financial Statements (With Independent Auditor s Report Thereon) ABCD KPMG Audit Limited Crown House 4 Par-la-Ville Road Hamilton HM 08 Bermuda Mailing Address: P.O. Box HM 906 Hamilton HM DX Bermuda Telephone
Financial Statements (With Independent Auditor s Report Thereon) ABCD KPMG Audit Limited Crown House 4 Par-la-Ville Road Hamilton HM 08 Bermuda Mailing Address: P.O. Box HM 906 Hamilton HM DX Bermuda Telephone
QBE Insurance (Singapore) Pte Ltd. Financial Statements 2016
 Pte Ltd. Financial Statements 2016") QBE Insurance (Singapore) Pte Ltd Financial Statements Contents QBE Insurance (Singapore) Pte Ltd Unique Entity No. 198401363C 3 Financial statements 4 Directors statement 6 Independent auditor s report
QBE Insurance (Singapore) Pte Ltd Financial Statements Contents QBE Insurance (Singapore) Pte Ltd Unique Entity No. 198401363C 3 Financial statements 4 Directors statement 6 Independent auditor s report
2
 2 4 5 6 7 10 11 12 13 16 17 DIRECTORS REPORT DIRECTORS REPORT The directors present their report to the shareholder together with the audited financial statements of the Company for the financial year
NEW YORK FINANCIAL DATA CALLS INFORMATION AND INSTRUCTIONS
 NEW YORK COMPENSATION INSURANCE RATING BOARD NEW YORK FINANCIAL DATA CALLS INFORMATION AND INSTRUCTIONS 2017 DATA REPORTING 2017 NEW YORK DATA CALL INFORMATION The instructions, due dates and other information
OHIO PLAN RISK MANAGEMENT, INC. Columbus, Ohio. FINANCIAL STATEMENTS December 31, 2015 and 2014
 OHIO PLAN RISK MANAGEMENT, INC. Columbus, Ohio FINANCIAL STATEMENTS Columbus, Ohio FINANCIAL STATEMENTS CONTENTS INDEPENDENT AUDITOR S REPORT... 1 MANAGEMENT S DISCUSSION AND ANALYSIS (UNAUDITED)... 3
Allied World Assurance Company, Ltd. Consolidated Financial Statements and Independent Auditors' Report
 Allied World Assurance Company, Ltd Consolidated Financial Statements and Independent Auditors' Report December 31, 2015 and 2014 INDEPENDENT AUDITORS REPORT To the Board of Directors and Shareholder of
Swiss Re investors and media meeting
 Swiss Re investors and media meeting Today s agenda Introduction Stefan Lippe, CEO Business messages Michel M. Liès, Head of Client Markets ILS Martin Bisping, Head of Non-Life Risk Transformation Questions
Starr Insurance & Reinsurance Limited and Subsidiaries
 Starr Insurance & Reinsurance Limited and Subsidiaries Financial Statements Table of Contents Page Independent Auditors Report 1 Financial Statements Consolidated Balance Sheet 3 Consolidated Statement
Beazley Group plc Analysts Presentation RDS/Catastrophe Stress Testing
 Beazley Group plc Analysts Presentation RDS/Catastrophe Stress Testing 4 July 2005 Content Introduction Natural Catastrophe Specialty Lines Offshore Energy Account Conclusion Looking Forward! Content Introduction
willis re 1 JANUARY 2009 Willis Re 1st View
 willis re 1ST view 1 JANUARY 2009 CAPITAL RULES of 18 Willis Re 1st View TABLE OF CONTENTS RENEWALS 1 January 2009 Introduction 3 Casualty Territory and Placement Type 4 Territory and Comments 4 Rates
News from The Chubb Corporation
 News from The Chubb Corporation The Chubb Corporation 15 Mountain View Road P.O. Box 1615 Warren, New Jersey 07061-1615 Telephone: 908-903-2000 FOR IMMEDIATE RELEASE Chubb Reports First Quarter Net Income
RenaissanceRe. Casualty Insurance
 Syndicate 1458 Casualty Insurance Syndicate 1458 Casualty Insurance is a leading global provider of property catastrophe and specialty reinsurance, as well as other insurance coverages. Founded in Bermuda
INTERNATIONAL ASSOCIATION OF INSURANCE SUPERVISORS
 Discussion paper INTERNATIONAL ASSOCIATION OF INSURANCE SUPERVISORS QUANTIFYING AND ASSESSING INSURANCE LIABILITIES DISCUSSION PAPER October 2003 [This document was prepared by the Solvency Subcommittee
Bermuda Captive Market 2010
 Bermuda Captive Market 2010 October 2011 Contents Summary 3 Geography of Risk Assumption 4 Industry Utilisation Demographic 5 Industry Utilisation Premium Share 6 Lines of Business Property 7 Lines of
New Castle Reinsurance Company Ltd. (Incorporated in Bermuda) Financial Statements December 31, 2008 and 2007 (expressed in U.S.
 Financial Statements December 31, 2008 and 2007 (expressed in U.S.") (Incorporated in Bermuda) Financial Statements December 31, 2008 and 2007 Balance Sheet 2008 2007 Assets Cash and cash equivalents (note 3, 4, 10) $ 680,306,336 $ 746,021,343 Investments in fixed maturity
(Incorporated in Bermuda) Financial Statements December 31, 2008 and 2007 Balance Sheet 2008 2007 Assets Cash and cash equivalents (note 3, 4, 10) $ 680,306,336 $ 746,021,343 Investments in fixed maturity
Syndicate Business Forecasts
 Novae Syndicates Limited Syndicate Business Forecasts February 2009 Introduction The business plan information summarised here relates solely to Syndicate 2007 managed by Novae Syndicates Limited. Most
COMBINED ANNUAL STATEMENT
 PROPERTY AND CASUALTY COMPANIES ASSOCIATION EDITION COMBINED ANNUAL STATEMENT FOR THE YEAR ENDING December, 06 OF THE CONDITION AND AFFAIRS OF THE ZENITH INSURANCE COMPANY AND ITS AFFILIATED PROPERTY AND
Market realities and renewals messages
 Investors meeting Agenda Market realities and renewals messages Insurance Solutions update Slide 2 Reinsurance pricing levels remain firm Property incl. nat cat US Property incl. nat cat (excl. US) Casualty