QBE Insurance Group half year results presentation. John Neal Group Chief Executive Officer Pat Regan Group Chief Financial Officer
|
|
|
- Aldous Wood
- 6 years ago
- Views:
Transcription
1 QBE Insurance Group 2017 half year results presentation John Neal Group Chief Executive Officer Pat Regan Group Chief Financial Officer Thursday 17 August 2017 All figures in US$ unless otherwise stated
2 2 John Neal Group Chief Executive Officer
3 1H17 RESULTS SNAPSHOT GWP NEP CLAIMS RATIO 4 EXPENSE RATIO +3% growth 1 +6% growth 1 $7,892M 2 $8,044M 2 $5,791M 3 $6,045M 61.3% % % % 1H16 1H17 1H16 1H17 1H16 1H17 1H16 1H17 COR 4 CAY COR 6 INSURANCE MARGIN ROE 94.5% % % % 5.6% 3 9.3% 5 5.1% 8.8% 5 1H16 1H17 1H16 1H17 1. Constant currency basis 2. Excludes M&LS fronting (refer page 11 of HY17 report for details) 3. Excludes transactions to reinsure UK long-tail liabilities (refer page 11 of HY17 report for details) 4. Excludes the impact of changes in risk-free rates used to discount net outstanding claims 5. Excludes a $156M one-off adverse impact on the Group s underwriting result due to the Ogden decision in the UK (refer page 11 of HY17 report for details) 6. Excludes $38M (1H16 $22M) of favourable Crop prior accident year development that is offset by 3 1H16 1H17 1H16 1H17 an additional reinsurance cession to the US Government under the Federal crop reinsurance arrangements
4 1H17 UPDATE UNDERWRITING PERFORMANCE 95.3% combined operating ratio 1,2 (1H %) 2,3 9.3% insurance profit margin 1 (1H16 5.6%) 3 Sixth consecutive half of positive prior accident year development ROE 8.8% 1 (1H16 5.1%)`3 OPERATIONAL PROGRESS Emerging Markets disappointed with COR of 110.8% 2 (1H %) 2 ANZO 1H17 attritional claims ratio (ex LMI) improved by 420bps North America COR 98.2% 2 (1H %) 2 Expense ratio improved to 15.2% (1H %) 3 FINANCIAL STRENGTH Cash remittances strong on track to deliver >$1Bn in FY17 PCA stable at 1.7x Interim dividend up 5% to 22 Australian cents Share buyback active in 2H17 1. Excludes a $156M one-off adverse impact on the Group s underwriting result due to the Ogden decision in the UK (refer page 11 of HY17 report for details) 2. Excludes the impact of changes in risk-free rates used to discount net outstanding claims 3. Excludes transactions to reinsure UK long-tail liabilities (refer page 11 of HY17 report for details) 4
5 1H17 DIVISIONAL RESULTS 1H17 North America Europe 1 Australia & New Zealand Emerging Markets Equator Re Group 1,2 GWP ($M) 2,803 2,393 2, ,375 8,044 GEP ($M) 2,187 1,915 2, ,909 NEP ($M) 1,712 1,532 1, ,045 Net claims ratio (%) Net commission ratio (%) Expense ratio (%) COR (%) COR (%) ex discount rate H16 COR (%) ex discount rate COR (%) Excludes $156M one-off adverse impact on the Group s underwriting result due to the Ogden decision in the UK (refer page 11 of HY17 report for details) 2. Excludes M&LS fronting (refer page 11 of HY17 report for details) 3. Excludes transactions to reinsure UK long-tail liabilities (refer page 11 of HY17 report for details) 5
6 EMERGING MARKETS: IMPACTED BY HIGHER FREQUENCY OF MID-SIZED CLAIMS ACROSS SEVERAL PORTFOLIOS Despite the completion of the sale of Chile, flooding prior to sale closure contributed to the loss COMBINED OPERATING RATIO 1 VS PRIOR YEAR 5.0% 4.0% 2 0.8% 0.3% 110.8% 1 < Asia Pacific 99.5% 1.2% < Latin America 1H16 COR Chile Attritional & Large PYD Acquisition costs Other 1H17 COR COMBINED OPERATING RATIO 1 BY REGION DETERIORATION IN 1H17 COMBINED OPERATING RATIO 1 Higher as a result of property and marine in Asia Pacific, along with Brazil travel and large fire claims in Mexico 103.1% 112.2% 94.6% 109.1% 2 Review of Hong Kong workers compensation included a reserve strengthening; Colombian SOAT remains a drag Latin America Asia Pacific 1H16 1H17 1. Excludes the impact of changes in risk-free rates used to discount net outstanding claims 6
7 COMPREHENSIVE PROGRAM OF REMEDIAL ACTIONS UNDERWAY IN ASIA PACIFIC & LATIN AMERICA ASIA PACIFIC Revised pricing models for property, marine and workers compensation Reserves strengthened and reducing Hong Kong workers compensation exposure Exit Thailand LATIN AMERICA Significant reduction in acquisition costs Remediation of Mexican property business Exit Colombian SOAT Strategic review of geographical footprint PEOPLE & MAJOR TRADING ORGANISATION PARTNERS Revert to two division structure to enhance regional focus Jason Brown appointed CEO, Asia Pacific Carola Fratini appointed CEO, Latin America Tightened governance: dedicated CUOs and CROs 7
8 KEY PERFORMANCE DRIVERS 3% CONSTANT CURRENCY GWP GROWTH POSITIVE PRIOR ACCIDENT YEAR DEVELOPMENT PoA stable at 89.5% 1.9% Average PYD over the 6 halves (77) 8,044 7,892 $132M $63M $69M $196M $145M $107M 1H16 1 FX/Other NA 2 EO ANZO EM 1H Excludes M&LS fronting (refer page 11 of HY17 report for details) 2. Excludes $120M of Latin American business fronted on behalf of Equator Re (terminated on 1 Jan 2017) LARGE RISK & CATASTROPHE CLAIMS STABLE 2H14 1H15 2H15 1H16 2H16 1H17 Note: Excludes of favourable Crop prior accident year development that is offset by an additional reinsurance cession to the US Government under the Federal crop reinsurance arrangements REDUCTION IN EXPENSES Post GLRC 14.6% 15.6% 16.3% 17.3% 16.1% 15.2% 15.9% 8.0% 8.3% 9.9% 8.9% 9.8% 9.7% $1,074M $1,142M $1,134M $1,055M $931M $920M 1H11 1H12 1H13 1H14 1H15 1H16 1H17 1H12 1H13 1H14 1H15 1H16 1H17 8
9 9 Pat Regan Group Chief Financial Officer
10 1H17 FINANCIAL RESULTS SUMMARY For the half year ended 30 June 1H16 1,2 1H17 1,3 Change GWP $M 7,892 8,044 NEP $M 5,791 6,045 COR % COR (ex discount rate) % Insurance profit $M Insurance profit to NEP % Net profit after income tax $M Cash profit after tax $M ROE % Dividend per share AU cents % 4 6% 4 4.2ppt 0.8ppt 73% 3.7ppt 76% 30% 3.7ppt 5% 1. Excludes M&LS fronting (refer page 11 of HY17 report for details) 2. Excludes transactions to reinsure UK long-tail liabilities (refer page 11 of HY17 report for details) 3. Excludes a $156M one-off adverse impact on the Group s underwriting result due to the Ogden decision in the UK (refer page 11 of HY17 report for details) 4. Constant currency basis 5. Includes the $156M adverse impact on the Group s underwriting result due to the Ogden decision in the UK 10
11 AUSTRALIA & NEW ZEALAND REMEDIATION MOMENTUM CONTINUES TO IMPROVE PROFITABILITY RATE MOMENTUM CONTINUES; RETENTION STABLE IMPROVEMENT IN ATTRITIONAL RATIO CLAIMS (EX RATIO LMI) 8.0% 6.0% 81.8% 83.4% 83.1% 83.4% -3.3% -4.2% 4.0% 2.0% 0.0% -2.0% -4.0% 85.8% 83.4% (2.0%) (0.1%) FY15 1H16 1.7% 5.2% FY16 1H % 62.0% 58.7% 61.0% 1H16 1H17 1H16 1H17 ANZO ANZO ANZO ex LMI ANZO ex LMI LMI COMBINED OPERATING RATIO MODERATING CONSISTENTLY POSITIVE PRIOR YEAR DEVELOPMENT 4.4% Average PYD over the 6 halves 61% 52% 31% 23% 35% 44% $110M $45M $75M $83M $64M $78M FY12 FY13 FY14 FY15 FY16 1H17 1H14 1H15 2H15 1H16 2H16 1H17 Note: 2014 and 2015 excludes the impact of earnings pattern change 11
12 INVESTMENT PERFORMANCE FIXED INCOME DURATION (YEARS) QBE PORTFOLIO RETURN VS MARKET 1 Market return QBE return FY15 FY16 1H17 2H14 1H15 2H15 1H16 2H16 1H17 1. Asset weighted aggregation of all underlying asset classes and currencies INVESTMENTS & CASH - $25.7BN INTEREST BEARING FINANCIAL ASSETS 2 Cash 3.1% Govt bonds 25.8% Infrastructure debt 2.0% EM & high yield debt 0.4% Alternatives 2.9% Property trusts 4.3% Equities 0.6% Unit trusts 0.1% A 36.9% BBB 9.7% AAA 19.2% <BBB 1.2% NR 0.5% AA 32.5% Corporate Bonds 44.7% Short term money 16.1% S&P rating - pertains to cash & income assets only

13 FINANCIAL STRENGTH S&P CAPITAL CAPITAL 1H17 APRA PCA: 1.7x S&P maintain positive outlook CASH REMITTANCES DIVIDEND & SHARE BUYBACK 2017 interim dividend up 5% to 22 Australian cents per share 61% of cash profit, 30% franked $413M $379M $201M $648M $653M Share buyback active in 2H17 1H13 1H14 1H15 1H16 1H17 13
14 Outlook John Neal Group Chief Executive Officer 14
15 KEY PRIORITIES FOR 2H17 PERFORMANCE IMPROVEMENT Maintain underlying improvement in ANZO Execute on profit improvement plans in North America Maintain underwriting discipline in challenging European markets ASIA PACIFIC & LATIN AMERICA Implement Asia Pacific underwriting remediation Strategic review of Latin America Instigate cost reduction plan for both divisions FINANCIAL RETURNS Maintain high quality balance sheet Effective capital management; dividend growth and buyback FY17 FINANCIAL TARGETS Modest premium growth 1 2 Towards the upper end of 94.5% 96.0% 3,4 COR Investment return around 3.0% 1. Premium growth target is on a constant currency basis 2. Excludes M&LS fronting (refer page 11 of HY17 report for details) 3. Excludes the impact of changes in risk-free rates used to discount net outstanding claims 4. Excludes a $156M one-off adverse impact on the Group s underwriting result due to the Ogden decision in the UK (refer page 11 of HY17 report for details) 15
16 Questions & answers 16
17 DISCLAIMER The information in this presentation provides an overview of the results for the half year ended 30 June This presentation should be read in conjunction with all information which QBE has lodged with the Australian Securities Exchange ( ASX ). Copies of those lodgements are available from either the ASX website com.au or QBE s website Prior to making a decision in relation to QBE s securities, products or services, investors, potential investors and customers must undertake their own due diligence as to the merits and risks associated with that decision, which includes obtaining independent financial, legal and tax advice on their personal circumstances. This presentation contains certain "forward-looking statements for the purposes of the U.S. Private Securities Litigation Reform Act of The words "anticipate", believe", "expect", "project", "forecast", "estimate", "likely", "intend", "should", "could", "may", "target", "plan, outlook and other similar expressions are intended to identify forward-looking statements. Indications of, and guidance on, future earnings and financial position and performance are also forward-looking statements. Such forward-looking statements are not guarantees of future performance and involve known and unknown risks, uncertainties and other factors, many of which are beyond the control of QBE that may cause actual results to differ materially from those either expressed or implied in such statements. There can be no assurance that actual outcomes will not differ materially from these statements. You are cautioned not to place undue reliance on forward-looking statements. Such forward-looking statements only speak as of the date of this presentation and QBE assumes no obligation to update such information. Any forward-looking statements assume large individual risk and catastrophe claims do not exceed the significant allowance in our business plans; no reduction in premium rates in excess of our business plans; no significant fall in equity markets and interest rates; no major movement in budgeted foreign exchange rates; no material change to key inflation and economic growth forecasts; recoveries from our strong reinsurance panel; no unplanned asset sales and no substantial change in regulation. Should one or more of these assumptions prove incorrect, actual results may differ materially from the expectations described in this presentation. 17
18 Appendices 18
19 1H17 ATTRITIONAL CLAIMS RATIO ANALYSIS 1H16 1H17 NEP US$M Attritional % NEP US$M Attritional % Rest of world 5, , Crop insurance QBE Group adjusted 5, ,
20 1H17 CLAIMS RATIO ANALYSIS 30 June June 2017 Statutory 1 Adjusted Statutory 2 Adjusted NEP $M 5,615 5,791 6,043 6,045 Attritional claims % Large individual risk and catastrophes % Claims settlement costs % Claims discount % (1.3) (1.3) (1.8) (1.8) Accident year claims ratio % PY central estimate development % 3 (7.1) 3 (3.9) (2.4) Change in discount rates % (0.5) (0.5) Other (including unwind of discount) % Financial year claims ratio % Excludes transactions to reinsure UK long-tail liabilities (refer page 11 of HY17 report for details) 2. Excludes a $156 million one-off adverse impact on the Group's underwriting result due to the Ogden decision in the UK (refer page 11 of HY17 report for details) 3. Net of discount movement ($50 million cost) due to long tail classes including dust disease in Australia and motor third party bodily injury in Argentina, where the level of assumed claims inflation is directly linked to the discount rate. 4. Net of discount movement ($17 million cost) due to long tail classes including dust disease in Australia and motor third party bodily injury in Argentina, where the level of assumed claims inflation is directly linked to the discount rate. 20
21 CURRENCY MIX Currency mix of interest bearing financial assets 30 JUNE DECEMBER 2016 US$M % US$M % Australian dollar 7, , US dollar 8, , Sterling 4, , Euro 2, ,104 8 Canadian dollar 1, Hong Kong dollar New Zealand dollar Argentinian peso Singapore dollar Other Total 25, , JUNE JUNE 2016 GWP currency mix table US$M % US$M % US dollar 2, , Sterling 1, , Australian dollar 1, , Argentinian peso Euro Hong Kong dollar New Zealand dollar Singapore dollar Other Total 8, ,
22 1H17 MOVEMENT IN WEIGHTED AVERAGE DISCOUNT RATE Weighted average risk-free discount rates on outstanding claims % Currency 30 June Dec June 2017 Australian dollar US dollar Sterling Euro (0.16) Group weighted average (ex Argentine peso) Estimated impact of discount rate movement 1 $M 2 (267) (80) Excludes discount movement due to changes in yields for our Australian dust disease and Argentine peso denominated liabilities, where the level of assumed inflation is directly linked to the discount rate 2. Excludes $16 million of discount associated with transaction to reinsure UK long-tail liabilities 22
23 FX RATES VERSUS US$ June 2016 December 2016 June assumed Closing rate Average rate Closing rate Average rate Closing rate Average rate Average rate AUD GBP EUR ARS
24 NORTH AMERICA 1H16 1H17 Gross written premium $M 2,818 2,803 Gross earned premium $M 2,184 2,187 Net earned premium $M 1,710 1,712 Claims ratio % Commission ratio % Expense ratio % Combined operating ratio % Combined operating ratio (ex discount rate) % Premium rates up 1% Current accident year underwriting profitability stable Return to top-line growth with underlying GWP up 4% 1 Continued growth trajectory in Specialty, with GWP up 27% on the prior year with the introduction of new products and programs, coupled with growth in liability and professional lines COR (ex discount) improved to 98.2% from 100.5% in the prior year Net claims ratio of 66.8%, reflecting small positive prior year release, largely from crop, as well as the exit of mono-line commercial auto business in 2H16 Expense ratio increased slightly reflecting staff costs and technology spend Further cost efficiencies expected through a focused distribution model and partnership with Arrowhead Crop portfolio tracking in line with an average year Insurance profit margin % (1.5) Excludes Latin American premium income fronted on behalf of Equator Re in
25 EUROPE 1H16 1 1H17 2 Gross written premium $M 2,508 2,393 Gross earned premium $M 1,930 1,915 Net earned premium $M 1,561 1,532 Claims ratio % Commission ratio % Expense ratio % Combined operating ratio % Combined operating ratio (ex discount rate) % Insurance profit margin % Overall premium rates down 1%, reflecting a slight improvement from 1H16 Modest GWP growth on a constant currency basis Targeted growth achieved in Continental Europe insurance portfolio and QBE Re Positive prior year releases of $131M across several portfolios and accident years Attritional claims ratio impacted by NEP suppression resulting from weaker sterling and additional reinsurance spend, coupled with increased claims activity, largely in property Expense ratio improved to 16.1% from 17.3%, reflecting ongoing expense management and FX COR (ex Ogden and discount rate) deteriorated to 91.3% from 88.3% in the prior year, due to an increase in the current accident year claims ratio due to the higher attritional claims ratio 1. Excludes transactions to reinsure UK long-tail liabilities (refer page 11 of HY17 report for details) 2. Excludes $156M one-off adverse impact on the Group s underwriting result due to the Ogden decision in the UK (refer page 11 of HY17 report for details) 25
26 AUSTRALIA & NEW ZEALAND 1H16 1H17 Gross written premium $M 1,861 2,007 Gross earned premium $M 1,871 2,024 Net earned premium $M 1,654 1,705 Claims ratio % Commission ratio % Expense ratio % Combined operating ratio % Combined operating ratio (ex discount rate) % Insurance profit margin % GWP grew 5% on a constant currency basis reflecting 5% premium rate increases on the back of further rate increases in short-tail personal and commercial lines, coupled with improved risk selection and tighter claims management GWP grew 5% on a constant currency basis with significant premium rate increases achieved Despite the premium rate increases, policy retention remained broadly stable Net claims ratio decreased to 63.6%, largely due to improvement in attritional ratio through ongoing remediation activities and premium rate increases Attritional claims ratio improved 4.2% (ex LMI) on the back of continued remediation progress COR (ex-discount rate) improved to 92.2% from 93.9% in the prior period due to the reduction in the attritional claims ratio, partially offset by a lower level of positive prior year development 26
27 EMERGING MARKETS 1H16 1H17 Gross written premium $M Gross earned premium $M Net earned premium $M Claims ratio % Commission ratio % Expense ratio % Combined operating ratio % Combined operating ratio (ex discount rate) % Insurance profit margin % 5.5 (7.1) The result significantly impacted by adverse claims experience across a number of portfolios in Latin America and Asia Pacific Deterioration in COR to 110.8% from 99.5% due to increased frequency of mid-sized claims, coupled with adverse prior accident year claims development in HK workers compensation portfolio GWP up 3% on a constant currency basis, significantly lower than 10% growth in the prior period, reflecting 6% growth in Latin America, whilst Asia Pacific GWP declined 1% NEP up 6% on the same basis due to GWP growth, coupled with reduced reinsurance spend Claims ratio increased to 64.9% from 54.8% impacted by: - increased frequency of mid-sized claims in property & marine in Asia Pacific - adverse experience in Brazilian Affinity and Colombian SOAT, coupled with large fire claims in Mexico - reserve strengthening in HK workers compensation 27
28 EQUATOR RE 1H16 1H17 Gross written premium $M 1,125 1,375 Gross earned premium $M Net earned premium $M Claims ratio % Commission ratio % Expense ratio % Combined operating ratio % Combined operating ratio (ex discount rate) % GWP up 22% driven by an increase in proportional business underwritten to the divisions NEP up 113% from the prior period, largely from growth in the proportional book and new bespoke treaties Net claims ratio deteriorated to 68.7%: $49M adverse prior accident year development growth in proportional business Increase in commission ratio due to growth in proportional business which incurs higher commissions relative to excess of loss portfolio COR (ex discount rate) deteriorated to 79.9% compared with 63.5% in the prior period reflecting the aforementioned growth in the proportional book, coupled with adverse prior accident year claims experience Insurance profit margin %
29 FINANCIAL STRENGTH & FLEXIBILITY As at 31 Dec June 2017 Summary balance sheet $M $M Investments and cash 25,235 25,665 Trade and other receivables 4,831 6,926 Reserving Favourable PYD of $107M 1 $29M favourable discount rate impact PoA of 89.5% (FY %) Intangibles 3,627 3,737 Other assets 1,385 1, Excludes $38M (1H16 $22M) of favourable Crop prior accident year development that is offset by an additional reinsurance cession to the US Government under the Federal crop reinsurance arrangements Assets 35,078 37,718 Insurance liabilities, net 18,579 19,932 Borrowings 3,474 3,498 Other liabilities 2,691 3,572 Liabilities 24,744 27,002 Net assets 10,334 10,716 Non-controlling interests Shareholders funds 10,284 10,668 Borrowings Broadly unchanged from FY16 Debt to equity 32.8% (FY %) Debt to tangible equity 50.5% (FY %) 29
30 APRA PCA CALCULATION FY16 1 $M 1H17 2 $M Ordinary share capital and reserves 10,334 10,716 Net surplus relating to insurance liabilities Regulatory adjustments to Common Equity Tier 1 Capital (4,441) (4,571) Common Equity Tier 1 Capital 6,567 6,871 Additional Tier 1 Capital - Capital securities Total Tier 1 Capital 6,747 6,871 Tier 2 Capital - Subordinated debt and hybrid securities 2,530 2,513 Total capital base 9,277 9,384 Insurance risk charge 2,779 2,973 Insurance concentration risk charge 1,219 1,298 Asset risk charge 1,962 1,908 Operational risk charge Less: Aggregation benefit (1,158) (1,155) APRA s Prescribed Capital Amount (PCA) 5,281 5,556 PCA multiple CET1 ratio (APRA requirement >60%) 124% 124% 1. Prior year APRA PCA calculation has been restated to be consistent with APRA returns finalised subsequent to year end 2. Indicative APRA PCA calculation at 30 June
 64 62 Debt to equity Ratio within 25% - 35% benchmark range Debt to tangible equity down")
31 BORROWINGS Borrowings profile (%) Borrowings $3,498M at 30 June 2017 Weighted average cost of borrowings 5.52% Repayment profile (%) Debt to equity Ratio within 25% - 35% benchmark range Debt to tangible equity down to 50.5% 31

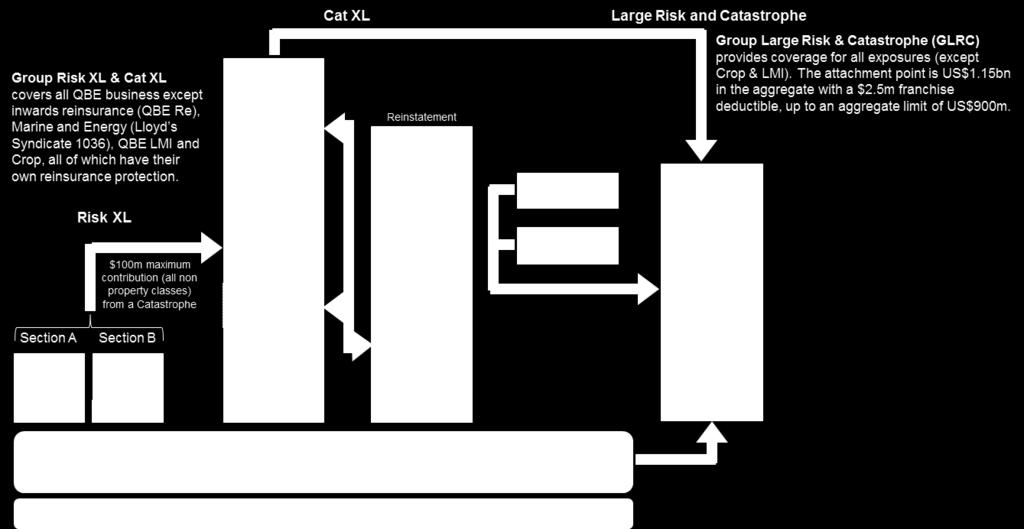
32 QBE S 2017 GLOBAL REINSURANCE PROGRAM 32
QBE Insurance Group annual results presentation. John Neal Group Chief Executive Officer Pat Regan Group Chief Financial Officer
 QBE Insurance Group 2015 annual results presentation John Neal Group Chief Executive Officer Pat Regan Group Chief Financial Officer Tuesday 23 February 2016 All figures in US$ unless otherwise stated
QBE Insurance Group annual results presentation
 QBE Insurance Group John Neal Group Chief Executive Officer Pat Regan Group Chief Financial Officer Tuesday 24 February 2015 All figures in US$ unless otherwise stated 1 John Neal Group Chief Executive
QBE Insurance Group. Credit Suisse Asian Investment Conference Hong Kong. Pat Regan I Group Chief Executive Officer
 QBE Insurance Group Credit Suisse Asian Investment Conference Hong Kong Pat Regan I Group Chief Executive Officer All figures in US$ unless otherwise stated Wednesday 21 March 2018 2017 In Review Catastrophe
Macquarie Australian Investment Conference Presentation 6 May Please find attached a copy of QBE s presentation to be delivered today.
 QBE Insurance Group Limited ABN 28 008 485 014 Level 27, 8 Chifley Square, SYDNEY NSW 2000 Australia GPO Box 82, Sydney NSW 2001 telephone + 612 9375 4444 facsimile + 612 9231 6104 www.qbe.com 6 May 2015
QBE Insurance Group Limited Half Year Report
 QBE Insurance Group Limited Half Year Contents Section 1 Business review 02 half year snapshot 04 Group Chief Executive Officer s report 08 Group Chief Financial Officer s report 22 North American Operations
28 February The Manager Company Announcements ASX Limited Level 6 Exchange Centre 20 Bridge Street, SYDNEY NSW 2000.
 28 February 2011 QBE Insurance Group Limited ABN 28 008 485 014 Head Office 82 Pitt Street SYDNEY NSW 2000 Australia Postal Address Box 82 GPO SYDNEY 2001 Telephone: +61 (2) 9375 4444 Facsimile: +61 (2)
2010 half year results announcement
 QBE INSURANCE GROUP 2010 half year results announcement Presented by: Frank O Halloran, CEO QBE Insurance Group Ltd 19 August 2010 Presentation roadmap 1. Group financial results - key messages 2. QBE
- 1 - QBE UPDATES ON PORTFOLIO SIMPLIFICATION, 2019 REINSURANCE RENEWAL AND A THREE-YEAR OPERATIONAL EFFICIENCY INITIATIVE 1
 - 1 - MARKET RELEASE 11 December 2018 QBE UPDATES ON PORTFOLIO SIMPLIFICATION, 2019 REINSURANCE RENEWAL AND A THREE-YEAR OPERATIONAL EFFICIENCY INITIATIVE 1 QBE has completed the Group s portfolio simplification
Citi conference - 25 October 2011
 QBE INSURANCE GROUP Citi conference - 25 October 2011 Presented by: Neil Drabsch, Group CFO Frequently asked questions Insurance/reinsurance pricing and market conditions Acquisitions and growth - QBE
Financial results. Full year ended 30 June Nick Hawkins Chief Financial Officer. Peter Harmer Managing Director and Chief Executive Officer
 Financial results Full year ended 30 June 2017 Peter Harmer Managing Director and Chief Executive Officer Nick Hawkins Chief Financial Officer 23 August 2017 Overview Peter Harmer Managing Director and
Global Life (GL) continues to deliver consistent results in line with previous guidance.
 continues to deliver consistent results in line with previous guidance.") Comments on Q2-16 results Slide 4: Key messages Zurich s underlying results continued to improve in the second quarter as a result of management actions outlined previously. The Q2-16 result also benefited
Comments on Q2-16 results Slide 4: Key messages Zurich s underlying results continued to improve in the second quarter as a result of management actions outlined previously. The Q2-16 result also benefited
HALF YEAR REPORT QBE INSURANCE GROUP LIMITED
 2018 HALF YEAR REPORT QBE INSURANCE GROUP LIMITED Contents QBE Insurance Group Limited Half Year to 30 June 2018 ABN 28 008 485 014 Section 1 Performance overview 2 2018 half year snapshot 4 Group Chief
INVESTOR REPORT FY August Insurance Australia Group Limited ABN
 INVESTOR REPORT FY17 23 August 2017 Insurance Australia Group Limited ABN 60 090 739 923 IMPORTANT INFORMATION This report contains general information current as at 23 August 2017 and is not a recommendation
Suncorp Group Limited ABN
 Suncorp Group Limited ABN 66 145 290 124 Financial results for the full year ended 30 June 2013 Basis of preparation Suncorp Group ( Group, the Group or Suncorp ) is represented by Suncorp Group Limited
Half year results 2018 Ongoing momentum
 Half year results 2018 Ongoing momentum Investor and media presentation August 9, 2018 Zurich Insurance Group Content MAIN SECTION (Use symbols to navigate through the document) APPENDIX (Use symbols to
Financial results. Half year ended 31 December Nick Hawkins Chief Financial Officer. Peter Harmer Managing Director and Chief Executive Officer
 Financial results Half year ended 31 December 2017 Peter Harmer Managing Director and Chief Executive Officer Nick Hawkins Chief Financial Officer 14 February 2018 Overview Peter Harmer Managing Director
G R O U P Full Year Results
 2014 Full Year Results 10 March 2015 Agenda Welcome & overview Stuart Vann, Chief Executive Officer Financial review Darren Ogden, Chief Finance Officer Chief Executive review and outlook Stuart Vann,
QBE Insurance. Premium rate and yield optimism A$12.60 AUSTRALIA. Event. Impact. Earnings and target price revision.
 AUSTRALIA QBE AU Price (at 09:32, 27 Feb 2017 GMT) Outperform A$12.60 Valuation A$ 12.92 - DCF (WACC 7.9%, beta 0.9, ERP 5.0%, RFR 3.3%, TGR 2.3%) 12-month target A$ 13.45 12-month TSR % +11.2 Volatility
ANNUAL REPORT QBE INSURANCE GROUP LIMITED
 20 ANNUAL REPORT QBE INSURANCE GROUP LIMITED Contents QBE Insurance Group Limited Annual 20 ABN 28 008 85 0 Section Performance overview 2 Chairman s message 20 snapshot Group Chief Executive Officer
Conference Call on Interim Report 3/2017
 Conference Call on Interim Report 3/2017 Hannover, 8 November 2017 Q3 losses absorbed within quarterly earnings Positive Q3 result supported by sale of listed equities Group Gross written premium: EUR
Investor Report Half Year ended 30 June 2014
 Investor Report Half Year ended 30 June 2014 Genworth Mortgage Insurance Australia Limited ABN 72 154 890 730 30 July 2014 This page has been left blank intentionally Important information This report
For personal use only. Suncorp Group Limited ABN Analyst Pack
 Suncorp Group Limited ABN 66 145 290 124 Analyst Pack for the full year ended 30 June 2014 Basis of preparation Suncorp Group ( Group, the Group or Suncorp ) is represented by Suncorp Group Limited (SGL)
IAG announces FY18 results 15 August 2018
 Financial indicators FY17 FY18 Change GWP ($m) 11,439 11,647 1.8% Insurance profit ($m) 1,270 1,407 10.8% Underlying margin (%) 12.4 14.1 170bps Reported margin (%) 15.5 18.3 280bps Shareholders funds
IAG REPORTS STRONG 1H14 PERFORMANCE
 NEWS RELEASE 21 FEBRUARY 2014 IAG REPORTS STRONG 1H14 Insurance Australia Group Limited (IAG) today announced a strong operating performance for the half-year ended 31 December 2013, recording an improved
Made possible by QBE. QBE Insurance Group Annual Report 2014
 QBE Insurance Group Annual Made possible by QBE QBE is a globally diversified insurer across a range of industries, including property and construction. From design, to construction and property management,
For personal use only Genworth Mortgage Insurance Australia
 Genworth Mortgage Insurance Australia 3Q 2016 Financial Results Presentation 4 November 2016 2016 Genworth Mortgage Insurance Australia Limited. All rights reserved. Disclaimer This presentation contains
Conference Call on Half-yearly Report 2016
 Conference Call on Half-yearly Report 2016 Hannover, 4 August 2016 Half-year results in line with full-year targets...... but Q2/2016 performance weaker than previous quarters Group Gross written premium:
Genworth Mortgage Insurance Australia
 Genworth Mortgage Insurance Australia 1Q 2016 Financial results presentation 29 April 2016 2016 Genworth Mortgage Insurance Australia Limited. All rights reserved. Disclaimer This presentation contains
Ageas reports Full Year 2016 result
 PRESS RELEASE Regulated information Brussels, 15 February 2017-7:30 (CET) Ageas reports Full Year 2016 result Steady growth of Insurance net result due to solid operating performance Fourth quarter net
2018 Full Year Results 20 November 2018
 2018 Full Year Results 20 November 2018 Disclaimer Certain information included in the following presentation is forward looking and involves risks, assumptions and uncertainties that could cause actual
Operating and financial review (unaudited) 2017
 2017") Operating and financial review (unaudited) 207 Results for the year ended December 3, 207 2 Operating and financial review The operating and financial review is the management analysis of the business
Operating and financial review (unaudited) 207 Results for the year ended December 3, 207 2 Operating and financial review The operating and financial review is the management analysis of the business
Genworth Mortgage Insurance Australia
 Genworth Mortgage Insurance Australia Full Year 2015 Financial Results Presentation 5 February 2016 2016 Genworth Mortgage Insurance Australia Limited. All rights reserved. Disclaimer This presentation
Genworth Mortgage Insurance Australia
 Genworth Mortgage Insurance Australia 1Q 2015 Financial results presentation 29 April 2015 2015 Genworth Mortgage Insurance Australia Limited. All rights reserved. Disclaimer This presentation contains
G R O U P Full Year Results
 Full Year Results 10 March 2017 Agenda Welcome and overview Stuart Vann, Chief Executive Officer Financials Darren Ogden, Chief Finance Officer Business review and outlook Stuart Vann, Chief Executive
G R O W I N G TO G E T H E R
 2 MAY 2018 1Q18 FINANCIAL RESULTS PRESENTATION G R O W I N G TO G E T H E R 2018 Genworth Mortgage Insurance Australia Limited. All rights reserved. Disclaimer This presentation contains general information
Genworth Mortgage Insurance Australia
 Genworth Mortgage Insurance Australia 1Q 2017 Financial Results Presentation 3 May 2017 2017 Genworth Mortgage Insurance Australia Limited. All rights reserved. Disclaimer This presentation contains general
Genworth Mortgage Insurance Australia
 Genworth Mortgage Insurance Australia Full Year 2016 Financial Results Presentation 8 February 2017 2017 Genworth Mortgage Insurance Australia Limited. All rights reserved. Disclaimer This presentation
STRATEGIC RELATIONSHIP WITH BERKSHIRE HATHAWAY
 ABN 60 090 739 923 STRATEGIC RELATIONSHIP WITH BERKSHIRE HATHAWAY 16 JUNE 2015 Mike Wilkins, Managing Director and Chief Executive Officer Nick Hawkins, Chief Financial Officer Strategic relationship with
Conference Call on Q1/2018 results
 Conference Call on Q1/2018 results Hannover, 7 May 2018 Favourable start to 2018 EBIT increase of +8.5% outperforms NPE growth GWP 4,547 in m. NPE in m. EBIT in m. Group net income in m. 5,345 +17.6% 3,738
2018 Genworth Mortgage Insurance Australia Limited. All rights reserved.
 2018 Genworth Mortgage Insurance Australia Limited. All rights reserved. Disclaimer This presentation contains general information in summary form which is current as at 31 December 2017. It may present
2017 Interim Results. Analyst Presentation. Lloyd s
 2017 Interim Results Analyst Presentation Lloyd s Disclaimer This information is not intended for distribution to, or use by, any person or entity in any jurisdiction or country where such distribution
Operating and financial review (unaudited) 2018
 2018") Operating and financial review (unaudited) 208 Results for the six months to June 30, 208 2 Operating and financial review The operating and financial review is the management analysis of the business
Operating and financial review (unaudited) 208 Results for the six months to June 30, 208 2 Operating and financial review The operating and financial review is the management analysis of the business
Investor Report Half year ended 30 June 2017
 Investor Report Half year ended 30 June 2017 Genworth Mortgage Insurance Australia Limited ABN 72 154 890 730 2 August 2017 Corporate information This report contains general information in summary form
Commenting on the performance, Bill Winters, Group Chief Executive, said:
 31 October 2018 Standard Chartered PLC - Interim Management Statement Standard Chartered PLC (the Group) today releases its Interim Management Statement for the period 30 September 2018. All figures are
Results for the year ended 31 December 2011
 Cover Results for the year ended 31 December 2011 Tuesday, 7 February 2012 Disclaimer notice Certain statements made in this presentation, both oral and written, are or may constitute forward looking statements
Half year results 2017 Building a strong foundation
 Half year results 2017 Building a strong foundation Investor and media presentation August 10, 2017 Zurich Insurance Group Content MAIN SECTION (Use symbols to navigate through the document) APPENDIX (Use
QBE Lenders Mortgage Insurance (QBE LMI)
") QBE Lenders Mortgage Insurance (QBE LMI) Jenny Boddington CEO, QBE LMI Michael Savery CRO, QBE LMI UBS conference Wednesday 19 June 2013 All amounts in AU$ unless otherwise stated 1 Agenda 1. Snapshot
QBE Lenders Mortgage Insurance (QBE LMI) Jenny Boddington CEO, QBE LMI Michael Savery CRO, QBE LMI UBS conference Wednesday 19 June 2013 All amounts in AU$ unless otherwise stated 1 Agenda 1. Snapshot
Profit before tax from continuing operations up 44.6% to 45.1m (1H 2016: 31.2m)
") 03 August 2017 esure Group plc interim results for the six months ended 30 June 2017 An excellent first half with growth in premiums, policies and profits Highlights Gross written premiums up 22.8% to
03 August 2017 esure Group plc interim results for the six months ended 30 June 2017 An excellent first half with growth in premiums, policies and profits Highlights Gross written premiums up 22.8% to
INVESTOR REPORT 1H February Insurance Australia Group Limited ABN
 INVESTOR REPORT 1H18 14 February 2018 Insurance Australia Group Limited ABN 60 090 739 923 IMPORTANT INFORMATION This report contains general information current as at 14 February 2018 and is not a recommendation
Australia and New Zealand Banking Group Limited
 Australia and New Zealand Banking Group Limited ABN 11 005 357 522 Year 30 September 2008 Consolidated Results Dividend Announcement and Appendix 4E The Consolidated Results and Dividend Announcement constitutes
Performance and Results
 018 Performance and Results Quarterly Statement as at 31 March 2018 THE TALANX GROUP AT A GLANCE Group key figures Unit 2018 2017 +/ 2018 to 2017 Gross written premiums 10,560 9,752 +8.3 by region Germany
COMPUTERSHARE LIMITED (ASX:CPU) FINANCIAL RESULTS FOR THE FULL YEAR ENDED 30 JUNE August 2014
 FINANCIAL RESULTS FOR THE FULL YEAR ENDED 30 JUNE August 2014") COMPUTERSHARE LIMITED (ASX:CPU) FINANCIAL RESULTS FOR THE FULL YEAR ENDED 30 JUNE 2014 13 August 2014 NOTE: All figures (including comparatives) are presented in US Dollars (unless otherwise stated). The
COMPUTERSHARE LIMITED (ASX:CPU) FINANCIAL RESULTS FOR THE FULL YEAR ENDED 30 JUNE 2014 13 August 2014 NOTE: All figures (including comparatives) are presented in US Dollars (unless otherwise stated). The
Operating and financial review (unaudited) 2015
 2015") Zurich Insurance Group Operating and financial review (unaudited) 2015 2 Group performance review Zurich Insurance Group Operating and financial review The Operating and financial review is the management
Zurich Insurance Group Operating and financial review (unaudited) 2015 2 Group performance review Zurich Insurance Group Operating and financial review The Operating and financial review is the management
3. RISK NOTE 2.7 TRADE AND OTHER PAYABLES
 NOTE 2.7 TRADE AND OTHER PAYABLES 2017 2016 A. COMPOSITION I. Reinsurance premium payable (a) 712 848 II. Trade creditors (b) Commissions payable 268 257 Stamp duty payable 123 116 GST payable on premium
Operating and financial review Zurich Financial Services Group Half Year Report 2011
 Operating and financial review 2011 Half Year Report 2011 2 Half Year Report 2011 Operating and financial review The information contained within the Operating and financial review is unaudited. This document
FBD HOLDINGS PLC 4 TH I N T E R I M R E S U L T S A U G U S T
 1 FBD HOLDINGS PLC 2 0 1 7 I N T E R I M R E S U L T S A U G U S T 4 TH 2 Forward looking statements This presentation contains certain forward-looking statements. Actual results may differ materially
Genworth Mortgage Insurance Australia
 Genworth Mortgage Insurance Australia 1H 2015 Financial results presentation 5 August 2015 2015 Genworth Mortgage Insurance Australia Limited. All rights reserved. Disclaimer This presentation contains
Suncorp Group Limited ABN Analyst Pack
 Suncorp Group Limited ABN 66 145 290 124 Analyst Pack Financial results for the half year ended 31 December 2015 Basis of preparation Suncorp Group ( Group, the Group, the Company or Suncorp ) is comprised
2017 INTERIM RESULTS. 1 RSA Insurance Group plc Interim Results. Underlying measure, please refer to pages for further information.
 2017 INTERIM RESULTS RSA Insurance Group plc 2 August 2017 RSA announces strong first half results. Underlying earnings per share up 31%; Interim dividend up 32%. Return on Tangible Equity 1 16.6%. Stephen
9 May Half Year Results
 9 May 2018 2018 Half Year Results Disclaimer Certain information included in the following presentation is forward looking and involves risks, assumptions and uncertainties that could cause actual results
Brambles reports results for the half-year ended 31 December 2017
 Brambles Limited ABN 89 118 896 021 Level 10, 123 Pitt Street Sydney NSW 2000 Australia GPO Box 4173 Sydney NSW 2001 Tel +61 2 9256 5222 Fax +61 2 9256 5299 www.brambles.com 19 February 2018 The Manager
Suncorp Group Limited
 Suncorp Group Limited Financial results for the half year ended 31 December 2013 1 Suncorp results presentation Agenda Results & operational highlights Patrick Snowball CFO report Steve Johnston Outlook
Half Year Report 2011
 Zurich Financial Services Group Half Year Report 2011 Report for the six months to June 30, 2011 About Zurich Zurich is one of the world s largest insurance groups, and one of the few to operate on a truly
INVESTOR REPORT FY August Insurance Australia Group Limited ABN
 INVESTOR REPORT FY16. 19 August 2016 Insurance Australia Group Limited ABN 60 090 739 923 IMPORTANT INFORMATION This report contains general information in summary form which is current as at 19 August
Q Results 11 May Torsten Leue, CEO Dr. Immo Querner, CFO
 2018 Results 11 May 2018 Torsten Leue, CEO Dr. Immo Querner, CFO Overall good underpins FY2018 Group net income Outlook of ~EUR 850m Retail International and Reinsurance with strong start into the new
PRESS RELEASE AXA CONSOLIDATED REVENUES UP 4.6% ON A COMPARABLE BASIS TO EURO 74.7 BILLION FOR THE FULL YEAR 2002
 PRESS RELEASE February 5, 2003 AXA CONSOLIDATED REVENUES UP 4.6% ON A COMPARABLE BASIS TO EURO 74.7 BILLION FOR THE FULL YEAR 2002 Life & Savings revenues increased by 5.5% to Euro 48.6 billion, boosted
Ashmore Group plc. Results for six months ending 31 December February
 Ashmore Group plc Results for six months ending 31 December 2017 8 February 2018 www.ashmoregroup.com Overview Accelerating growth and outperformance across Emerging Markets GDP growth driven by exports,
Half Year Report 2009
 Zurich Financial Services Group Half Year Report 2009 Report for the Six Months ended June 30, 2009 Here to help your world. Financial information Contents Message from the Chairman and CEO 1 Financial
2017 Full Year Results. Tuesday 21 November 2017
 2017 Full Year Results Tuesday 21 November 2017 Disclaimer Certain information included in the following presentation is forward looking and involves risks, assumptions and uncertainties that could cause
Analysts conference call 8 May 2007
 8 May 2007 First Quarter 2007 results Today s agenda Introduction Susan Holliday, Head IR Group results George Quinn, CFO Q&A George Quinn, CFO Slide 2 First Quarter 2007 results Executive summary Performance
Genworth Mortgage Insurance Australia
 Genworth Mortgage Insurance Australia 3Q 2017 Financial Results Presentation 3 November 2017 2017 Genworth Mortgage Insurance Australia Limited. All rights reserved. Disclaimer This presentation contains
Results for the six months ended 30 June 2014
 Cover Results for the six months ended 30 June 2014 Tuesday, 22 July 2014 1 Disclaimer notice Certain statements in the presentation, are or may constitute forward looking statements. Such forward looking
Aviva Preliminary Results Athletics pictures
 Aviva Preliminary Results 2011 Athletics pictures Disclaimer Cautionary statements: This should be read in conjunction with the documents filed by Aviva plc (the Company or Aviva ) with the United States
Commentary on annual results Slide 3: Key messages
 Commentary on annual results 2018 Slide 3: Key messages Full year 2018 results show very strong performance in a challenging market and claims environment, with the business operating profit (BOP) up 20%
9M 2018 Results 12 November Torsten Leue, CEO Dr. Immo Querner, CFO
 2018 Results 12 November 2018 Torsten Leue, CEO Dr. Immo Querner, CFO All segments except Industrial Lines contribute to significantly higher operating result EBIT (+33%) and Group net income (+10%) well
H Financial results
 H1 2014 Financial results Financial analysts meeting July 30, 2014 1 1 Highlights 2 Commercial & Risk overview 3 Quarterly results 4 Year-to-date results 5 Appendices 2 1H 2014 Operational highlights Improving
For personal use only
 ASX / Media release 14 February 2017 COCHLEAR FINANCIAL RESULTS FOR THE SIX MONTHS ENDED DECEMBER 2016 Positive momentum continues across all markets Net profit of $111.4m, up 19% Cochlear implant units
1 Jan 2018 Property & Casualty Treaty Renewals. and guidance update 2017 and 2018
 Property & Casualty Treaty Renewals and guidance update 2017 and 2018 Renewals Conference Call Hannover, 7 February 2018 Reinsurance markets Our results Our portfolio Structured reinsurance Outlook 2018
INSURANCE AUSTRALIA GROUP LIMITED ABN HALF YEAR REPORT 31 DECEMBER 2010 APPENDIX 4D
 INSURANCE AUSTRALIA GROUP LIMITED ABN 60 090 739 923 HALF YEAR REPORT 31 DECEMBER 2010 APPENDIX 4D CONTENTS Page No Results for announcement to the market 1 Other information 2 Appendix 4D compliance matrix
NAB 2015 Half Year Results
 800 Bourke Street Docklands VIC 3008 AUSTRALIA www.nabgroup.com Thursday, 7 May 2015 ASX Announcement NAB 2015 Half Year Results Executing our strategy, building a stronger bank Highlights Cash earnings
2015 PRELIMINARY RESULTS
 2015 PRELIMINARY RESULTS 2015 operating profit of 523m, up 43% on 2014 (up 57% at constant exchange) 25 February 2016 Underwriting profit up 437%. Post-tax profit up 221%. Final dividend 7p/share, up 250%
Half Year Report 2016
 Half Year Report 2016 Report for the six months to June 30, 2016 About Zurich Zurich is a leading multi-line insurer that serves its customers in global and local markets. With about 55,000 employees,
Half Year Results Reporting 2008
 Half Year Results Reporting 2008 Analysts and Media Presentation Zurich, August 3, 2008 Disclaimer and cautionary statement Certain statements in this document are forward-looking statements, including,
23 August 2012 INVESTOR REPORT FY12. Insurance Australia Group Limited ABN
 23 August 2012 INVESTOR REPORT FY12 Insurance Australia Group Limited ABN 60 090 739 923 DIRECTORY SECURITIES EXCHANGE LISTINGS ASX Limited: ASX code for Ordinary Shares: IAG (shares on issue, 30 June
Amcor Half Year Results
 Amcor Half Year Results Investor Presentation Ron Delia Managing Director & CEO Michael Casamento CFO Disclaimer Forward looking statements This presentation contains forwardlooking statements that involve
For personal use only
 tification of dividend / distribution tification of dividend / distribution Announcement Summary Entity name AMCOR LIMITED Security on which the Distribution will be paid AMC - ORDINARY FULLY PAID Announcement
Mondelēz International Q Results. July 27, 2016
 Mondelēz International Q2 2016 Results July 27, 2016 1 Forward-Looking Statements This presentation contains a number of forward-looking statements. Words, and variations of words, such as will, expect,
Results for the six months ended. Friday, 22 July 2011
 Results for the six months ended 30 June 2011 Results for the six months ended 30 June 2011 Friday, 22 July 2011 1 Disclaimer notice Certain statements in the presentation, are or may constitute forward
Aon Risk Solution Seminar -AGCS perspective. Axel Theis, CEO Allianz Global Corporate & Specialty September 16, 2010
 Aon Risk Solution Seminar -AGCS perspective Axel Theis, CEO Allianz Global Corporate & Specialty September 16, 010 Content 1 Corporate & Specialty Market: Snapshot and Outlook 3 What drives the outlook
12M 2013 Financial results
 12M 2013 Financial results Financial analysts meeting February 13, 2014 1 1 Highlights 2 Commercial & Risk overview 3 Quarterly results 4 Year-to-date results 5 Shareholders equity & Economic solvency
For personal use only
 Update Summary Entity name AMCOR LIMITED Security on which the Distribution will be paid AMC - ORDINARY FULLY PAID Announcement Type Update to previous announcement Date of this announcement Friday September
DATATEC GROUP UNAUDITED INTERIM RESULTS FOR THE 6 MONTHS ENDED 31 AUGUST 2016
 Technology Distribution Integration & Managed Services Consulting & Research UNAUDITED INTERIM RESULTS FOR THE 6 MONTHS ENDED 31 AUGUST 2016 AGENDA Results summary, market conditions & operational strategy
Puma Energy : Fourth quarter & full year 2018 results Thursday 28 th March Puma Energy
 Puma Energy : Fourth quarter & full year 2018 results Thursday 28 th March 2019 Puma Energy The opportunity for Puma Energy Unique footprint, great people & strong business fundamentals in high potential
For personal use only
 For personal use only Profit Announcement FOR THE FULL YEAR ENDED 30 JUNE 2014 COMMONWEALTH BANK OF AUSTRALIA ACN 123 123 124 13 AUGUST 2014 ASX Appendix 4E Results for announcement to the market (1) Report
Profit Announcement For the full year ended 30 June 2013
 Profit Announcement For the full year ended 30 June 2013 COMMONWEALTH BANK OF AUSTRALIA ACN 123 123 124 14 AUGUST 2013 FIND OUT MORE VIA OUR APP ASX Appendix 4E Results for announcement to the market (1)
Ageas reports 9M 2017 result Continued excellent operating performance
 PRESS RELEASE Regulated information Brussels, 8 November 2017-7:30 (CET) Ageas reports 9M 2017 result Continued excellent operating performance 9M 2017 Net Result Inflows Operating Performance Balance
Acquisition of Endurance Specialty Holdings. October 5, 2016
 Acquisition of Endurance Specialty Holdings October 5, 2016 Disclaimer The information in this presentation is subject to change without prior notice. Financial data included in this presentation relating
FBD HOLDINGS PLC Interim Results. August 2016
 FBD HOLDINGS PLC 2016 Interim Results Forward looking statements This presentation contains certain forward-looking statements. Actual results may differ materially from those projected or implied in such
QBE Insurance Group Global Operational Transformation Program
 QBE Insurance Group Global Operational Transformation Program John Neal Group Chief Executive Officer Neil Drabsch Group Chief Financial Officer Colin Fagen Chief Executive Officer, Australian & NZ Operations
Quarterly Market Review
 Quarterly Market Review THEMES FOR THE QUARTER Emerging Markets the Standout in Mixed Q1 Global Equity Returns Developed Markets Positive; Australia and NZ Negative Value Premium Positive in Emerging Markets;