s 2012 Annual Report
|
|
|
- Edgar Mills
- 6 years ago
- Views:
Transcription

1 2012 s Annual Report

2 Millennium Offshore Services Superholdings, LLC Trust Company Complex Ajeltake Island Ajeltake Road, Majuro Marshall Islands, MH96960 COMPANY OFFICES Millennium Offshore Services - Main Office Millennium Offshore Services Management Company FZE. P.O. Box nd Floor, Building C1, Ajman Free Zone, Ajman United Arab Emirates Telephone: +971 (0) Fax : +971(0) MOS - Logistics Center UAE - AJMAN Aljarf - Industrial Estate Block 20 Plot 607 Ajman, UAE MOS - AUSTRALIA BRANCH AUSTRALIA - DARWIN 14 Christie Street Darwin, Australia MOS - QATAR BRANCH QATAR - Doha Almuntaza - Ibn Seena Street Gulf Bussines Center Building Office No. 101 Doha, Qatar MOS - SINGAPORE OFFICE 1 Commonwealth Lane #06-21, ONE Commonwealth Singapore MOS - EGYPT BRANCH EGYPT - Cairo 8 Palestine Street, Messagnia Building Port Said, Egypt MOS - ABU DHABI REPRESENTATIVE OFFICE Zakher Marine International United Arab Emirates Abu Dhabi
3 ANNUAL REPORT CONTENTS Independent Auditors Report Financial Highlights 5 Fleet Vessel Profiles 7 Business Overview 13 Officers, Board of Directors, and Principal Shareholders 22 Risk Factors 24 Presentation of Financial & Other Information 34 Management s Discussion and Analysis of Financial Condition and Results of Operations 38 Consolidated Financial Statements 67 Consolidated Statement of Financial Position 68 Consolidated Statement of Comprehensive Income 69 Consolidated Statement of Changes in Equity 70 Consolidated Statement of Cash Flows 71 Notes to the Consolidated Financial Statements 72 Independent Appraisal Value of Fleet 93 Company Details 94 3

4
5 2012 FINANCIAL HIGHLIGHTS Revenue & Fleet Utilization ($m) 58% 68% 94% $127.1 Burj not part of the fleet 1 $47.9 $ % revenue growth in 2012 driven by the addition of ASV Burj to the fleet and utilization rising to 94% Fleet Utilization # of ASVs in Fleet at year-end Net Income ($m) Burj not part of the fleet 1 $51.7 $9.5 $ Robust revenue growth, increased fleet utilization and rising gross margin drove significantly improved profitability EBITDA 2 ($m) 53% 47% 66% Burj not part of the fleet 1 $83.8 $25.2 $ EBITDA more than triples versus 2011 as EBITDA margin rises to 66% % Margin Footnotes: (1) Burj was first contracted on January 1, 2012 on a transit / standby discounted day rate until its full day rate began on March 12, (2) EBITDA is defined as net profit for the applicable period before finance costs, income tax expense, unrealized gain/loss on fair valuation of interest rate swap, equity settled C-grant expense and depreciation of property and equipment.
6 2012 FINANCIAL HIGHLIGHTS Maintenance Capital Expenditures ($m) Experienced management team driving efficient maintenance CapEx investment in well maintained fleet of ASVs $15.9 $5.3 $ Cash & Cash Equivalents ($m) Rising cash and cash equivalents, underpinned by strong free cash flow generation $1.8 $3.2 $ Backlog Breakdown by Year as of December 31, 2012 ($m) Large backlog resulting in significant visibility into future revenues and cash flows $132.4 $132.4 $106.2 $26.3 $79.9 $78.0 $65.1 Footnotes: - The comprehensive IFRS 2012 financials and notes are provided in this report as well as the audited 2010 and 2011 annual financials which are incorporated herein by reference and are publicly available on the company website at - For further details regarding backlog see: Management s Discussion and Analysis of Financial Condition and Results of Operations - Other Financial Data - Backlog, Fleet Utilization and Day Rates - Backlog is presented pro-forma for new business wins. See: Material Recent Developments $ Customer Extension Option Fixed Term Contract
7 7
8 8
9 9
10 10
11 11
12 12
13 BUSINESS OVERVIEW We are a leading provider of offshore jack-up accommodation service vessels ( ASVs ) to oil and gas as well as engineering, procurement, installation and commission ( EPIC ) companies operating in the Middle East and North Africa ( MENA ) and Asia-Pacific regions. ASVs are typically used wherever there is a need for additional offshore accommodation to support a workforce that cannot be accommodated on an offshore oil and gas installation s own facilities. The ASV is usually linked to the host installation by one or two walkways. The facilities for the personnel on board an ASV include bedrooms, bathrooms, dining halls, recreational facilities (such as cinemas, internet cafes, game rooms, gyms), executive offices and conference rooms. ASVs may also have additional equipment and facilities on board that can be used to support ongoing work on the neighboring installation including cranes, open deck areas, workshops, storage areas and client offices. Demand for ASVs is often greatest during the production and other post-exploration phases of an offshore oil and gas installation s lifecycle. As installations age, their need for inspection, maintenance and repair increases, with a resulting need for additional accommodation to support such large-scale work. Inspection, maintenance and repair work carried out on an installation during the production phase is essential to maintaining oil and gas production and therefore drives the majority of ASV demand globally. We own and operate a fleet of six jack-up ASVs, five of which are currently in the MENA region and one of which is currently in the Asia-Pacific region. All of our ASVs are registered in the Republic of the Marshall Islands ( Marshall Islands ). We have historically operated in the MENA region and entered the Asia-Pacific market in early 2012 with the mobilization of Burj, our sixth and newly-converted ASV, for a contract in the offshore region jointly administered by Australia and Timor-Leste ( Australia/Timor ). We believe demand for ASVs in the Asia-Pacific region is growing and that the market remains underserved. We were founded in 2007 and are headquartered in Ajman (UAE). We have five registered offices in Singapore (Singapore), Darwin (Australia), Doha (Qatar), Alexandria (Egypt) and Dili (Timor-Leste), as well as a representative office in Abu Dhabi (UAE). We also lease a purpose-built yard, workshop and storage area in Ajman (UAE), near the Hamriyah Port in Sharjah. 13
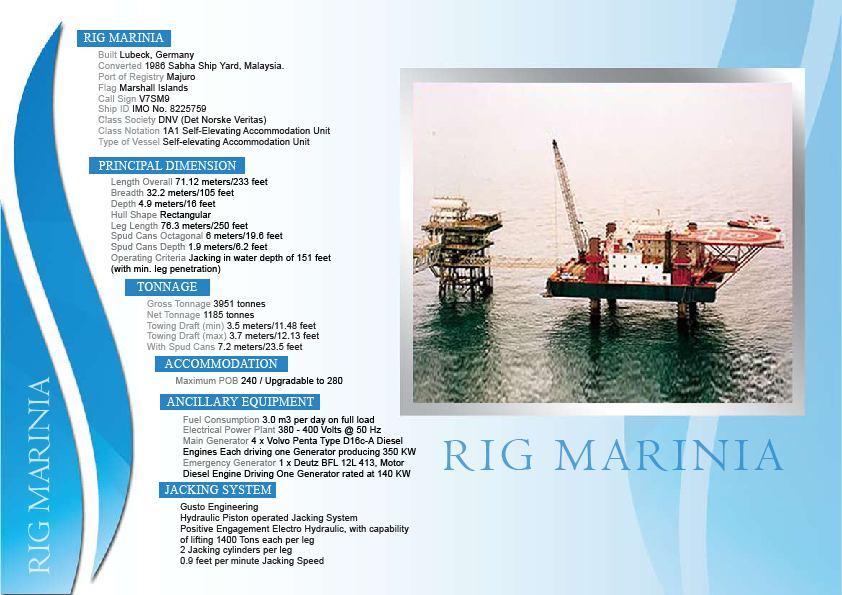
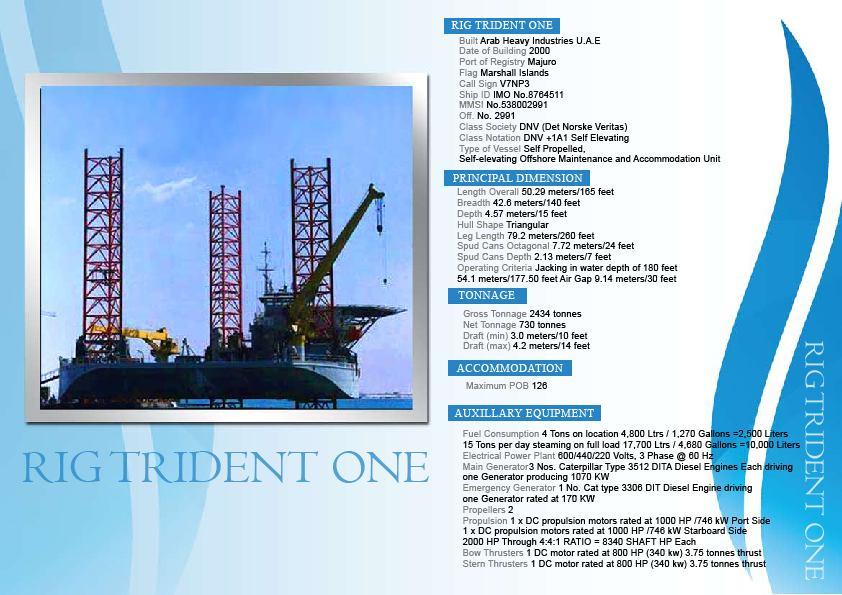
14 The following table provides a summary of our fleet of ASVs as of December 31, Name Max Water Depth (ft) Max PoB Capacity (1) # of Cranes / Max Crane Lift (MT) Certification Ahmed /110 DNV Burj Upgradable to 500 3/200 DNV Deema Upgradable to 500 3/200 DNV Leen /37 DNV Marinia Upgradable to 280 2/110 DNV Trident One /64 DNV (1) ASVs may be upgraded through the installation of additional modular accommodation, which allows person on board ( PoB ) capacity of the ASV to be increased to levels shown. Total PoB upgrade capacity is based on the maximum number of additional modular accommodation that can be supported by the ASV. Customers Our customer base includes large and prominent NOCs, IOCs and EPIC companies who lease our ASVs at varying contract lengths to provide support to their large offshore capital projects. In some instances, we enter into contracts with our customers indirectly as subcontractors. For the twelve months ended December 31, 2012, six customers accounted for 100% of our revenue and our top customer accounted for 38% of our revenue. In addition, as of December 31, 2012, six customers accounted for 100% of our backlog of fixed term contracts and customer extension options. We benefit from repeat business from our customers, with seven out of our eleven customers since we began operating having executed two or more contracts with us. In addition, since our inception, our customers have exercised 37 out of 41 customer extension options. Some of our repeat customers include, Total ABK, Hyundai Heavy Industries, Oxy, Saudi Aramco/McDermott and ENPPI/GUPCO. Other customers include ConocoPhillips, Lamnalco, NPCC and others. Our management team continually works to build customer relationships by initiating dialogue with prospective customers and maintaining an active dialogue with our existing customers to ensure that we are up to date with their requirements, particularly with regards to health and safety, and trends in the industry, including with regards to ASV specifications. 14
15 Fleet Contract Profile Set out below is an overview of our fleet contract profile as of December 31, We operate on the basis of fixed term contracts with customer extension options. Contract/Extension Date ASV/Status End Customer Location Start End Ahmed On Fixed Term Contract... ENPPI/GUPCO (1) Egypt September 2011 September 2014 Burj On Fixed Term Contract... ConocoPhillips Australia/Timor January 2012 July 2014 Customer Extension Option (2) ConocoPhillips Australia/Timor August 2014 November 2015 Deema On Fixed Term Contract... NOC Qatar February 2013 July 2013 Leen On Fixed Term Contract... NOC/IOC JV UAE July 2011 July 2014 Customer Extension Option (3) NOC/IOC JV UAE July 2014 July 2016 Marinia On Fixed Term Contract (4)... Occidental Petroleum of Qatar Qatar April 2010 March 2015 Trident One On Fixed Term Contract... Total ABK UAE July 2011 June 2013 Follow On Contract (5)... Total ABK UAE July 2013 June 2015 (1) GUPCO is a 50/50 joint venture between BP plc and Egyptian General Petroleum Corporation ( EGPC ). (2) Comprises eight two-month customer extension options. (3) Comprises one two-year customer extension option. (4) Includes two one-year customer extension options exercised by the customer on January 27, 2013, extending the fixed term of the contract from March 2013 to March See Material Recent Developments Marinia Contract Extension. (5) On February 21, 2013 we signed a 2 year follow on contract for the Trident One with Total ABK e from July 2013 to June Trident Oned. See See Material Recent Developments New Business Wins Total ABK/Trident One. 15
16 The table below sets out, based on the above fleet contract profile, the percentage of days during the relevant period that each ASV is contracted for a fixed period or has a customer extension option as of December 31, 2012 pro-forma for new business wins. Ahmed Three months ended December 31, Year ended December 31, Fixed Term Contract % 100.0% 67.7% 0.0% Customer Extension Options % 0.0% 0.0% Total Fixed Term Contract and Customer Extension Options % 100.0% 67.7% 0.0% Burj Fixed Term Contract % 100.0% 58.1% 0.0% Customer Extension Options % 41.9% 91.5% Total Fixed Term Contract and Customer Extension Options % 100.0% 100.0% 91.5% Deema Fixed Term Contract % 44.1% 0.0% 0.0% Total Fixed Term Contract, Customer Extension Options and New Business Win % 0.0% 0.0% Leen (1) Fixed Term Contract % 100.0% 54.2% 0.0% Customer Extension Options % 45.8% 100.0% Total Fixed Term Contract and Customer Extension Options % 100.0% 100.0% 100.0% Marinia Fixed Term Contract (2) % 100.0% 100.0% 24.7% Customer Extension Options % 0.0% 0.0% Total Fixed Term Contract and Customer Extension Options % 100.0% 100.0% 24.7% Trident One Fixed Term Contract (3) % 100.0% 100.0% 49.6% Customer Extension Options % 0.0% 0.0% Total Fixed Term Contract, Customer Extension Options and New Business Win % 100.0% 100.0% 49.6% (1) For Leen, customer extension options also cover 54.1% of days in the year ended December 31, (2) On January 27, 2013, the customer exercised its two one-year extension options, extending the fixed term of the contract from March 2013 to March (3) On February 21, 2013 we signed a 2 year follow on contract for the Trident One with Total ABK e from July 2013 to June Trident Oned. See See Material Recent Developments New Business Wins Total ABK/Trident One. 16
17 Key Contract Terms Our contracts generally include: (i) a day rate, which is earned regardless of the activity level on the ASV; (ii) a rate per PoB to provide messing and accommodation for the customer personnel and other workers on board the ASV; and (iii) a mobilization and demobilization fee, which usually covers the costs of moving an ASV to the contract location and back to the yard at contract expiry. We operate on the basis of fixed term contracts with customer extension options. The duration of our contracts varies depending on customer requirements. At the end of the initial contract period, our customers usually seek to have one or more options to extend the contract. Our contracts can be terminated by our customers generally without penalty at notice periods typically ranging from 30 to 60 days. Terms vary by contract but can be longer, including a current contract which has a notice period of 180 days. The notice period is generally linked to the length of the fixed term of the contract, with longer contracts having longer notice periods. We have only experienced one early cancellation in our operating history, which occurred in December 2009 when our customer cancelled its contract for Ahmed. We believe that the contract was cancelled because the budget for the underlying project was not approved by the country financing the project due to adverse global economic conditions. Ahmed was subsequently awarded a contract starting in mid-2011 by the same customer for the same project and installations once the budget was approved. Company Strengths and Strategy Strengths We believe that our key competitive strengths are as follows: A leading jack-up ASV operator focused on the large and growing market for offshore oil and gas installation (i) inspection, maintenance and repair, and (ii) construction, hook-up and commissioning projects in both the MENA and Asia-Pacific regions We are a leading provider of jack-up ASVs to oil and gas and EPIC companies operating in the MENA and Asia-Pacific regions. As of October 2012, we had market shares of 29.2% and 24.0% (by total fleet passenger capacity) in the jack-up ASV sector in the MENA and Asia-Pacific regions, respectively, according to an IHS Report commissioned by the Company 1. The total revenue generated in the global ASV market in 2011 was estimated to be $3.7 billion (equivalent to total demand of 29,820 vessel days) according to the IHS Report, of which 31% was spent in the Middle East and Mediterranean and Asia-Pacific regions (or 50% of total vessel days). The ASV market is expanding globally as a result of (i) the increasing inspection, maintenance and repair of existing offshore installations as they age, (ii) the large number of new installations being constructed (predominantly offshore) and subsequently requiring construction, hook-up and commissioning, and (iii) the increased focus and legislation related to the removal and decommissioning of old installations. The largest market for ASVs comes from inspection, maintenance and repair work, which has to be undertaken during the production phase of an installation s life because, as installations age, their inspection, maintenance and repair programs increase and generally require a large number of workers for extended periods of time. In addition, an installation s production phase is the least impacted by commodity price swings, which means that inspection, maintenance and repair capital expenditures on these projects are usually delayed only in extraordinary circumstances. According to the IHS Report, ASVs are broadly used 70% of the time for inspection, maintenance and repair of existing installations. As of October 2012, approximately 19% and 22% of the fixed installations were in the Middle East and Mediterranean and Asia- Pacific regions, respectively, with an average age of 24.2 years and 19.6 years, respectively, according to the IHS Report. The Middle East and Mediterranean region also has some of the oldest fixed installations globally. 17
18 1. All references to IHS Report, IHS or the Report relate to an accommodation market survey report prepared by IHS for the Company, entitled The Jackup Accommodation Market, a Report for Millennium Offshore Services dated October In addition to inspection, maintenance and repair work, ASVs are also used to accommodate personnel working on construction, hook-up and commissioning of new installations Ability to capitalize on growing trend in the ASV sector of using jack-up ASV solutions versus floating solutions We believe that in the shallow water market, jack-up ASVs are becoming increasingly popular compared to floating ASVs (mainly barges and monohulls), as customers are increasingly becoming aware of the significant disadvantages of floating solutions, including: (i) potential for significant downtime during periods of adverse weather conditions, as the walkways between a floating ASV and a fixed platform must be disconnected; (ii) generally low quality of accommodation; (iii) potential for worker sea sickness; and (iv) potential for floating solution anchors to interfere with the subsea infrastructure thereby damaging the customer s installation. These factors may be exacerbated on longer-term projects where workers can reside on the same ASV for over five years. We believe that customers are increasingly looking at jack-up ASV solutions to minimize downtime and maximize productivity. Significant backlog resulting in visibility into future revenues Our backlog reflects the estimated future revenue attributable to the remaining term of our existing fixed term contracts and customer extension options across all of our ASVs. As at December 31, 2012, our total backlog stood at $316.6 million. This consists of backlog under fixed term contracts of $225.1 million and backlog in respect of customer extension options of $91.5 million. Furthermore, we are in active dialog with current and potential new customers, including expressions of interest, requests for quotation and invitations to tender, concerning future needs for our services and potential additions to our fleet. Strong relationships with high-quality customers resulting in significant repeat business and exercise of customer extension options Our customer base has included some of the largest and most prominent national oil companies ( NOCs ), international oil companies ( IOCs ) and EPIC companies globally, including ConocoPhillips, Total ABK, Occidental Petroleum of Qatar ( Oxy ), Saudi Aramco, Hyundai Heavy Industries, McDermott, ENPPI/GUPCO, Lamnalco and Dolphin Energy. These companies have large multi-year development budgets and we believe they will continue to use ASVs during the production and other post-exploration phases of their offshore oil and gas installations, with each of whom we are pre-qualified to work. We have established strong, trusted and long-term relationships with our customers as a result of our strong historical operational and safety track record, differentiated and flexible fleet and overall commitment to superior customer service. As a result, seven out of our eleven customers have executed two or more contracts with us. We believe this track record with our customers is a testament to the strength of our customer relationships and the high quality of service that we provide. Extending our current contracts or entering into new contracts with existing customers benefits both us and our customers. From the customer s perspective, the ASV is readily available on the work site, there is no mobilization cost associated with the new contract or customer extension option and there is a high level of comfort that the ASV will fit their requirements and that we are familiar with their policies and procedures, all of which give us a competitive advantage when we tender for the renewal of contracts or when a customer has a contract extension option. From our perspective, the ASV downtime is reduced, therefore increasing our fleet utilization rate. 18
19 Resilient EBITDA margins and strong free cash flow generation We have realized EBITDA margins of 52.6% and 46.9% for the years ended December 31, 2010 and 2011, respectively, and 66.0% for the year ended December 31, We believe we are able to achieve these EBITDA margins given the favorable supply and demand dynamics in the ASV sector combined with our low operating cost base. Our EBITDA margins have also translated into significant free cash flow generation given (i) the controlled maintenance capital expenditure required in order to keep our fleet operating and certified and (ii) the low tax rates to which we have historically been subject. The profitability and strong cash flow profile of the business allows us to both explore responsible fleet additions through retrofits / conversions or new builds and be patient in negotiations for future contracts to optimize terms. Diverse, well-maintained, certified and valuable fleet We believe our fleet of jack-up ASVs is well-suited to our focus regions that are MENA and Asia- Pacific. In comparison with our competitors, we have (i) a more diverse fleet capable of accommodating a broader range of PoB (126 to 500) and working in greater water depths (131 to 350 feet), (ii) a more diverse offering of ancillary services (e.g. higher crane lift capacity, larger deck areas and more client workshops) and (iii) a mix of self-propelled and non self-propelled jack-up ASVs, all of which differentiate us when tendering for contracts. Specifically, we also have the deepest water depth jack-up ASV globally (Burj, currently in the Asia-Pacific region) and the largest PoB capacity jack-up ASV in the MENA and Asia-Pacific regions (Deema, currently in the MENA region), according to the IHS Report. In addition, we have a strong focus on maintaining our fleet to internationally-recognized certification standards. All of our ASVs are certified by Det Norske Veritas ( DNV ), which we believe to be widely recognized as the highest international standard for vessel certification. DNV performs annual, intermediate and five-year inspections on each of our ASVs. We have also made significant investments during the past three years to differentiate and upgrade our fleet and tailor ASV specifications to better meet customer demands. This has involved equipment purchases and upgrades that allow us to offer more value-added services to customers. Market-leading health and safety track record Given that a primary focus in the offshore industry is health and safety, we believe that customers carefully evaluate the health and safety track record of our fleet when deciding on an ASV operator, particularly as in many cases over 100 workers can be living on board an ASV. We strive to ensure a safe environment on board our ASVs, and have implemented extensive procedures and protocols to be followed on each ASV, including the daily review of safety performance reports by the operations manager. Compared to drilling rigs, from which many jack-up ASVs are converted, ASVs have fewer moving parts and therefore have lower operational and health and safety risks. We have built a very strong health and safety track record. From 2009 through 2012, we completed 6,515 days of uninterrupted charter hire, with zero downtime for our ASVs while on contract and only one lost time incident ( LTI ) in over ten million man hours of operation. The electrical fault on Burj in January 2013 resulted in downtime, but this incident was not health and safety related, and no one was injured as a result. We achieved ISO 9001 accreditation in December 2012, and are aiming to achieve ISO accreditation in ISO 9001 (Quality Management) and ISO (Environmental Management) are quality and environmental management standards, respectively, that demonstrate a company s efforts in ensuring high product quality standards and enduring compliance with environmental laws and regulations. These standards are published by the International Organization for Standardization ( ISO ), and accreditation under these standards involves certification by third party certification bodies, which provide independent confirmation that an organization meets the requirements of the relevant ISO standards. This third party 19
20 certification process ensures independent and transparent confirmation that we meet or exceed the requirements of the relevant ISO standards. We believe that using an internationally recognized set of standards is likely to assist us during the pre-qualification and initial tendering processes, and that both ISO 9001 and ISO are accreditations that may help differentiate us from our competitors who are not accredited during contract tendering processes. They show current and potential customers that we have been assessed and audited by a third party certification body, and either meet or exceed the relevant ISO standards. We believe that our MARPOL 73/78 compliance, together with our DNV audits, demonstrate that we have a certified safety management system on board our ASVs, and that together with ISO 9001 and ISO 14001, evidence that we take our health, safety, quality and environment obligations very seriously. Experienced management team with significant sector expertise Our management team has extensive experience in the oil and gas industry, with an average of 19 years of experience in the oilfield services sector and a total of 74 years in the oil and gas industry, of which 33 years are in the MENA region. We believe that, over the last five years, our management has developed relationships with all of the main users of ASVs in the MENA region, and we are in the process of developing similarly beneficial relationships in the Asia-Pacific region. In addition, our management team has significantly grown the business since inception by increasing our revenue, EBITDA, EBITDA margin, day rates, fleet utilization rate and backlog, and has successfully expanded operations into the Asia-Pacific region. Strategy We aim to continue to be a leading provider of jack-up ASVs in the MENA region and to become a leading provider of jack-up ASVs in the Asia-Pacific region. We intend to employ the following strategies to achieve our goal: Continue to deliver high-quality customer service and maintain a strong health and safety record We believe that our high-quality customer service and our strong health and safety track record are key factors driving our ability to win repeat business and contract extensions from our customers. We are focused on continuing to strengthen our customer relationships by (i) maintaining the current high quality of our service when operating our ASVs and (ii) maintaining our strong health and safety track record. Continue to maintain active dialog with potential future customers and build revenue backlog with a contract portfolio that balances revenue visibility with optimal fleet utilization Our goal is to keep all of our ASVs fully utilized at attractive day rates. We aim to strike an optimal balance between long-term contracts for most of our ASVs, which provide visibility on cash flows at preagreed day rates, and short to medium-term contracts for one or two of our ASVs, which provide us with flexibility to capitalize on current market conditions with opportunistic work at potentially higher day rates. We believe that this strategy enables us to maintain high fleet utilization rates while maintaining our EBITDA margins. Maintain our existing fleet to best-in-class international standards and continue to reinvest in our ASVs to maintain a differentiated fleet and meet customer requests We intend to continue to invest management and financial resources to maintain our fleet to the internationally recognized and best-in-class DNV standards. All six of our ASVs are currently certified by DNV and undergo extensive third-party inspections including a thorough five-year special survey, intermediate surveys and an annual survey. Additionally, we have re-invested considerable capital from our own balance sheet since inception to upgrade our fleet and tailor ASV specifications to better meet customer demands. This has involved equipment purchases and upgrades that further differentiate our fleet from the 20
21 competition and allow us to offer more value-added services to customers. We intend to continue to reinvest capital as necessary to maintain a differentiated fleet, which we believe enables us to access a broader range of contracts and markets than our direct competitors. Expand geographic presence by capitalizing on contract duration and pricing power in the Asia-Pacific region and identifying new ASV opportunities We plan to bolster our entry into the Asia-Pacific region by bidding on additional available contracts. Since the beginning of 2012, we have witnessed strong activity in the Asia-Pacific region, with expressions of interest for contracts with a total value of over $400 million and we plan to leverage the corporate structure we have established in Singapore and Australia/Timor, build on the customer relationships we have developed and continue to develop our ability to win contracts in the Asia-Pacific region. Our expansion into the Asia-Pacific region will be opportunistic. We are actively working to identify further potential new contracts in the Asia-Pacific region which provide attractive opportunities to either redeploy ASVs from our existing fleet in the MENA region and maximize our day rates or, alternatively, build or convert new ASVs, as we did with Burj, which we marketed in the Asia-Pacific region and contracted with ConocoPhillips. Maintain a robust and scalable corporate structure while controlling costs We believe we have one of the lowest operating and overhead cost structures in the offshore oil and gas services industry. We have historically kept our corporate overhead and operating costs low by standardizing equipment, vendors and service providers across our fleet and the regions in which we operate, undertaking detailed preventive maintenance programs and centralizing our procurement function. All our support services are centralized in our headquarters in Ajman, which enables us to control and minimize costs. In addition, our purpose-built yard, workshop and storage area in Ajman, is strategically located in close proximity to the Hamriyah Port in Sharjah (UAE) to reduce costs related to normal repairs as well as costs associated with annual, intermediate and special surveys of our ASVs. Our strategy is to continue to pursue initiatives to minimize operating costs and overhead. Material Recent Developments Senior Secured Notes On February 14, 2013, Millennium Offshore Services Superholdings, LLC (the Issuer ) issued $225 million aggregate principal amount of its 9½% Senior Secured Notes due 2018 (the Notes ). The Notes are senior obligations of the Issuer and are guaranteed on a senior basis by all of the Issuer s material subsidiaries. The Notes and the guarantees thereof are secured by first-ranking security over substantially all of the Issuer s material assets. See Description of Certain Financing Arrangements Material Debt Instruments Senior Secured Notes. Revolving Credit Facility On February 26, 2013, we entered into a new $15 million super senior revolving credit facility with ABN AMRO Bank N.V. (the Revolving Credit Facility ). The Revolving Credit Facility is guaranteed by the Issuer and the subsidiaries of the Issuer that guarantee the Notes, and benefits from security over the same collateral that secures the Notes. See Description of Certain Financing Arrangements Material Debt Instruments Revolving Credit Facility. Proceeds from any enforcement action against the collateral securing the Notes and the Revolving Credit Facility will be applied as described in the intercreditor agreement (the Intercreditor Agreement ) described under Description of Certain Financing Arrangements Material Debt Instruments Intercreditor Agreement. 21
22 Burj Electrical Fault On January 27, 2013, we experienced an electrical fault on Burj related to its auxiliary power system which resulted in a shut-down of power on the ASV. The Burj returned to full operating status on February 17, 2013 in line with our expectations. There were no injuries or structural damage related to the event and our crew and client personnel have returned to the ASV. Although Burj was still contracted, the daily charter rate under our contract during this downtime period was zero. The downtime therefore resulted in lost contracted revenue and additional operating expenditures which were not covered by insurance. The amount of downtime and losses resulting from this event are not expected to be material to our results of operations. Marinia Contract Extension On January 27, 2013, Oxy formally exercised the two one-year extension options under its current contract for Marinia, extending the fixed term of the contract from March 2013 to March New Business Wins Total ABK/Trident One On 21 st February, 2013, we signed a charter contract with Total ABK to enter into an additional two year contract for Trident One. The contract start date is July 1, 2013, following the conclusion of Total ABK s existing charter for Trident One. NOC/Deema On 3 rd February, 2013, we signed a contract from an NOC in respect of Deema, for a 161 day fixed term contract. The contract has a start date of February 16, OFFICERS The following table sets forth the name, age and position (at Millennium Offshore Services, LLC) of our officers, followed by a short description of each officer s business experience, education and activities. Name Age Position Robert Duncan 41 Managing Director Anthony Lawson 46 Operations Director Erlend Johnston 35 Financial Director Ian McInnes 52 Technical Manager Robert Duncan has been the Managing Director of Millennium Offshore Services, LLC since September 2011, and is our President. He joined Millennium Offshore Services, LLC in December 2007 as the Financial Director. Mr. Duncan is the former Regional Financial Controller for PSL Energy Services, where his primary responsibility was setting up, developing and managing the finance functions in both the Middle East and Caspian Regions. He also served as Lead Accountant at KBR Production Services, and he previously held various roles as Financial Controller, Management Accountant and Financial Accountant in the U.K. Mr. Duncan is a U.K. Chartered Accountant, Member of the Institute of Chartered Accountants Scotland (ICAS) and Member of the Chartered Institute of Public Finance and Accountancy (CPFA) in the U.K. 22
23 Anthony Lawson serves as the Operations Director of Millennium Offshore Services, LLC, having joined at the company s inception in June He is the Former Commissioning Manager for QGM Group in Sharjah. There, he was responsible for managing the maintenance and repair of all shipyard equipment and mechanical commissioning of various jack-up rigs. He also served as Chief Engineer at Mansal Offshore and has held various engineering posts, both on and offshore throughout Africa, Asia and the Middle East. Mr. Lawson is a certified Offshore Installation Manager (OIM), Jacking Technician and Crane Operator. Erlend Johnston has served as the Financial Director of Millennium Offshore Services, LLC since September 2011, and is our Secretary and Treasurer. He previously served as the Regional Financial Controller for EnerMech, where his primary responsibility was managing all elements of the finance function, compliance, developing the finance team and setting up companies across the Caspian and Middle East regions. He also worked as Group Financial Controller at PSL Energy Services. He was responsible for managing the U.K. finance function, group reporting and also integration of the PSL finance systems and processes following acquisition by Halliburton in Mr. Johnston is a former Enterprise Risk Services Manager at Deloitte. Mr. Johnston is a U.K. Chartered Accountant and Member of the Chartered Accountants of Scotland (ICAS). Ian McInnes serves as the Technical Manager of Millennium Offshore Services, LLC, having joined the company in July He previously served as a Mechanical Superintendent for Lamprell Energy Limited UAE, overseeing mechanical projects, rig commissioning and all yard maintenance at Lamprell s Sharjah and Hamriyah FZE yards. He also worked as Chief Mechanic for Ensco Drilling and Nabors Drilling, where he was responsible for rig maintenance and commissioning of well-heads and flow lines. Mr. McInnes has also served as the former Commissioning Engineer at J Ray McDermott Indonesia, where he supervised the fabrication, installation, hook-up and commissioning of a wide range of mechanical systems for various onshore and offshore oil and gas projects. BOARD OF DIRECTORS The following table sets forth the name, age and position of the members of the Issuer s Board of Directors. Name Age Position Affiliation Anthony J. Gordon 50 Director Och-Ziff Richard E. Lyon III 46 Director Och-Ziff Mike Mullen 63 Director MMEER Chris Nehls 50 Director MMEER Michael J. Jabon 29 Director Och-Ziff PRINCIPAL SHAREHOLDERS Millennium Offshore Services Superholdings, LLC is wholly-owned by Millennium Offshore Services, LLC. Investment funds affiliated with Och-Ziff Capital Management Group, LLC ( Och-Ziff ) own 60% of the limited liability company interests in Millennium Offshore Services, LLC. The remaining 40% of the limited liability company interests in Millennium Offshore Services, LLC is owned by an affiliate of Mike Mullen Energy Equipment Resources ( MMEER ). Och-Ziff, headquartered in New York, is a leading global institutional alternative asset management firm with approximately $34.9 billion of assets under management as of April 1, MMEER, based in Dallas, is a global investor focused on the oilfield services sector, and has purchased offshore rig-related assets with a total cost of acquisition of over $1 billion. 23
24 RISK FACTORS Risks Related to Our Business and Industry Our future business performance depends on our ability to win new and favorable contracts for our ASVs and on the exercise by our customers of their extension options on existing contracts. In the ASV industry, companies such as ours participate in tender processes to win new contracts. We participate in a number of new contract tenders each year and the tender process often requires significant management time. It is generally difficult to predict whether we will be awarded new contracts as these are all competitive tendering processes. The tenders for new contracts as well as contract renewals where we are the incumbent ASV provider are affected by a number of factors beyond our control, such as market conditions, competitive dynamics, financing arrangements and governmental approvals required of our customers. If we are not selected or if the contracts we enter into are delayed, our work flow may be interrupted and our business, financial condition or results of operations may be adversely affected. Our contracts normally include two types of terms: (i) a fixed term; and (ii) customer extension options that are exercisable at the discretion of the customer. The extension options do not represent guaranteed commitments from our customers. If a customer decides not to exercise its extension option(s), then we will need to secure a new contract in connection with that ASV, which could lead to that ASV being off-hire for some time. As of the date of this Annual Report, we have two contracts the fixed terms of which expire within twelve months. This includes our contract for Trident One, which expires on June 30, However, the expiry of the current contract for Trident One we have been awarded and signed a 2 year follow on contract commencing July 1, 2013 described in Summary Recent Developments New Business Wins Total ABK/Trident One. In addition, we expect that our new business win for Deema will expire in mid Our ability to renew existing contracts or sign new contracts will largely depend on the prevailing market conditions. If we are unable to sign new contracts that start immediately after the end of our current contracts, or if new contracts are entered into at day rates substantially below the existing day rates or on terms otherwise less favorable compared to existing contract terms our business, financial condition or results of operations may be adversely affected. Our ASV rental contracts are terminable by our customers on varying notice periods. While our contracts are typically long-term in nature, all of our contracts provide the customer with a right for early termination with notice periods typically ranging from 30 to 60 days, although some notice periods have been significantly shorter and one current contract has a notice period of 180 days. In such circumstances, we generally do not have the right to receive compensation in respect of such early termination other than payment in lieu of the notice period and any demobilization payment that is typically included in the contract. In December 2009, following a short consultation period with us, a customer cancelled its contract with us nine months prior to the end date of the contract. We believe that the contract was cancelled because the budget for the customer s underlying project was not approved by the country financing the project due to adverse global economic conditions. A new contract in connection with the same project was subsequently secured once the budget was approved in February 2011, 14 months after the cancellation of the previous contract. The delay in obtaining this new contract contributed to the ASV being off-hire for all of If our customers cancel or seek to renegotiate our contracts and we are unable to secure new contracts on similar terms, or if there is a substantial period of time between the cancellation of one contract and the award of a new contract, it could adversely affect our business, financial condition or results of operations. 24
25 A number of events may impact our ability to realize our backlog, and backlog may not be an accurate indicator of our future results. As of December 31, 2012, our backlog under our fixed term contracts was $225.1 million and our backlog in respect of customer extension options totaled $91.5 million, together totaling $316.6 million (including new contract wins for Trident One and Deema). Our backlog reflects the estimated future revenue attributable to the remaining term of existing fixed term contracts and customer extension options across all of our ASVs. For a description of how we calculate backlog, see Management s Discussion and Analysis of Financial Condition and Results of Operations The amount of our backlog does not necessarily indicate future earnings as the backlog may be adjusted up or down depending on any early cancellation of contracts, failure to exercise customer extension options, changes to the scope of work and changes to the applicable day rate. In addition, the actual PoB over the life of a contract may be lower than the estimated average PoB that we used in calculating the backlog. We also may not be able to perform under contracts in our backlog. For example, we recently experienced an electrical fault on Burj and as a result experienced downtime during which the daily charter rate under our contract was zero. See Material Recent Developments Burj Electrical Fault. Furthermore, our customers may seek to terminate or renegotiate our contracts for lower day rates for various reasons due to events beyond our control. All of our contracts provide the customer with a right for early termination within the contractual notice period, and we generally do not have the right to receive compensation in respect of such early termination other than payment in lieu of the notice period and any demobilization payment that is typically included in the contract. If a customer cancels an existing contract such termination would reduce our backlog. In December 2009, following a short consultation period with us, a customer cancelled its contract with us, nine months prior to the end date of the contract. You should exercise caution in comparing backlog as reported by us to backlog of other companies as it is a measure that is not required by, or presented in accordance with, IFRS. Other companies may calculate backlog differently than we do because backlog and similar measures are used by different companies for differing purposes and on the basis of differing assumptions and are often calculated in ways that reflect the circumstances of those companies. Demand for our ASVs is linked to the level of activity of the oil and gas industry, which may be influenced by a sustained decline in oil and gas prices. We depend on our customers willingness and ability to fund operating and capital expenditures to explore, develop and produce oil and gas, maintain infrastructure and to pay for accommodation services in relation to their operations. Demand for our ASVs is dependent on NOCs, IOCs and EPIC companies commissioning, constructing, inspecting, maintaining, repairing and decommissioning offshore production platforms and processing and storage facilities and on the need for additional offshore accommodation to support a workforce that cannot be accommodated on an installation s own facilities. Lower expenditure by the oil and gas industry may result in fewer offshore production platforms and processing and storage facilities being utilized as well as lower levels of maintenance performed on existing platforms and facilities, and, accordingly, lower demand for our services. Such a reduction in demand for our ASVs could materially reduce our fleet utilization rate and day rates and consequently directly impact our revenue and profitability. Long-term oil and gas prices are affected by numerous factors, including: (i) the demand for energy, which is affected by worldwide population growth and general economic and business conditions; (ii) the level of worldwide oil exploration and production activity; (iii) the policies of various governments regarding exploration and development of their oil and gas reserves; (iv) the cost of exploring for, producing and delivering oil and gas; (v) political and economic uncertainty and socio-political unrest; (vi) the availability of pipeline, storage and refining capacity; (vii) advances in exploration, development and production technology; (viii) technological advances affecting energy consumption; and (ix) other factors that could decrease the demand for oil and gas, including taxes on oil and gas, pricing activities undertaken by the Organization of the Petroleum Exporting Countries and alternative fuels. For example, the oilfield services 25
26 industry, including the ASV market, experienced a downturn during 2010 and 2011, as global economic conditions deteriorated, which negatively impacted oil prices resulting in a number of capital projects being deferred or delayed. A substantial and extended decline in oil or gas prices would be likely to cause a significant decline in the level of activity in the oil and gas industry. This reduction of activity could lead to a decline in the demand for our ASVs and therefore a reduction in our fleet utilization rate and/or downward price pressure on the day rates we are able to achieve for our ASVs, which could have an adverse effect on our business, financial condition or results of operations. We are limited in relation to the contracts for which we can tender. As our fleet of ASVs consists entirely of jack-up ASVs, we are limited in relation to the contracts for which we can tender. For example, our jack-up ASVs are only able to operate in depths of less than 400 feet, so we cannot participate in tenders where the water in which the customer s installation is located is deeper than that. In addition, it may be more difficult for us to secure contracts for those of our ASVs which are more specialized, i.e. operate in deeper water and have greater PoB capacity, as these ASVs command higher day rates and are less attractive to customers on projects that have lower PoB or shallower water depth requirements and where more commoditized ASVs, contracted at lower day rates, would suffice. We rely on a small number of customers and ASVs. Due to the size of our fleet, our business is subject to the risks associated with having a limited number of customers for our services at any point in time. For the twelve months ended December 31, 2012, six customers accounted for 100% of our revenue and our top customer accounted for 38% of our revenue. In addition, as of December 31, 2012, six customers accounted for 100% of our backlog of fixed term contracts and customer extension options. Our business, financial condition or results of operations could be adversely affected if any of our customers fail to compensate us for our services, terminate our contracts, fail to exercise their extension options or fail to renew their existing contracts and we are unable to enter into contracts with new customers at similar day rates. In the event that our customers, who are in general large NOCs, IOCs and EPIC companies, change the scope or schedule of their projects, we may face the risk of delays in revenues, unanticipated costs or discounted day rates to the extent we enter into amendments to our contracts to accommodate our customers. As we operate a fleet of only six ASVs, the loss of a single ASV contract or a delay in signing a new contract for one of our ASVs, as well as damage to a single ASV, could lead to a significant reduction in our fleet utilization rate and revenues, and can result in significant volatility in our results of operations. For example, we lost contracted revenue when Deema experienced a fire while in the shipyard in August 2009 and subsequently underwent an upgrade and remediation program during the remainder of 2009, and due to the late arrival of Ahmed to its contracted position and the subsequent adverse weather in June We act as a subcontractor under some of our contracts. In some instances, we enter into contracts with our customers indirectly as subcontractors. Generally this occurs when the end customer is based in a country where we do not have a presence yet the end customer requires that the entity with which it contracts is based in the same jurisdiction. In these cases, we enter into a contract with an intermediary whereby we act as subcontractor in a back to back arrangement with the end customer. In the event that the intermediary becomes unable to fulfill its obligations under its contract with the end customer, regardless of whether we have fulfilled our obligations under the subcontract, the end customer may elect to terminate the contract and re-tender for the project. We may not be successful in any such retender process. 26
27 Time and cost overruns associated with mobilization and demobilization may be material to our business. The ASV market is by nature a global market as ASVs may be mobilized from one area to another. We operate in the MENA and Asia-Pacific regions and currently have five ASVs in the MENA region and one ASV in the Asia-Pacific region. Under our contracts with our customers, we are required to mobilize our ASVs to our customers installations at the start of the contract, and demobilize our ASVs away from the installation at the end of the contract. The mobilization and demobilization of our ASVs to and from our customers installations can be time consuming, particularly if an ASV is travelling a long distance. Mobilization and demobilization also involve significant costs and are impacted by several factors including, but not limited to, governmental regulation and customs practices, the availability of third party-owned and operated tugs and Heavy Lift Vessels ( HLV ) for transporting the ASVs, weather conditions, political instability, civil unrest and military actions. Our contracts contain mobilization and demobilization fees pursuant to which we pass on the costs of mobilization and demobilization to our customers. However, events beyond our control may delay our ability to mobilize or demobilize our ASVs, leading to time and cost overruns for which our customers may not be liable. For example, Ahmed was contracted to commence work on a new contract on June 1, 2011, but due to the late arrival of the HLV that was scheduled to carry it, Ahmed arrived late to the customer s float off location, and due to continued adverse weather was unable to be removed from the HLV until August 2011 and subsequently did not go on-hire until September 4, This resulted in lost contracted revenue, additional mobilization costs and the payment of liquidated damages to our customer, and reduced fleet utilization rates over the period from June 1, 2011 to September 4, The total 2011 EBITDA impact of the Ahmed delay was estimated by management to be approximately $6.5 million. We face competition from various vessel types and any increased supply of ASVs may lead to a reduction in our day rates and may materially impact our profitability. The ASV market is highly fragmented with approximately 60 companies operating the 138 ASVs active in the sector, according to an IHS report as of October We operate in the jack-up ASV market, which comprises 51 jack-up ASVs operated by 18 companies, with the majority of these ASVs located in the MENA and North Sea regions. In addition to competition from jack-up ASVs, we also face competition from operators of barge and monohull ASVs. The barge ASV market is very fragmented, with 34 companies operating mainly in the West Africa and Asia-Pacific regions, and is very competitive both in terms of pricing and accessibility given the comparatively low capital costs involved in acquiring and operating an accommodation barge. The monohull ASV market is the smallest among the ASV sub-markets with five players operating a total of five ASVs spread over South America, Europe, West Africa and Asia-Pacific. For more information, see Industry Overview. Additionally, other vessels including jack-up drilling rigs, diving support vessels, pipe laying barges and liftboats could also enter the ASV segment depending on market condition and dynamics in their respective segments. Industry players may increase the supply of jack-up ASVs by converting currently available drilling rigs to jack-up ASVs and/or constructing new jack-up ASVs, which could result in increased competition. This could lead to a downward price pressure on the day rates we are able to achieve for our ASVs and/or a reduction in our fleet utilization rate, which could have an adverse effect on our business, financial condition or results of operations. In addition, prolonged periods of low fleet utilization and lower day rates could also result in the recognition of impairment charges on our ASVs if future cash flow estimates, based upon information available to management at the time, indicate that the carrying value of these ASVs may not be recoverable. Our operating and maintenance costs will not necessarily fluctuate in proportion to changes in operating revenues and operating and maintenance costs on older vessels may not be economically viable. Our revenues may fluctuate as a function of changes in the supply of ASVs and demand for offshore accommodation services linked to the oil and gas industry. However, our operating costs are generally related to the number of ASVs in operation and the location of those ASVs. We may also be subject to certain 27
28 operating costs related to ASVs even when they are off-hire. For example, we have in the past maintained, and may in the future maintain, a core crew on our ASVs when they are off-hire so that they can be mobilized quickly and at a lower cost when they are contracted. This results in the incurrence of crew costs even when an ASV is off-hire. In addition, when an ASV faces long idle periods, reductions in costs may not be immediate, as maintenance on the ASV may still be required. In addition, four of our six ASVs have core structures that were built over 30 years ago ( original build age ). The capital required to repair, maintain and upgrade our fleet of ASVs may fluctuate, and generally increases with age. We may not be able to maintain our fleet by extending the economic life of existing ASVs and, as our ASVs continue to age, there may come a point at which the costs of maintenance and upgrades are no longer economically viable. Delay or inability to obtain appropriate certifications for our ASVs may result in us being unable to win new contracts and fulfill our obligations under our existing contracts. Our customers require that our ASVs are inspected and certified by a recognized independent third party in order for us to be able to participate in tenders for their projects. In addition, we are required under our contracts with our customers to maintain such certifications. Each of our ASVs is certified by DNV. The DNV certification process generally involves three types of inspections. The first occurs on an annual basis, the second intermediate survey occurs every two and a half years, and is more detailed than the annual inspection, and the third special survey takes place every five years and is a more detailed inspection of all major components of the ASV, usually undertaken while the vessel is in the dry-dock. The last five year survey was done in January 2012 for Burj, December 2010 for Ahmed, February 2010 for Deema, July 2009 for Trident One, March 2010 for Marinia and May 2008 for Leen. If we are unable to maintain or obtain these certifications, we may be unable to service our customers under our existing contracts and may not be eligible to participate in future tenders, which could have an adverse effect on our business, financial condition or results of operations. The age of our fleet may restrict us from doing business with certain customers. Certain of our existing and potential customers have policies regarding the minimum acceptable original build age of ASVs for use on their projects. Four of our six ASVs have original build ages of over 30 years, and such policies may preclude us from participating in tenders for new contracts at all or without producing third party feasibility studies of our ASVs. For example, we have one customer in Abu Dhabi for which we are required to produce feasibility studies of our ASVs before we can participate in tenders for its contracts. We cannot predict how or whether our customers policies towards ASV original build age may change or whether the jurisdictions in which we operate may introduce regulation regarding minimum ASV original build ages. Any trend towards restricting the operation of ASVs with older original build ages, either from our customers or under the regulations in the jurisdictions in which we operate, could have an adverse effect on our business, financial condition or results of operations, particularly as our ASVs continue to age. Delays or cost overruns in the construction of new ASVs or the conversion of drilling rigs into ASVs could adversely affect our business, financial condition or results of operations. The construction of a new ASV and the acquisition and subsequent conversion of a drilling rig into an ASV both require significant lead time, typically between six to twelve months for conversions and 24 months for new-builds, and also require significant expertise and management resources, given the specifications required by customers in the industry. Such projects are subject to risks of delay and cost overruns inherent in any large construction project, including costs or delays resulting from the following: shipyard availability; unexpected delays in delivery times for, or shortages of, key equipment, parts and materials; shortages of skilled labor and other shipyard personnel necessary to perform the work; 28
29 shortages or unforeseen increases in the cost of equipment, labor and raw materials; unforeseen design and engineering problems, including those relating to the commissioning of newly designed equipment; unanticipated change orders; work stoppages and labor disputes; delays in, or inability to obtain, access to financing; failure or delay of third-party service providers; disputes with shipyards and suppliers; delays and unexpected costs of incorporating parts and materials needed for the completion of projects; financial or other difficulties at shipyards and suppliers; adverse weather conditions; and defective construction and the resultant need for remedial work. We would generally invest in new ASV construction or conversion before we bid for contracts for a new ASV. However, we may sign a contract in respect of a new ASV prior to its construction or conversion being fully completed. Any delay in completing an ASV construction or conversion project may delay our ability to tender for contracts for that ASV or, where we have a customer contract in place, may delay our ability to service such contract, which could have an adverse effect on our reputation and on our business, financial condition or results of operations. Should we commit to construct a new ASV or acquire a drilling rig and convert it into a new ASV, there is no guarantee that we will be awarded new contracts for such ASV, as the award of new contracts is affected by a number of factors beyond our control. We depend on contractors and subcontractors for a number of services, and their unavailability or failure to perform to a high standard may result in delays or interruptions to the services that we provide to our customers. We rely on contractors and subcontractors in connection with each of our ASVs. In particular, we subcontract out the construction or conversion of our ASVs, survey, upgrade and maintenance work on our ASVs, messing and accommodation services provided on our ASVs, and the mobilization and demobilization of ASVs via tugs, warranty services, rig movers and HLVs, among others. There are a limited number of shipyards in close proximity to the areas in which our ASVs operate that have the facilities and capability to perform the construction, conversion, survey, upgrade and other maintenance work that we require. Historically, we have used the shipyard of Lamprell Energy Ltd. ( Lamprell ), which provides construction services for us in connection with our ASV maintenance, survey, upgrade and construction or conversion requirements. Were we unable to use Lamprell s facilities, we may have to transport our ASVs further distances in order to complete our survey, upgrade and maintenance requirements, which would have a negative impact on our fleet utilization rate due to the additional transport time required, and would lead to increased costs associated with upgrading and maintaining our fleet and maintaining our DNV certifications. The crew on a contracted ASV tends to include a mix of our own employees and subcontractor employees. Failure of contractors and subcontractors to adhere to schedule and work in accordance with our quality standards, or failure of suppliers to deliver on time could negatively affect the quality of service on our ASVs. The ability of contractors and subcontractors to perform their obligations is subject to numerous factors beyond our control, such as their ability to hire adequate labor and to otherwise manage their own businesses efficiently. We have the ultimate responsibility for the required standard of service on our ASVs and a failure 29
30 to maintain a consistent standard of quality may lead to difficulties in marketing our services and damage to our reputation, rescission or termination of project contracts and increased liabilities to customers. We have significant international operations in countries which may be susceptible to political, social and economic instability. Our international operations may be susceptible to political, social and economic instability, civil disturbances, wars, hostilities between nations, terrorism, piracy or similar events, which may lead to: disruption to operations, including strikes, civil actions or political interference; increasing security threats for our personnel and ASVs; deterioration of customer relationships due to local political pressure as governments seek greater control over their oil and gas industries; or difficulties in collecting accounts receivable and longer collection times than in more developed markets. Any of the above factors could result in disruptions to our business, increased costs or reduced future growth. We have historically and expect to continue to do business in Egypt. Terrorist attacks, piracy and the current conflicts in Egypt and other countries in which we operate, and other current and future conflicts, may adversely affect our business, operating results, financial condition, ability to raise capital and future growth. Continuing hostilities in the Middle East may lead to additional armed conflicts or to further acts of terrorism and civil disturbance, which may contribute to further economic instability and disruption of oil production and distribution, which could result in reduced demand for our services. In addition, terrorist attacks, war, piracy, social unrest or other events beyond our control that adversely affect the production of oil and gas could lead to increased volatility in prices for oil and gas and could affect the market for ASVs and/or result in lower day rates. Such events could also lead our customers to terminate our contracts, which could have an adverse effect on our business, financial condition or results of operations. Oil facilities, shipyards, vessels, pipelines and oil and natural gas fields could be targets of future terrorist attacks, and our ASVs and/or our customers installations could be targets of pirates or hijackers. Any such attacks could lead to, among other things, bodily injury or loss of life, vessel or other property damage and increased operational costs, including insurance costs. We may not be able to obtain insurance policies covering such risks, or such policies may only be available with premiums that are not commercially sustainable. Acts of terrorism, piracy and political and social unrest, brought about by world political events or otherwise, have caused instability in the world s financial and insurance markets in the past and may occur in the future. Such acts could be directed against companies such as ours. The occurrence of such acts could have an adverse effect on our business, financial condition or results of operations. Public health threats could have an adverse effect on our business. Public health threats, such as swine flu, bird flu, Severe Acute Respiratory Syndrome and other highly communicable diseases, outbreaks of which have already occurred in various parts of the world in which we operate, could adversely impact our operations, the operations of our customers and the global economy, including the worldwide demand for oil and gas and, ultimately, the level of demand for our services. In many cases, over 100 workers may be living on one of our ASVs, making the risks posed by communicable diseases particularly acute. Any public health threats on board one of our ASVs could lead to significant lost revenue and costs in connection with the treatment of such threats, including cleaning costs, increased insurance premiums and potential legal costs in relation to suits from those persons stationed on our ASVs. 30
31 Furthermore, public health threats could adversely affect our reputation and our ability to successfully win new contracts. In the offshore accommodation industry, there is a primary focus on health and safety and customers will evaluate the health and safety track record of a service provider in significant detail when deciding on an ASV operator. Our business involves numerous operating hazards, and our insurance may not be adequate to cover our losses. Our insurance is intended to cover normal risks in our current operations, including insurance for property damage, occupational injury and illness, loss of hire and certain third-party liability including pollution liability. Our insurance policies and contractual rights to indemnity may not adequately cover losses, and we may not have insurance coverage or rights to indemnity for all risks. For example, our loss of hire insurance only extends to fixed term contract periods and not customer extension options, only covers external events and does not extend to mechanic failures or breakdowns. As such, we are unable to claim under our insurance for the current downtime we experienced on Burj. See Material Recent Developments Burj Electrical Fault. In addition, we may experience increased costs for available insurance coverage as our fleet ages. Pollution and environmental risks generally are subject to significant deductibles and are not completely insurable. We could also experience a significant accident or other event resulting in damage to our ASVs, including, but not limited to, fire, severe weather, terrorist acts and piracy that may not be fully covered by insurance or a recoverable indemnity from a customer. Moreover, we may not be able to obtain insurance for certain risks or maintain adequate insurance at rates we consider reasonable. The occurrence of a loss or liability, for which we are not fully insured, could significantly reduce our revenues, cause us to pay fines or damages which are generally not insurable and that may have priority over payment obligations under our indebtedness or otherwise have an adverse effect on our business, financial condition or results of operations. Our ASV operations are subject to perils inherent in marine operations, including capsizing, grounding, collision and loss or damage from severe weather. In addition, damage to our ASVs caused by high winds, turbulent seas, or unstable sea bottom conditions could potentially force us to suspend operations for significant periods of time until the damages can be repaired. In particular, jack-up ASVs require good weather and low currents to be safely positioned on the seabed. As our ASVs are connected to the oil and gas properties of our customers, the occurrence of any damage to our customers properties caused by an accident on board our ASV, a machinery breakdown, abnormal operating condition or other hazard on our ASV or the failure of our subcontractors to perform services could result in severe damage to or destruction of our customers property and equipment, injury or death to our customers or our personnel and environmental damage or pollution. Further, our operations are subject to hazards inherent in activities related to the operation of oil and natural gas wells, such as oil spills, blowouts, reservoir damage, loss of production, loss of well control, punch through, craterings, fires and pollution. The occurrence of these events could result in claims from our customers, severe damage to or destruction of our property and equipment and injury or death to ASV personnel and environmental damage. We may also be subject to property, environmental and other damage claims by other businesses operating offshore and in coastal areas. The occurrence of any of these events could have an adverse effect on our business, financial condition or results of operations. We are directly or indirectly subject to complex laws and regulations, including health and safety and environmental regulations, that can adversely affect the cost, manner or feasibility of our operations. Our operations are directly or indirectly subject to a variety of complex laws, regulations and guidelines, in all jurisdictions in which we operate and in which our ASVs are registered, including laws and regulations relating to health and safety, the conduct of operations, taxation and the protection of the 31
32 environment. As of December 31, 2012, we operated in five countries and each ASV is registered in the Marshall Islands. We conduct our business within a strict regime of health and safety and environmental regulations, which exposes us to potential liabilities and significant compliance costs. The technical requirements of compliance with health and safety and environmental laws and regulations are becoming increasingly expensive, complex and stringent. We incur, and expect to continue to incur, capital and operating costs to comply with health and safety and environmental laws and regulations. We have also invested financial and management resources that aim to ensure compliance with such regulations and expect to continue to make appropriate investments in the future. It is impossible for us to predict the cost or impact of such laws and regulations on our future operations. Furthermore, failure to comply with health and safety and environmental laws and regulations could adversely affect our reputation and our ability to win new contracts. In the offshore accommodation industry, there is a particular focus on health and safety and customers will evaluate the health and safety track record of a service provider in significant detail when deciding on an ASV operator. In addition, governments in some foreign countries have been increasingly active in regulating and controlling the exploration for oil and gas and other aspects of the oil and gas industries in their countries. Many governments favor or effectively require that drilling contracts be awarded to local contractors or require foreign contractors to employ citizens of, or purchase supplies from, a particular jurisdiction. If these practices extend to ASV providers, it may result in inefficiencies or put us at a disadvantage when we bid for contracts against local competitors. We could be adversely affected by violations of applicable anti-corruption laws. We currently operate, and historically have operated, our ASVs in a number of countries throughout the world, mainly in developing economies. We are committed to doing business in accordance with all applicable laws and our own codes of ethics. We are subject, however, to the risk that we, our affiliated entities or our or their respective officers, directors, employees and agents may take actions determined to be in violation of such anti-corruption laws. Any such violations could result in substantial civil and criminal penalties, and would have a damaging effect on our reputation and business relationships. We may be subject to litigation, arbitration and other proceedings. We may be involved in litigation matters from time to time in the future. The operating hazards inherent in our business expose us to litigation, including but not limited to personal injury litigation, environmental litigation, contractual litigation with customers, tax litigation and maritime lawsuits, including the possible arrest of our ASVs. We cannot predict with certainty the outcome or effect of any claim or other litigation matter, or a combination of these. If we are involved in any future litigation, the costs associated with asserting our claims or defending such lawsuits, and the diversion of management s attention to these matters and the potential damage to our reputation could have an adverse effect on our business, financial condition or results of operations. The tax laws of the countries in which we operate or changes thereto or to our tax profile could result in a higher tax expense or a higher effective tax rate on our worldwide earnings. We conduct our operations through various subsidiaries in countries throughout the world. Tax laws, regulations and treaties can be complex and are subject to interpretation. Consequently, we are subject to changing tax laws, regulations and treaties in and between the countries in which we operate. Our income tax expense is based upon the tax laws in effect in various countries at the time that the expense was incurred. A change in these tax laws, regulations or treaties or in the interpretation thereof, or in the valuation of our deferred tax assets, which is beyond our control, could result in a materially higher tax expense or a higher effective tax rate on our worldwide earnings. Additionally, our expansion into new jurisdictions could adversely affect our tax profile and significantly increase our future cash tax payments. For example, due to 32
33 our expansion into the Asia-Pacific region in 2012, our tax profile has changed, as we are now subject to taxation in Singapore, Timor-Leste and Australia. Prior to 2012, the only jurisdictions in which our operations were subject to tax (other than withholding tax) were Qatar and Saudi Arabia, as operations in the UAE and Egypt were carried out in tax-free Free Zones. The ability to recruit, retain and develop qualified personnel is critical to our success and growth. Each ASV requires an operating team of 35 to 50 workers, the majority of which are skilled jobs that require a wide-ranging set of expertise, and include roles such as Offshore Installation Manager, Chief Officer, Chief Engineer and Chief Electrician. Hiring and retaining these workers takes significant time and expertise along with a sound understanding of regional labor dynamics. For us to successfully compete and grow, we must retain, recruit and develop the necessary personnel who can provide the required expertise across the entire spectrum of our business needs. However, the market for qualified personnel is competitive and we may not succeed in recruiting additional personnel, or may fail to effectively replace current personnel who depart, with qualified or effective successors. In addition, we may be unable to retain crew during periods when our ASVs are off-hire, and may be unable to re-hire the same crew members before the start of an ASV going on-hire on a new contract. Our effort to retain and develop personnel may also result in significant additional expenses, which could adversely affect our business, financial condition or results of operations. We are dependent on our senior personnel. We depend on the continued services of our senior personnel, including our directors and senior management. Our directors and senior management possess marketing, engineering, project management, and financial and administrative skills that are important to the operation of our business. Our ability to successfully conduct our business depends on the depth of experience of our senior management and directors and their customer relationships. The loss or an extended interruption in the services of our senior management or our directors, or the inability to attract or develop a new generation of senior management, could have an adverse effect on our business, financial condition or results of operations. Our significant debt obligations could limit our flexibility in managing our business and expose us to risks. Following the issuance of the Notes, we are highly leveraged and have significant debt service obligations. As of December 31, 2012, as adjusted to give effect to the Offering, we would have had approximately $225 million of indebtedness outstanding. In addition, we are permitted under the indenture governing the Notes (the Indenture ) to incur additional debt, subject to certain limitations. Our high degree of leverage may have important consequences to you. For example, it could: make it more difficult for us to satisfy our obligations under the Notes or other indebtedness, and if we fail to comply with these requirements, an event of default could result; require us to dedicate a substantial portion of our cash flow from operations to required payments on indebtedness, thereby reducing the availability of cash flow for working capital, capital expenditures and other general corporate activities; under covenants relating to our debt, restrict our ability to obtain additional financing for working capital, capital expenditures and other general corporate activities; under covenants relating to our debt, limit our flexibility in planning for, or reacting in planning for, or reacting to, changes in our business and the industry in which we operate; make us more vulnerable than our competitors to the impact of economic downturns and adverse developments in our business; expose us to interest rate increases on indebtedness that we may incur in the future, including under revolving credit facilities that we may enter into after the Issue Date; and 33
34 place us at a competitive disadvantage against any less leveraged competitors. The occurrence of any of these events could have a material adverse effect on our business, financial condition, results of operations, prospects and ability to satisfy our obligations under the Notes. In addition, the Indenture will, and future revolving credit facilities that we enter into may, contain certain restrictive covenants. These covenants will limit our ability to engage in certain activities that may be in our long term best interests. Our failure to comply with those covenants could result in an event of default under the Indenture which, if not cured or waived, could result in the acceleration of all of our indebtedness. PRESENTATION OF FINANCIAL AND OTHER INFORMATION Financial Information The financial statements presented herein are the consolidated financial statements and have been prepared in accordance with International Financial Reporting Standards ( IFRS ). All of the financial information in this annual report is presented in U.S. dollars, except as otherwise indicated. Non-IFRS Financial Measures In this annual report, we present certain financial measures and ratios, including EBITDA and other operating data, including backlog and fleet utilization rate, that are not presented in accordance with IFRS and which are not IFRS measures. As used in this annual report: EBITDA is defined as net profit for the applicable period before finance costs, income tax expense, unrealized gain/loss on fair valuation of interest rate swap, equity settled C-grant expense and depreciation of property and equipment. For purposes of our calculation of EBITDA, we do not have amortization of intangible assets in the periods being presented. EBITDA margin is defined as EBITDA divided by revenue. Adjusted net working capital is defined as inventory, trade and other receivables, trade and other payables, amounts due from a related party and amounts due to a related party, less certain insurance claim expenses and the balance under mortgage financing. Net debt is defined as total debt (bank borrowings plus deferred consideration in relation to the Burj acquisition plus the outstanding balance on the mortgage in favor of Lamprell Energy Ltd. in respect of the financing for the conversion of Burj (the Lamprell Mortgage ) less bank balances and cash. We present EBITDA because we believe that (i) it is a useful indicator of our ability to incur and service our indebtedness, (ii) it and similar measures are widely used in our industry as useful indicators or supplemental measures of operating performance and (iii) it can assist certain investors, security analysts and other interested parties in evaluating our operations and performance. EBITDA is not recognized terms under IFRS. Accordingly, it should not be used as indicator of, or alternative to, revenue, operating profit or operating profit margin or other comparable IFRS metrics, as a measure of operating performance, or of cash flow from operating activities as a measure of liquidity. Our presentation of EBITDA has limitations as an analytical tool, and you should not consider it in isolation, or as a substitute for analysis of our results reported under IFRS. In particular, you should not consider EBITDA as an alternative to: (a) operating profit or profit for the period (as determined in accordance with IFRS) as a measure of our operating performance; (b) cash flows from operating, investing and financing activities as a 34
35 measure of our ability to meet our cash needs; or (c) any other measure of performance under generally accepted accounting principles. The limitations of EBITDA as an analytical tool include: (i) EBITDA and does not reflect our cash expenditures or future requirements for capital expenditures or contractual commitments; (ii) EBITDA does not reflect changes in, or cash requirements for our working capital needs; (iii) EBITDA does not reflect the significant interest expense, or the cash requirements necessary, to service interest or principal payments on our debts; (iv) although depreciation and amortization are non-cash charges, the assets being depreciated and amortized will often need to be replaced in the future and EBITDA does not reflect any cash requirements that would be required for such replacements; and (v) some of the exceptional items that we eliminate in calculating EBITDA reflect cash payments that were made, or will be made in the future. Because our definition of EBITDA may differ from those used by other companies and industries, our presentation of this metrics may not be comparable to other similarly-titled measures used by other companies. Backlog and fleet utilization rate are not measurements of financial performance under IFRS and should not be considered as alternatives to other indicators of our operating performance, cash flows or any other measure of performance derived in accordance with IFRS. Our management believes that the presentation of backlog and fleet utilization rate is helpful to investors as a measure of our historical operating performance and ability to service debt, and also, in the case of backlog, as an indication of our future revenue. Backlog Our backlog reflects the estimated future revenue attributable to the remaining term of our existing fixed term contracts and customer extension options across all of our ASVs. We include new fixed term contracts and extension options in the calculation of our backlog only after we have entered into full contracts with the relevant counterparties. We assume that customer extension options will be exercised at the day rate under the contract. We consider backlog to be a key performance indicator of our business because it gives an indication of our future revenue. Our contracts normally include two types of terms, (i) a fixed term during which the customer commits to use the ASV and (ii) customer extension options that are exercisable at the discretion of the customer. We calculate backlog as the sum of the following for each ASV: (charter day rate x remaining days contracted) + ((estimated average PoB x daily messing rate) x remaining days contracted) + contracted remaining mobilization and demobilization fees We calculate backlog for both the fixed terms of our current contracts and the customer extension options set out in those contracts. The customer extension options do not represent guaranteed commitments from our customers, but they do represent a contractual arrangement with us, and we believe those arrangements provide a reasonable indication of our future activity. Our contracts can be terminated by our customers generally without penalty at notice periods typically ranging from 30 to 60 days, although some notice periods have been significantly shorter and one current contract has a notice period of 180 days, which can affect the usefulness of backlog as an indicator of future revenue. However, we have only experienced one early cancellation in our operating history, which occurred in December 2009 when one of our customers cancelled the Ahmed contract nine months prior to the contracted end date. Since 2007, 37 out of a total 41 customer extension options have been exercised which gives us a reasonable indication of the probability of future customer extension options included in the backlog being exercised. Changes in our backlog provide an early indication of future revenue and visibility of cashflows. Before the end of the fixed term contract, our management seeks to identify prospects for our ASVs based on 35
36 the expressions of interest, requests for quotation and invitations to tender we have received, and ongoing discussions with both existing and potential new customers. Overall market conditions and the competition dynamics in our markets have a direct impact on the number of contracts we have, their duration and the exercise of customer extension options, and therefore our backlog. While our backlog is a key performance indicator of our future business, it may be adjusted up or down depending on any early cancellation of contracts, failure to exercise customer extension options, changes to the scope of work, changes to the applicable day rate and differences between our estimated average PoB and actual PoB. In general, our customers are not required to commit to a minimum PoB, and the revenues that we eventually earn from messing and accommodation reflect the actual PoB. Fleet Utilization Fleet utilization rate is defined as the percentage of days of the year that an ASV is under contract and in respect of which a customer is paying a day rate for rental of the ASV. Fleet utilization rate is the average of the utilization rates for each of our ASVs. Certain Terms Used In this annual report, Issuer refers only to Millennium Offshore Services Superholdings, LLC and not any of its subsidiaries and the terms we, us, our, MOS and Group refer to the Issuer and its consolidated subsidiaries except where the context otherwise requires or as otherwise indicated. Forward Looking Statements This annual report contains forward looking statements within the meaning of the U.S. federal securities laws regarding future financial performance and results and other statements that are not historical facts. The words believe, anticipate, plan, expect, project, estimate, predict, intend, target, assume, may, could, will and similar expressions are intended to identify such forward looking statements. Such statements are made on the basis of assumptions and expectations that we believe to be reasonable as of the date of this annual report, but may prove to be erroneous. Such forward looking statements involve known and unknown risks and uncertainties and other factors which may cause our actual results, business, financial condition, results of operations, performance or achievements or industry results to be materially different from any future results, performance or achievements expressed or implied by such forward looking statements. Such factors include, among others, those more fully described in Risk Factors and elsewhere in this annual report. The risks and uncertainties we face going forward which could affect the accuracy of these forward looking statements include, but are not limited to: our ability to win new contracts and extend existing contracts on favorable terms; early termination of our ASV contracts by our customers on varying notice periods; changes to our backlog; sustained decreases in oil and gas prices, which may impact the level of activity in the oil and gas industry and demand for our ASVs; limitations on the contracts for which we can tender; our reliance on a small number of customers and ASVs; our status as subcontractor under some of our contracts; time and cost overruns associated with mobilization and demobilization; our ability to effectively compete in the event the supply of ASVs in the accommodation services industry increases or other vessel types enter the ASV market; fluctuations to our operating and maintenance costs that are not in proportion to changes in our operating revenue, and economic viability of continued maintenance of our ASVs as they age; delay or inability to obtain appropriate third party certifications for our ASVs; limitations on customers we can service and jurisdictions in which we can operate due to the age of our fleet; delays or cost overruns in the construction of new ASVs or the conversion of drilling rigs into ASVs; 36
37 our dependence on contractors and subcontractors for a number of services; adverse economic, social or political conditions in any of the several different countries in which we operate; the outbreak of communicable diseases or other public health threats in the regions in which we operate; the operating hazards associated with our business, and our ability to insure all potential losses, liabilities and damage related to our activities; the costs, liabilities and operational restrictions imposed by applicable law, including in the areas of health and safety and environmental protection; our ability to comply with anti-corruption laws; the outcome of any litigation or threatened litigation; the tax laws in the countries in which we operate or changes thereto or to our tax profile; our ability to recruit, retain and develop qualified personnel; and our dependence on our senior personnel. Should one or more of these risks or uncertainties materialize, or should any underlying assumptions prove incorrect, our actual results, business, financial condition, results of operations, performance or achievements or industry results may vary materially from those indicated. We therefore caution investors and prospective investors against relying on any of these forward looking statements. Except as required by law or regulation, we assume no obligation to update such forward looking statements or to update the reasons for which actual results could differ materially from those anticipated in such forward looking statements. 37
38 MANAGEMENT S DISCUSSION AND ANALYSIS OF FINANCIAL CONDITION AND RESULTS OF OPERATIONS The following discussion and analysis summarizes the significant factors affecting our results of operations and financial condition during the year ended December 31, This discussion contains certain forward-looking statements. Our actual results could differ materially from those discussed in the forward-looking statements. Factors that could cause or contribute to such differences include, but are not limited to, those discussed below and elsewhere in this annual report, particularly under Forward Looking Statements and Risk Factors. This discussion should be read in conjunction with Presentation of Financial and Other Information, Business Overview and the consolidated financial statements and related notes included elsewhere in this annual report. Note: the complete audited IFRS financial results for the year 2010 and 2011, including cash flow statements and the notes to the financial statements, are incorporated herein by reference, and available for public access on the company s corporate website under the investor relations section of the website. Results of Operations Year Ended December 31, 2012 Compared to Year Ended December 31, 2011 The following table sets forth our historical income statement data derived from the unaudited interim condensed consolidated financial statements of the Issuer for the years ended December 31, 2011 and 2012, as well as other financial data. Year ended December 31, (U.S. dollars in millions) % change Revenue % Rental of offshore accommodation units % Service income % Direct costs... (41.5) (54.8) 32% Staff costs... (7.0) (12.4) 77% Sub-contract charges... (4.3) (5.6) 30% Depreciation of property and equipment... (13.8) (19.4) 41% Other direct expenses... (16.4) (17.4) 6% Gross profit % General and administrative expenses... (4.7) (8.5) 81% Unrealized gain on fair valuation of interest rate swap (27)% Finance costs... (2.4) (6.5) 171% Other income (0.2) (140%) Profit before tax % Income tax expense... (1.3) (6.2) 377% Profit/(loss) for the period % 38
39 Revenue Revenues include (i) rental income from our ASVs and (ii) service income. Rental income is the day rate that we charge for chartering our ASVs, and is the main source of our revenue. Service income includes messing and accommodation income, fees charged for the mobilization and de-mobilization of our ASVs, and any other costs recharged to the customer. Messing and accommodation income is based either on a daily fee per PoB or a fee per meal. Revenues increased by $68.2 million, or 116%, from $58.9 million in the year ended December 31, 2011 to $127.1 million in the year ended December 31, 2012, primarily due to the commencement of the Burj contract with ConocoPhillips in the Asia-Pacific region from January 1, 2012 and an increase in our fleet utilization rate (excluding Burj) from 68% in the year ended December 31, 2011 to 92% in the year ended December 31, 2012 (excluding Burj). Day rates for the year ended December 31, 2012 were generally stable as compared to the same period in 2011 (other than with respect to Burj which began operations in 2012). Service income increased by $6.6 million, or 60%, from $11.0 million in the year ended December 31, 2011 to $17.6 million in the year ended December 31, 2012, primarily due to the mobilization fee under our Burj contract and increased income from catering due to the higher fleet utilization rate. There was no impact on service income from catering from the addition of Burj to the fleet in the twelve months ended December 31, 2012, as ConocoPhillips self-cater under that contract. As a result, service income increased by a lower percentage compared to income from rental of offshore accommodation units during the period. Revenues in the year ended December 31, 2011 were also impacted by weather delays on the Ahmed Mobilization, which impacted revenues negatively in 2011 which did not recur in the year ended December 31, The 2011 Ahmed mobilization delay is further described below. Ahmed Mobilization Delay Ahmed was scheduled to start work in relation to a new contract in June However, due to the late arrival of the HLV that was scheduled to carry it, Ahmed arrived late to the customer s float off location, and due to continued adverse weather was unable to be removed from the HLV until August 2011 and subsequently did not go on-hire until September 4, This is the only occasion in our operating history where HLV delays and weather conditions resulted in a delay in our ability to service a customer contract and liquidated damages being paid by us to a customer. In future instances where a customer requires a longdistance mobilization or mobilization to a region with which we are unfamiliar we will aim to negotiate a cost pass-through mechanism into the mobilization fee to avoid potential cost overruns. The late arrival of the HLV and the continued adverse weather resulted in additional mobilization costs of $0.8 million, the payment of liquidated damages of $1.3 million to the customer as a result of the late delivery and 95 days of lost contracted revenue, resulting in a total 2011 EBITDA impact estimated by management of approximately $6.5 million. Ahmed utilization rate in 2011 was 54%, whereas had the delay not occurred management believes utilization rates for Ahmed in 2011 would have been 80%, based on servicing the contract from the scheduled June 1, 2011 start date. Direct Costs Direct costs include offshore crew costs, including crew and contract labor payroll, uniforms, crew health insurance, medicals, training, accommodation, flights, and visas; sub-contract charges, including only catering costs; depreciation of property and equipment; and other direct expenses, including repair and maintenance, materials and consumables, fuel, rental equipment, ASV insurance, mobilization and demobilization costs, classification costs, tugs and port charges. Direct costs increased by $13.3 million, or 32%, from $41.5 million in the year ended December 31, 2011 to $54.8 million in the year ended December 31, 2012, primarily driven by operating costs (which include staff costs, sub-contract charges (catering costs), depreciation and other direct expenses) as a result of 39
40 the commencement of the Burj contract with ConocoPhillips in the Asia-Pacific region from January 1, 2012 and the increase in our fleet utilization rate (excluding Burj) from 68% to 92%, respectively. Staff costs increased by $5.4 million, or 77%, from $7.0 million in the year ended December 31, 2011 to $12.4 million in the year ended December 31, 2012, due to the increased fleet utilization during the year ended December 31, 2012, as our fleet was fully crewed during the period, with the exception of Deema which down manned only in the third quarter of Sub-contract charges (catering costs) increased by $1.3 million, or 30%, from $4.3 million in the year ended December 31, 2011 to $5.6 million in the year ended December 31, 2012 due to Ahmed, Leen, Trident One and Marinia being 100% utilized during this period and Deema being 62% utilized, with catering services being provided to charter customers and crew during these periods. Other direct expenses increased by $1.0 million, or 6%, from $16.4 million in the year ended December 31, 2011 to $17.4 million in the year ended December 31, 2012, primarily due to the costs associated with the mobilization of Burj to the Timor Sea during the first quarter of 2012 and increased materials, consumables and fuel costs due to the increased utilization during the period. As detailed above, other direct expenses for the year ended December 31, 2011 included the mobilization cost overruns incurred on ASV Ahmed mobilization to Egypt. Direct costs also include depreciation, which increased by $5.6 million, or 41%, from $13.8 million in the year ended December 31, 2011 to $19.4 million in the year ended December 31, 2012, due to the addition of our sixth ASV, Burj, to our fleet. General and Administrative Expenses General and administrative expenses include overhead staff costs, legal and professional fees, depreciation of property and equipment, rent, traveling expenses and other items. General and administrative expenses increased by $3.8 million, or 81%, from $4.7 million in the year ended December 31, 2011 to $8.4 million in the year ended December 31, 2012, primarily due to the addition of ASV Burj to the fleet and professional fees associated with our expansion into the Asia-Pacific region in Australia, Singapore and Timor- Leste in 2012, some of which are non-recurring expenses also include the payment of management bonus and $0.4m other professional and advisory fees. Finance Costs Finance costs include interest on our existing credit facility and overdraft, interest on our Lamprell Mortgage and intercompany interest recharged from Millennium Offshore Services, LLC on the funds contributed for the acquisition of Burj. Interest payable on construction or conversion financing during the period of construction or conversion is capitalized in the cost of the ASV. Investment income earned on the temporary investment of specific borrowings pending their expenditure on qualifying assets is deducted from the borrowing costs eligible for capitalization. All other borrowing costs are recognized in profit or loss in the year in which they are incurred. Finance costs increased by $4.1 million, or 171%, from $2.4 million in the year ended December 31, 2011 to $6.5 million in the year ended December 31, 2012, primarily due to the capitalization of intercompany interest recharged from Millennium Offshore Services, LLC on the $30.0 million capital contribution for the acquisition of Burj as part of the costs of the ASV in 2011, which accrued at a rate of 12.0% per annum. In 2012, the intercompany interest has been expensed from January 1, 2012 onwards. Income Tax Expense Income tax expense includes corporate income tax. Income tax expense increased by $4.9 million, or 377%, from $1.3 million in the year ended December 31, 2011 to $6.2 million in the year ended December 31, 2012, primarily due to the commencement of the Burj contract with ConocoPhillips from January 1, Income under the contract is subject to taxation in Timor-Leste, Australia and Singapore, where there are higher income tax rates paid than in other jurisdictions where we currently operate. Income tax expensed in relation to Burj was $4.0 million for the year 40
41 ended December 31, Income tax payable in relation to Deema also increased due to increased utilization rates during 2012 compared to 2011 and provision expensed for filing of the Deema 2008/09 Qatar tax return during Other Financial Data Backlog, Fleet Utilization and Day Rates Our revenues and profitability are strongly influenced by our backlog, fleet utilization rate and day rates. Backlog represents the amount of revenue that we expect to realize from the remaining term of our existing fixed term contracts and customer extension options across all of our ASVs, based on the currently contracted day rate. We define fleet utilization rate as the percentage of days in a period that our ASVs are under contract and during which we are receiving a day rate for the rental of our ASVs. The following table sets out our fleet utilization rate, ASVs and backlog as at December 31, 2011 and As of and for the year ended December 31, Fleet utilization rate (1)... 68% 94% ASVs in fleet (2) Backlog (3)(4) Fixed term contracts (5) Customer extension options (6) Total backlog (1) Fleet utilization rate is defined as the percentage of days of the year that an ASV is under contract and in respect of which a customer is paying a day rate for rental of the ASV. Fleet utilization rate is the average of the utilization rates for each of our ASVs. (2) Burj came into operation on January 1, (3) Presented in U.S. dollars in millions. (4) Includes backlog in respect of new business wins in relation to Deema and Trident One which were signed post December 31, (5) Represents backlog under the fixed term of our existing contracts backlog is pro-forma for new business wins See: Material Recent Developments (6) Represents backlog under the extension options available to our customers under our existing contracts backlog is pro-forma for new business wins See: Material Recent Developments Backlog Our backlog reflects the estimated future revenue attributable to the remaining term of our existing fixed term contracts and customer extension options across all of our ASVs. We include new fixed term contracts and extension options in the calculation of our backlog only after we have entered into full contracts with the relevant counterparties. We assume that customer extension options will be exercised at the day rate under the contract. As at December 31, 2012, pro-forma for new business wins, backlog attributed to our fixed term contracts was $225.1 million and backlog attributed to our customer extension options was $91.5 million, totaling $316.6 million (including backlog in respect of (i) eight two-month customer extension options that 41
42 were converted into a fixed term contract, and (ii) eight new two-month extension options, agreed in September 2012 and contracted in October 2012). The following table sets out our backlog breakdown by year as at December 31, 2012, pro-forma for new business wins. Year ended December 31, (U.S. dollars in millions) Fixed term contract Customer extension options Total EBITDA and Other Financial Data The following table sets out our EBITDA and certain other financial data as of and for the years ended December 31, 2011 and EBITDA As of and for the year ended December 31, (U.S. dollars in millions) EBITDA (1) Total debt (2) Net debt (3) Capital expenditure (4) ASV acquisition and conversion (5) Maintenance (6) Adjusted net working capital (7) (1.5) 1.5 Total (1) EBITDA represents earnings before finance costs, income tax expense, unrealized gain/loss on fair valuation of interest rate swap, equity settled C-grant expense and depreciation of property and equipment. EBITDA-based measures are presented because we believe they are frequently used by securities analysts, investors and other interested parties in evaluating companies. However, other companies may calculate EBITDA-based measures in a manner different from ours. EBITDA-based measures are not a measurement of financial performance under IFRS and should not be considered an alternative to cash flow from operating activities or as a measure of liquidity or an alternative to profit/(loss) on ordinary activities as indicators of operating performance or any other measures of performance derived in accordance with IFRS. (2) Total debt includes bank borrowings, deferred consideration in relation to the Burj acquisition and the outstanding balance on the Lamprell Mortgage. (3) Net debt calculated as total debt less bank balances and cash. (4) 2012 capital expenditures exclude $1.0 million advance dry dock deposits included in capital work in progress. (5) Does not include deferred consideration in respect of the Burj acquisition. (6) Maintenance capital expenditure includes capital expenditure relating to surveys, upgrades, general maintenance and headquarters equipment. (7) Adjusted net working capital represents inventory, trade and other receivables, trade and other payables, amounts due from a related party and amounts due to a related party, less the insurance claim in relation to the Deema fire and the balance under the Lamprell Mortgage. See Management s Discussion and Analysis of Financial Condition and Results of Operations Liquidity and Capital Resources Net Working Capital Requirements. 42
43 Reconciliation of EBITDA to net profit on a consolidated basis For the year ended December 31, (U.S. dollars in millions) Net profit Depreciation (a) Finance costs Unrealized (gain)/loss on fair valuation of interest rate swap (1.1) (0.8) Equity Settled C Grant Expense (b) Income tax expense EBITDA (c) (a) Includes depreciation of property and equipment recognized in Direct Costs as well as deprecation of certain property and equipment included in our General and Administrative Expenses. (b) Equity settled C Grant expense refers to the amount provided under IFRS 2 for the expense relating to equity settled employee benefits provided to senior management. (c) Reconciliation to EBITDA may not add due to rounding. The complete audited IFRS financial results for the year 2010 and 2011, including the notes to the financial statements, are incorporated herein by reference, and available for public access on the company s corporate website under the investor relations section of the website. Liquidity and Capital Resources Overview Our principal sources of funds have historically been cash generated from our operations, borrowings under our finance arrangements (including bank loans and vendor funding provided by Lamprell) and contributions from our shareholders. Our principal uses of cash are to fund capital expenditures and working capital and debt service obligations. We expect that our principal source of liquidity in the future will continue to be cash generated from our operations. Our ability to generate cash from our operations depends on our future operating performance which is in turn dependent, to some extent, on general economic, financial, competitive, market, legislative, regulatory and other factors, many of which are beyond our control. See Risk Factors. We believe that our operating cash flows, together with borrowings under our financing arrangements, will be sufficient to fund our working capital requirements, anticipated capital expenditures and payments of interest as they become due for the foreseeable future, although we cannot provide assurance that this will be the case. We believe that the potential risk to our liquidity is a reduction in operating cash flows due to a reduction in our fleet utilization rate and day rates, which could result from downturns in our performance or the industry as a whole or unforeseen delays. Historical Cash Flow The following table sets forth the principal components of our historical cash flow statement data for the periods indicated. 43 Year ended December 31,
44 (U.S. dollars in millions) Net cash flows from operating activities Net cash used in investing activities (67.9) (10.2) Net cash generated from/(used in) financing activities 15.9 (17.5) Net increase/(decrease) in cash and cash equivalents Cash and cash equivalents (1) at the beginning of the reporting period Cash and cash equivalents (1) at the end of the reporting period Restricted cash at the end of the reporting period 1.4 (2) 1.4 (2) (1) Cash and cash equivalents comprise cash on hand and demand deposits and other short-term highly liquid investments that are readily convertible to a known amount of cash and are subject to an insignificant risk of changes in value. (2) Represents $1.4 million on deposit for guarantees, $1.3 million of which relates to a performance bond required under our current contract for Ahmed and $0.1 million of which relates to a guarantee provided to the GAFI Free Zone authority in Egypt. The complete audited IFRS financial results for the year 2010 and 2011, including cash flow statements and the notes to the financial statements, are incorporated herein by reference, and available for public access on the company s corporate website under the investor relations section of the website. 44
45 Net Cash Flow from Operating Activities The following table sets forth the principal components of our net cash flow from operating activities for the periods indicated. For the year ended December 31, (U.S. dollars in millions) Cash flows from operating activities Profit for the year/period Adjustments for: Depreciation of property and equipment Gain on disposal of property and equipment (0.0) (0.0) Unrealized gain on interest rate swap (1.1) (0.8) Finance costs Income tax expenses Provision for employees end of service indemnity Operating cash flows before changes in operating assets and liabilities Increase in inventories (0.7) (2.0) (Increase)/decrease in due from a related party (0.1) 0.1 (Increase)/decrease in trade and other receivables (6.9) (2.6) Increase/(decrease) in trade and other payables 33.9 (32.0) (Decrease)/increase in due to a related party Net cash generated from operating activities Finance costs paid (2.3) (6.4) Income tax paid (0.5) (2.3) Employee s end of service indemnity paid (0.1) (0.0) Net cash flows from operating activities
46 Net cash flow from operating activities decreased by $10.9 million, or 20%, from $53.4 million in the year ended December 30, 2011 to $42.5 million in the year ended December 31, While operating cash flows before changes in operating assets and liabilities increased by $55.8 million, from $27.5 million in the year ended December 31, 2011 to $83.3 million in the year ended December 31, 2012, net cash flow from operating activities was negatively impacted by a $2.6 million increase in trade and other receivables and a $32.0 million decrease in trade and other payables. The increase in trade and other receivables was primarily due to the addition of Burj to the fleet which generated additional receivables. The decrease in trade and other payables was primarily due to a $25 million repayment of the Lamprell facility, which was included within our trade payables at December 31, Net Cash Flow from Investing Activities The following table sets forth the principal components of our net cash flow from investing activities for the periods indicated. Year ended December 31, (U.S. dollars in millions) Purchase of property and equipment (1)... (67.5) (10.2) Proceeds from disposal of property and equipment Increase in fixed deposits... (0.5) 0.0 Net cash used in investing activities... (67.9) (10.2) (1) Does not include deferred consideration in respect of the Burj acquisition. Net cash used in investing activities decreased by $57.7 million, from cash used of $67.9 million in the year ended December 31, 2011 to cash used of $10.2 million in the year ended December 31, 2012, primarily due to the $67.5 million purchase of property and equipment during 2011, mainly related to the acquisition of Burj, compared with purchases of property and equipment of $10.2 million in the year ended December 31, 2012, of which $3.9 million was related to conversion, customer requested upgrades and equipment purchases in respect of Burj, $5.3 million on maintenance and $1.0 million relating to advance dry dock deposits. 46
47 Net Cash Flow from Financing Activities The following table sets forth the principal components of our net cash generated from/(used in) financing activities for the periods indicated. Year ended December 31, (U.S. dollars in millions) Loans repaid during the year (14.0) (17.1) (Decrease)/Increase in bank overdraft. (0.1) (0.3) Dividends paid Drawings under ABN Facility Capital contribution 30.0 Net cash generated from/(used in) financing activities 15.9 (17.5) Cash generated from/(used in) financing activities decreased by $33.4 million, from $15.9 million generated in the year ended December 31, 2011 to $17.5 million used in the year ended December 31, 2012, primarily due to a $30.0 million capital contribution received from Millennium Offshore Services, LLC in 2011 and a $3.1 million increase in loan repayments during the nine months ended September 30, Net Working Capital Requirements The following table sets forth the principal components of our net working capital as of the end of the periods indicated. Year ended December 31, (U.S. dollars in millions) Trade and other payables (1)... (41.6) (13.5) Trade and other receivables Inventories Due from a related party Due to a related party... (3.5) (7.9) Net working capital... (26.5) 1.5 (1) As of the year ended December 31, 2011 included $25.0 million outstanding balance on the Lamprell Mortgage, which was repaid in full in December
48 Our adjusted net working capital was ($1.5) million as at December 31, 2011, compared to net working capital of $1.5 million as at December 31, The following table sets forth the reconciliation of our net working capital to our adjusted net working capital as of the end of the periods indicated. Year ended December 31, (U.S. dollars in millions) Net working capital... (26.5) 1.5 Adjustments to trade and other payables Lamprell (1) Adjustments to trade and other receivables Adjusted net working capital... (1.5) 1.5 (1) Represents the outstanding balance on the Lamprell Mortgage, which was repaid in full in December Adjusted net working capital is adjusted for the Lamprell Mortgage accounted for in trade and other payables, as we consider this as a financial liability as opposed to an operating working capital item. Our adjusted net working capital increased by $3.0 million, from negative $1.5 million as of the year ended December 31, 2011 to $1.5 million as of the year ended December 31, This increase is primarily due to a $2.6 million increase in trade and other receivables relating primarily to the addition of Burj to our fleet in 2012 and charter revenues added to trade receivables. Inventories also increased by $1.9 million from $1.3 million as of the year ended December 31, 2011 to $3.2 million as of the year ended December 31, 2012 due to additional inventory relating to the addition of Burj to our fleet. Our trade receivables relate to six customers. Contract payment terms are between 30 and 60 days. Other receivables mainly comprise prepaid insurance and accrued revenue. Trade payables consist of both operating expenditure and capital expenditure payables. Capital expenditure payables generally relate to upgrades and maintenance of the ASVs. Other payables mainly comprise accrued expenses, accrued crew payroll, interest payable on the ABN Facility, interest payable on the Lamprell Mortgage, intercompany interest recharged from Millennium Offshore Services, LLC and tax payable. The increase in other payable in the year ended December 31, 2012 was driven by interest costs associated with the acquisition funding for Burj. Capital Expenditure Our capital expenditure mainly relates to ASV maintenance, survey costs and subsequent ASV upgrades, and the acquisition and conversion of new ASVs. Our capital expenditure amounted to $70.6 million (excluding deferred consideration of $17.5 million in respect of the Burj acquisition) for 2011 and $9.2 million for the year ended December 31, 2012 (excluding $1.0 million advance dry dock deposits included within capital work in progress). For the year ended December 31, 2011 our capital expenditure increased significantly due to our acquisition and conversion of Burj. Capital expenditure reverted to normal maintenance levels in Should we pursue the acquisition or conversion of one or more new ASVs in the future, our capital expenditure would increase substantially in the period during which the acquisition and/or conversion were to occur. 48
49 The following table sets forth the breakdown of our capital expenditure in respect of acquisition and conversion and maintenance for the periods indicated. Year ended December 31, (U.S. dollars in millions) ASV acquisition and conversion (1) Maintenance (2) Total (1) Does not include deferred consideration in respect of the Burj acquisition. (2) Includes capital expenditure relating to surveys, upgrades, general maintenance and headquarters equipment. In 2011, we incurred acquisition and conversion costs related to our acquisition of Burj and our survey costs and maintenance and upgrade spending totaled $5.3mm following the completion of extensive upgrades to Ahmed, Deema and Marinia in In 2012, our capital expenditure included $3.9 million in conversion costs relating to Burj with the remaining $5.3 million incurred on survey costs, upgrades and maintenance of the existing fleet. As of the date of this annual report, we do not have any material committed capital expenditure. Contractual Obligations and Off-Balance Sheet Arrangements Following the Offering, our only long-term financial liability is the Notes. For a description of our liabilities as of December 31, 2012, see Quantitative and Qualitative Disclosures about Market Risk Liquidity Risk and note 21 to our audited consolidated financial statements as of and for the year ended December 31, As of December 31, 2012, we did not have any significant off-balance sheet arrangements. For a full description of our commitments and contingencies, see note 19 to the consolidated financial statements as of and for the year ended December 31, 2012 included elsewhere in this annual report. Off-balance sheet arrangements (U.S. dollars in millions) Less than 1 year 1 5 years More than 5 years Total Letters of guarantee (1) Total (1) Represents a $1.3 million performance bond required under our current contract for Ahmed and a $0.1 million guarantee provided to the GAFI Free Zone authority in Egypt. 49
50 Quantitative and Qualitative Disclosures about Market Risk Credit Risk The following are what we consider the most material market risks relating to our business. The market for our services is the offshore oil and gas industry, and the customers consist primarily of NOCs, IOCs and EPIC companies who lease our ASVs at varying contract lengths to provide support to their offshore capital projects. We perform ongoing credit evaluations of our customers and generally do not require collateral in our business agreements. Reserves for potential credit losses are maintained when necessary. Credit risk refers to the risk that a counter party will default on its contractual obligations resulting in financial loss to us. We have adopted a policy of only dealing with creditworthy counterparties as a means of mitigating the risk of financial loss from defaults. Our exposure and the credit ratings of our counterparties are continuously monitored and the aggregate value of transactions concluded is spread amongst approved counterparties. Credit exposure is controlled by making binding legal agreements with the counter parties and is monitored by management. We may also face credit-related losses in the event that counterparties to our derivative financial instrument contracts do not perform according to the terms of the contract. The credit risk arising from these counterparties relates to unrealized profits from our interest rate swaps. We generally do not require collateral for our financial instrument contracts. In the opinion of our management, our counterparties are creditworthy financial institutions with high credit ratings assigned by international credit rating agencies, and we do not expect any significant loss to result from their non-performance. As of the date of this annual report, we have not recorded any bad debts resulting from the credit quality of our customers. Liquidity Risk We manage liquidity risk by maintaining adequate reserves, by continuously monitoring forecast and actual cash flows and matching the maturity profiles of financial assets and liabilities. Ultimate responsibility for liquidity risk management rests with the Board of Directors, which has built an appropriate liquidity risk management framework for the management of our short, medium and long-term funding and liquidity management requirements, which includes the issuance of a new $15 million super senior revolving credit facility which was put in place February 26, See Description of Certain Financing Arrangements Material Debt Instruments Revolving Credit Facility. The table below includes the maturity profile of the Group s financial instruments. The contractual maturities of the financial instruments have been determined on the basis of the remaining period at the end of reporting date to the contractual maturity date. The maturity profile is monitored by management to ensure adequate liquidity is maintained. The maturity profile of the financial assets and financial liabilities at December 31, 2012 based on contractual repayment arrangements was as follows: Financial Assets (U.S. dollars in millions) Within 1 year 1 2 years 2 5 years Total Bank balances and cash Trade and other receivables Total
51 Financial Liabilities (U.S. dollars in millions) Within 1 year 1 2 years 2 5 years Total Bank borrowings Trade and other payables Other financial liabilities Due to related parties Derivative financial instruments Total Interest Rate Risk Our exposure to market risk for changes in interest rates relates primarily to our debt obligations. We will not have any cash flow exposure due to rate changes on the Notes as they will bear interest at a fixed rate. Our exposure to interest rate risk relates to borrowings from banks. The interest rates on bank borrowings are linked to LIBOR plus applicable margin. If interest rates had been 100 basis points higher/lower and all the other variables held constant, our profit for the year ended December 31, 2012 and equity as of that date would have been decreased/increased by $263,253 (2011: 437,812). This sensitivity analysis has been determined based on the interest rate risk exposure on our net assets and on our profits for the year ended December 31, We enter into interest rate swap derivative transactions to manage our exposure to interest rate risk. We enter into interest rate swaps to convert a proportion of our bank borrowings from floating to fixed rate liabilities. At December 31, 2012, we had outstanding interest rate swaps for contracts with nominal values of $14.7 million with fixed interest payments quarterly and floating interest receipts linked to LIBOR. Foreign Exchange Risk We use the U.S. dollar as our functional currency because the majority of our revenues and expenses are denominated in U.S. dollars. Accordingly, our reporting currency is also the U.S. dollar. We do, however, earn some revenue and incur some expenses in other currencies and there is thus a risk that currency fluctuations could have an adverse effect on the value of our cash flows. We undertake certain transactions denominated in foreign currencies, hence, exposure to exchange rate fluctuations arise. The carrying amounts of our foreign currency denominated monetary liabilities at December 31, 2012 date are as follows. (U.S. dollars in millions) Liabilities UAE Dirhams Egyptian Pound Others As of December 31, 2012, we did not have any foreign currency denominated monetary assets. We are mainly exposed to UAE Dirhams, Egyptian Pound, Qatari Riyal and Euro. Based on the sensitivity analysis to a 10% increase or decrease in the U.S. dollar against Egyptian Pound and Euro, our profit for the year ended December 31, 2012 and equity as of December 31, 2012 would not be impacted 51
52 significantly. There is no impact on UAE Dirhams and Qatari Riyals because of a U.S. dollar peg to these currencies. 10% is the sensitivity rate used when reporting foreign currency risk internally to key management personnel and represents management s assessment of the reasonably possible change in foreign exchange rates. The sensitivity analysis includes only outstanding foreign currency denominated monetary items and adjusts their translation at the period end for a 10% change in foreign currency rates. Critical Accounting Policies Fair Value of Derivative Financial Instruments We enter into interest rate swap derivative transactions to manage our exposure to interest rate risk. Derivative financial instruments are initially recognized at fair value at the date a derivative contract is entered into and are subsequently re-measured to their fair value at the end of each reporting period. All the derivative financial instruments are carried at their fair values as assets where the fair values are positive and as liabilities where the fair values are negative. A derivative financial instrument is presented as a non-current asset or a non-current liability if the remaining maturity of the instrument is more than twelve months and it is not expected to be realized or settled within twelve months. Other derivative financial instruments are presented as current assets or current liabilities. As at December 31, 2012, we had outstanding interest rate swaps for nominal values of $14.7million. The fair value of this interest rate swap has been determined using monthly market-to-market data. The derivative instrument becomes favorable (asset) or unfavorable (liability) as a result of fluctuations in market interest rates relative to the terms agreed with the counter party. Property and Equipment The cost of property and equipment is depreciated over the estimated useful life, which is based on expected usage of the asset, expected physical wear and tear, the repair and maintenance program and technological obsolescence arising from changes and the residual value. Provisions Provisions are recognized when (i) we have a present obligation (legal or constructive) as a result of a past event, (ii) it is probable that we will be required to settle the obligation and (iii) a reliable estimate can be made of the amount of the obligation. Generally, provisions are only recorded in relation to tax. We make monthly provisions based on the various locations in which our ASVs are operating, which we check against applicable tax rates. The amount recognized as a provision is the best estimate of the consideration required to settle the present obligation at the reporting date, taking into account the risks and uncertainties surrounding the obligation. Where a provision is measured using the cash flows estimated to settle the present obligation, its carrying amount is the present value of those cash flows. Material Contractual Arrangements Customers Our customer base includes large and prominent NOCs, IOCs and EPIC companies who lease our ASVs at varying contract lengths to provide support to their large offshore capital projects. In some instances, we enter into contracts with our customers indirectly as subcontractors. For the twelve months ended 52
53 December 31, 2012, six customers accounted for 100% of our revenue and our top customer accounted for 38% of our revenue. In addition, as of December 31, 2012, six customers accounted for 100% of our backlog of fixed term contracts and customer extension options. See Fleet Contract Profile and Key Contract Terms. We benefit from repeat business from our customers, with seven out of our eleven customers since we began operating having executed two or more contracts with us. In addition, since our inception, our customers have exercised 37 out of 41 customer extension options. Our repeat customers include, Total ABK, Hyundai Heavy Industries, Oxy, Saudi Aramco/McDermott and ENPPI/GUPCO. Other customers include ConocoPhillips, Lamnalco and NPCC. Our management team continually works to build customer relationships by initiating dialogue with prospective customers and maintaining an active dialogue with our existing customers to ensure that we are up to date with their requirements, particularly with regards to health and safety, and trends in the industry, including with regards to ASV specifications. Suppliers We rely on outside suppliers to provide messing, accommodation and communication services for the passengers on board our ASVs while on contract. There are a number of international firms that provide these services and we generally bid out the potential service contract to a number of parties unless our customer has a specific preference. Our main supplier for shipyard facilities and labor for ASV maintenance, survey, upgrade and conversion work is Lamprell. The Lamprell shipyard is our preferred choice given its close proximity to our headquarters and workshop and storage area, and to our ASVs that are operating in the MENA region. We also retain outside suppliers for staffing and new recruitment, travel for our staff and crew, the provision of safety equipment, such as lifeboats, for our ASVs and for mobilization services. Certain Relationships and Related Party Transactions Burj Acquisition On February 16, 2011, we purchased Burj from MMEER LLC. MMEER LLC is an affiliate of one of our principal shareholders. We purchased Burj for $30.0 million plus a potential deferred consideration of $17.5 million. The acquisition was funded by a $30.0 million capital contribution by Millennium Offshore Services, LLC. The deferred consideration is a earn out provision, which was paid in full from the proceeds of the Offering. Dixie Patriot From 2009 through 2011, we managed the ASV Dixie Patriot, which was owned by an affiliate of Mike Mullen. We received revenue from our contract to manage Dixie Patriot of $0.4 million in the year ended December 31, 2011 that was recorded in Other Income. Our contract to manage Dixie Patriot ended in August
54 Description of Certain Financing Arrangements MATERIAL DEBT INSTRUMENTS The following summary of the material terms of our principal financing arrangements does not purport to describe all of the applicable terms and conditions of such arrangements, and is qualified in its entirety by reference to the actual underlying documents. Senior Secured Notes Overview On February 14, 2013, Millennium Offshore Services Superholdings, LLC, as the Issuer, issued $225 million aggregate principal amount of 9½% Senior Secured Notes due The Notes were issued pursuant to an indenture (the Indenture ) dated February 14, 2013 among, inter alios, the Issuer, the Guarantors (as defined below), Citibank, N.A., London Branch as trustee (the Trustee ) and ABN AMRO Bank N.V. as collateral agent. The Notes: are general senior secured obligations of the Issuer; are secured by the Collateral (as defined below); are effectively subordinated to any existing and future indebtedness of the Issuer, to the extent such Indebtedness is secured by liens senior to the liens securing the Notes, or secured by property and assets that do not secure the Notes, to the extent of the value of the property and assets securing such indebtedness; rank pari passu in right of payment with all existing and future senior indebtedness of the Issuer; rank senior in right of payment to any future indebtedness of the Issuer that is expressly subordinated in right of payment to the Notes; are fully and unconditionally guaranteed on a senior basis by the Guarantors (as defined below), subject to limitations under applicable law; and are structurally subordinated to all obligations of the Issuer s subsidiaries that are not Guarantors. Guarantees The Notes are senior obligations of the Issuer and are guaranteed (the Guarantees ) on a senior basis by the following subsidiaries of the Issuer (the Guarantors ): Millennium Offshore Services Management Pte. Ltd.; Millennium Offshore Services Pte. Ltd.; Burj, LLC; Millennium Offshore Services Holdings, LLC; Millennium Offshore Services Marshall Islands Inc.; Ahmed LLC; Deema LLC; Marinia LLC; Trident One LLC; and Leen LLC. Each Guarantee is a general, senior secured obligation of the relevant Guarantor and: is secured by the Collateral (as defined below); is effectively subordinated to any existing and future indebtedness of that Guarantor that is secured by liens senior to the liens securing the Guarantees, or secured by property and assets that do not secure the Guarantees, to the extent of the value of the property and assets securing such indebtedness; ranks pari passu in right of payment with any future senior indebtedness of that Guarantor that is not subordinated in right of payment to that Guarantor; ranks senior in right of payment to any future indebtedness of that Guarantor that is expressly subordinated in right of payment to the relevant Guarantee; and 54
55 is effectively senior to all of that Guarantor s existing and future unsecured indebtedness to the extent of the assets securing that Guarantee. Security The Guarantees are subject to release under certain circumstances. The Notes and the Guarantees are secured by first ranking security over (i) all of the limited liability company interests in the Issuer; (ii) all of the limited liability company interests or capital stock, as the case may be, in each Guarantor; (iii) material bank accounts of the Issuer and each Guarantor (for the avoidance of doubt, excluding any bank accounts in Egypt and Australia existing on the date of issuance of the Notes); (iv) all vessels of the Issuer and each Guarantor; (v) an assignment of insurances of the Issuer and each Guarantor; (vi) the proceeds of customer contracts and the proceeds of any other vessel earnings, in each case, received by the Issuer and each Guarantor; (vii) requisition proceeds of the Issuer and each Guarantor; (viii) equipment, inventory and intercompany receivables of the Issuer and each Guarantor; (ix) any shareholder loans from Millennium Offshore Services, LLC to the Issuer or any Guarantor; and (x) in the case of any Guarantor organized in Singapore, substantially all of the assets of such Guarantor (the Collateral ). The Revolving Credit Facility is also secured on the Collateral and pursuant to the Intercreditor Agreement will receive priority with respect to any proceeds received upon any enforcement action over the Collateral. Subject to the terms of the security documents and the Intercreditor Agreement, the obligations of the Issuer under the Notes, and the obligations of the Guarantors in respect of the Guarantees under the Indenture, may be secured by liens and security interests on the same assets that secure, inter alia, the obligations under future indebtedness. See Intercreditor Agreement below. The Collateral is subject to release under certain circumstances. Principal, Maturity and Interest The Issuer has issued $225 million in aggregate principal amount of Notes. The Issuer may issue additional Notes under the Indenture from time to time. Any issuance of such additional Notes is subject to all of the covenants in the Indenture, including the covenant relating to our ability to incur debt. The Notes will mature on February 15, Interest on the Notes will accrue at the rate of 9.50% per annum and will be payable semi-annually in arrears on February 15 and August 15, commencing on August 15, Interest on overdue principal and interest, if any, will accrue at a rate that is 1.0% higher than the then applicable interest rate on the Notes. Interest on the Notes will accrue from the date of original issuance or, if interest has already been paid, from the date it was most recently paid. Interest will be computed on the basis of a 360-day year comprised of twelve 30-day months. Optional Redemption Prior to February 15, 2015, the Issuer may redeem all or a portion of the Notes at a price equal to 100% of the aggregate principal amount thereof plus accrued and unpaid interest and additional amounts, if any, and a make-whole premium. At any time on or after February 15, 2015, the Issuer may redeem all or a portion of the Notes at the prices specified in the Indenture plus accrued and unpaid interest and additional amounts, if any. In addition, prior to February 15, 2015, the Issuer may redeem at its option up to 35% of the aggregate principal amount of the Notes with the net proceeds from certain equity offerings at a price equal to % of the aggregate principal amount thereof plus accrued and unpaid interest and additional amounts, if any. 55
56 Change of Control Upon the occurrence of certain change of control events together with a downgrade or withdrawal of a rating from certain rating agencies, within 90 days following the occurrence of such events, the Issuer is required to make an offer to purchase the Notes at a price equal to 101% of the aggregate principal amount thereof plus accrued and unpaid interest and additional amounts, if any. In the event of certain developments affecting taxation, the Issuer may redeem all, but not less than all, of the Notes at a price equal to 100% of the aggregate principal amount thereof plus accrued and unpaid interest and additional amounts, if any. Asset Sales The Issuer is required to offer to purchase the Notes with excess proceeds, if any, following certain asset sales at a purchase price equal to 100% of the aggregate principal amount, and accrued and unpaid interest and additional amounts, if any, to the date of purchase. Covenants The Indenture governing the Notes contains information and restrictive covenants. The Indenture limits, among other things, our ability to: incur or guarantee additional indebtedness and issue certain preferred stock; pay dividends on, redeem or repurchase our capital stock; make certain restricted payments and investments, including dividends or other distributions with regard to the shares of the Issuer or its restricted subsidiaries; create or incur certain liens; enter into agreements that restrict our restricted subsidiaries ability to pay dividends or other distributions or make loans or advances to the Issuer or any of its restricted subsidiaries; transfer or sell assets; merge or consolidate with other entities; enter into certain transactions with affiliates; and impair the security interests for the benefit of the holders of the Notes. Each of the covenants is subject to a number of important exceptions and qualifications. Events of Default The Indenture contains certain events of default, including but not limited to default in payment when due of principal, premium or interest on the Notes, cross-default (subject to a $10 million threshold) with respect to other indebtedness of the Issuer and its Restricted Subsidiaries (as defined in the Indenture), failure to comply with the Indenture and certain events of bankruptcy or insolvency. In the case of an event of default caused by certain events of bankruptcy or insolvency with respect to the Issuer, any Restricted Subsidiary that is a Significant Subsidiary (as defined in the Indenture) or any group of Restricted Subsidiaries that, taken together, would constitute a Significant Subsidiary, all then outstanding Notes will become due and payable immediately. In the case of any other event of default occurring and continuing, the Trustee may and at the direction of the holders of at least 25% in aggregate principal amount of the then outstanding Notes shall, declare all of the then outstanding Notes to be due and payable immediately by notice in writing to the Issuer and, in case of a notice by holders, also to the Trustee. Listing The Notes are listed on the Official List of the Irish Stock Exchange and are admitted to trading on the Global Exchange Market. 56
57 Governing Law The Indenture, the Notes and the Guarantees are governed by the laws of the State of New York. The security documents are governed by the laws of the Marshall Islands, New York law, Dutch law and Singapore law. Revolving Credit Facility On February 26, 2013, we entered into a new $15 million super senior revolving credit facility with ABN AMRO Bank N.V. The terms of the Revolving Credit Facility, including provisions relating to maintenance of financial covenants, change of control and events of default differ from the terms of the Notes. Set out below is a summary of the material terms of the Revolving Credit Facility. Overview The Revolving Credit Facility provides for up to $15 million of committed financing (the Total Commitments ), which are available for utilization by way of the drawing of cash revolving loans, performance guarantees and ancillary facilities from and including March 15, 2013 (the date on which all conditions precedent under the Revolving Credit Facility were satisfied) until the date falling one month prior to the Termination Date (as defined below). Borrowings under the Revolving Credit Facility will be used for the working capital and general corporate purposes of the Group. The borrower under the Revolving Credit Facility is the Issuer. The Revolving Credit Facility is guaranteed by the Guarantors and the Issuer. The facility agent (the Agent ) under the Revolving Credit Facility is ABN AMRO Bank N.V. Repayments and Prepayments The Revolving Credit Facility will terminate on February 15, 2017 (the Termination Date ). Any amounts still outstanding at such date must be repaid on that date. Subject to certain conditions, the Issuer is permitted to voluntarily prepay utilizations and/or permanently cancel all or part of the available commitments under the Revolving Credit Facility by giving three business days prior notice to the Agent (provided that such prepayment or cancellation must be, if in part, in a minimum amount of $500,000 and in an integral multiple of $500,000). Any such prepayment will be made with accrued interest on the amount prepaid, and subject to breakage costs, without premium or penalty. Amounts repaid may, subject to the terms of the agreement governing the Revolving Credit Facility, be reborrowed. Change of Control The Revolving Credit Facility includes customary mandatory prepayment provisions relating to any person gaining more than 50.1% control of the Issuer, other than any entity or entities which are owned, managed or advised by OZ Management LP or any of its direct or indirect affiliates. Interest and Fees The Revolving Credit Facility bears interest at a rate per annum equal to LIBOR plus certain mandatory costs and a margin of 4.00% per annum (the Margin ). 57
58 We are required to pay a commitment fee on available but not utilized or not cancelled commitments under the Revolving Credit Facility at a rate of 25% of the Margin per annum on the undrawn portion of each lender s commitment under the Revolving Credit Facility. Security and Guarantees The Revolving Credit Facility is guaranteed by the Issuer and the same Guarantors that guarantee the Notes. The Revolving Credit Facility also benefits from security over the same collateral as the Notes and pursuant to the Intercreditor Agreement will receive priority with respect to any proceeds received upon any enforcement action over the Collateral. See Senior Secured Notes Guarantees and Senior Secured Notes Security. Covenants The Revolving Credit Facility contains customary information and negative covenants (including certain restrictive covenants that replicate those contained in the Indenture, and the note purchase condition described below under The Note Purchase Condition ), subject to customary carve outs, thresholds, materiality and permitted baskets. The Revolving Credit Facility also requires the Issuer and each guarantor under the Revolving Credit Facility to observe certain customary affirmative covenants, subject to customary carve outs, thresholds, materiality and permitted baskets. The Revolving Credit Facility requires our financial and operating performance to be monitored by three financial covenants, which will require us to ensure that: the fair market value of the vessels owned by the Issuer and each Guarantor shall be at least equal to 115% of the total net debt of the Issuer and each Guarantor; the ratio of total net debt of the Issuer and each Guarantor to EBITDA (the Leverage ) is (i) equal to or less than 4.0:1 on each test date up to and including December 31, 2014 and (ii) equal to or less than 3.5:1 on each test date falling on or after June 30, 2015; and the debt service cover ratio ( DSCR ) is equal to or higher than 1.15:1. We have rights to cure any breach of the Leverage and DSCR financial covenants by adding new equity or subordinated debt to EBITDA or using the proceeds thereof to reduce Total Net Debt (as defined in the Revolving Credit Facility). These rights cannot be exercised more than three times, in consecutive quarters or more than once in a financial year, and the new equity or subordinated debt must be provided within 60 business days of the compliance certificate which evidences the breach. The Note Purchase Condition The Notes or other debt ranking pari passu with the Notes may be prepaid or redeemed by an amount equal to 35% of the initial principal amount of the Notes without cancellation of the Revolving Credit Facility. Any further prepayment or redemption will be accompanied by a pro rata cancellation of the Revolving Credit Facility. Events of Default The Revolving Credit Facility contains customary events of default (subject to customary carve outs, thresholds, materiality and permitted baskets), including a cross-default with respect to financial indebtedness of the Issuer and Guarantors (subject to a $10 million threshold), the occurrence of which would likely allow the lenders under the Revolving Credit Facility to exercise customary rights to (i) cancel the Total Commitments; (ii) declare that all or part of the loans (plus accrued interest and all other accrued amounts) are 58
59 immediately due and payable; (iii) declare that all or part of the loans are payable on demand; (iv) declare any of the amounts (or cash cover in relation to those amounts) outstanding in respect of any performance guarantees or ancillary facilities to be immediately due and payable; (v) declare any of the amounts (or cash cover in relation to those amounts) outstanding in respect of any performance guarantees or ancillary facilities be payable on demand; and/or (vi) exercise or direct the Collateral Agent to exercise any of its rights and remedies under the agreement governing the Revolving Credit Facility and other related finance documents. Governing Law The Revolving Credit Facility and any non-contractual obligation arising out of or in connection with it will be governed by and construed and enforced in accordance with English law, although the incurrence covenants included in the Revolving Credit Facility largely replicate those contained Indenture and will be interpreted in accordance with the law of the State of New York (without prejudice to the fact that the Revolving Credit Facility is governed by English law). Intercreditor Agreement To establish the relative rights of certain of the Issuer s and each other Debtors (as defined below) creditors under the Group s financing arrangements, the Issuer and certain of its subsidiaries entered into an intercreditor agreement (the Intercreditor Agreement ) dated February 14, 2013 to govern the relationships and relative priorities among: (i) the Trustee on behalf of itself and the holders of the Notes (the Noteholders ); (ii) the hedge counterparties under certain hedging agreements (the Hedge Counterparties ); (iii) certain future creditors of the Issuer and its restricted subsidiaries; (iv) certain intra-group creditors and debtors; (v) Millennium Offshore Services, LLC as the original shareholder in the Issuer (the Parent ); (vi) various creditor representatives; and (vii) ABN AMRO Bank N.V. as the Collateral Agent. The Issuer and each of its subsidiaries that incurs any liability or provides any guarantee under the Indenture or the Super Senior Facilities (as defined below) or the Pari Passu Debt (as defined below) documents and which is a party to the Intercreditor Agreement are together referred to in this description as Debtors (and each a Debtor ). The Intercreditor Agreement sets out: the relative ranking of certain indebtedness of the Debtors; the relative ranking of certain security granted by the Debtors; when payments can be made in respect of certain indebtedness of the Debtors; when enforcement actions can be taken in respect of that indebtedness; the effect of certain insolvency events; turnover provisions; and when security and guarantees will be released to permit a sale of the Collateral. The Intercreditor Agreement allows for the Debtors to enter into super senior credit facilities (including the refinancing, in full or in part, of any super senior facilities then outstanding at the time of such refinancing) (the Super Senior Facilities ) provided that such Super Senior Facilities do not breach the terms of the Indenture, any other agreement documenting any Super Senior Facilities then outstanding and any agreement documenting any Pari Passu Debt then outstanding. Subject to the following sentence or as otherwise set out in this description, the Super Senior Facilities shall rank in right and priority of payments, and the Collateral shall rank and secure the liabilities owed under the Super Senior Facilities, pari passu to the Notes. In respect of the proceeds of the enforcement of the Collateral (and certain other amounts), the Super Senior Facilities shall rank in right and priority of payments super senior to the Notes. 59
60 The lenders of the Super Senior Facilities (the Super Senior Lenders ) have rights under the Intercreditor Agreement which are summarized below. For the purposes of this description, any references to the Super Senior Facilities or Super Senior Lenders or Super Senior Facilities Liabilities (as defined below) should be read as including any other super senior credit facilities or any refinancing debt in respect of the Super Senior Facilities. The Intercreditor Agreement also contains provisions relating to future indebtedness that may be incurred by the Debtors provided that it is not prohibited by the terms of the Indenture and any agreement documenting Super Senior Facilities then outstanding, which may rank in right and priority of payments pari passu to the Notes and be secured by the Collateral (the Pari Passu Debt ) and provided that it is permitted by the terms of any other Pari Passu Debt then outstanding, subject to the terms of the Intercreditor Agreement. The creditors of the Pari Passu Debt (the Pari Passu Creditors ) have rights under the Intercreditor Agreement which are summarized below. The Intercreditor Agreement also contains provisions relating to hedging liabilities that may be incurred by the Debtors provided that such liabilities are not prohibited by the terms of the Indenture, any agreement documenting Super Senior Facilities then outstanding and any agreement documenting any Pari Passu Debt then outstanding, which may rank in right and priority of payments pari passu to the Notes and be secured by the Collateral (the Hedging Liabilities ), subject to the terms of the Intercreditor Agreement. below. The Hedge Counterparties have rights under the Intercreditor Agreement which are summarized The following description is a summary of certain provisions that are contained in the Intercreditor Agreement. It does not restate the Intercreditor Agreement in its entirety nor does it describe provisions relating to the rights and obligations of holders of other classes of our debt. Ranking and Priority The Intercreditor Agreement provides, subject to the provisions regarding Collateral and Permitted Payments below, that the right and priority of payment of all present and future liabilities and obligations under the Notes (the Notes Liabilities ), of all present and future liabilities and obligations under the Super Senior Facilities (the Super Senior Facilities Liabilities ), the Hedging Liabilities and the Pari Passu Debt will rank pari passu in right and priority of payment without any preference or payment between them. The Super Senior Lender will be paid on priority to other creditors from the proceeds of any enforcement of the Collateral and certain other amounts paid to, or recovered by, the Collateral Agent in accordance with the terms of the Intercreditor Agreement. These liabilities will rank ahead of any liabilities of the Debtors to the Issuer and its subsidiaries (the Intra-Group Liabilities ) or any debt to the Parent or any future direct shareholder in the Issuer who accedes to the Intercreditor Agreement (the Investors ) (the Investor Liabilities and together with the Intra-Group Liabilities, the Subordinated Liabilities and the holders of any Subordinated Liabilities, the Subordinated Creditors ). The Intercreditor Agreement does not purport to rank any of the Subordinated Liabilities as between themselves. Collateral The Noteholders, the Super Senior Lenders, the Hedge Counterparties and the Pari Passu Creditors will benefit from a common guarantee and security package and no such secured creditor may take the benefit of any guarantee or security unless such guarantee or security is also offered for the benefit of the other secured creditors from the Issuer and its restricted subsidiaries. 60
61 Subject to the provision regarding the Application of Proceeds below, the Collateral shall rank and secure the liabilities owed to the Noteholders, the Super Senior Lenders, the Hedge Counterparties and the Pari Passu Creditors pari passu and without any preference between them. The Super Senior Lender will be paid on priority to other creditors from the proceeds of any enforcement of the Collateral and certain other amounts paid to, or recovered by, the Collateral Agent in accordance with the terms of the Intercreditor Agreement. In addition, the Intercreditor Agreement provides that the guarantees and security over the Collateral will be released in certain circumstances described further below in Release of Security and Guarantees Non-distressed Disposals and Release of Security and Guarantees Distressed Disposals. Permitted Payments The Intercreditor Agreement permits payments to be made, at any time, by the Debtors under the Indenture and any Pari Passu Debt documentation (provided such payments are permitted under such documents and unless, in the case of a redemption, repurchase or repayment, any documentation relating to the Super Senior Liabilities or the Notes Liabilities or the Pari Passu Debt (as applicable) restricts such redemption, repurchase or repayment). The Intercreditor Agreement permits payments to be made, at any time, by the Debtors under the Super Senior Facilities agreement (provided such payments are permitted under any documentation relating to such Super Senior Facilities). The Intercreditor Agreement includes restrictions on payments to Hedge Counterparties except certain specified permitted payments. Provided that no acceleration event has occurred, subject to certain conditions, the Intercreditor Agreement permits payments to lenders of Intra-Group Liabilities. If an acceleration event has occurred payments to lenders of Intra-Group Liabilities may only be paid if the requisite consents required under the Intercreditor Agreement for those payments to be made are given or the payment is being made to facilitate the payment of Notes Liabilities, Super Senior Liabilities, Hedging Liabilities, Pari Passu Debt or amounts owed to the Trustee. No payments may be made in respect of Investor Liabilities except to the extent not prohibited by the Indenture, any documentation for the Super Senior Facilities and the Pari Passu Debt documentation or if the requisite consents required under the Intercreditor Agreement for those payments to be made are given. An acceleration event includes the relevant creditor representative exercising any or all of its rights under the acceleration provisions of the Indenture, Super Senior Facilities agreement (or any other equivalent acceleration provisions under any replacement or additional facility agreement for the Super Senior Facilities) and/or the Pari Passu Debt documentation (as applicable). Enforcement Enforcement Instructions The Collateral Agent may refrain from enforcing the Collateral unless instructed otherwise by the Instructing Group (as defined below). Subject to the security having become enforceable in accordance with its terms and compliance with the provisions described under Enforcement Instructions Consultation Periods below, the Instructing Group may give instructions to the Collateral Agent to enforce the Collateral as they see fit provided that the instructions as to enforcement given by the Instructing Group are consistent with the security enforcement principles set out in the Intercreditor Agreement (the Security Enforcement Principles ). 61
62 In the case of the enforcement of Collateral, the Intercreditor Agreement defines Instructing Group as the Majority Super Senior Creditors (being, 66 2 / 3 % by value of the Super Senior Lenders) and the Majority Senior Secured Creditors (being, 50% by value of the Noteholders, the Hedge Counterparties and the Pari Passu Creditors) (in each case acting through its respective Creditor Representative), provided that: (a) (b) in the case of an insolvency event in respect of a member of the Group, the instructions with respect to Enforcement from the Majority Super Senior Creditors will prevail provided further that such instructions are consistent with the Security Enforcement Principles; if the Collateral Agent has received instructions (or proposed instructions) as to the enforcement of the Collateral by or on behalf of both the Majority Super Senior Creditors and the Majority Senior Secured Creditors that are inconsistent as to the manner of such enforcement (including any inconsistency as to the timeframe for realising value from an enforcement of the Collateral or a distressed disposal) ( Conflicting Enforcement Instructions ) then: (i) subject to (ii) below, if instructions with respect to such enforcement have been received from the Majority Senior Secured Creditors and: (A) (B) the provisions in the second paragraph described under Enforcement Instructions Consultation Periods below have been complied with; and such instructions are instructions to enforce or not to enforce the Collateral or otherwise require the distressed disposal of Collateral, such enforcement instructions from the Majority Senior Secured Creditors will prevail; and (ii) in the event that the relevant Instructing Group is the Majority Senior Secured Creditors, and: (A) (B) from the date that is three months after the date the first enforcement instructions were issued, no steps have been taken in relation to the commencement of enforcement of the Collateral; or the Super Senior Liabilities have not been fully discharged within six months of the date the first such Enforcement instructions were issued, the instructions with respect to Enforcement from the Majority Super Senior Creditors will prevail provided that they are consistent with the Security Enforcement Principles. Other than in certain specified circumstances set out in the Intercreditor Agreement, the Hedge Counterparties may not, independently, take any enforcement action in respect of the Hedging Liabilities. No secured party shall have any independent power to enforce, or to have recourse to enforce, any security or to exercise any rights or powers arising under the security documents except through the Collateral Agent. Enforcement Instructions Consultation Periods If either of the Majority Super Senior Creditors or the Majority Senior Secured Creditors wish to instruct the Collateral Agent to commence enforcement of the Collateral, such group of creditors must deliver a copy of the proposed instructions as to such enforcement (the Enforcement Proposal ) to the Collateral Agent and the agent/representative of each creditor class at least ten business days prior to the proposed date of issuance of instructions under such Enforcement Proposal (the Proposed Enforcement Instruction Date ). If any Super Senior Facilities are then outstanding and the Collateral Agent has received Conflicting Enforcement Instructions, the Collateral Agent shall promptly notify the agent/representative of each creditor class and such agents/representatives will consult with each other and the Collateral Agent in good faith for a 62
63 period of no less than 30 days (or such shorter period as the relevant agents/representatives may agree) from the earlier of (i) the date of the latest such Conflicting Enforcement Instruction and (ii) the date falling ten Business Days after the date the original Enforcement Proposal is delivered in accordance with the paragraph above, with a view to co-ordinating instructions as to any enforcement. No agent/representative of the creditors represented in the Instructing Group shall be obliged to consult in accordance with the immediately preceding paragraphs, and the Instructing Group shall be entitled to give any instructions to the Collateral Agent to enforce the Collateral or take any other enforcement action prior to the end of a consultation period, if: (a) (b) the security has become enforceable as a result of an insolvency event in respect of a member of the Group; the creditors represented in the Instructing Group or any agent/representative of the creditors represented in the Instructing Group determines in good faith (and notifies each of agent/representative and the Collateral Agent) that to enter into such consultations and thereby delay the commencement of enforcement of the security could reasonably be expected to have a material adverse effect on: (i) (ii) the Collateral Agent s ability to enforce any of the Collateral; or the realization proceeds of any enforcement of the Collateral; (c) (d) a period of no less than three months has elapsed since the Proposed Enforcement Instruction Date and no enforcement is being effected by the Collateral Agent; or the agents/representatives of each creditor class agree no consultation period is required. Turnover Primary Creditors Subject to certain exclusions, if any Noteholder, Super Senior Lender, Pari Passu Creditor or Hedge Counterparty (or any of their respective creditor representatives) receives or recovers the proceeds of any enforcement of any Collateral or any Distressed Disposal (as defined below) except in accordance with Application of Proceeds below, that person must: (a) (b) in relation to amounts not received or recovered by way of set-off, hold that amount on trust for the Collateral Agent and promptly pay an amount equal to that amount to the Collateral Agent; and in relation to receipts and recoveries received or recovered by way of set-off, promptly pay an amount equal to that recovery, in each case, to the Collateral Agent for application in accordance with the provisions of Application of Proceeds below. The Trustee shall only have an obligation to turn over or repay amounts received or recovered by it as described above (i) if it had actual knowledge of that obligation; and (ii) to the extent that, prior to receiving that knowledge, it has not distributed the amount of that receipt to the Noteholders in accordance with the Indenture. Subordinated Creditors There is a general turnover obligation on the Subordinated Creditors to turnover all amounts not received in accordance with the Intercreditor Agreement. 63
64 For example, if, following the occurrence of an insolvency event in respect of any Debtor: (a) (b) a Subordinated Creditor is entitled to receive a distribution out of the assets of that Debtor, that Subordinated Creditor must pay an amount equal to that distribution; or to the extent any liability owed to a Subordinated Creditor is discharged by way of set-off, that Subordinated Creditor must pay an amount equal to the amount discharged by way of set-off; in each case, to the Collateral Agent for application in accordance with the provisions of Application of Proceeds below. Application of Proceeds All amounts from time to time received or recovered by the Collateral Agent in connection with the realization or enforcement of all or any part of the Collateral or otherwise paid to the Collateral Agent under the Intercreditor Agreement for application pursuant thereto shall be held by the Collateral Agent on trust and applied in the following order: first: (a) (b) pro rata and pari passu, in payment of certain amounts owing to the Trustee and any amount owing to any agent/representative for the Super Senior Lenders and the Pari Passu Creditors, the Collateral Agent and any receiver or delegate; and then pro rata and pari passu, in payment of all costs, expenses and liabilities incurred by any agent/representative of the Super Senior Lenders, the Noteholders or the Pari Passu Creditors (but not a Hedge Counterparty in its capacity as its own representative) and any receiver, attorney or agent in connection with any realization or enforcement of the Collateral in accordance with the terms of the Intercreditor Agreement; second, pro rata and pari passu, in payment of all costs and expenses incurred by the Super Senior Lenders and their agent/representative in connection with the enforcement of the Collateral or any action taken at the request of the Collateral Agent; third, pro rata and pari passu, in payment to the agent of the Super Senior Lenders for its own behalf and on behalf of the arrangers of the Super Senior Facilities and the Super Senior Lenders for application towards the discharge of the Super Senior Liabilities and any liabilities owed to the arrangers of the Super Senior Facilities; fourth, pro rata and pari passu, in payment of all costs and expenses incurred by the Noteholders, the Pari Passu Creditors and the Hedge Counterparties and any agent/representative of the Noteholders and the Pari Passu Creditors in connection with the enforcement of the Collateral or any action taken at the request of the Collateral Agent; fifth, pro rata and pari passu, in payment to (i) the Trustee on its own behalf and on behalf of the Noteholders for application towards the discharge of the Notes Liabilities in accordance with the Indenture; (ii) the creditor representatives of the Pari Passu Creditors for application towards the discharge of the Pari Passu Debt; and (iii) the Hedge Counterparties for application towards the discharge of the Hedging Liabilities; and sixth, after amounts referred to above have been repaid in full, in payment of the surplus (if any) to the relevant Debtor or other person entitled to it. 64
65 Option to Purchase The Noteholders and Pari Passu Creditors may, after the occurrence of an acceleration event or the commencement of any enforcement of the Collateral, and subject to various conditions set out in the Intercreditor Agreement (including the grant of an acceptable indemnity against clawback to the Super Senior Lenders), exercise an option to purchase the Super Senior Liabilities in full and at par. Release of Security and Guarantees Non-distressed Disposals In circumstances where a disposal is not a Distressed Disposal (and the applicable agent/representative has notified the Collateral Agent that such disposal is permitted, or is not prohibited, by the terms of the Super Senior Facilities agreement and any Pari Passu Debt documentation and the Issuer certifies for the benefit of the Collateral Agent that such disposal is permitted under, or is not prohibited by, the Indenture or the Trustee authorises the release in accordance with the terms of the Indenture), the Collateral Agent is authorized: (a) (b) to release the Collateral or any other claim over the relevant asset; and if the relevant asset consists of shares in the capital of a Debtor, to release the Collateral or any other claim over that holding company s or Debtor s assets and the assets of any of their subsidiaries. Release of Security and Guarantees Distressed Disposals Distressed Disposal means a disposal of an asset or shares of a member of the Group which is: (a) (b) (c) being effected at the request of the Instructing Group in circumstances where the Collateral has become enforceable; being effected by enforcement of the Collateral; or being effected, after an acceleration event or an enforcement of Collateral has occurred, by a Debtor to a person or persons which is not a member of the Group. In circumstances where a Distressed Disposal is being effected, Collateral Agent is authorized: (a) (b) (c) (d) to release the Collateral or any other claim over the relevant asset; if the asset which is disposed of consists of shares in the capital of a Debtor, to release (i) that Debtor and any subsidiary of that Debtor from all or any part of its borrowing, guaranteeing or other liabilities; (ii) any Collateral granted over that Debtor s assets and the assets of any of its subsidiaries; and (iii) any other claim of a Debtor, an Investor or other intra-group lender over that Debtor s assets or over the assets of any subsidiary of that Debtor; if the asset which is disposed of consists of shares in the capital of any holding company of a Debtor, to release (i) that holding company and any subsidiary of that holding company from all or any part of its borrowing, guaranteeing or other liabilities; (ii) any Collateral granted over the assets of any subsidiary of that holding company; and (iii) any other claim of a Debtor, an Investor or other intra-group lender over the assets of any subsidiary of that holding company; if the asset which is disposed of consists of shares in the capital of a Debtor or any holding company of a Debtor, to dispose of all or any part of that Debtor s or the holding company that Debtor s or any subsidiary of the Debtor or holding company s borrowing, guaranteeing liabilities or other liabilities provided that, if the transferee of such liabilities is to be treated as a Noteholder, Super Senior Lender, Hedge Counterparty or Pari Passu Creditor or otherwise benefit from the Collateral for the purposes of the Intercreditor Agreement, all Notes Liabilities, Super Senior Facilities Liabilities, Hedging Liabilities and Pari Passu Debts must be transferred to that transferee; and 65
66 (e) if the asset which is disposed of consists of shares in the capital of a Debtor or any holding company of a Debtor, to transfer Intra-Group Liabilities and debtor liabilities owed by that Debtor or holding company of a Debtor to another Debtor. Any net proceeds of the disposal must be applied in accordance with the enforcement proceeds waterfall described above under Application of Proceeds. Amendment The Intercreditor Agreement may be amended only with the consent of the Majority Super Senior Creditors, the Trustee, the required percentage of Pari Passu Creditors (as set out in the relevant Pari Passu Debt documentation), the Issuer and the Collateral Agent unless it relates to certain specified matters such as redistributions, application of proceeds, amendments and consents, certain provisions relating to protection of the Collateral Agent s own position and the order of any priority or subordination. Such amendments require consent from all Super Senior Lenders (to the extent such amendments would materially and adversely affect them), the Trustee acting on behalf of the Noteholders (to the extent such amendments would materially and adversely affect them), the agent/representative of the Pari Passu Creditors acting on their behalf (to the extent such amendments would materially and adversely affect the Pari Passu Creditors), each Hedge Counterparty (to the extent such amendments would adversely affect it), the Issuer and the Collateral Agent. No amendment or waiver of the Intercreditor Agreement may impose new or additional obligations on or withdraw or reduce the rights of any party (other than in a way which affects creditors of that party s class generally) to the Intercreditor Agreement without the prior consent of that party or, in relation to the Noteholders or Pari Passu Creditors, the consent of their representatives. The Intercreditor Agreement may be amended without the consent of the Noteholders in certain circumstances set out further in the Indenture. The Intercreditor Agreement also permits the Collateral Agent to enter into new or supplemental security if certain conditions are met, set out further in the Indenture. To the extent the Debtors wish to enter into Pari Passu Debt or other additional or replacement indebtedness ( Additional Indebtedness ) which is permitted to share in the Collateral then the parties to the Intercreditor Agreement may be required to enter into a replacement intercreditor agreement as set out further in the Indenture. 66
67 MILLENNIUM OFFSHORE SERVICES SUPERHOLDINGS L.L.C. AND SUBSIDIARIES Consolidated financial statements and independent auditor s report for the year ended 31 December 2012 Contents Pages Consolidated statement of financial position 68 Consolidated statement of comprehensive income 69 Consolidated statement of changes in equity 70 Consolidated statement of cash flows 71 Notes to the consolidated financial statements 72 67
68 MILLENNIUM OFFSHORE SERVICES SUPERHOLDINGS L.L.C. AND SUBSIDIARIES Consolidated statement of financial position At 31 December 2012 ASSETS Notes USD USD Non-current assets Property and equipment 5 222,846, ,205,426 Current assets Inventories 6 3,240,637 1,279,085 Due from a related party 7-133,633 Trade and other receivables 8 19,657,205 17,136,406 Bank balances and cash 9 19,479,095 4,636,866 Total current assets 42,376,937 23,185,990 Total assets 265,223, ,391,416 EQUITY AND LIABILITIES Equity Capital contribution 10 96,705,765 96,705,765 Retained earnings 102,659,373 50,916,814 Total equity 199,365, ,622,579 Non-current liabilities Provision for employees end of service indemnity , ,001 Other financial liabilities 12-11,600,000 Bank borrowings 13-26,305,700 Derivative financial instrument ,728 1,158,056 Total non-current liabilities 724,251 39,321,757 Current liabilities Other financial liabilities 12 17,429,500 5,900,000 Bank borrowings 13 26,325,326 17,475,540 Due to a related party 7 7,928,155 3,498,446 Trade and other payables 15 13,450,957 41,573,094 Total current liabilities 65,133,938 68,447,080 Total liabilities 65,858, ,768,837 Total equity and liabilities 265,223, ,391,416 Managing Director Finance Director The accompanying notes form an integral part of these consolidated financial statements. 68
69 MILLENNIUM OFFSHORE SERVICES SUPERHOLDINGS L.L.C. AND SUBSIDIARIES Consolidated statement of comprehensive income For the year ended 31 December 2012 Notes USD USD Revenue ,062,175 58,939,388 Direct costs 17 (54,829,016) (41,462,775) Gross profit 72,233,159 17,476,613 General and administrative expenses 18 (8,449,351) (4,694,792) Unrealised gain on fair valuation of interest rate swap ,328 1,117,694 Finance costs: - Bank borrowings and trade payables (2,504,776) (2,438,982) - Recharged by Parent Company 7 (3,988,603) - Other (expense)/income (211,588) 483,377 Profit before tax 57,925,169 11,943,910 Income tax expense (6,182,610) (1,316,291) Profit for the year 51,742,559 10,627,619 Other comprehensive income for the year - - Total comprehensive income for the year 51,742,559 10,627,619 The accompanying notes form an integral part of these consolidated financial statements. 69
70 MILLENNIUM OFFSHORE SERVICES SUPERHOLDINGS L.L.C. AND SUBSIDIARIES Consolidated statement of changes in equity For the year ended 31 December 2012 Capital Retained contribution earnings Total USD USD USD Balance at 31 December ,705,765 40,289, ,994,960 Additional capital contributed 30,000,000-30,000,000 Total comprehensive income for the year - 10,627,619 10,627,619 Balance at 31 December ,705,765 50,916, ,622,579 Total comprehensive income for the year - 51,742,559 51,742,559 Balance at 31 December ,705, ,659, ,365,138 The accompanying notes form an integral part of these consolidated financial statements. 70
71 MILLENNIUM OFFSHORE SERVICES SUPERHOLDINGS L.L.C. AND SUBSIDIARIES Consolidated statement of cash flows For the year ended 31 December USD USD Cash flows from operating activities Profit for the year 51,742,559 10,627,619 Adjustments for: Depreciation of property and equipment 19,604,074 14,129,793 Gain on disposal of property and equipment (28,708) (46,574) Unrealised gain on fair valuation of interest rate swap (846,328) (1,117,694) Finance costs 6,493,379 2,438,982 Income tax expenses 6,182,610 1,316,291 Provision for employees end of service indemnity 157, ,086 Operating cash flows before changes in operating assets and liabilities 83,305,129 27,462,503 Increase in inventories (1,961,552) (728,206) Decrease/(increase) in due from a related party 133,633 (133,633) Increase in trade and other receivables (2,591,299) (6,874,837) Increase in due to a related party 4,429,709 2,715,406 (Decrease)/increase in trade and other payables (32,042,817) 33,904,638 Net cash generated from operating activities 51,272,803 56,345,871 Finance costs paid (6,440,590) (2,344,143) Income tax paid (2,314,719) (496,719) Employee s end of service indemnity paid (3,021) (125,104) Net cash flows from operating activities 42,514,473 53,379,905 Cash flows from investing activities Purchase of property and equipment (10,260,439) (67,459,636) Proceeds from disposal of property and equipment 44,109 46,574 Decrease/(increase) in fixed deposits 1,297 (466,942) Net cash used in investing activities (10,215,033) (67,880,004) Cash flows from financing activities Loans repaid during the year (17,165,500) (14,000,100) Decrease in bank overdraft (290,414) (74,860) Additional capital contribution - 30,000,000 Net cash (used in)/generated from financing activities (17,455,914) 15,925,040 Net increase in cash and cash equivalents 14,843,526 1,424,941 Cash and cash equivalents at the beginning of the year 3,219,924 1,794,983 Cash and cash equivalents at the end of the year (Note 9) 18,063,450 3,219,924 Note: In 2011, addition to property and equipment of USD 17.5 million is not reflected in the consolidated statement of cash flows (Note 12). The accompanying notes form an integral part of these consolidated financial statements. 71
72 MILLENNIUM OFFSHORE SERVICES SUPERHOLDINGS L.L.C. AND SUBSIDIARIES Notes to the consolidated financial statements For the year ended 31 December General information Millennium Offshore Services Superholdings L.L.C. Republic of the Marshall Islands (the Company ) was incorporated on 12 June 2007 under the Limited Liability Company Act 1996 of the Republic of Marshall Islands. The address of the Company s registered office is Trust Company Complex, Ajeltake Island, Ajeltake Road, Majuro, Marshall Islands (MH 96960). The Group comprises Millennium Offshore Services Superholdings L.L.C. and Subsidiaries (see Note 3). Millennium Offshore Services L.L.C. is the Ultimate Holding Company. The principal activity of the Company is to invest in stocks and other securities of companies engaged in the business of purchasing, maintaining, operating and investing in floating accommodation units. 2. Application of new and revised International Financial Reporting Standards (IFRSs) 2.1 New and revised International Financial Reporting Standards (IFRSs) adopted with no material effect on the consolidated financial statements The following new and revised IFRSs have been adopted in these consolidated financial statements. The adoption of these new and revised IFRSs has not had any material impact on the amounts reported for the current and prior periods but may affect the accounting for future transactions or arrangements. Effective for annual periods New and revised IFRSs beginning on or after Amendments to IFRS 1 Severe Hyperinflation 1 July 2011 Amendments to IFRS 1 Removal of Fixed Dates for First-time Adopters 1 July 2011 Amendments to IFRS 7 Disclosures Transfers of Financial Assets 1 July 2011 Amendments to IAS 12 Deferred Tax: Recovery of Underlying Assets 1 January New and revised International Financial Reporting Standards (IFRSs) in issue but not yet effective and not early adopted The Group has not yet adopted the following new and revised IFRSs that have been issued but are not yet effective: Effective for annual periods New and revised IFRSs beginning on or after IFRS 9 Financial Instruments (as revised in 2010) 1 January 2015 Amendments to IFRS 9 and IFRS 7 Mandatory Effective Date of IFRS 9 and Transition Disclosures 1 January 2015 IFRS 10 Consolidated Financial Statements* 1 January
73 MILLENNIUM OFFSHORE SERVICES SUPERHOLDINGS L.L.C. AND SUBSIDIARIES Notes to the consolidated financial statements For the year ended 31 December 2012 (continued) 2. Application of new and revised International Financial Reporting Standards (IFRSs) (continued) 2.2 New and revised International Financial Reporting Standards (IFRSs) in issue but not yet effective and not early adopted (continued) New and revised IFRSs Effective for annual periods beginning on or after IFRS 11 Joint Arrangements* 1 January 2013 IFRS 12 Disclosure of Interests in Other Entities* 1 January 2013 Amendments to IFRS 10, IFRS 11 and IFRS 12 Consolidated Financial Statements, Joint Arrangements and Disclosure of Interests in Other Entities: Transition Guidance 1 January 2013 IAS 27 Separate Financial Statements (as revised in 2011)* 1 January 2013 IAS 28 Investments in Associates and Joint Ventures (as revised in 2011)* 1 January 2013 IFRS 13 Fair Value Measurement 1 January 2013 IAS 19 Employee Benefits (as revised in 2011) 1 January 2013 Amendments to IFRS 1 Government Loans 1 January 2013 Amendments to IFRS 7 Disclosures Offsetting Financial Assets and Financial Liabilities Amendments to IAS 1 Presentation of Items of Other Comprehensive Income Amendments to IAS 32 Offsetting Financial Assets and Financial Liabilities Annual Improvements to IFRSs Cycle Amendments to IFRS 1 First-time Adoption of International Financial Reporting Standards, IAS 1 Presentation of Financial Statements, IAS 16 Property, Plant and Equipment, IAS 32 Financial Instruments: Presentation, IAS 34 Interim Financial Reporting IFRIC 20 Stripping Costs in the Production Phase of a Surface Mine Amendments to IFRS 10 Consolidated Financial Statements, IFRS 12 Disclosure of Interests in Other Entities and IAS 27 Separate Financial Statements 1 January July January January January January 2014 * In May 2011, a package of five Standards on consolidation, joint arrangements, associates and disclosures was issued, including IFRS 10, IFRS 11, IFRS 12, IAS 27 (as revised in 2011) and IAS 28 (as revised in 2011). These five standards are effective for annual periods beginning on or after 1 January Earlier application is permitted provided that all of these five standards are applied early at the same time. 73
74 MILLENNIUM OFFSHORE SERVICES SUPERHOLDINGS L.L.C. AND SUBSIDIARIES Notes to the consolidated financial statements For the year ended 31 December 2012 (continued) 2. Application of new and revised International Financial Reporting Standards (IFRSs) (continued) 2.2 New and revised International Financial Reporting Standards (IFRSs) in issue but not yet effective and not early adopted (continued) The directors anticipate that these new standards, interpretations and amendments will be adopted in the Group s consolidated financial statements for the period beginning 1 January 2013 or as and when they are applicable and adoption of these new standards, interpretations and amendments may have no material impact on the consolidated financial statements of the Group in the period of initial application. 3. Significant accounting policies 3.1 Statement of compliance The consolidated financial statements have been prepared in accordance with International Financial Reporting Standards (IFRS). 3.2 Basis of preparation The consolidated financial statements have been prepared on the historical cost basis, except for the revaluation of financial instruments that have been measured at fair value. Historical cost is generally based on the fair value of the consideration given in exchange for assets. The principal accounting policies adopted are set out below: 3.3 Basis of consolidation The consolidated financial statements of Millennium Offshore Services Superholdings L.L.C. and Subsidiaries (the "Group") incorporate the financial statements of the Company and entities controlled by the Company (its subsidiaries). Control is achieved where the Company has the power to govern the financial and operating policies of an entity so as to obtain benefits from its activities. All intra-group transactions, balances, income and expenses are eliminated in full on consolidation. 74
75 MILLENNIUM OFFSHORE SERVICES SUPERHOLDINGS L.L.C. AND SUBSIDIARIES Notes to the consolidated financial statements For the year ended 31 December 2012 (continued) 3. Significant accounting policies (continued) 3.4 Subsidiaries Details of the Company's subsidiaries at 31 December 2012 are as follows: Name of subsidiary Millennium Offshore Services Holdings L.L.C. and Subsidiaries Millennium Offshore Services Management L.L.C. Millennium Offshore Services Management PTE Millennium Offshore Services PTE Burj L.L.C. Place of incorporation Republic of the Marshall Islands Republic of the Marshall Islands Proportion of ownership Principal interest activity 100% Management of business of its subsidiaries. 100% Management of business of its subsidiaries. Singapore 100% Management of business of its subsidiaries. Singapore 100% Providing offshore accomodation facilities on rental Republic of the Marshall Islands 100% Providing offshore accomodation facilities on rental 3.5 Revenue recognition Revenue is measured at the fair value of the consideration received or receivable. Revenue is reduced for estimated customer returns, rebates and other similar allowances Rendering of services Revenue from services is recognised when the services are rendered Rental of Offshore accommodation units Rental income of offshore accommodation units is recognised on the basis of accommodation facilities utilised by customers. 3.6 Foreign currencies The consolidated financial statements of the Group are presented in the currency of the primary economic environment in which the Group operates (its functional currency). For the purpose of the consolidated financial statements, the results and financial position of the Group are expressed in United States Dollars ( USD ), which is the functional currency of the Group and the presentation currency for the consolidated financial statements. In preparing the consolidated financial statements of the Group, transactions in currencies other than the Group s functional currency (foreign currencies) are recorded at the rates of exchange prevailing at the dates of the transactions. At the end of each reporting period, monetary items denominated in foreign currencies are retranslated at the rates prevailing at that date. Non-monetary items carried at fair value that are denominated in foreign currencies are retranslated at the rates prevailing at the date when the fair value was determined. Nonmonetary items that are measured in terms of historical cost in a foreign currency are not retranslated. Exchange differences are recognised in profit or loss in the period in which they arise. 75
76 MILLENNIUM OFFSHORE SERVICES SUPERHOLDINGS L.L.C. AND SUBSIDIARIES Notes to the consolidated financial statements For the year ended 31 December 2012 (continued) 3. Significant accounting policies (continued) 3.7 Borrowing costs Borrowing costs directly attributable to the acquisition, construction or production of qualifying assets, which are assets that necessarily take a substantial period of time to get ready for their intended use or sale, are added to the cost of those assets, until such time as the assets are substantially ready for their intended use or sale. Investment income earned on the temporary investment of specific borrowings pending their expenditure on qualifying assets is deducted from the borrowing costs eligible for capitalisation. All other borrowing costs are recognised in profit or loss in the year in which they are incurred. 3.8 Property and equipment Property and equipment, except capital work-in-progress are stated at their cost, less any accumulated depreciation and any identified impairment losses. Properties in the course of construction for production, rental or administrative purposes, or for purposes not yet determined, are carried at cost, less any recognised impairment loss. Cost includes professional fees and, for qualifying assets, borrowing costs capitalised in accordance with the Group s accounting policy. Depreciation of these assets, on the same basis as other property assets, commences when the assets are ready for their intended use. Depreciation is charged so as to write off the cost of assets, over their estimated useful lives, using the straight-line method. The estimated useful lives, residual values and depreciation method are reviewed at each year end, with the effect of any changes in estimate accounted for on a prospective basis. Depreciation on offshore accommodation units is calculated after considering the salvage value. The gain or loss arising on disposal or retirement of an item of property and equipment is determined as the difference between the sales proceeds and the carrying amount of the asset and is recognised in profit or loss. Upon acquisition of an offshore accommodation unit, the components of the unit which are required to be replaced at the next dry-docking are identified and their costs are depreciated over the period to the next estimated dry-docking date. Costs incurred on subsequent dry-docking of offshore accommodation units are capitalised and depreciated over the period to the next estimated dry-docking date. When significant dry-docking costs incurred prior to the expiry of the depreciation period, the remaining costs of the previous dry-docking are written off immediately. The following useful lives are used in calculation of depreciation: Years Offshore accommodation units Offshore accommodation units upgrade 5 Offshore accommodation units equipment 5 Furniture, fixtures & office equipment 2-5 Motor vehicles 2 Dry docking costs (included with offshore accommodation units) 5 76
77 MILLENNIUM OFFSHORE SERVICES SUPERHOLDINGS L.L.C. AND SUBSIDIARIES Notes to the consolidated financial statements For the year ended 31 December 2012 (continued) 3. Significant accounting policies (continued) 3.9 Impairment of tangible assets At the end of each reporting period, the Group reviews the carrying amounts of its tangible assets to determine whether there is any indication that those assets have suffered an impairment loss. If any such indication exists, the recoverable amount of the asset is estimated in order to determine the extent of the impairment loss (if any). Where it is not possible to estimate the recoverable amount of an individual asset, the Group estimates the recoverable amount of the cash-generating unit to which the asset belongs. Where a reasonable and consistent basis of allocation can be identified, corporate assets are also allocated to individual cash-generating units, or otherwise they are allocated to the smallest group of cash-generating units for which a reasonable and consistent allocation basis can be identified. Recoverable amount is the higher of fair value less costs to sell and value in use. In assessing value in use, the estimated future cash flows are discounted to their present value using a discount rate that reflects current market assessments of the time value of money and the risks specific to the asset for which the estimates of future cash flows have not been adjusted. If the recoverable amount of an asset (or cash-generating unit) is estimated to be less than its carrying amount, the carrying amount of the asset (cash-generating unit) is reduced to its recoverable amount. An impairment loss is recognised immediately in profit or loss, unless the relevant asset is carried at a revalued amount, in which case the impairment loss is treated as a revaluation decrease. Where an impairment loss subsequently reverses, the carrying amount of the asset (cash-generating unit) is increased to the revised estimate of its recoverable amount, but so that the increased carrying amount does not exceed the carrying amount that would have been determined had no impairment loss been recognised for the asset (cash-generating unit) in prior years. A reversal of an impairment loss is recognised immediately in profit or loss, unless the relevant asset is carried at a revalued amount, in which case the reversal of the impairment loss is treated as a revaluation increase Inventories Spares, consumables and supplies are stated at the lower of cost and net realisable value. Cost is calculated using the FIFO method Income tax Provision for current tax is based on taxable income at the applicable rate of income tax after taking into account tax credits and rebates, if any. The Group takes into account the current applicable tax law and decision taken by taxation authorities Provisions Provisions are recognised when the Group has a present obligation (legal or constructive) as a result of a past event, it is probable that the Group will be required to settle the obligation, and a reliable estimate can be made of the amount of the obligation. The amount recognised as a provision is the best estimate of the consideration required to settle the present obligation at the reporting date, taking into account the risks and uncertainties surrounding the obligation. Where a provision is measured using the cash flows estimated to settle the present obligation, its carrying amount is the present value of those cash flows. 77
78 MILLENNIUM OFFSHORE SERVICES SUPERHOLDINGS L.L.C. AND SUBSIDIARIES Notes to the consolidated financial statements For the year ended 31 December 2012 (continued) 3. Significant accounting policies (continued) 3.13 Financial instruments Financial assets and financial liabilities are recognised when the Group becomes a party to the contractual provisions of the instrument. Financial assets and financial liabilities are initially measured at fair value. Transaction costs that are directly attributable to the acquisition or issue of financial assets and financial liabilities are added to or deducted from the fair value of the financial assets or financial liabilities, as appropriate, on initial recognition Financial assets The Group s financial assets include bank balances and cash, trade and other receivables (excluding prepaid expenses and advances to suppliers) and due from a related party. Trade and other receivables (excluding prepaid expenses and advances to suppliers) and due from a related party are classified as loans and receivables. The classification depends on the nature and purpose of the financial assets and is determined at the time of initial recognition. The effective interest method is a method of calculating the amortised cost of a financial asset and of allocating interest income over the relevant period. The effective interest rate is the rate that exactly discounts estimated future cash receipts through the expected life of the financial asset, or, where appropriate, a shorter period Cash and cash equivalents Cash and cash equivalents comprise cash on hand and demand deposits and other short-term highly liquid investments that are readily convertible to a known amount of cash and are subject to an insignificant risk of changes in value Loans and receivables Loans and receivables that have fixed or determinable payments are initially measured at fair value and subsequently measured at amortised cost using the effective interest method, less any impairment Impairment of financial assets Financial assets are assessed for indicators of impairment at the end of each reporting period. Financial assets are impaired where there is objective evidence that, as a result of one or more events that occurred after the initial recognition of the financial asset, the estimated future cash flows of the financial asset have been impacted. For financial assets carried at amortised cost, the amount of the impairment is the difference between the asset s carrying amount and the present value of estimated future cash flows, discounted at the original effective interest rate. For certain categories of financial asset, such as trade receivables, assets that are assessed not to be impaired individually are subsequently assessed for impairment on a collective basis. Objective evidence of impairment for a portfolio of receivables could include the Group s past experience of collecting payments, an increase in the number of delayed payments, as well as observable changes in national or local economic conditions that correlate with default on receivables. 78
79 MILLENNIUM OFFSHORE SERVICES SUPERHOLDINGS L.L.C. AND SUBSIDIARIES Notes to the consolidated financial statements For the year ended 31 December 2012 (continued) 3. Significant accounting policies (continued) 3.14 Financial assets (continued) Impairment of financial assets (continued) The carrying amount of the financial asset is reduced by the impairment loss directly for all financial assets with the exception of trade receivables where the carrying amount is reduced through the use of an allowance account. When a trade receivable is uncollectible, it is written off against the allowance account. Subsequent recoveries of amounts previously written off are credited against the allowance account. Changes in the carrying amount of the allowance account are recognised in profit or loss. If, in a subsequent period, the amount of the impairment loss decreases and the decrease can be related objectively to an event occurring after the impairment was recognised, the previously recognised impairment loss is reversed through profit or loss to the extent that the carrying amount of the financial asset at the date the impairment is reversed does not exceed what the amortised cost would have been had the impairment not been recognised Derecognition of financial assets The Group derecognises a financial asset only when the contractual rights to the cash flows from the asset expire; or it transfers the financial asset and substantially all the risks and rewards of ownership of the asset to another entity. If the Group neither transfers nor retains substantially all the risks and rewards of ownership and continues to control the transferred asset, the Group recognises its retained interest in the asset and an associated liability for amounts it may have to pay Financial liabilities and equity instruments issued by the Group Classification as debt or equity Debt and equity instruments are classified as either financial liabilities or as equity in accordance with the substance of the contractual arrangement Equity instruments An equity instrument is any contract that evidences a residual interest in the assets of an entity after deducting all of its liabilities. Equity instruments issued by the Group are recorded at the proceeds received, net of direct issue costs Financial liabilities Bank borrowings, due to related parties, trade and other payables (excluding provision for income tax and advances from customers) and derivative financial instrument are classified as other financial liabilities. The effective interest method is a method of calculating the amortised cost of a financial liability and of allocating interest expense over the relevant period. The effective interest rate is the rate that exactly discounts estimated future cash payments through the expected life of the financial liability, or, where appropriate, a shorter period Other financial liabilities Other financial liabilities are initially measured at fair value, net of transaction costs and are subsequently measured at amortised cost using the effective interest method, with interest expense recognised on an effective yield basis. 79
80 MILLENNIUM OFFSHORE SERVICES SUPERHOLDINGS L.L.C. AND SUBSIDIARIES Notes to the consolidated financial statements For the year ended 31 December 2012 (continued) 3. Significant accounting policies (continued) 3.15 Financial liabilities and equity instruments issued by the Group (continued) Derecognition of financial liabilities The Group derecognises financial liabilities when, and only when, the Group s obligations are discharged, cancelled or they expire Derivative financial instruments The Group enters into interest rates swap derivative transactions to manage its exposure to interest rate risk. Derivatives financial instruments are initially recognised at fair value at the date a derivative contract is entered into and are subsequently re-measured to their fair value at the end of each reporting period. All the derivatives financial instruments are carried at their fair values as assets where the fair values are positive and as liabilities where the fair values are negative. A derivative financial instrument is presented as non-current assets or a non-current liability if the remaining maturity of the instrument is more than 12 months and it is not expected to be realised or settled within 12 months. Other derivative financial instruments are presented as current assets or current liabilities. 4. Critical accounting judgements and key sources of estimation uncertainty In the application of the Group s accounting policies, which are described in Note 3, Management is required to make judgements, estimates and assumptions about the carrying amounts of assets and liabilities that are not readily apparent from other sources. The estimates and associated assumptions are based on historical experience and other factors that are considered to be relevant. Actual results may differ from these estimates. The estimates and underlying assumptions are reviewed on an ongoing basis. Revisions to accounting estimates are recognised in the period in which the estimate is revised if the revision affects only that period, or in the period of the revision and future periods if the revision affects both current and future periods. 4.1 Critical judgements in applying accounting policies In the process of applying Group s accounting policies, Management is of the opinion that the following is the instance of application of judgement which is expected to have a significant effect on the amounts recognised in the consolidated financial statements, apart from those involving estimations described below Fair value of derivative financial instruments At 31 December 2012 the Group has outstanding interest rate swaps for nominal values of USD million as disclosed in the Note 14 to these consolidated financial statements. The fair value of this interest rate swap has been determined as such in accordance with best market practice and using observable market data. 80
81 MILLENNIUM OFFSHORE SERVICES SUPERHOLDINGS L.L.C. AND SUBSIDIARIES Notes to the consolidated financial statements For the year ended 31 December 2012 (continued) 4. Critical accounting judgements and key sources of estimation uncertainty (continued) 4.1 Critical judgements in applying accounting policies (continued) Fair value of derivative financial instruments (continued) The derivative instrument becomes favourable (asset) or unfavourable (liability) as a result of fluctuations in market interest rates relative to the terms agreed with the counter party. At 31 December 2012, the fair value of this instrument is favourable to the Group. However, the fair value could fluctuate significantly from time to time and may result in further losses or gains in the future periods. 4.2 Key sources of estimation uncertainty The following are the key assumptions concerning the future, and other key sources of estimation uncertainty at the reporting date, that have a significant risk of causing a material adjustment to the carrying amounts of assets and liabilities within the next financial year Impairment of trade receivables An estimate of the collectible amount of trade receivables is made when collection of the full amount is no longer probable. This determination of whether these trade receivables are impaired, entails the Group evaluating, the credit and liquidity position of the customers, historical recovery rates and collateral requirements from certain customers in certain circumstances. The difference between the estimated collectible amount and the book amount is recognised as an expense in the profit or loss. Any difference between the amounts actually collected in the future periods and the amounts expected will be recognised in the profit or loss at the time of collection Property and equipment The cost of property and equipment is depreciated over the estimated useful life, which is based on expected usage of the asset, expected physical wear and tear, the repair and maintenance program and technological obsolescence arising from changes and the residual value Income tax The Group has exposure to income taxes in numerous jurisdictions. Significant judgement is involved in determining the group-wide provision for income taxes. There are certain transactions and computation for which the ultimate tax determination is uncertain during the course of business. The Group recognises liabilities for expected tax issues based on estimates of whether additional taxes will be due. Where the final tax outcome of these matters is different from the amounts that were initially recognised, such differences will impact income tax in the period in which such determination is made.. 81
82 MILLENNIUM OFFSHORE SERVICES SUPERHOLDINGS L.L.C. AND SUBSIDIARIES Notes to the consolidated financial statements For the year ended 31 December 2012 (continued) 5. Property and equipment Offshore accommodation Offshore accommodation Offshore accommodation Furniture, fixtures and office Motor Capital work- Units units upgr ade units equipment equipment vehicles in-progress Total USD USD USD USD USD US D USD Cost At 31 December ,172,473 14,224, ,748,751 1,635, ,426 1,034, ,948,497 Additions 1,214,534 1,946, , ,946 90,822 84,677,480 88,105,937 Transfers - - 2,458, (2,458,707) - Disposals (69,590) - (69,590 At 31 December ,387,007 16,170, ,268,446 1,751, ,658 83,252, ,984,844 Additions 5,184,176 1,034, 867 1,917, , ,960 1,810,939 10,260,439 Transfers 82,690,772 (3,500,084) 3,753,096 (253,012) - (82,690,772) - Disposals (85,890) - (85,890 At 31 December ,261,955 13,705, ,938,914 1,633, ,728 2,372, ,159,393 Accumulated depreciation At 31 December ,341,041 3,177, 410 4,069,576 1,041,454 89,734-33,719,215 Charge for the year 7,958,101 2,537, 706 3,281, ,376 59,434-14,129,793 Eliminated on disposals (69,590) - (69,590 At 31 December ,299,142 5,715, 116 7,350,752 1,334,830 79,578-47,779,418 Charge for the year 13,024,942 2,629, 514 3,768,022 91,899 89,697-19,604,074 Eliminated on disposals (70,489) - (70,489 At 31 December ,324,084 8,344, ,118,774 1,426,729 98,786-67,313,003 Carry ing amount At 31 December ,937,871 5,360, 374 8,820, , ,942 2,372, ,846,390 At 31 December ,087,865 10,455, 105 6,917, ,909 75,080 83,252, ,205,426 82
83 MILLENNIUM OFFSHORE SERVICES SUPERHOLDINGS L.L.C. AND SUBSIDIARIES Notes to the consolidated financial statements For the year ended 31 December 2012 (continued) 5. Property and equipment (continued) Offshore accommodation units with carrying amount as at 31 December 2012 of USD million (2011: USD million) are mortgaged to a bank and insurance policy covering them are assigned to a bank against facilities granted to the Group (Note 13). At 31 December 2012, the cost of fully depreciated property and equipment that is still in use amounted to USD 1,599,145 (2011: Nil). Capital work in progress includes advances paid for dry docking. Borrowings cost charged by Parent Company on funds specifically borrowed for obtaining qualifying asset amounting to USD Nil (2011: USD 3,146,301) has been capitalised (Note 7). 6. Inventories USD USD Spares, consumables and supplies 3,240,637 1,279,085 ============ ============= 7. Related party transactions Related parties include the Group s major Shareholders, Directors and businesses controlled by them and their families over which they exercise significant management influence as well as key management personnel. At the reporting date, amount due from/to related party was as follows: Due from a related party USD USD MMEER Inc ,633 ============ ============= Due to a related party Millennium Offshore Services L.L.C. ( the Parent Company ) 7,928,155 3,498,446 ============ ============= The amounts outstanding are unsecured and will be settled in cash. No guarantees have been given. 83
84 MILLENNIUM OFFSHORE SERVICES SUPERHOLDINGS L.L.C. AND SUBSIDIARIES Notes to the consolidated financial statements For the year ended 31 December 2012 (continued) 7. Related party transactions (continued) During the year, the Group entered into the following transactions with related parties: USD USD Other income - 446,862 Interest charged by the Parent Company 3,988,603 3,146,301 Recharge for equity settled employee benefits (Note 18) 636, ,163 Management expense 17,306,153 9,567,503 Transactions with related parties were carried out on terms agreed with the management. Compensation of directors/key management personnel: USD USD Directors remuneration 1,001,300 1,155, Trade and other receivables USD USD Trade receivables 17,737,749 15,795,624 Prepaid expenses 1,311,256 1,081,691 Other receivables 608, , ,657,205 17,136,406 ============ ============= The average credit period ranges between days. Trade receivables more than 90 days are provided for based on estimated irrecoverable amounts, determined by reference to past default experience in addition to specific provision made on identified customers. Before accepting any new customer, the Group assesses the potential customer s credit quality and defines credit limits by customer. Of the trade receivable balance at the end of year, USD 4,788,353 (2011: USD 10,894,908) is due from the Group s largest customer. Trade receivables disclosed above include amounts (see below for aged analysis) that are past due at the end of the reporting period. These amounts pertains to amounts withheld by a customer pending receipt of tax clearance certificate from the Group. Management is in the process of obtaining the clearance and accordingly no allowance is provided against the above over due balance. The Group does not hold any collateral or other credit enhancements over these balances nor does it have a legal right of offset against any amounts owed by the Group to the counterparty. Ageing of past due but not impaired: USD USD 91 days and above 228, ,688 ============ ============= 84
85 MILLENNIUM OFFSHORE SERVICES SUPERHOLDINGS L.L.C. AND SUBSIDIARIES Notes to the consolidated financial statements For the year ended 31 December 2012 (continued) 9. Bank balances and cash USD USD Cash on hand - 14,000 Bank balances: Current accounts 18,063,450 3,205,924 Fixed deposits 1,415,645 1,416, Bank balances and cash 19,479,095 4,636,866 Short term deposits under lien with original maturities greater than three months (1,415,645) (1,416,942) Cash and cash equivalents 18,063,450 3,219,924 ============ ============= 10. Capital contribution As per Limited Liability Agreement dated 12 June 2007, the Company was registered and is wholly owned by Millennium Offshore Services L.L.C. (the Parent Company ). The Parent Company shall be liable for all the funding requirements of the Company and based on underlying capital contribution agreement, MOS has funded USD 66,705,765 during the year ended 31 December 2008 and an additional contribution of USD 30,000,000 was made in year The capital contribution has been authorized and approved by shareholders of MOS. The Capital contributions from MOS are being treated as Equity Instruments whereby MOS will have residual interest in the assets of the Company after deducting all its liabilities. No additional funding was made during the year ended 31 December Provision for employees end of service indemnity Movements in the net liability were as follows: USD USD Balance at the beginning of the year 258, ,019 Provision for the year 157, ,086 Amount paid (3,021) (125,104) Balance at the end of the year 412, ,001 ============ ============= 12. Other financial liabilities USD USD Contingent consideration payable 17,429,500 17,500,000 Less: Amount due for settlement after 12 months (shown under non-current liabilities) - (11,600,000) Amount due for settlement within 12 months (shown under current liabilities) 17,429,500 5,900,000 =========== =============
86 MILLENNIUM OFFSHORE SERVICES SUPERHOLDINGS L.L.C. AND SUBSIDIARIES Notes to the consolidated financial statements For the year ended 31 December 2012 (continued) 12. Other financial liabilities (continued) The Group has acquired an offshore accommodation unit (the unit ) and as part of purchase agreement the Group has to pay USD 17,500,000 which is contingent upon the net profit earned by Unit as defined in the purchase agreement. Based on the cash-flow and profit forecasts prepared by the Group, the Group has considered the full amount of USD 17,500,000 (31 December 2011: USD 5,900,000) to be paid under the purchase agreement within one year. The balance outstanding as at 31 December 2012 is after setting off USD 70,500 receivable from vendor. 13. Bank borrowings USD USD Overdraft 19, ,040 Term loans 26,305,700 43,471, ,325,326 43,781,240 ============ ============= The bank borrowings are repayable as follows: On demand or within one year 26,325,326 17,475,540 In the second year - 26,305,700 In the third to fifth year inclusive ,325,326 43,781,240 Less: Amount due for settlement within 12 months (shown under current liabilities) (26,325,326) (17,475,540) Amount due for settlement after 12 months - 26,305,700 ============ ============= The principal terms of the Group s borrowings are as follows: (i) (ii) Bank overdraft is repayable on demand The Group has two six year term loans; (a) (b) loan of USD 63,300,000 obtained in June 2007, repayable in quarterly instalments of USD 2,313,000 each commencing from 28 December The outstanding balance as of 31 December 2012 is USD 14,727,000 (2011: USD 23,979,000). The interest rate is linked to LIBOR plus applicable margin. loan of USD 41,650,000 obtained in October 2007, repayable in quarterly installments of USD 1,582,700 each commencing from 10 April The outstanding balance as of 31 December 2012 is USD 11,578,700 (2011: USD 19,492,200). The interest rate is linked to LIBOR plus applicable margin. At 31 December 2012, bank facilities are secured by mortgage over offshore accommodation units along with assignment of their insurance policies (Note 5) and corporate guarantee of the Parent Company. The bank s facilities are subject to certain financial covenants including the maintenance of certain financial ratios. 86
87 MILLENNIUM OFFSHORE SERVICES SUPERHOLDINGS L.L.C. AND SUBSIDIARIES Notes to the consolidated financial statements For the year ended 31 December 2012 (continued) 14. Derivative financial instrument USD USD Interest rate swap 311,728 1,158,056 ============ ============= The Group uses interest rate swap to manage its exposure to interest rate movements on its bank borrowings by entering into interest rate swap to convert a proportion of those borrowings from floating rates to fixed rates liabilities. Contracts with nominal values of US$ million have fixed interest payments quarterly and have floating interest receipts linked to LIBOR. At 31 December 2012 the unrealised gain on changes in fair value of swap is USD 846,328 (2011: unrealised gain of USD 1,117,694) which has been taken to the statement of comprehensive income for the year ended 31 December Trade and other payables USD USD Trade payables 5,274,604 13,591,605 Accruals and other payables 2,831,678 26,504,705 Provision for income tax 5,344,675 1,476, ,450,957 41,573,094 ============ ============= 16. Revenue USD USD Rental of offshore accommodation units 109,485,146 47,908,800 Service income 17,577,029 11,030, ,062,175 58,939,388 ============ ============= Revenue has been generated from 5 customers (2011: 4 customers). 87
88 MILLENNIUM OFFSHORE SERVICES SUPERHOLDINGS L.L.C. AND SUBSIDIARIES Notes to the consolidated financial statements For the year ended 31 December 2012 (continued) 17. Direct costs USD USD Staff costs 12,425,744 7,002,039 Sub-contract charges 5,556,530 4,297,670 Depreciation of property and equipment 19,422,478 13,776,983 Other direct expenses 17,424,264 16,386, ,829,016 41,462,775 ============ ============= 18. General and administrative expenses USD USD Staff costs 4,880,409 2,565,465 Legal and professional fees 1,065, ,283 Depreciation of property and equipment 181, ,810 Rent 1,026, ,210 Traveling expenses 673, ,315 Other direct expense 621, , ,449,351 4,694,792 ============ ============= Staff costs includes USD 636,535 (2011: USD 174,163), being amount recharged to the Group by the Ultimate Parent Company against the equity settled employee benefits provided to employees working for managing the Group. 19. Contingent liabilities USD USD Letters of guarantee 1,400,000 1,416,942 The above letters of guarantee have been issued by the agent of the Group on behalf of the Group. 20. Capital risk management The Group manages its capital to ensure that the Group will be able to continue as a going concern while maximising the return to stakeholders. The Group s overall strategy remains unchanged from The capital structure of the Group consists of bank balances and cash, bank borrowings and equity comprising capital contribution and retained earnings. 88
89 MILLENNIUM OFFSHORE SERVICES SUPERHOLDINGS L.L.C. AND SUBSIDIARIES Notes to the consolidated financial statements For the year ended 31 December 2012 (continued) 20. Capital risk management (continued) 20.1 Gearing of debt/equity The Group s management reviews the capital structure on regular basis. As part of this review, the management considers the cost of capital and the risks associated with capital. The gearing ratio at the year end was as follows: USD USD Debt (i) 26,325,326 43,781,240 Bank balances and cash (19,479,095) (4,636,866) Net debt 6,846,231 39,144,374 ============ ============= Equity (ii) 199,365, ,622,579 ============ ============= Debt/Equity (ratio) ============ ============= (i) Debt is defined as bank borrowings (Note 13). (ii) Equity comprises capital contribution and retained earnings. 21. Financial instruments 21.1 Significant accounting policies Details of the significant accounting policies and methods adopted, including the criteria for recognition, the basis of measurement and the basis on which income and expenses are recognised, in respect of each class of financial asset, financial liability and equity instrument are disclosed in note 3 to the consolidated financial statements Categories of financial instruments USD USD Financial assets Loans and receivables (including bank balances and cash) 37,825,044 20,825,214 Financial liabilities At amortised cost 60,100, ,034,052 The management considers that the carrying amounts of the financial assets and financial liabilities recorded in the consolidated financial statements approximate their fair values. 89
90 MILLENNIUM OFFSHORE SERVICES SUPERHOLDINGS L.L.C. AND SUBSIDIARIES Notes to the consolidated financial statements For the year ended 31 December 2012 (continued) 21. Financial instruments (continued) 21.3 Financial risk management objectives The management of the Group monitors and manages the financial risks relating to the operations of the Group through internal risk reports which analyse exposures by degree and magnitude of risks. These risks include market risk (including currency risk, fair value interest rate risk and price risk), credit risk and liquidity risk Market risk The Group s activities expose it primarily to the financial risks of changes in foreign currency exchange rates and interest rates. Market risk exposures are measured using sensitivity analysis Foreign currency rate management The Group undertakes certain transactions denominated in foreign currencies. Hence, exposure to exchange rate fluctuations arise. The carrying amounts of the Group s foreign currency denominated monetary assets and monetary liabilities at the reporting date are as follows: Liabilities Assets USD USD USD USD UAE Dirhams 932,009 4,227, Euro - 13,256 5,941 - Egyptian Pound 350,523 1,117, Qatari Riyals 26,915 10, , ,736 Others 206, , Foreign currency sensitivity analysis The Group is mainly exposed to United Arab Emirates Dirhams (UAE), Egyptian Pound, Qatari Riyal and Euro. Based on the sensitivity analysis to a 10% increase or decrease in the USD against Egyptian Pound and Euro, the Group s profit for the year ended 31 December 2012 and equity as of 31 December 2012 would not be impacted significantly. There is no impact on UAE Dirhams and Qatari Riyals because of a dollar peg to these currencies. 10% is the sensitivity rate used when reporting foreign currency risk internally to key management personnel and represents management s assessment of the reasonably possible change in foreign exchange rates. The sensitivity analysis includes only outstanding foreign currency denominated monetary items and adjusts their translation at the period end for a 10% change in foreign currency rates. 90
91 MILLENNIUM OFFSHORE SERVICES SUPERHOLDINGS L.L.C. AND SUBSIDIARIES Notes to the consolidated financial statements For the year ended 31 December 2012 (continued) 21. Financial instruments (continued) 21.3 Financial risk management objectives (continued) Interest rate risk management The Group's exposure to interest rate risk relates to borrowings from banks. The interest rates on bank borrowings are linked to LIBOR plus applicable margin. If interest rate had been 100 basis points higher/lower and all the other variables held constant, the Group s profit for the year ended 31 December 2012 and equity as of that date would have been decreased/increased by USD 263,253 (2011: USD 437,812). The sensitivity analysis above has been determined based on the interest rate risk exposure on the Group s net assets and on its profits for the reporting period Credit risk management Credit risk refers to the risk that a counter party will default on its contractual obligations resulting in financial loss to the Group. The Group has adopted a policy of only dealing with creditworthy counterparties as a means of mitigating the risk of financial loss from defaults. The Group s exposure and the credit ratings of its counterparties are continuously monitored and the aggregate value of transactions concluded is spread amongst approved counterparties. Credit exposure is controlled by making binding legal agreements with the counter parties and is monitored by the Management. At the reporting date, the amounts receivable from 4 (2011: 4) customers representing 100% of the outstanding trade receivables are exposed to credit risk. The credit risk on liquid funds is limited because the counterparties are banks with high credit-ratings assigned by international credit-rating agencies. The carrying amount of financial assets recorded in the consolidated financial statements, which is net of impairment losses, represents the Group s maximum exposure to credit risk Liquidity risk management Ultimate responsibility for liquidity risk management rests with the Board of Directors, which has built an appropriate liquidity risk management framework for the management of the Group s short, medium and long-term funding and liquidity management requirements. The Group manages liquidity risk by maintaining adequate reserves, by continuously monitoring forecast and actual cash flows and matching the maturity profiles of financial assets and liabilities. The table below includes the maturity profile of the Group s financial instruments. The contractual maturities of the financial instruments have been determined on the basis of the remaining period at the end of reporting date to the contractual maturity date. The maturity profile is monitored by management to ensure adequate liquidity is maintained. The maturity profile of the financial assets and financial liabilities at the end of reporting date based on contractual repayment arrangements was as follows: 91
92 MILLENNIUM OFFSHORE SERVICES SUPERHOLDINGS L.L.C. AND SUBSIDIARIES Notes to the consolidated financial statements For the year ended 31 December 2012 (continued) 21. Financial instruments (continued) 21.5 Liquidity risk management (continued) 31 December 2012 Financial assets Within 1 year to 2 years to 1 year 2 years 5 years Total USD USD USD USD Bank balances and cash 19,479, ,479,095 Trade and other receivables 18,345, ,345,949 37,825, ,825,044 Financial liabilities Bank borrowings 26,325, ,325,326 Due to a related party 7,928, ,928,155 Trade and other payables 8,106, ,106,282 Other financial liabilities 17,429, ,429,500 Derivative financial instrument 311, ,728 60,100, ,100, December 2011 Financial assets Bank balances and cash 4,636, ,636,866 Due from a related party 133, ,633 Trade and other receivables 16,054, ,054,715 Financial liabilities 20,825, ,825,214 Bank borrowings 17,475,540 26,305,700-43,781,240 Due to a related party 3,498, ,498,446 Trade and other payables 40,096, ,096,310 Other financial liabilities 5,900,000 5,800,000 5,800,000 17,500,000 Derivative financial instrument - - 1,158,056 1,158,056 66,970,296 32,105,700 6,958, ,034,052 Derivative financial instrument falls under level 2 category and is valued based on market observable data. 22. Approval of the consolidated financial statements The consolidated financial statements were approved by the Board of Directors and authorised for issue on 6 March
93 INDEPENDENT APPRAISAL VALUE OF FLEET Annual independent third party valuation of our ASVs In January 2013, M3 Marine Expertise Pte Ltd independently valued our fleet of six ASVs at between $296 million and $323 million. The independent third-party fleet valuation process is comprehensive multi-phase analysis which takes into account a variety of factors including consideration of: (1) the development of a good understanding of the vessel specifications and general arrangement; (2) the review of historical vessel valuation records; (3) the vessel s current and future earnings potential; (4) market conditions; (5) the vessel s inherent value; (6) the vessel s replacement costs; (7) deriving a range of figures which best represent the vessel s value; and (8) preparing a vessel valuation certificate. The independent valuation of the market value of the rigs is on the basis of a prompt as is, where is sale in U.A.E., between a buyer and a willing seller. Valuation is based on assumption that the rigs are in good order and in a condition in hull and machinery which is to be expected of rigs of this type and age. 93
94 COMPANY DETAILS Millennium Offshore Services Superholdings, LLC Trust Company Complex Ajeltake Island Ajeltake Road, Majuro Marshall Islands, MH96960 INDEPENDENT AUDITORS Deloitte & Touche (M.E.) 701 Corniche Plaza 2 P.O. Box 5470 Sharjah, United Arab Emirates TRUSTEE Citibank, N.A., London Branch Citigroup Centre 25 Canada Square Canary Wharf London E14 5LB United Kingdom PRINCIPAL PAYING AGENT AND TRANSFER AGENT Citibank, N.A., London Branch Citigroup Centre 25 Canada Square Canary Wharf London E14 5LB United Kingdom REGISTRAR Citigroup Global Markets Deutschland AG 5th Floor, Reuterweg Frankfurt Germany INVESTOR RELATIONS Grayling 405 Lexington Avenue, 7 th Floor New York, NY United States 94


95
s 2013 Annual Report
 2013 s Annual Report Millennium Offshore Services Superholdings, LLC Trust Company Complex Ajeltake Island Ajeltake Road, Majuro Marshall Islands, MH96960 COMPANY OFFICES Millennium Offshore Services -
Millennium Offshore Services. Second Quarter 2013 Results Conference Call August 29, 2013
 Millennium Offshore Services Superholdings, LLC Second Quarter 2013 Results Conference Call August 29, 2013 1 Disclaimer & Safe Harbor Statement This presentation may contain forward looking statements
Millennium Offshore Services Superholdings, LLC. First Quarter 2014 Results Conference Call May 21, 2014
 Millennium Offshore Services Superholdings, LLC First Quarter 2014 Results Conference Call May 21, 2014 1 Disclaimer & Safe Harbor Statement This presentation may contain forward looking statements within
2014 Third Quarter 1
 2014 Third Quarter 1 COMPANY OFFICES MILLENNIUM OFFSHORE SERVICES SUPERHOLDINGS, LLC Trust Company Complex Ajeltake Island Ajeltake Road, Majuro Marshall Islands, MH96960 MILLENNIUM OFFSHORE SERVICES MAIN
COMPANY OFFICES ASIA PACIFIC REGION OFFICES REGISTERED OFFICE MIDDLE EAST & NORTH AFRICA (MENA) REGION OFFICES NORTH SEA / EUROPE REGION OFFICES
 REGION OFFICES NORTH SEA / EUROPE REGION OFFICES") Millennium Offshore Services Superholdings LLC (part of the Seafox Group) SECOND QUARTER 2015 COMPANY OFFICES REGISTERED OFFICE MILLENNIUM OFFSHORE SERVICES SUPERHOLDINGS, LLC Trust Company Complex Ajeltake
Millennium Offshore Services Superholdings LLC (part of the Seafox Group) SECOND QUARTER 2015 COMPANY OFFICES REGISTERED OFFICE MILLENNIUM OFFSHORE SERVICES SUPERHOLDINGS, LLC Trust Company Complex Ajeltake
COMPANY OFFICES ASIA PACIFIC REGION OFFICES REGISTERED OFFICE MIDDLE EAST & NORTH AFRICA (MENA) REGION OFFICES NORTH SEA / EUROPE REGION OFFICES
 REGION OFFICES NORTH SEA / EUROPE REGION OFFICES") Millennium Offshore Services Superholdings LLC, part of the Seafox Group First Quarter 2015 COMPANY OFFICES REGISTERED OFFICE MILLENNIUM OFFSHORE SERVICES SUPERHOLDINGS, LLC Trust Company Complex Ajeltake
Millennium Offshore Services Superholdings LLC, part of the Seafox Group First Quarter 2015 COMPANY OFFICES REGISTERED OFFICE MILLENNIUM OFFSHORE SERVICES SUPERHOLDINGS, LLC Trust Company Complex Ajeltake
MILLENNIUM OFFSHORE SERVICES SUPERHOLDINGS LLC, PART OF THE SEAFOX GROUP, REPORTS FIRST QUARTER 2015 FINANCIAL RESULTS
 FOR IMMEDIATE RELEASE MILLENNIUM OFFSHORE SERVICES SUPERHOLDINGS LLC, PART OF THE SEAFOX GROUP, REPORTS FIRST QUARTER 2015 FINANCIAL RESULTS Revenue increased 2.2% to $39.4 million, EBITDA decreased 21.7%
MILLENNIUM OFFSHORE SERVICES SUPERHOLDINGS, LLC, PART OF THE SEAFOX GROUP, REPORTS SECOND QUARTER 2015 FINANCIAL RESULTS
 FOR IMMEDIATE RELEASE MILLENNIUM OFFSHORE SERVICES SUPERHOLDINGS, LLC, PART OF THE SEAFOX GROUP, REPORTS SECOND QUARTER 2015 FINANCIAL RESULTS Second Quarter 2015 Revenues increased 23.6% to $47.5 million,
LAMPRELL Analyst Presentation Site Visit, 22 November 2006
 LAMPRELL Analyst Presentation Site Visit, 22 November 2006 I. OVERVIEW OF LAMPRELL 2 Overview of Lamprell A leading jackup rig refurbisher in the Arabian Gulf with a significant share of the market in
ENSCO PLC FORM 10-Q. (Quarterly Report) Filed 04/26/04 for the Period Ending 03/31/04
 Filed 04/26/04 for the Period Ending 03/31/04") ENSCO PLC FORM 10-Q (Quarterly Report) Filed 04/26/04 for the Period Ending 03/31/04 Telephone 4402076594660 CIK 0000314808 Symbol ESV SIC Code 1381 - Drilling Oil and Gas Wells Industry Oil Well Services
ENSCO PLC FORM 10-Q (Quarterly Report) Filed 04/26/04 for the Period Ending 03/31/04 Telephone 4402076594660 CIK 0000314808 Symbol ESV SIC Code 1381 - Drilling Oil and Gas Wells Industry Oil Well Services
Topaz Energy and Marine
 Topaz Energy and Marine Financial results for the six months ended 30 Half Year Revenue of US $116 million; Robust EBITDA margin of 50% Dubai, UAE, Thursday 17 th August : Topaz Energy and Marine ( Topaz
Financial Results For the Period Ending 30 June 2017
 Financial Results For the Period Ending 30 June 2017 Investor Call, 17 August 2017 DISCLAIMER Any information in this presentation that is not a historical fact is a forward-looking statement. Such statements
Topaz Energy and Marine
 Topaz Energy and Marine Financial results for the year ended 31 Twelve months revenue of US$244m; stable EBITDA margin of 48 Dubai, UAE, Monday 26 th March 2018: Topaz Energy and Marine ( Topaz ), a leading
Strengthening the Offshore Driller of Choice May 30, 2017
 Strengthening the Offshore Driller of Choice May 30, 2017 1 Forward-Looking Statements Statements included in this presentation regarding the proposed transaction, benefits, expected synergies and other
Vantage Drilling Company
 Vantage Drilling Company 2012 Global Energy Conference Houston, Texas November 29, 2012 Forward-Looking Statements Some of the statements in this presentation constitute forward-looking statements. Forward-looking
Investor Presentation March 2018
 Investor Presentation March 2018 INTRODUCTION TO ADES ADES at a Glance Who We Are Leading MENAbased O&G Service Provider A leading oil & gas drilling and production services provider in the Middle East
Deutsche Bank - dbaccess CEEMEA Conference London 22 January 2015
 Deutsche Bank - dbaccess CEEMEA Conference London 22 January 2015 Gulf Marine Services 22 January 2015 www.gmsuae.com Disclaimer This presentation has been prepared by Gulf Marine Services PLC (the "Company")
Vantage Drilling Company
 Vantage Drilling Company Company Update December 6, 2012 Forward-Looking Statements Some of the statements in this presentation constitute forward-looking statements. Forward-looking statements relate
1Q2012 Results Briefing Analyst & Investor Update 22 February 2012
 1Q2012 Results Briefing Analyst & Investor Update 22 February 2012 Disclaimer This Investor Presentation has been prepared by Mermaid Maritime Plc for investors, solely for information purposes. The views
Half Year Results 2018
 Half Year Results 2018 20 September 2018 www.lamprell.com 1 East Anglia One Disclaimer This presentation contains certain forward-looking statements relating to the business, financial performance and
Investor Presentation. March 2015
 Investor Presentation March 2015 1 Forward-Looking Statements Statements contained in this presentation that are not historical facts are forward-looking statements within the meaning of Section 27A of
Interim Results for six months ended 30 June 2014
 Interim Results for six months ended 30 June 2014 Gulf Marine Services 28 August 2014 www.gmsuae.com Disclaimer This presentation has been prepared by Gulf Marine Services PLC (the "Company") and comprises
Investor Presentation. April 2015
 Investor Presentation April 2015 1 Forward-Looking Statements Statements contained in this presentation that are not historical facts are forward-looking statements within the meaning of Section 27A of
McDermott International, Inc. (Exact name of registrant as specified in its charter)
") UNITED STATES SECURITIES AND EXCHANGE COMMISSION Washington, D.C. 20549 FORM 8-K CURRENT REPORT PURSUANT TO SECTION 13 OR 15(d) OF THE SECURITIES EXCHANGE ACT OF 1934 Date of Report (Date of earliest event
UNITED STATES SECURITIES AND EXCHANGE COMMISSION Washington, D.C. 20549 FORM 8-K CURRENT REPORT PURSUANT TO SECTION 13 OR 15(d) OF THE SECURITIES EXCHANGE ACT OF 1934 Date of Report (Date of earliest event
Fleet Status Report. ENSCO 8505 and ENSCO 8503 Contracted into 3Q April 2018 ENSCO 8505
 ENSCO 8505 ENSCO 8505 and ENSCO 8503 ed into 3Q18 Recently, ENSCO 8505 was awarded two contracts for a total of three wells and ENSCO 8503 was contracted for two wells. Both rigs are capable of operating
Topaz Energy and Marine
 Topaz Energy and Marine Financial Results for the Nine months ended 30 tember Dubai, UAE, : Topaz Energy and Marine, a leading offshore support vessel company, today announces its results for the nine
NOT FOR DISTRIBUTION IN THE US, CANADA OR JAPAN FOR IMMEDIATE RELEASE 3 FEBRUARY 1998
 NOT FOR DISTRIBUTION IN THE US, CANADA OR JAPAN FOR IMMEDIATE RELEASE 3 FEBRUARY 1998 SAIPEM ANNOUNCES 1997 RESULTS Today, the Board of Directors of Saipem S.p.A., the leading Italian oilfield services
ADES International Holding announces intention to float on the London Stock Exchange
 THIS ANNOUNCEMENT IS NOT BEING MADE IN, IS NOT DIRECTED AT AND MAY NOT BE DISTRIBUTED OR SENT INTO OR OTHERWISE MADE ACCESSIBLE BY PERSONS LOCATED IN THE UNITED STATES OF AMERICA, AUSTRALIA, CANADA, JAPAN
Acquisition of Horizon Offshore. June 12, 2007
 Acquisition of Horizon Offshore June 12, 2007 Forward-Looking Statements Certain statements made herein contain forward-looking statements within the meaning of Section 27A of the Securities Act of 1933,
Howard Weil Conference Presentation. March 2015
 Howard Weil Conference Presentation March 2015 1 Forward-Looking Statements Statements contained in this presentation that are not historical facts are forward-looking statements within the meaning of
Fleet Status Report 16 July 2010
 Ensco high-grades its jackup fleet with addition of ENSCO 109, a KFELS Super B Class design. Two million pound hoisting capacity, 15,000 psi high-pressure BOP and nearly 5,000 bbls of liquid mud capacity
Corporate Presentation. December 2016
 Corporate Presentation December 2016 1 Disclaimer This presentation may contain forward looking statements which are subject to risks and uncertainties that could cause actual results, performance or achievements
Investor Presentation December 2015
 Investor Presentation December 2015 1 Forward-Looking Statements Statements herein that are not historical facts are forward looking statements within the meaning of the Private Securities Litigation Reform
Topaz Energy and Marine
 Topaz Energy and Marine Financial results for the quarter ended 31 st March 2018 Q1 2018 Revenues Increase 14% to $66 million Dubai, UAE, Wednesday 30 th May 2018: Topaz Energy and Marine ( Topaz ), a
Savanna Energy Services Corp. Announces Second Quarter 2014 Results and New Triple Drilling Rig Contract
 PRESS RELEASE FOR IMMEDIATE RELEASE Savanna Energy Services Corp. Announces Second Quarter 2014 Results and New Triple Drilling Rig Contract Calgary, Alberta August 5, 2014 TSX SVY Second Quarter Results
Gulf Marine Services PLC
 Gulf Marine Services PLC Preliminary Results for the year ended 31 December 2016 Gulf Marine Services (LSE: GMS), the leading provider of advanced self-propelled selfelevating support vessels (SESVs) serving
Pareto Securities 23rd Annual Oil & Offshore Conference
 Pareto Securities 23rd Annual Oil & Offshore Conference September 14-15, 2016 Oslo, Norway www.paragonoffshore.com Safe Harbor Statement This material contains statements that are forward looking statements
Saipem: Board of Directors approves six-month report at June 30, 2011 H1 PROFITS AT RECORD LEVELS
 Saipem: Board of Directors approves six-month report at June 30, H1 PROFITS AT RECORD LEVELS Net profit for the second quarter of amounted to Euro 225 million, a 13.6% increase compared to the second quarter
Half Year Results 2017
 Half Year Results 2017 22 September 2017 www.lamprell.com 1 NDC 9 Rig Al Lulu Disclaimer This presentation contains certain forward-looking statements relating to the business, financial performance and
Financial Report For the Period Ended March 31, 2018
 Financial Report For the Period Ended March 31, 2018 This report comments on the operating and financial performance of Shelf Drilling, Ltd (the Company ) and on the summary table of results set out on
ADES International Holding Ltd Results for the six-month period ending 30 June 2017
 For the purpose of the Transparency Directive the Home Member state of the issuer is the United Kingdom. ADES International Holding Ltd 1H2017 Results Update London, 12 September 2017 ADES International
PRESS RELEASE SHELF DRILLING REPORTS FOURTH QUARTER 2018 RESULTS
 PRESS RELEASE SHELF DRILLING REPORTS FOURTH QUARTER 2018 RESULTS Dubai, UAE, March 4, 2019 Shelf Drilling, Ltd. ( Shelf Drilling and, together with its subsidiaries, the Company, OSE: SHLF) announces results
PACC Offshore Services Holdings Ltd. Results Presentation Q2 & 1H FY15 Results
 PACC Offshore Services Holdings Ltd. Results Presentation Q2 & 1H FY15 Results 1 Agenda 1. Financial Highlights 2. Capex plan & fleet program 3. Updates 4. Q & A 2 Key Highlights Push into Offshore Accommodation
BOURBON Full Year 2013: Net Income Group share up 174% to 115 million Increased operating margin
 BOURBON Full Year 2013: Net Income Group share up 174% to 115 million Increased operating margin 1 and capital gains generated 575.7 million EBITDA, up 41.7% compared to Paris, March 5, 2014 EBITDAR 2
Ezion Holdings Limited. Informal Meeting with Shareholders 23 March 2018
 Ezion Holdings Limited Informal Meeting with Shareholders 23 March 2018 1 Disclaimer This informal meeting is being convened for the purpose of providing the Shareholders with a summary of the Proposed
Financial Report For the Period Ended September 30, 2017
 Financial Report For the Period Ended September 30, 2017 This report comments on the operating and financial performance of Shelf Drilling, Ltd (the Company ) and on the summary table of results set out
ATLANTIC OILFIELD SERVICES
 ATLANTIC LTD Report for the 4 th quarter 2006 Company Background Atlantic Oilfield Services Ltd ( AOS ) is an integrated oil service company owning and operating onshore and offshore drilling units as
2Q 2018 RESULT PRESENTATION
 2Q 2018 RESULT PRESENTATION 15 August 2018 www.mermaid-group.com Disclaimer: The information contained in this document is intended only for use during the presentation and should not be disseminated or
Financial Results for the Period Ended 31 December Investor Call, 25 March 2019
 Financial Results for the Period Ended 31 December 2018 Investor Call, 25 March 2019 FY 2018 RESULTS HIGHLIGHTS Strong operating performance across all regions and multiple significant contract awards
BUMI ARMADA BERHAD. 3Q 2011 Results 21 st November Knots Ahead of the Rest
 BUMI ARMADA BERHAD 3Q 2011 Results 21 st November 2011 Knots Ahead of the Rest Disclaimer This document may contain statements of future expectations and other forward-looking statements based on management
Savanna Energy Services Corp. Announces Second Quarter 2016 Results
 PRESS RELEASE FOR IMMEDIATE RELEASE Savanna Energy Services Corp. Announces Second Quarter 2016 Results Calgary, Alberta August 3, 2016 TSX SVY Second Quarter Results Savanna generated revenue of $54.9
PACC Offshore Services Holdings Ltd. Results Presentation Q3 & 9M FY15 Results
 PACC Offshore Services Holdings Ltd. Results Presentation Q3 & 9M FY15 Results 1 Agenda 1. Financial Highlights 2. CAPEX plan & fleet optimisation programme 3. Updates 4. Q & A 2 Key Highlights Focus on
Gulf Marine Services PLC ( Gulf Marine Services, GMS, the Company or the Group )
") Gulf Marine Services PLC ( Gulf Marine Services, GMS, the Company or the Group ) Preliminary Results for the year ended 31 December 2017 Gulf Marine Services (LSE: GMS), the leading provider of advanced
Gulf Marine Services PLC ( Gulf Marine Services, GMS, the Company or the Group ) Preliminary Results for the year ended 31 December 2017 Gulf Marine Services (LSE: GMS), the leading provider of advanced
Proposed Joint Venture 31 May 2017
 Proposed Joint Venture 31 May 2017 Important Notice This document comprises the written materials/slides for a presentation concerning the proposed entry by Lamprell plc (the "Company") into a joint venture
Financial Results for the Period Ended 30 September Investor Call, 30 October 2018
 Financial Results for the Period Ended 30 September 2018 Investor Call, 30 October 2018 Q3 2018 RESULTS HIGHLIGHTS Growth across the business Strong cash flow generation and increased profitability Q3
SEACOR MARINE ANNOUNCES RESULTS FOR ITS FOURTH QUARTER AND YEAR ENDED DECEMBER 31, 2017
 PRESS RELEASE SEACOR MARINE ANNOUNCES RESULTS FOR ITS FOURTH QUARTER AND YEAR ENDED DECEMBER 31, Houma, Louisiana March 22, 2018 FOR IMMEDIATE RELEASE - SEACOR Marine Holdings Inc. (NYSE:SMHI) (the Company
Ocean Rig UDW Inc. NASDAQ: ORIG August 9, nd Quarter Ended June 30, 2018 Earnings Presentation
 Ocean Rig UDW Inc. NASDAQ: ORIG August 9, 2018 2 nd Quarter Ended June 30, 2018 Earnings Presentation Forward Looking Statements Matters discussed in this presentation may constitute forward-looking statements
OCEAN RIG UDW INC. REPORTS FINANCIAL AND OPERATING RESULTS FOR THE THIRD QUARTER 2012
 OCEAN RIG UDW INC. REPORTS FINANCIAL AND OPERATING RESULTS FOR THE THIRD QUARTER 2012 November 14, 2012, Nicosia, Cyprus. Ocean Rig UDW Inc. (NASDAQ: ORIG), or the Company, an international contractor
Ocean Rig UDW Inc. NASDAQ: ORIG December 08, rd Quarter Ended September 30, 2015 Earnings Presentation
 Ocean Rig UDW Inc. NASDAQ: ORIG December 08, 2015 3 rd Quarter Ended September 30, 2015 Earnings Presentation Forward Looking Statements Matters discussed in this presentation may constitute forward-looking
Saipem: Board of Directors approves Interim Report as at March 31, 2011 IMPROVED RESULTS VERSUS Q1 2010
 Interim Report at March 31, 2011 Saipem: Board of Directors approves Interim Report as at March 31, 2011 IMPROVED RESULTS VERSUS Revenues amounted to Euro 2,954 million: +11.9% compared to the first quarter.
ADES International Holding announces indicative price range for offering of ordinary shares on the London Stock Exchange
 THIS ANNOUNCEMENT IS NOT BEING MADE IN, IS NOT DIRECTED AT AND MAY NOT BE DISTRIBUTED OR SENT INTO OR OTHERWISE MADE ACCESSIBLE BY PERSONS LOCATED IN THE UNITED STATES OF AMERICA, AUSTRALIA, CANADA, JAPAN
FOR IMMEDIATE RELEASE 20 FEBRUARY 2018 PACC OFFSHORE SERVICES HOLDINGS LTD. MEDIA RELEASE
 PACC OFFSHORE SERVICES HOLDINGS LTD. MEDIA RELEASE FY: REVENUE GROWTH DESPITE FURTHER IMPAIRMENTS TO GOODWILL AND FIXED ASSETS Q4 FY revenue up 71 on strong growth in Offshore Accommodation and Offshore
Investor Presentation
 Investor Presentation November, 2016 *Rig 580, Oklahoma SCOOP 1 Forward-looking statements Certain statements contained in this presentation, including statements that contain words such as "could", "should",
MARCO POLO MARINE LTD Incorporated in the Republic of Singapore (Company Registration Number: Z)
") MARCO POLO MARINE LTD Incorporated in the Republic of Singapore (Company Registration Number: 200610073Z) ENTRY INTO A RIG CONSTRUCTION CONTRACT WITH PPL SHIPYARD PTE LTD FOR THE CONSTRUCTION OF A HIGH-SPECIFICATION
MARCO POLO MARINE LTD Incorporated in the Republic of Singapore (Company Registration Number: 200610073Z) ENTRY INTO A RIG CONSTRUCTION CONTRACT WITH PPL SHIPYARD PTE LTD FOR THE CONSTRUCTION OF A HIGH-SPECIFICATION
Investor Presentation August PKD (NYSE) Rig 273 Alaska
 Rig 273 Alaska") Investor Presentation August 207 PKD (NYSE) Rig 273 Alaska Forward-Looking Statements Caution The following presentation contains certain statements that may be deemed to be forwardlooking statements within
Investor Presentation August 207 PKD (NYSE) Rig 273 Alaska Forward-Looking Statements Caution The following presentation contains certain statements that may be deemed to be forwardlooking statements within
Fleet Status Report. 18 August Ensco Signs Multi-Year Jackup Contract in Malaysia
 Ensco Signs Multi-Year Jackup Contract in Malaysia ENSCO 52 was contracted with Murphy in Malaysia for a three-year term. ENSCO 52 has an excellent safety performance record, recently surpassing three
KNOT OFFSHORE PARTNERS LP EARNINGS RELEASE INTERIM RESULTS FOR THE PERIOD ENDED MARCH 31, 2017
 Highlights KNOT OFFSHORE PARTNERS LP EARNINGS RELEASE INTERIM RESULTS FOR THE PERIOD ENDED MARCH 31, 2017 For the three months ended March 31, 2017, KNOT Offshore Partners LP ( KNOT Offshore Partners or
McDermott International + CB&I
 McDermott International + CB&I Creating a premier global fully vertically integrated onshore-offshore company with a broad EPCI offering, driven by technology and innovation with the scale and diversification
Acquisition of Ferguson Group. 9 September 2014
 Acquisition of Ferguson Group 9 September 2014 Strategic highlights Continuing our expansion in specialist containers Ferguson Group is a leading provider of container solutions (mostly cargocarrying units)
MERMAID MARITIME PUBLIC COMPANY LIMITED (Registered in the Kingdom of Thailand) (Company Registration No )
 (Company Registration No )") Financial Statements and Dividend Announcement for the Period Ended 31 March 2017 PART I INFORMATION REQUIRED FOR QUARTERLY (Q1, Q2, & Q3), HALF-YEAR AND FULL YEAR ANNOUNCEMENTS 1(a) An income statement
Financial Statements and Dividend Announcement for the Period Ended 31 March 2017 PART I INFORMATION REQUIRED FOR QUARTERLY (Q1, Q2, & Q3), HALF-YEAR AND FULL YEAR ANNOUNCEMENTS 1(a) An income statement
Fleet Status Report. 17 June ENSCO DS-10 Drillship Order Driven by Deepwater Market Strength
 ENSCO DS-10 Drillship Order Driven by Deepwater Market Strength Ensco ordered an additional advanced-capability DP3 ultradeepwater drillship. The vessel, ENSCO DS-10, will be the eighth DP3 drillship in
Lamprell plc. Interim results presentation - H1 2012
 Interim results presentation - H1 2012 1 Interim results presentation - H1 2012 Agenda Financial summary Operational summary Operational highlights Operational and growth initiatives Markets and business
Maersk Drilling Q November 2015
 Maersk Drilling Q3 2015 9 November 2015 page 2 Legal notice This presentation contains certain forward looking statements (all statements that are not entirely based on historical facts, among others expectations
Swiber and Saudi Arabia s Rawabi in JV to target offshore projects in the GCC
 A world class service provider in the offshore industry Swiber Holdings Limited Co Reg No. 200414721N 12 International Business Park, CyberHub@IBP #04-01 Singapore 609920 Tel: +65 6505 0800 Fax: +65 6505
Brookfield Business Partners
 Brookfield Business Partners C O R P O R AT E P R O F I L E NOVEMBER 2017 Brookfield Business Partners ( BBU ) We are a business services and industrials company focused on long-term capital appreciation
PACC Offshore Services Holdings Ltd. Corporate Overview SGX-Goldman Marine Oil & Gas Corporate Day 3 March 2017
 PACC Offshore Services Holdings Ltd. Corporate Overview SGX-Goldman Marine Oil & Gas Corporate Day 3 March 2017 Overview 1. About POSH 2. Our Competitive Strengths 3. Our Fleet 4. Q4 and FY 2016 Financial
The people you can trust when you really need them
 The people you can trust when you really need them WHO WE ARE Whitelaw Loss Adjusters (WLA) is an established and reputed professional loss adjusting practice based in the Middle East. Independently owned
KNOT Offshore Partners LP (Translation of registrant s name into English)
") UNITED STATES SECURITIES AND EXCHANGE COMMISSION Washington, D.C. 20549 Form 6-K REPORT OF FOREIGN PRIVATE ISSUER PURSUANT TO RULE 13a-16 OR 15d-16 UNDER THE SECURITIES EXCHANGE ACT OF 1934 For the month
UNITED STATES SECURITIES AND EXCHANGE COMMISSION Washington, D.C. 20549 Form 6-K REPORT OF FOREIGN PRIVATE ISSUER PURSUANT TO RULE 13a-16 OR 15d-16 UNDER THE SECURITIES EXCHANGE ACT OF 1934 For the month
Shelf Drilling Q Results Highlights. March 2019
 March 2019 Disclaimer This presentation (the "Presentation") has been prepared by Shelf Drilling, Ltd. ("Shelf Drilling" or the "Company") exclusively for information purposes and may not be reproduced
First Quarter Results PRESS RELEASE FOR IMMEDIATE RELEASE. Calgary, Alberta May 5, 2014 TSX SVY
 Calgary, Alberta May 5, 2014 TSX SVY PRESS RELEASE FOR IMMEDIATE RELEASE Savanna Energy Services Corp. Announces First Quarter 2014 Results, New Triple Drilling Rig Contract, and Renewal and Expansion
Miclyn Express Offshore
 Miclyn Express Offshore FY13 Results Presentation 26 August, 2013 Live Webcast Details Presenter: Diederik de Boer, CEO Date: 26 August, 2013 Time: 11:00am AEST Access: http://www.brrmedia.com/event/114725
MANAGEMENT S DISCUSSION AND ANALYSIS THIRD QUARTER 2017
 MANAGEMENT S DISCUSSION AND ANALYSIS THIRD QUARTER 2017 Overview... 2 Third Quarter Highlights... 3 Outlook... 3 Continuing Operations Comparative Quarterly Income Statements,... 5 Third Quarter Discontinued
Pareto Securities Oil & Offshore Conference
 Pareto Securities Oil & Offshore Conference September 2-3, 2015 Oslo, Norway www.paragonoffshore.com Safe Harbor Statement This material contains statements that are forward looking statements about Paragon
Q 1. To the Shareowners
 DRILLING LTD. Q 1 Interim report for 3 months ended, 2011 To the Shareowners Commencing with this quarterly report, all financial information is reported in accordance with IFRS including for comparative
HNZ GROUP REPORTS 2016 YEAR-END RESULTS
 From: HNZ Group Inc. Matthew Wright Vice-President and Chief Financial Officer Tel: 780-429-6903 HNZ GROUP REPORTS 2016 YEAR-END RESULTS PRESS RELEASE FOR IMMEDIATE RELEASE Revenue of $212.3 million, versus
Part II. Item 5 Market for Registrant s Common Equity, Related Shareholder Matters and Issuer Repurchases of Equity Securities
 Part II ~ N a b o r s I n d u s t r i e s L t d. a n d S u b s i d i a r i e s ~ Item 5 Market for Registrant s Common Equity, Related Shareholder Matters and Issuer Repurchases of Equity Securities I.
Case Doc 20 Filed 06/12/17 Entered 06/12/17 18:10:32 Desc Main Document Page 1 of 9
 Document Page 1 of 9 UNITED STATES BANKRUPTCY COURT DISTRICT OF MASSACHUSETTS (Eastern Division) In re CASHMAN EQUIPMENT CORP., 1 Debtor Chapter 11 Case No. 17-12205 MOTION BY DEBTORS FOR ENTRY OF ORDER
Arc Logistics Partners LP Investor Presentation March 2015
 Arc Logistics Partners LP Investor Presentation March 2015 Vince Cubbage - CEO, Chairman and Director Bradley Oswald - Senior Vice President, CFO and Treasurer Cautionary Note Forward Looking Statements
LAMPRELL PLC. ( Lamprell or the Company ) 2010 PRELIMINARY RESULTS
 2010 PRELIMINARY RESULTS") 28 March 2011 LAMPRELL PLC ( Lamprell or the Company ) 2010 PRELIMINARY RESULTS Lamprell (ticker: LAM), a leading provider of specialist engineering services to the international oil & gas and renewable
28 March 2011 LAMPRELL PLC ( Lamprell or the Company ) 2010 PRELIMINARY RESULTS Lamprell (ticker: LAM), a leading provider of specialist engineering services to the international oil & gas and renewable
Investor Presentation June 24, 2016
 Investor Presentation June 24, 2016 1 Forward-Looking Statements Statements herein that are not historical facts are forward looking statements within the meaning of the Private Securities Litigation Reform
Ensco plc 6 Chesterfield Gardens London W1J 5BQ Ensco plc Reports First Quarter 2011 Results
 Ensco plc 6 Chesterfield Gardens London W1J 5BQ www.enscoplc.com Press Release Ensco plc Reports First Quarter 2011 Results Pride Acquisition Announced Ensco Ranked #1 in Total Customer Satisfaction ENSCO
KCA Deutag Alpha Limited ( KCA Deutag or the Group ) Results for the three months ended 30 June 2015
 Results for the three months ended 30 June 2015") For immediate release 20 August 2015 KCA Deutag Alpha Limited ( KCA Deutag or the Group ) Results for the three months ended 30 June 2015 KCA Deutag, one of the world s leading drilling and engineering
For immediate release 20 August 2015 KCA Deutag Alpha Limited ( KCA Deutag or the Group ) Results for the three months ended 30 June 2015 KCA Deutag, one of the world s leading drilling and engineering
LA Energy Conference. New Orleans, LA - June 11, Todd M. Hornbeck Chairman, President & CEO
 LA Energy Conference New Orleans, LA - June 11, 2014 Todd M. Hornbeck Chairman, President & CEO Forward-Looking Statements This Presentation contains forward-looking statements, as contemplated by the
MANAGEMENT S DISCUSSION AND ANALYSIS
 MANAGEMENT S DISCUSSION AND ANALYSIS For the three months ended March 31, 2016 Section 1: Description of the Business... 3 Section 2: Key Performance Indicators... 4 Section 3: Overall Performance... 4
TRANSFORMING THE COMPANY AT THE BOTTOM OF THE CYCLE. Oslo, 8 th of March 2018
 TRANSFORMING THE COMPANY AT THE BOTTOM OF THE CYCLE Oslo, 8 th of March 2018 DISCLAIMER This presentation is being made only to, and is only directed at, persons to whom such presentation may lawfully
FOLD LINES FOLD LINES
 Focused 2016 THIRD QUARTER REPORT For the three and nine months ended September 30, 2016 TABLE OF CONTENTS 01 Management s Discussion & Analysis 02 Financial Highlights 03 Operating Highlights 07 Industry
Third Quarter November 2, 2011
 Earnings Presentation Third Quarter 2011 November 2, 2011 12:00 200noon UK time Forward-looking statements Certain statements made in this announcement may include forward-looking statements within the
TRINIDAD DRILLING 2011 SECOND QUARTER REPORT
 TRINIDAD DRILLING 2011 SECOND QUARTER REPORT FOR THE THREE AND SIX MONTHS ENDING JUNE 30, 2011 TRINIDAD SECOND QUARTER REPORT 2011 + 1 TRINIDAD DRILLING LTD. REPORTS SOLID SECOND QUARTER AND YEAR TO DATE
Frequently Asked Questions
 th Frequently Asked Questions DEVELOPMENT & TECHNICAL Q: What is the estimated recoverable petroleum for the first platform and for the whole of Cambodia Block A? A: See section Resources & Development
Investor Presentation September 2015
 Investor Presentation September 2015 1 Forward-Looking Statements Statements herein that are not historical facts are forward looking statements within the meaning of the Private Securities Litigation